Article

Study on the Dynamic Change of Land Use in Megacities and Its Impact on Ecosystem Services and Modeling Prediction

1
School of Architecture and Planning, Anhui Jianzhu University, Hefei 230601, China
2
School of Environment and Energy Engineering, Anhui Jianzhu University, Hefei 230601, China
3
Anhui Provincial Key Laboratory of Environmental Pollution Control and Resource Reuse, Hefei 230601, China
4
Anhui Institute of Ecological Civilization, Hefei 230601, China
5
Anhui Institute of Land Spatial Planning and Ecology, Hefei 230601, China
*
Author to whom correspondence should be addressed.
Sustainability 2024, 16(13), 5364; https://doi.org/10.3390/su16135364
Submission received: 21 April 2024 / Revised: 19 June 2024 / Accepted: 20 June 2024 / Published: 24 June 2024
(This article belongs to the Section Resources and Sustainable Utilization)

Abstract

:
Under the background of rapid urbanization, strengthening the research on the response and dynamic mechanism of ecosystem services to land use is conducive to the optimization of land space and ecological restoration and governance in megacities. Using Hefei City as a case study, we examined specific ecosystem services and analyzed how water yield, habitat quality, carbon storage, and soil conservation changed over time from 2000 to 2020. We utilized spatial information technology and the InVEST model to assess these changes. Additionally, we developed a comprehensive ecological service index (CES) and used Geodetector and regression models to investigate how ecosystem services responded to land use. In addition, we utilized the Patch-generating Land Use Simulation Model (PLUS) to simulate the spatial distribution of land use in 2030. This was performed under four different scenarios: natural development (ND), urban development (UD), cultivated land protection (CP), and ecological protection (EP). Furthermore, we assessed the effects of these land-use changes on ecosystem service functions by integrating the PLUS results with InVEST. The findings indicate the following: (1) between 2000 and 2020, farmland consistently remained the dominant land-use type in Hefei City while construction land experienced significant growth. Land-use conversion was prevalent during this period, and each ecological indicator exhibited noticeable geographic variation; (2) during the past 20 years, the comprehensive ecosystem service index (CES) exhibited clear spatial clustering patterns. The different types of land use showed significant quantitative relationships with CES. Specifically, cultivated land, forest land, grassland, and water area had positive correlations, while construction land had a negative correlation. Geodetector analysis revealed that the proportion of ecological land use had the greatest impact on the spatial differentiation of CES, followed by population density; (3) according to the PLUS simulation, the UD scenario results in a significant conversion of cultivated land and grassland into construction land, leading to the greatest decrease in CES. In the ND scenario, the areas with decreasing CES are mostly areas that have been converted from other land types to construction land. In contrast, the EP scenario shows an increase in forest land and grassland, which promotes the enhancement of multiple ecosystem service functions simultaneously. This indicates that the EP scenario is the most favorable for sustainable land-use development. The study investigates the impact of land-use changes on ecosystem services and evaluates the sustainability of regional land use. The findings have both theoretical and practical significance for effectively managing land use and regulating ecological functions in large cities.

1. Introduction and Literature Review

1.1. Introduction

Ecosystem services play a crucial role in connecting human activity with the natural environment. China has seen rapid urbanization over the last forty years, resulting in the expansion of urban construction and substantial socio-economic progress. Conversely, ecological and environmental concerns are more prominent. Some examples of these issues are the decrease in biodiversity, decrease in carbon storage, and poor water quality. All of these problems are a threat to urban sustainability and the health of urban populations [1]. Hefei City, situated in the Yangtze River Economic Belt, is a strategically positioned dual-node city that serves as a complete national science hub. It has experienced significant social and economic growth since the beginning of the twenty-first century. Urbanization has experienced substantial improvement, resulting in notable alterations in the city’s land-use patterns and structures. However, this progress has come at the cost of a severe degradation of the ecosystem service function. Statistics indicate that the unrestrained growth of construction land between 1990 and 2000 in Hefei City led to a considerable deterioration in the operation of several critical ecosystem services [2]. Unlike other provincial capitals along the Yangtze River Economic Belt, Hefei has witnessed a more significant decline in ecosystem service activities. The Political Bureau of the Central Committee of the Communist Party of China (CPC) considered and approved the Outline of the Development Plan for the Yangtze River Economic Belt in March 2016. The plan explicitly and strongly emphasized the need to safeguard the ecological environment of the Yangtze River, strive to establish a new comprehensive openness model, and reinvent the institutional mechanism for the coordinated development of the region. This highlights the importance of this program. Ensuring the repair and enhancement of Hefei City’s ecosystem service function is essential to fulfilling this criterion, as the city plays a vital role as a key hub in the Yangtze River Economic Belt.

1.2. Literature Review

Ecosystem services are the goods and services that humans directly or indirectly obtain from ecosystems, and they are crucial for preserving ecological security, advancing sustainable development, and preserving human well-being. Ecosystem services are the resource and environmental foundation for sustaining human survival and sustainable development [3,4]. The 1970s saw the start of an international study on ecosystem services, which was later expanded upon by Daily (1997) [5,6] and Costanza (1997) [7], who examined the idea, methodology, and measurement of ecosystem services, respectively. Their research has also served as the basis for ecosystem services research in the country. When it came to highlighting the effects of socio-environmental changes on ecosystem services (such as provisional, regulation, support, and cultural services) and their correlation analyses, the valuation methodology used in the early stages of the research on the valuation of ecosystem services made significant strides [8].
The two primary categories of research approaches for valuing ecosystem services are the material conversion method and the energy value conversion method. The intermediate material conversion method and the final material conversion method are the two divisions of the material conversion method [9]. The value equivalent method, which is derived by multiplying the value of ecosystem services per unit area by the corresponding area, is a representation of the intermediate conversion method. Overseas, this is often based on the value equivalent per unit area proposed by Costanza et al. (1997) [7], and domestically, this is often based on the value equivalent per unit area proposed by Xie Gao Di (2003) [10]. Over the years, researchers domestically and internationally have provided an abundance of study findings by conducting ecosystem service valuations for a range of land types, including forests [11], grasslands [12], farmlands [13], wetlands [14], and coastal environments [15].
The InVEST model, which has been used in numerous applied studies conducted both domestically and internationally, represents the final material conversion method [16]. At the moment, it is the most established and widely used model for valuing ecological services. The InVEST model spatializes the quantitative assessment of the value of ecosystem service functions by simulating changes in the quantity and value of ecosystem services under different land covers. The InVEST model has gained more traction among researchers than earlier ecosystem valuation models due to its capacity for the quantitative assessment of ecosystem services and trade-offs, as well as for scenario analysis and comparing the benefits and drawbacks of different management strategies. A multitude of modules that correspond to different types of services make up the InVEST model, which makes it easier to research the valuation of ecosystem services at different scales, such as the global, regional, and watershed dimensions. The value of ecosystem services in the study area is measured in this paper using the water yield, habitat quality, carbon storage service, and soil conservation services modules. This allows for a comprehensive understanding of the ecosystem condition and natural capital of the study area and is a prerequisite for integrated ecosystem management and scientific planning.
Several land-use change models have been introduced since the 20th century, such as the CA-Markov, Fore-SCE, and FLUS models. These models are unable to replicate the simultaneous development of land-use patches because they do not incorporate spatiotemporal dynamics. This limitation has a detrimental effect on ecological assessment [17,18,19]. In 2021, Liang Xun [20] proposed a new framework dubbed the PLUS model for mining land-use change rules. Researchers have extensively utilized the PLUS model because of its ability to simulate and forecast urban land use in various scenarios, assess the worth of ecological services, and incorporate ecosystem services [21,22].
The primary focus of previous studies on Hefei City has been on the ecological footprint and ecological carrying capacity. However, there needs to be more emphasis on examining the relationship between land use and the responsiveness of ecosystem services. This article outlines the research activities that will be discussed: The study area utilized land-use data from 2000 to 2020 in Hefei City to conduct an ecosystem service assessment using the InVEST model. The investigation focused on the spatial and temporal evolution characteristics of land use and ecosystem services, as well as hotspot identification, using spatial autocorrelation and geodetector methods. Additionally, the geodetector was used to analyze the dynamics of the spatial heterogeneity of ecosystem services in the study area. Ultimately, a comprehensive simulation study was conducted to analyze the impact of several development scenarios on ecosystem services. The study utilized the PLUS model to estimate the spatial distribution of ecosystem services in the study area by the year 2030. The findings of the study provide recommendations for optimizing and regulating ecosystem services. The purpose is to furnish data for making decisions on land use and serve as a point of reference for ensuring ecological security.

2. Materials and Methods
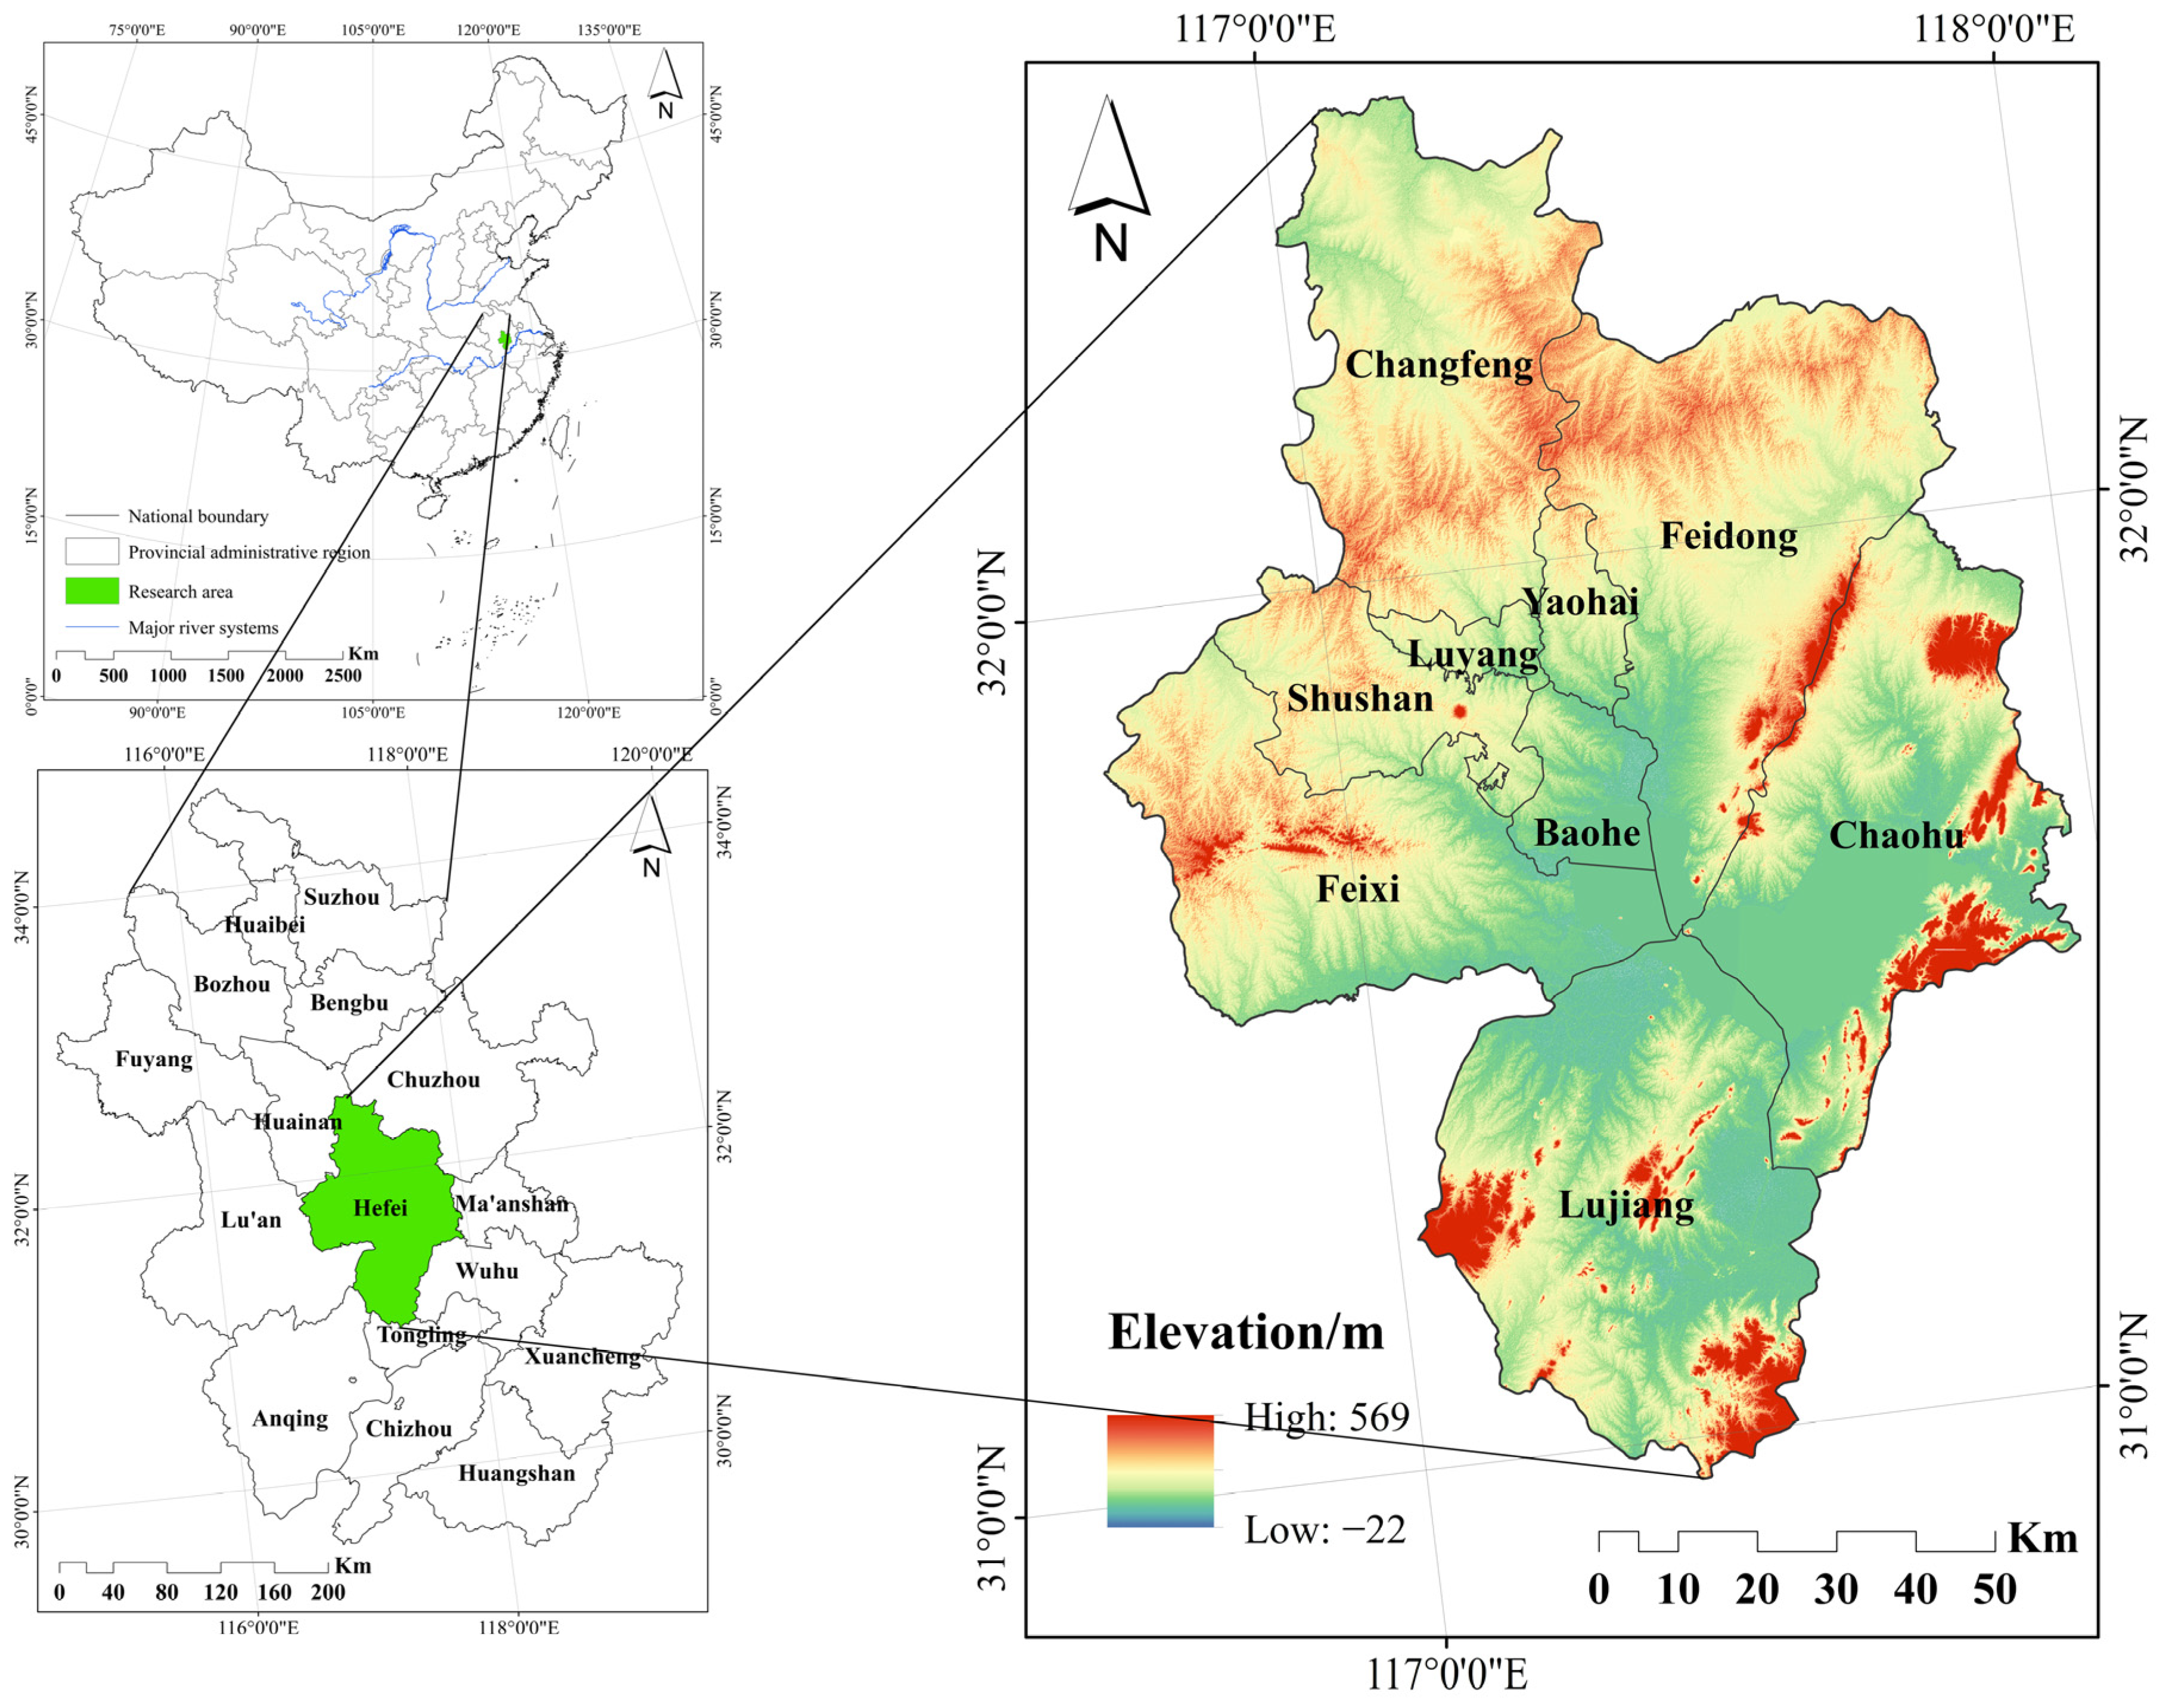
2.1. Study Area

Hefei City is located between the Jianghuai River and the Huaihe River, and is the capital of Anhui Province (Figure 1). Located in Hefei City, Chaohu Lake is one of the five largest freshwater lakes in China. The coordinates of the location are defined by a latitude range of 31°30′–32°38′ north and a longitude range of 116°41′–117°53′ east. Hefei consists of one city, Chaohu, and four counties, namely Yaohai, Luyang, Shushan, and Baohe. Additionally, it includes three significant cities: Feixi, Changfeng, and Lujiang. Hefei City has a land area of 11,445 km2. The predominant landforms in the area consist mostly of hills, low-lying plains, and low-lying mountains. Hefei City is situated at an altitude ranging from 10 to 80 m above sea level and has a humid subtropical monsoon climate. The area contains three distinct types of vegetation: deciduous broadleaf woods, mixed coniferous broadleaf forests, and coniferous forests. In terms of socio-economic conditions, in 2000, Hefei’s GDP was 36.9 billion yuan, ranking 82nd in the country, a clear laggard. In 2010, Hefei’s GDP grew to 270.2 billion yuan, ranking 38th in the country. By 2020, the city’s economy has also demonstrated strong resilience, with an annual GDP of 1004.6 billion yuan, ranking 20th in the country and crossing the “trillion club” for the first time, with years of economic growth at the forefront of the country. In November 2020, Hefei’s resident population reached 9,369,900, and the city has entered the ranks of mega-cities. The high potential, steady growth, and strong resilience of Hefei’s economy must be balanced with the rich dividends brought by the optimization and upgrading of the industrial structure. Compared with 2000, the structure of the three major industries in Hefei will be adjusted from 11.4%, 48.6%, and 40.0% to 3.0%, 36.6%, and 60.4%, respectively, in 2023. In particular, The Economist Weekly published a lengthy evaluation article on 5 August 2023, analyzing Hefei’s urban development path in depth, stating that the “Hefei Model” empowers high-quality development of the city’s economy and provides a practical example for the development of other cities in China.

2.2. Data Sources

The study acquired the three-phase land-use data (2000, 2010, and 2020) from the Resource and Environment Data Sharing Center of the Chinese Academy of Sciences (CAS). The data have a geographical resolution of 10 m × 10 m. The land-use data were categorized into six distinct types: cultivated land, forest land, grassland, water area, construction land, and unused land, based on the classification scheme devised by the CAS. The digital elevation model (DEM) data were acquired via the Geospatial Data Cloud (GDC). The gradient and orientation of the slope were derived from the DEM. The water system, road, and administrative boundary (point) data are sourced from the National Geographic Information Resources Catalog Service System. The soil data are sourced from the Harmonized World Soil Database (HWSD). A description of the data is shown in Table 1.

2.3. Research Framework

The objective of this study is to perform the following: (1) Examine the changes in land use in Hefei City, measure four ecological indicators, and analyze their spatial and temporal evolution patterns. (2) Develop a CES index to investigate the attributes of the influence of land-use change on ecosystem services and examine its response mechanism using various methodologies. (3) Conduct a simulation of future land-use changes and examine the corresponding changes in multiple ecosystem services and the CES index in Hefei under various scenarios. This analysis aims to give valuable information for making informed decisions on land use. The complete adopted technique in the current investigation is comprehensively presented in Figure 2.

2.4. Research Methodology

2.4.1. PLUS Multi-Scenario Simulation Forecasting

  • First bullet: Introduction to the model;
The Patch-generating Land Use Simulation Model (PLUS), created by the High-Performance Spatial Computing Intelligence Laboratory (HPSCOL), comprises two components: the Land Expansion Analysis Strategy (LEAS) and the CA (Cellular Automata) model based on multi-class stochastic patch seeding (CARS). This model depicts the changes in land use resulting from the dynamic interactions between economic, ecological, and social systems. Its purpose is to enhance planning policies for sustainable development. The LEAS algorithm identifies and isolates the components of land-use expansion from two periods of land-use change. It then samples from these components to determine the probability of development for each land-use type and the contribution of each driver to the expansion of each land-use type during the specified period. This is achieved by employing the Random Forest algorithm to analyze the expansion of each land-use type and its associated driving factors. The CARS module is derived from the multi-class random patch-seeded cellular automata (CA) model. It enhances it through the implementation of random seed generation and a threshold-reducing mechanism [26,27].
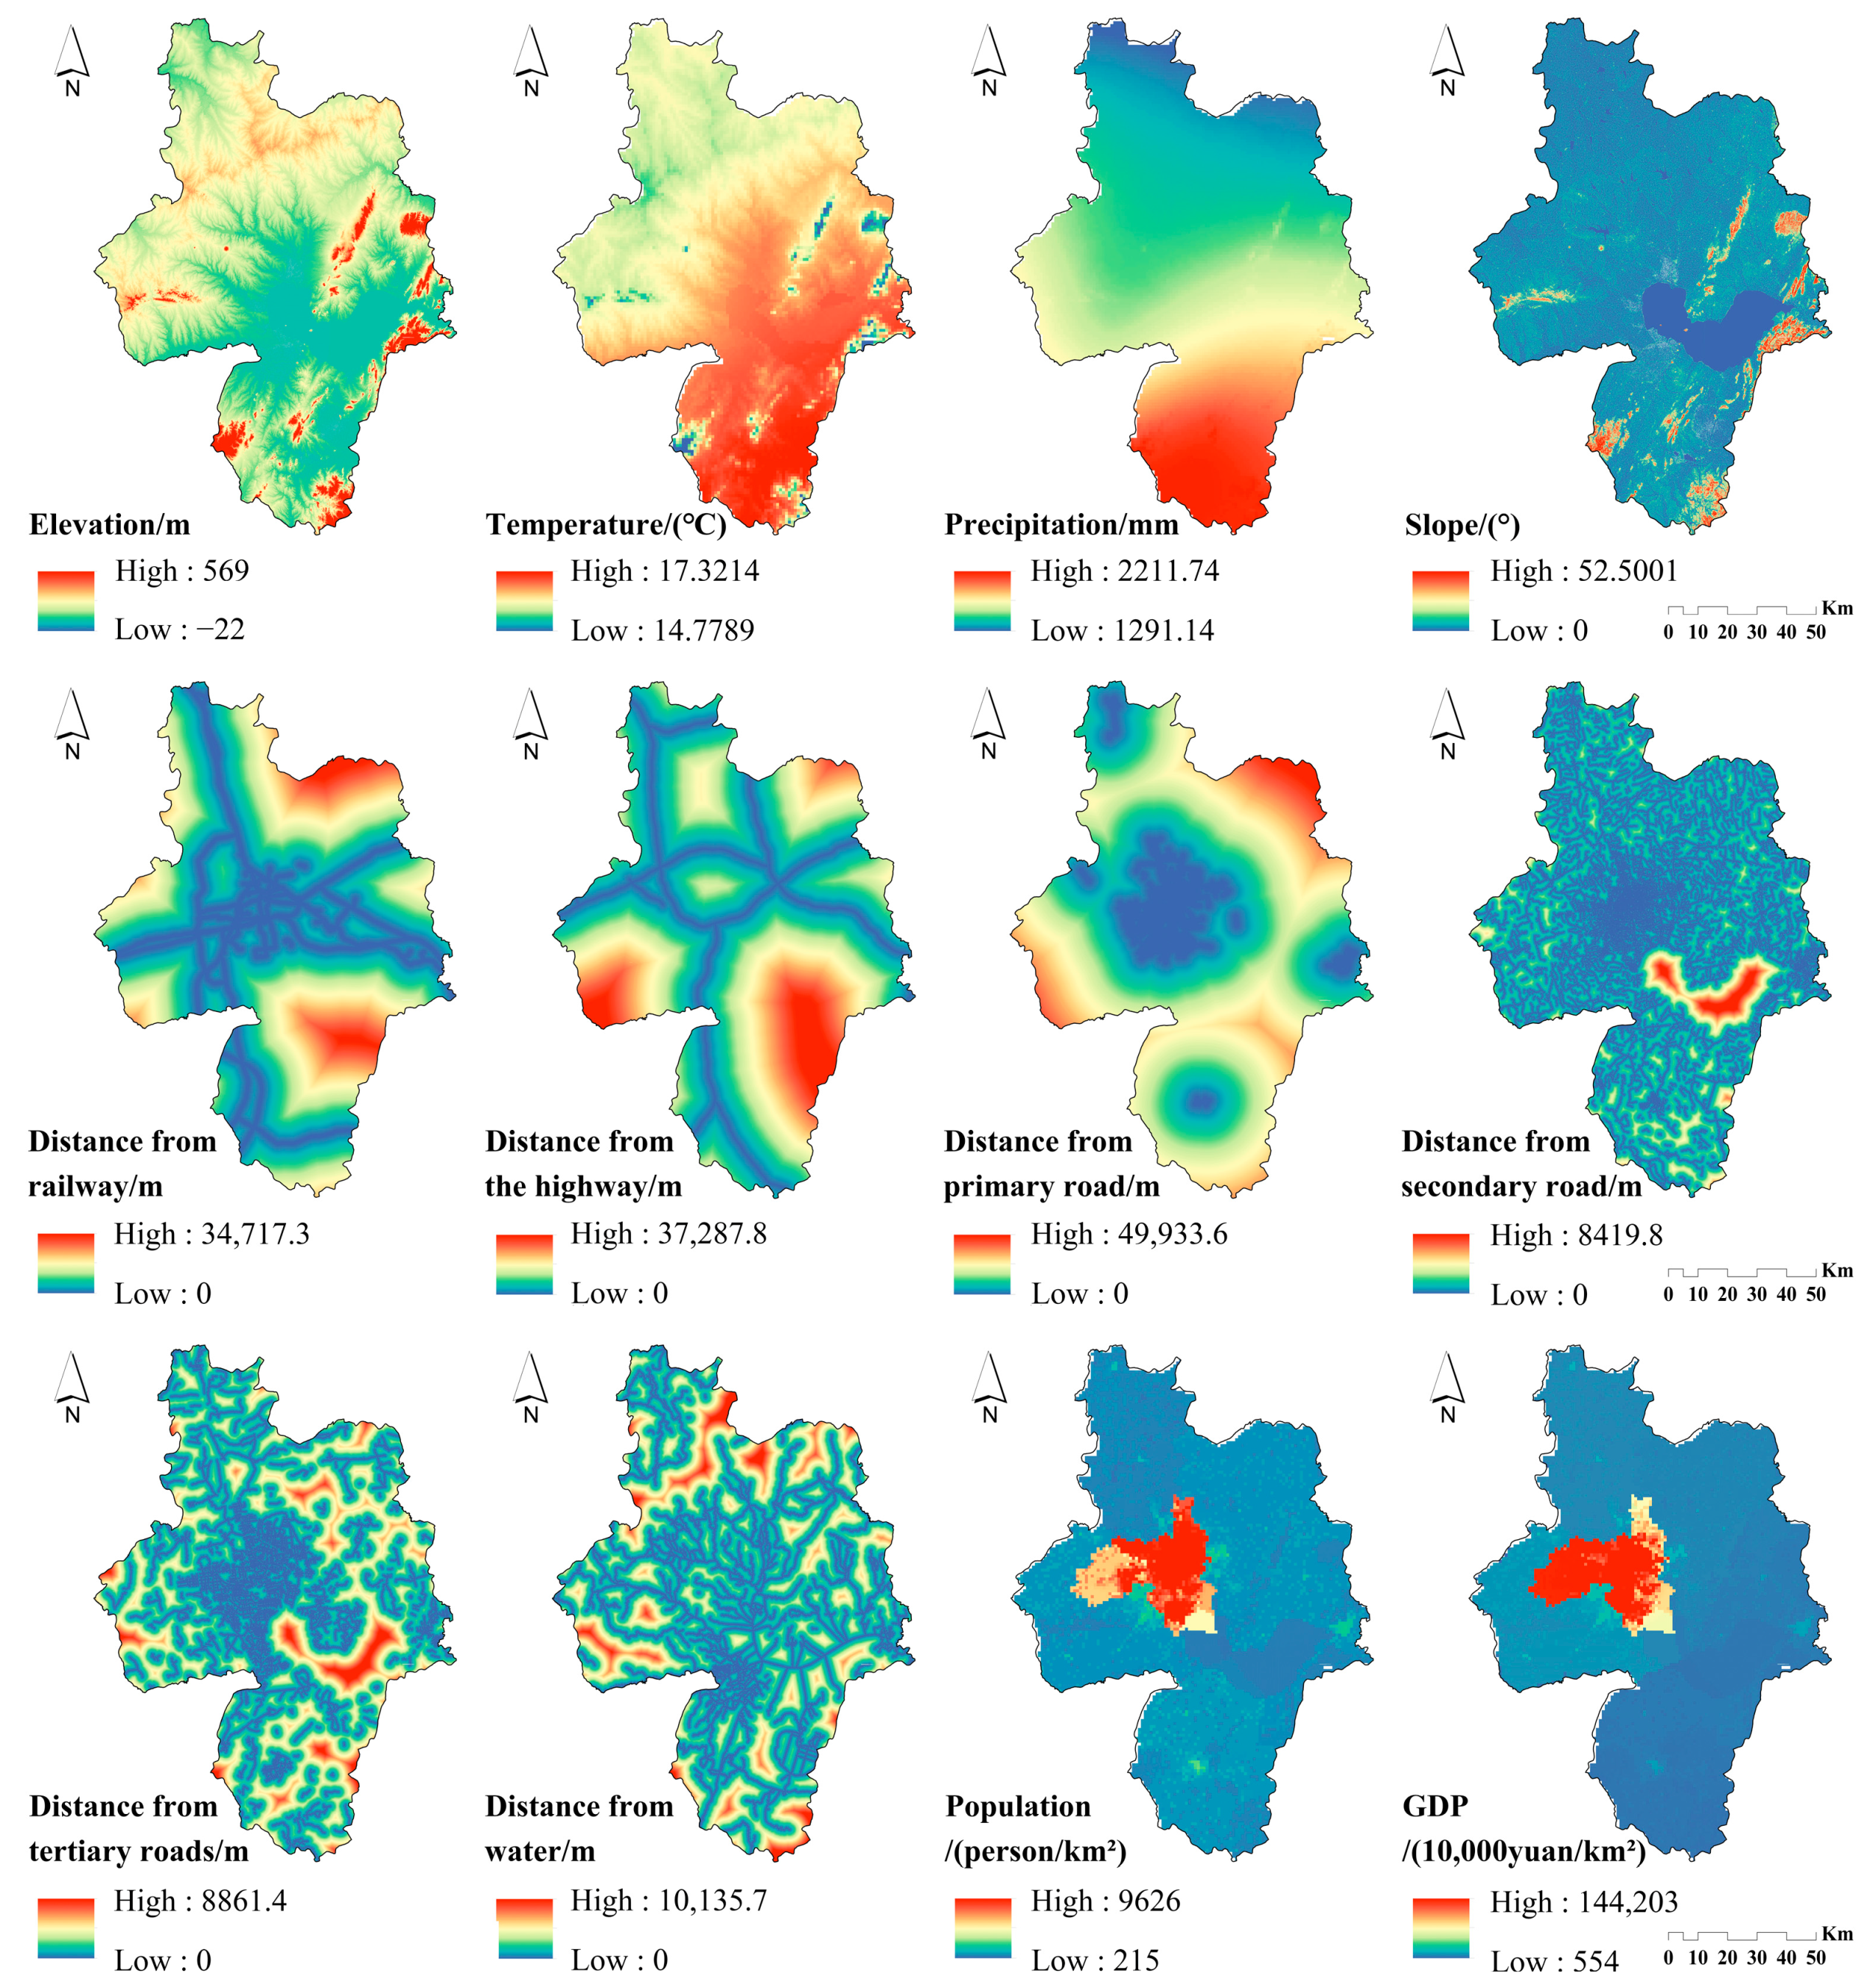
  • Second bullet: Selection of driving factors;
Based on the current conditions of the study area, taking into account natural, economic, and social factors and considering the availability of data, 12 factors that drive land-use change (Figure 3) have been selected as input for the LEAS module. Driving factors include elevation, temperature, precipitation, slope, distance to railway, distance to highway, distance to primary road, distance to secondary road, distance to tertiary road, distance to water, population, and GDP. The contribution of each driving factor to the expansion of each land type is calculated, resulting in the probability of development for each land-use type.
  • Third bullet: Land-use simulation scenario presetting;
The model employs multiple factors and training parameters, including land-use demand, transfer matrix, and neighborhood weights, to forecast the distribution of land use in Hefei City by the year 2030 (Table 2). The study outlines four development scenarios: natural development (ND), urban development (UD), cultivated land protection (CP), and ecological protection (EP). The land-use transfer probability matrix is calibrated using the Hefei City Territorial Spatial Master Plan (2021–2035) and current research [24,28,29]. In the ND scenario, the extent of land utilization remains constant between the years 2000 and 2020. The UD scenario strictly forbids the transformation of property designated for construction land purposes into other types of land while adhering to the policy guidelines aimed at minimizing the unregulated growth of construction land. The CP scenario simulates the impacts of implementing the cultivated land protection policy, which prohibits the conversion of cultivated land to other land uses and ensures the preservation of essential farmed land. The EP scenario places a high priority on the protection of forest land and other ecological land. The objective is to reduce the transformation of forest land into other land uses while promoting the conversion of non-forested land into forested areas. Furthermore, it explicitly forbids the transformation of forest land into any alternative land classification. The water area is regularly listed as off-limits for all situations.
  • Fourth bullet: Setting neighborhood weight parameters;
The neighborhood influence factor quantifies the degree of interaction between various land-use types and units within a neighborhood. It is measured on a scale of 0 to 1, with values closer to 1 indicating a higher capacity for land-use expansion. The work utilizes the change in land-use type area in Hefei City from 2000 to 2020, along with relevant research [30,31,32], to determine the neighborhood weights. These weights are presented in Table 3.
  • Fifth bullet: Accuracy verification.
The simulation standards for this study were established in 2000 and 2010. The land-use forecast statistics for 2020 were obtained by executing the PLUS model. Subsequently, the forecasted outcomes were juxtaposed with the factual land utilization data recorded in 2020. The results demonstrate that the Kappa coefficient is 0.86, indicating a high level of reliability and appropriateness of the simulation results for predicting the land-use changes of urban agglomerations in 2030.

2.4.2. InVEST Ecosystem Service Functioning Assessment

This study utilized the InVEST model to conduct a quantitative evaluation of four crucial indicators of ecosystem services in Hefei City. These indicators include habitat quality, water production, carbon storage, and soil conservation. The water yield module of the InVEST model is a technique that calculates the water balance by deducting the actual evapotranspiration (which includes both surface evapotranspiration and vegetation evapotranspiration) from the amount of rainfall [33]. This estimation is conducted using a raster-based approach. The determination of plant-accessible water content (PAWC) was conducted by analyzing the soil texture and soil organic matter content. The parameters of the coefficient table were determined using the relevant literature [23]. The habitat quality indicators were calculated using the habitat quality module of the InVEST model to assess the advantages and disadvantages of habitat quality in the specified research area. This assessment functions as a gauge of the impact of human activities on the state of habitats. This research examines the elements that pose a danger to cultivated land and construction land based on previous studies [34,35]. It also identifies forest land, grassland, water area, and unused land as habitats. The sensitivity factor was determined based on pertinent sources. The carbon storage was quantified using the InVEST model. The evaluation of carbon storage generally includes the four main carbon reservoirs, which are above-ground, below-ground, soil, and dead organic matter. However, because of the difficulties in obtaining data for the carbon reservoirs of deceased organic matter, only the three main reservoirs were considered. The carbon density data were selected based on the relevant literature [36,37]. The InVEST model is utilized for soil conservation, which pertains to the capacity of ecosystems to avoid and alleviate soil erosion. To ascertain the parameters of each category, use the InVEST model user handbook and relevant research [38,39]. The current study utilized the Modified Universal Soil Loss Equation (RUSLE) as described in the Guidelines for the Delineation of Red Line for Ecological Protection to assess soil conservation. The assessment entailed quantifying the discrepancy between the anticipated soil erosion and the observed erosion.

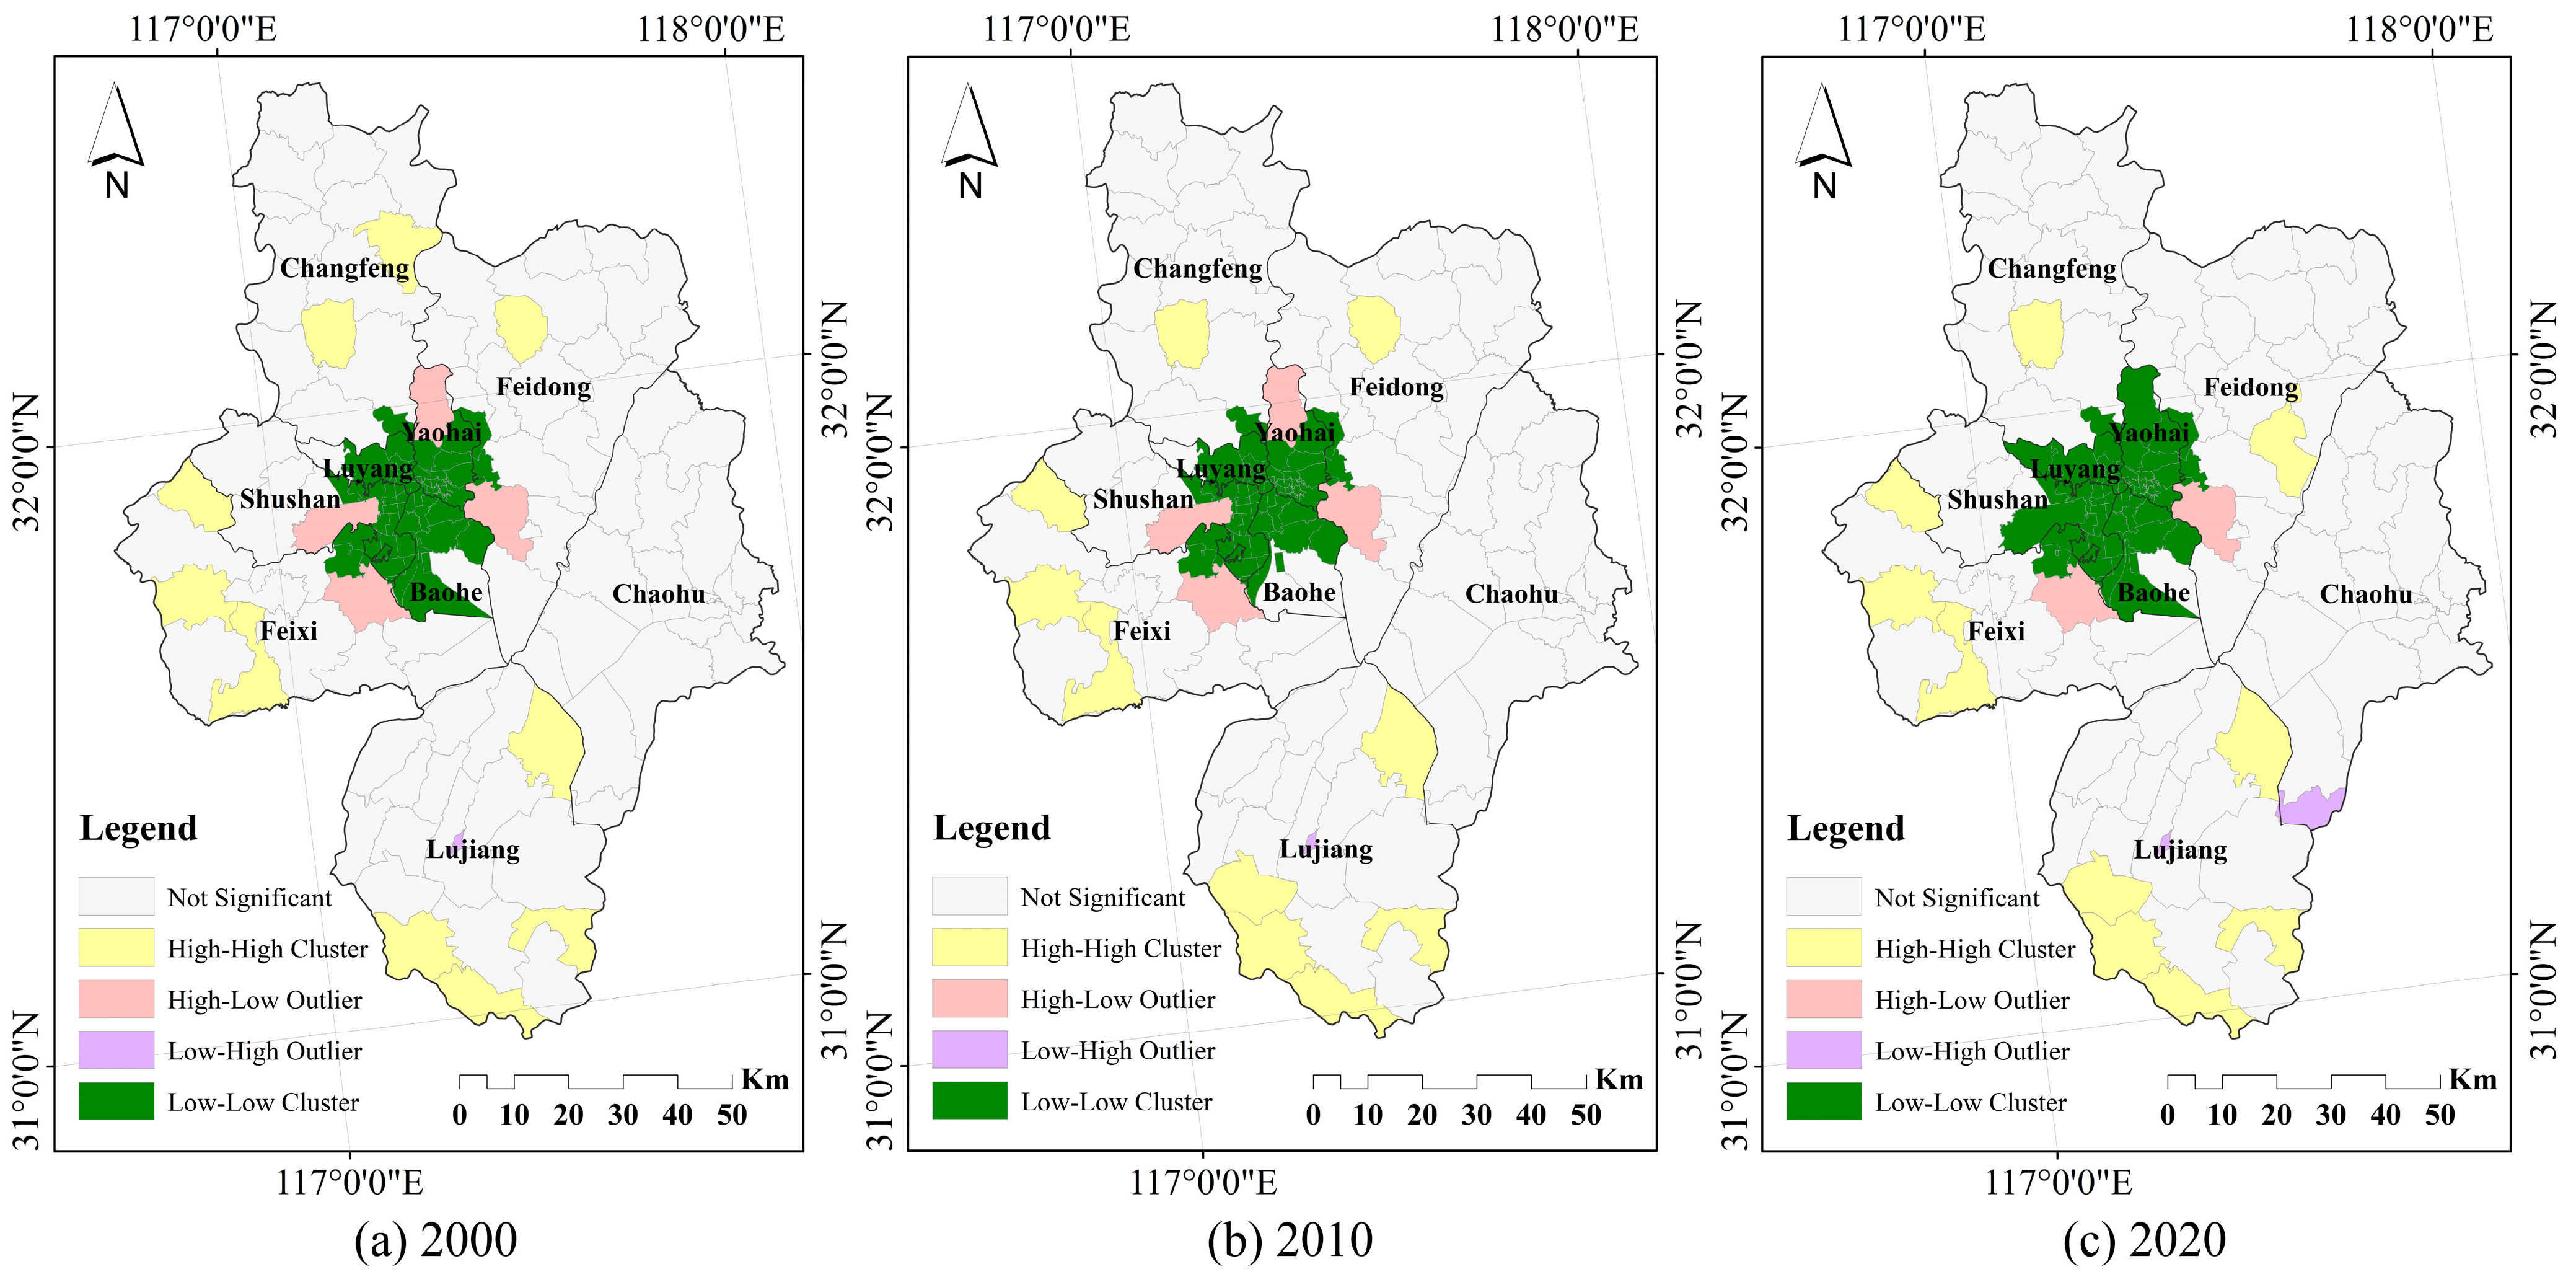
2.4.3. Spatial Autocorrelation Analysis

The spatial autocorrelation analysis includes global spatial autocorrelation and local spatial autocorrelation, and the global spatial autocorrelation reveals the overall distribution characteristics of ecosystem service value in Hefei City, which is expressed by Moran’s I, and its specific formula is
I = n i   j   w i , j × i   j   w i , j x i x ¯ x j x ¯ i   x i x ¯ 2
For a single spatial unit I, the local spatial autocorrelation Local Moran′s Index (Local Moran′s I) was used to reveal the aggregation and significance of local spatial elements [40,41] and combined with LISA (Local Indicators of Spatial Association) agglomeration maps to detect the specific location of ecosystem service values in the spatial aggregation. Its Local Moran′s I was calculated as shown in Equation:
I = n 2 i   j   w i . j × x i x ¯ j   w i j x j x ¯ j   x j x ¯ 2
In Equations (1) and (2), xi and xj are the attribute values of spatial units i and j and their average values, respectively; wij is the spatial weight matrix established based on the neighbor relationship, i.e., if region i and region j have a common boundary, wij has a spatial weight of 1 and takes the value of 0 otherwise. Moran′s I ∈ [−1, 1], and when >0, it indicates that ecosystem service values are positively correlated in spatial distribution; when =0, it indicates that ecosystem service values are randomly distributed; if <0, there is a negative correlation of ecosystem service values. Hotspot analysis (Getis-Ord Gi*) is used to identify spatial clustering of high (hot) and low (cold) values with significance. It is a means to explore the distribution characteristics of local spatial clusters. The hotspot analysis can visualize whether there are high-value clusters and low-value clusters of ecosystem service values in Hefei City.

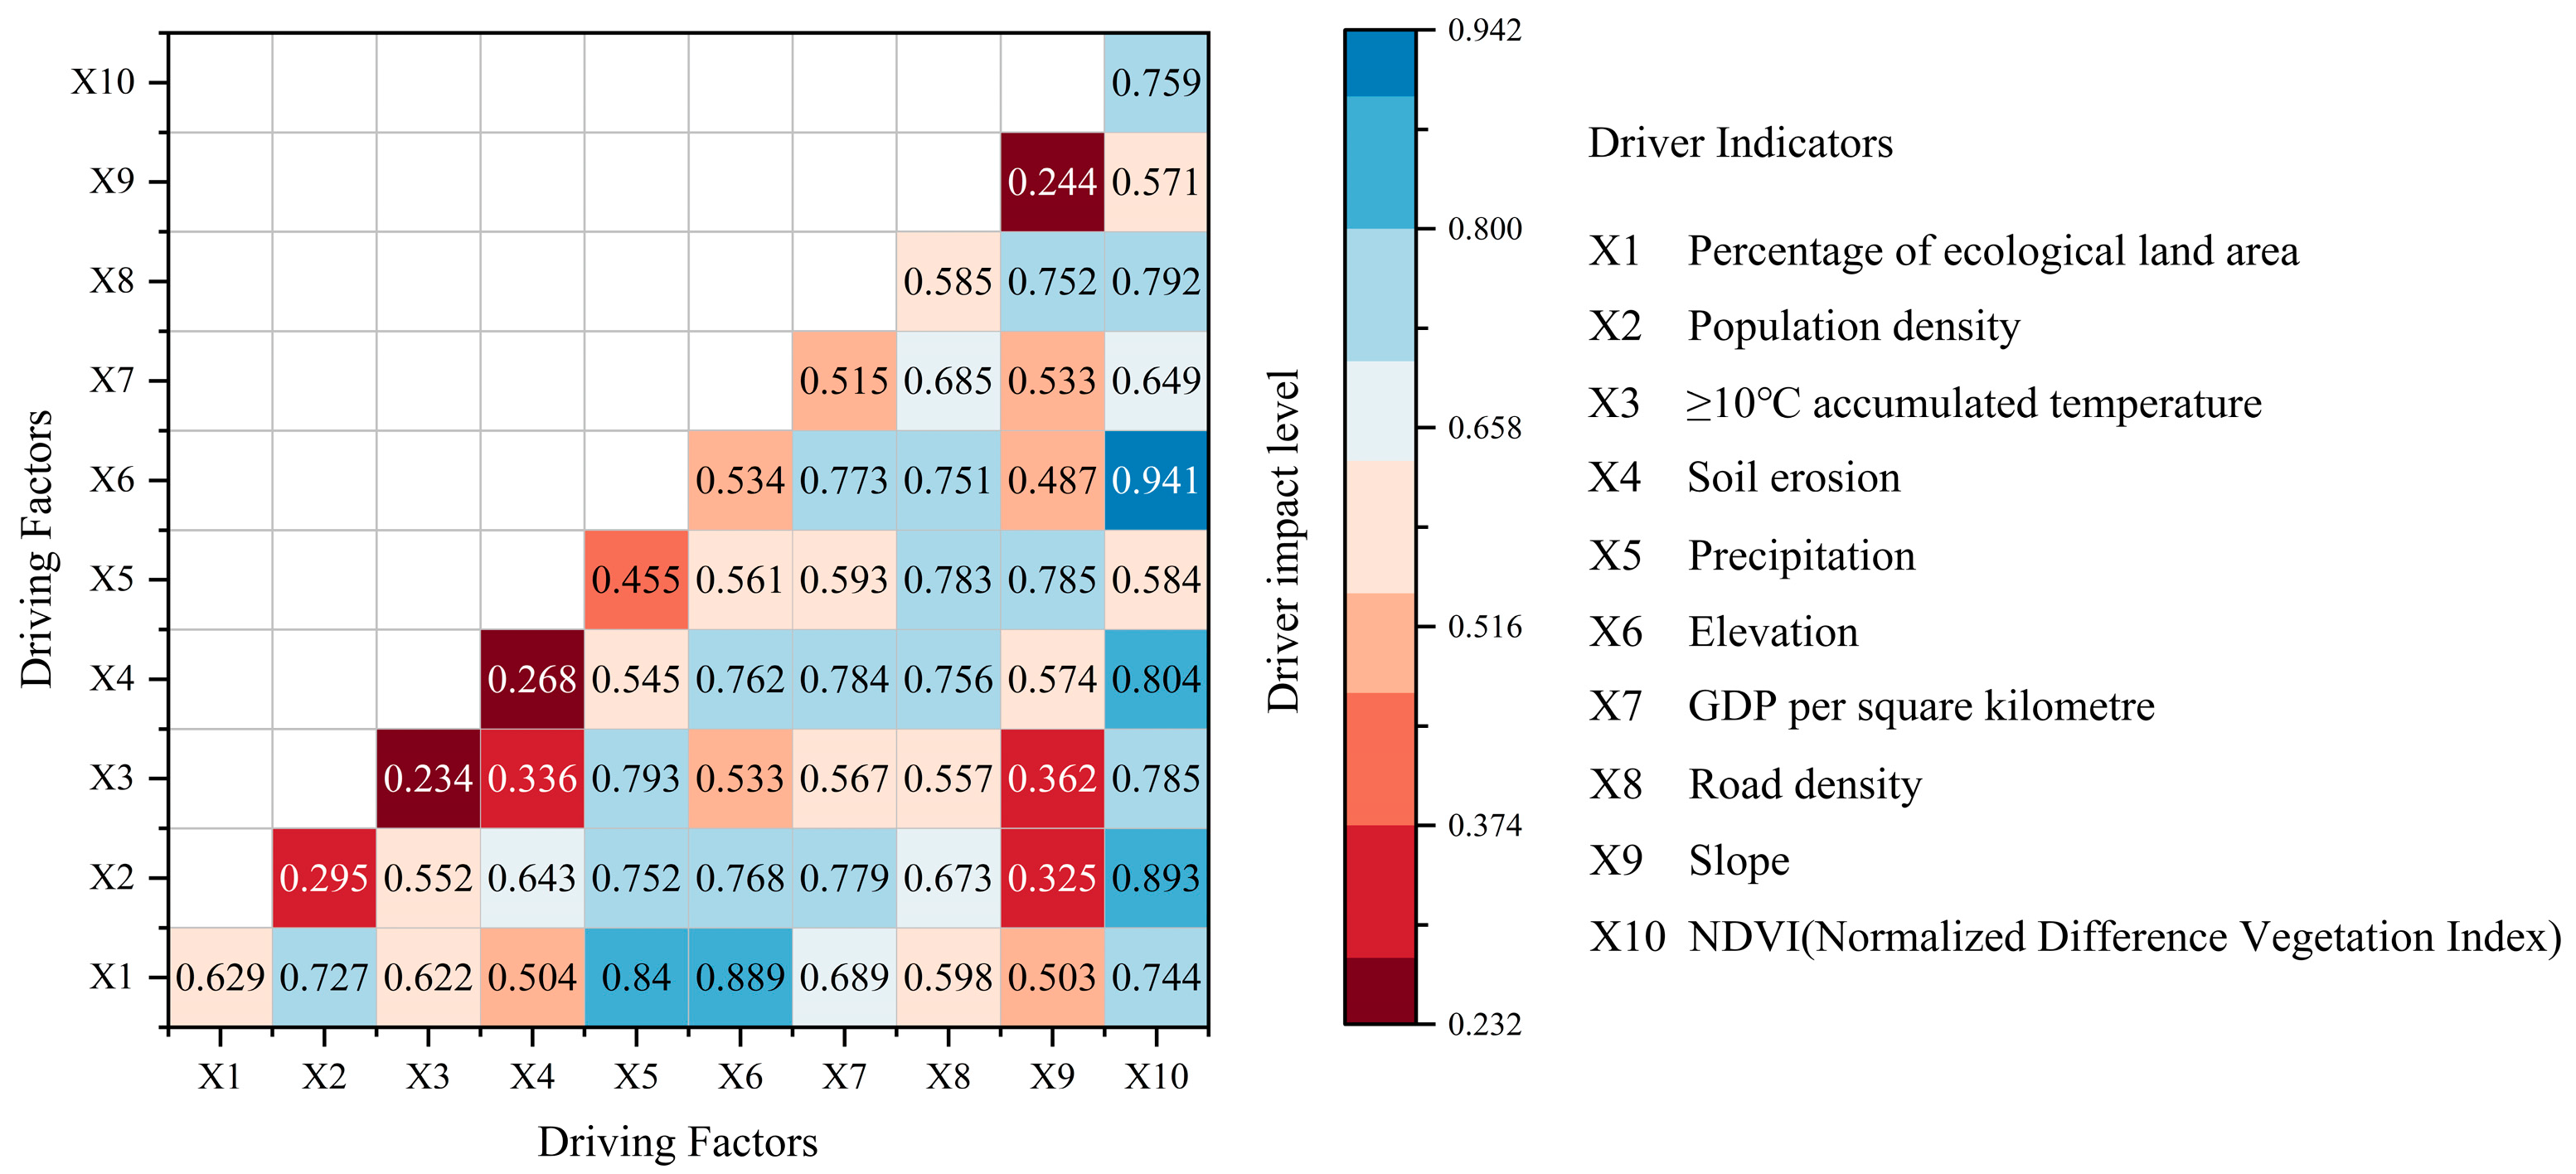
2.4.4. Geo-Detectors

Geographic Detector is an important method based on the principle of geography to study the formation mechanism of spatial variability of geographic elements, which is based on the principle of testing whether the spatial differentiation of attributes is consistent with the spatial differentiation of factors [25]. Its advantage is that it can directly portray the interaction between different drivers. The details are as follows:
P D = 1 1 / n σ 2 i = 1 k   n i σ i 2
where PD is the D driver role of the driver, n, and σ2 are the dispersion variance of the ecological service value and different drivers in Hefei City, ni is the number of sub-level decision-making units, σi2 is the dispersion variance of the ecological service value of the sub-level decision-making units, and k is the number of hierarchical subdivisions of the driver. Therefore, this paper selects ten driving factors from two aspects of natural factors and social factors to reveal the formation mechanism of spatial variability of ecological service value in Hefei City.

2.4.5. Comprehensive Ecosystem Services Index

This research developed a comprehensive ecosystem service index (CES) to accurately measure and quantify the overall impact of various ecological services. The index was produced based on the relevant literature [42]. In numerous scholarly investigations, there exists a tendency to assign equal significance to all ecological services despite the fact that the relative value of distinct ecological service functions varies. This research uses the hierarchical analytic approach AHP, which is based on prior studies, to assess and compare the overall level of several ecosystem services across various situations. The complete ecosystem service index can provide a spatial representation of the overall state of urban ecosystems. The formula for this index is as follows:
C E S j = i = 1 n   w i × S i j
S = S Min Max Min
CESj is the composite ecosystem service index in year j; wi is the weight of ecosystem service i; Sij is the normalized value of ecosystem service i in year j; and n is the number of ecosystem service categories. Table 4 shows the weights of each type of ecosystem service determined by AHP.

3. Results

3.1. Characteristics of Spatial and Temporal Changes in Land Use

3.1.1. Characteristics of Land-Use Quantity Evolution

Between 2000 and 2020, land use in Hefei City underwent significant changes (Figure 4). There was a noticeable increase in the construction land, a significant decrease in the area used for cultivated land, and a rather consistent distribution in other land categories. In terms of changes in land quantity, it is important to note that the area of construction land increased from 1367.82 km2 in 2000 to 2025.14 km2 in 2020, indicating a growth rate of 2.40%. The rise of construction land has resulted in a substantial decrease in the amount of cultivated land. More precisely, the total area of cultivated land experienced a reduction from 8200.23 km2 in the year 2000 to 7525.88 km2 in 2020, indicating a fall of 674.35 km2. The decline indicates a motivation decrease of −0.41%. The forested land area exhibits a non-linear trend, decreasing from 483.26 km2 in 2000 to 480.40 km2 in 2020. The decline in this context is correlated with a reduction in the area of 2.86 km2, leading to a negative motivation rate of −0.03%. The water area has a non-linear growth pattern, with its surface area increasing from 1028.77 km2 in 2000 to 1044.11 km2 in 2020. This signifies an expansion of 15.34 km2, accompanied by a growth rate of 0.07%. It is crucial to note that the grassland area demonstrates a pattern of decrease followed by an increase. From 2000 to 2010, the area of the region decreased by 2.43 km2, but from 2010 to 2020, it increased by 3.25 km2. The rate of rise in motivation is 0.08%, while the rate of change over ten years is 0.14%. From 2000 to 2020, Hefei City saw a phase of rapid urbanization, as evidenced by its development history. This era has been marked by swift regional socio-economic progress and an increasing need for varied land utilization. The rapid urbanization and infrastructure development in Hefei City has resulted in the encroachment of construction land into other land-use categories, leading to a substantial increase in the area of land designated for construction purposes.

3.1.2. Evolutionary Characteristics of Land-Use Transfer

Between the years 2000 and 2020, there has been a significant change in land-use categories, as shown in Figure 5, when considering land transfer characteristics. From 2000 to 2010, a total of 411.26 km2 of cultivated land was moved out, making it the land category with the largest amount of land transferred. The primary destination for this area was construction purposes. The total area of land transferred to construction land was 393.23 km2, making it the land category with the largest amount of transfer. Within this, 387.50 km2 of cultivated land was transferred to construction land, with cultivated land being the primary contributor to the expansion of construction land. The quantity of land that has been transferred out of construction land is 11.34 km2. This transferred land area is the second largest, following only cultivated land. Out of the total transferred land, 10.80 km2 have been converted into cultivated land. From 2010 to 2020, the highest category of land in terms of area transferred out will continue to be cultivated land, with a total area of 334.38 km2. The second category is construction land, which saw a substantial rise in area transferred out, totaling 48.45 km2, compared to the prior period. Out of the whole area, a portion of 42.70 km2 was converted into cultivated land. After being transferred out, cultivated land primarily becomes a water area, which plays a crucial role in the subsequent expansion of the water area during the two stages.

3.2. Characterization of Spatial and Temporal Changes in Ecosystem Services

Figure 6 illustrates the changes in ecosystem services in Hefei City from 2000 to 2020, considering both temporal and spatial aspects. The average water yield in the years 2000, 2010, and 2020 was 766.81 mm, 1092.01 mm, and 1468.32 mm, respectively, showing temporal variability. This signifies a consistent rise in the city’s water yield, illustrating a growth pattern that is not linear. The city’s water yield capacity has experienced notable growth, primarily concentrated in the southern region of Hefei City, particularly in the Lujiang County vicinity. According to the study of geographical patterns, the amount of water yield in Hefei City has remained largely stable over the previous two decades. The spatial variation pattern of water yield depth at different times shows low variance. The entire display has a high level of uniformity, with a consistent pattern of low values in the northern part and high values in the southern section. The pattern exhibits a high correlation with the spatial distribution of reduced precipitation in the northern portion of Hefei City. The southern region has distinct disparities in land cover types between its northern and southern areas. Regions characterized by high average precipitation and low evapotranspiration of vegetation possess a significant ability to water yield. In contrast, regions characterized by low rainfall and high evapotranspiration rates of vegetation exhibit a limited ability to yield water.
Considering the temporal fluctuations in habitat quality, the mean values of habitat quality in 2000, 2010, and 2020 were 0.4556, 0.4452, and 0.4280, respectively. The overall habitat quality exhibited a declining pattern. Over the past two decades, the new development sites in the Central metropolitan region, Chaohu City, and Lujiang County have transitioned from being moderately valued to being valued as poor. This shift has resulted in a significant deterioration in the overall quality of the habitat. This is directly associated with the occurrence of increased interference caused by human activities and significant harm to the biological environment. Except for these three locations, the overall quality of habitats has improved in all other regions. Regional variations in habitat quality are readily apparent when seen from a geographical scale perspective. For instance, an urban center typically contains a high concentration of places with low habitat quality. The largest group, which is primarily dispersed around the high-value area, is the median value area. The regions characterized by steep terrain in the western and southern parts, lakes and mountains in the eastern part, and other locations exhibiting superior ecological development emerge as the primary clusters with excellent habitat quality. In general, the habitat quality in urban areas and the surrounding urban centers is comparatively low.
The temporal trend of carbon storage exhibits a decreasing pattern, with the cumulative carbon storage values in 2000, 2010, and 2020 recorded as 9.32 × 10⁷ t, 9.23 × 10⁷ t, and 9.17 × 10⁷ t, respectively. The key drivers behind the decline in carbon storage are the substantial rise in urban development and the conversion of forest land, cultivated land, and grassland. The less valuable sections of carbon storage have a generally stable degree of consistency, while certain high-value regions undergo a decline and shift towards medium-value parts. Most of the locations that are seeing a decline in value consist of newly developed land, where building has taken place in the last two decades. The spatial distribution of carbon storage in Hefei exhibits a significant correlation with the kind of land use. The mountains of Hefei, including Zipeng Mountain, Dashushan Mountain, Niuwangzhai in Lujiang County, Yefu Mountain, and Wuding Mountain, have dispersed areas with significant carbon storage potential. Additionally, these mountains exhibit a substantial percentage of vegetation coverage. The distribution of carbon storage in Hefei City is characterized by unevenness, with the highest concentration observed in cultivated land, construction land, and unused land. The areas with limited carbon storage are predominantly located in aquatic environments, specifically Chaohu Lake in the eastern section of the city, as well as Dongpu Reservoir and Dafangying Reservoir in the northwest. The distribution of carbon storage is strongly correlated with land-use patterns, with forest land dominating high-value areas and water areas dominating low-value areas.
The temporal fluctuation in soil conservation can be observed by examining the cumulative soil conservation amounts in 2000, 2010, and 2020, which are 3.45 × 10⁸ t, 5.94 × 10⁸ t, and 9.11 × 10⁸ t, respectively. The data demonstrate a persistent and continuous increase in soil conservation over some time. Over the past twenty years, most locations in Hefei City have witnessed a decrease in soil conservation, with only a few mountainous regions able to maintain growth. The highest level of growth is found in Niuwangzhai, reaching a maximum of 5.75 × 10³ t. The growing region is predominantly characterized by a combination of woodland and grassland, with a substantial amount of flora covering the area. The vegetation in this area offers a certain degree of safeguarding, and the soil here is not greatly prone to erosion. The regional distribution of soil conservation in Hefei City was largely consistent in 2000, 2010, and 2020, with a consistent trend of higher intensity in the southeast and lower intensity in the northwest. The level of soil conservation in the central metropolitan region is much inferior when compared to Yinping Mountain in the east, as well as Niuwangzhai and Wuding Mountain in the south. The soil conservation services provided by various land-use types vary greatly, with natural ecosystems exhibiting a significantly better soil conservation status compared to urban ecosystems, which experience higher levels of human involvement.
The mean CES value can accurately represent the overall supply status of ecosystem services. Based on the temporal variation of CES (Figure 7), the mean CES values in 2000, 2010, and 2020 were 0.387, 0.420, and 0.398, respectively, indicating a pattern of an initial increase followed by a decrease. Future enhancement of ecosystem services is needed as there has been a notable decline in the CES index for the center metropolitan area and Chaohu City over the last two decades. Additionally, a significant portion of Changfeng County in the northern region has shown a downward trend in the CES index while Lujiang County has experienced notable enhancements, particularly in Niuwangzhai and Yefu Mountain located in the southern region. The overall spatial distribution of CES in Hefei City has remained largely unchanged with a “southern high and northern low” pattern characterized by high values in the southern portion and mountainous regions while low values are found in the northern part of Hefei City, Chaohu Lake area, and other rivers and lakes.

3.3. Ecosystem Service Assessment and Spatial Heterogeneity Analysis

A study was conducted to examine the spatial autocorrelation of the total ecosystem index in Hefei City using the global Moran’s I technique. The correlation test was successfully conducted at three time points: 2000, 2010, and 2020. The significance test was successfully passed with a p-value of 0.00, suggesting a confidence level of 99% or above. Furthermore, the global Moran’s I was determined to be positive. The study area demonstrates geographic clustering tendencies in connection to the comprehensive ecosystem index. Overall, the global Moran’s index showed a decreasing trend, indicating that the index shifted from a strong correlation to a weak correlation over the study period. Consequently, the study of the evolution of the local spatial pattern was carried out in the study area, and the LISA aggregation map of ecological indices was obtained (Figure 8).
The chart illustrates that the prevalence of low-low agglomeration has consistently increased over the past two decades. Specifically, the figures in 2000, 2010, and 2020 were 55, 54, and 58, respectively, indicating a continuous upward trend. The majority of these streets are clustered in the central area of Hefei. Low-low agglomeration is characterized by a centralized and continuous distribution pattern. On the contrary, high-high agglomeration is characterized by a concentrated and continuous distribution in the southern and western regions of Hefei City, while other areas show a dispersed distribution. High-low agglomeration and low-high agglomeration, on the other hand, exhibit a scattered distribution. In terms of quantity, the order of agglomeration from highest to lowest is low-low, high-high, high-low, and low-high.
The region characterized by high-high aggregation is commonly observed in the counties surrounding the metropolitan center and in the southern region of Lujiang County. The region is primarily distinguished by its undulating topography, which includes a greater share of forested regions, limited urban development, and favorable ecological conditions. In a region characterized by high-low aggregation, the High-tech Development Zone, Cuozhen, Shangpai Township, and Thirty Heads Township are situated. These regions have elevated ecological indicators and exert a significant impact on the adjacent townships. The center of Hefei City is predominantly situated inside a low-low agglomeration zone, indicating a relatively low ecological service index between the agglomeration region and its surrounding areas, resulting in negligible disparities. The site functions as a central hub for economic advancement in Hefei City, and there is a requirement for additional enhancement in the ecological surroundings. Due to insufficient management of the ecological environment in industrial development activities, the Lujiang Economic Development Zone has experienced a growing concentration of high-low aggregation. Consequently, there is a pressing need to enhance the regional ecological balance capability.

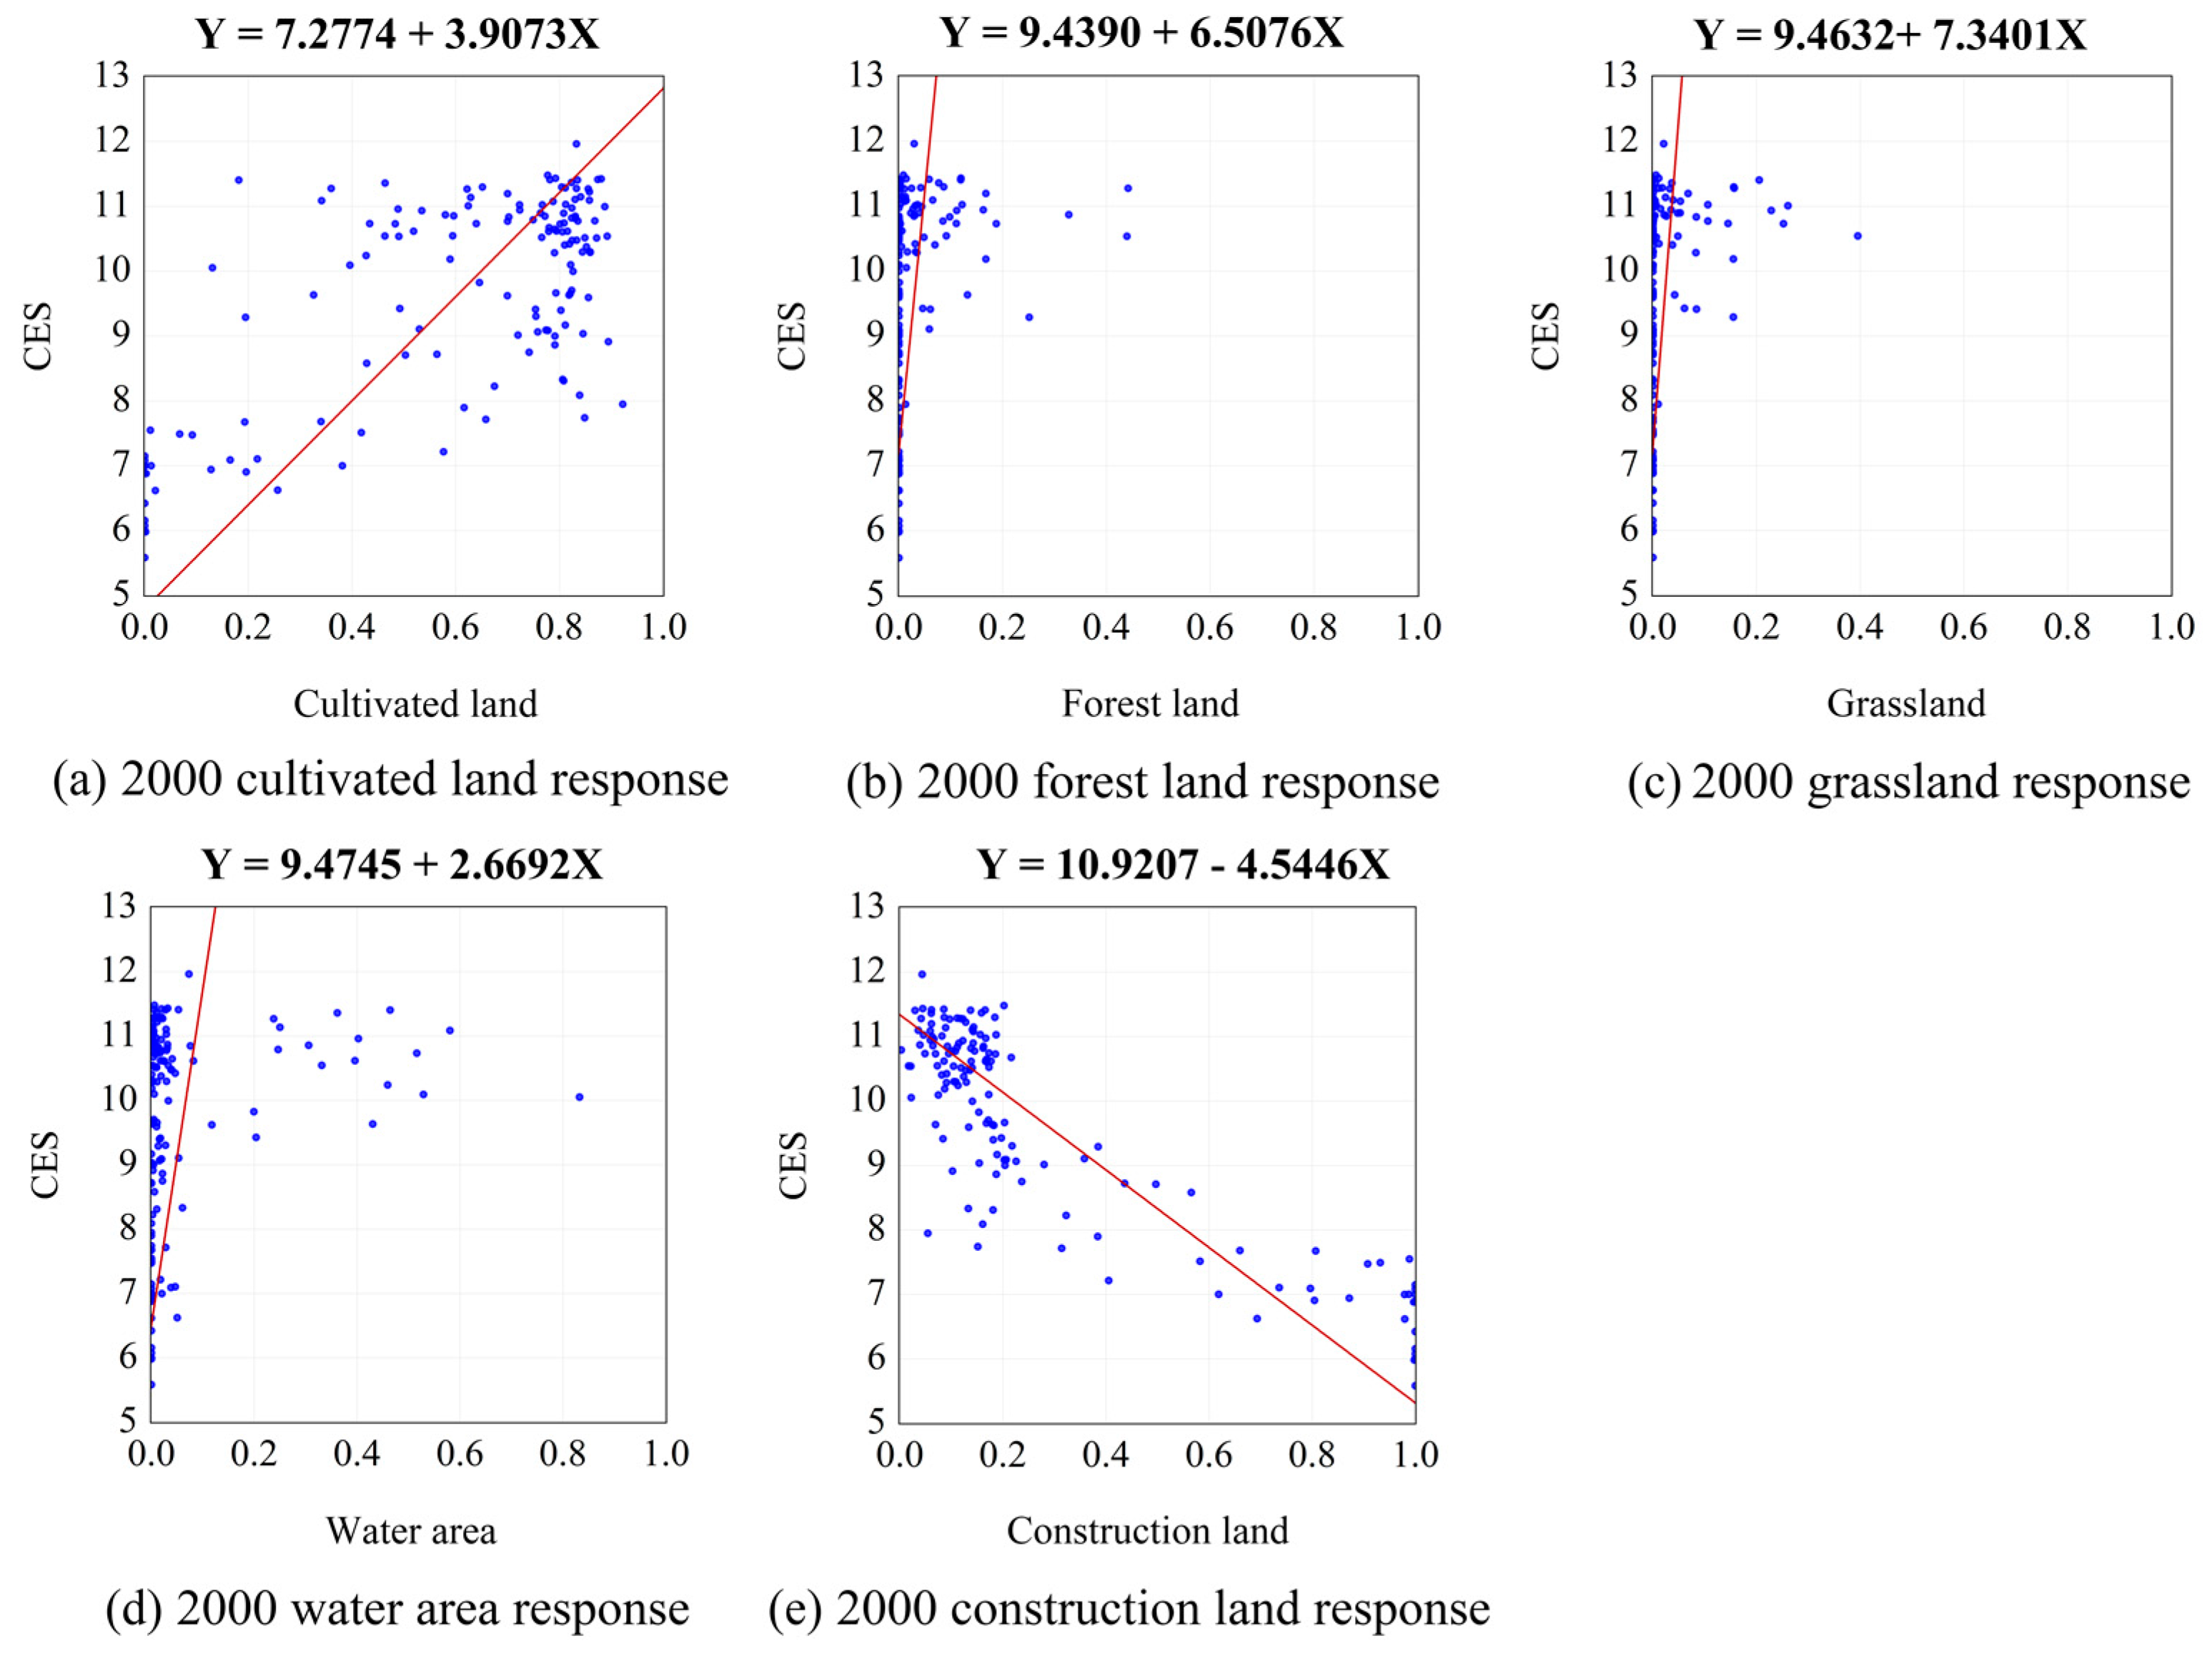
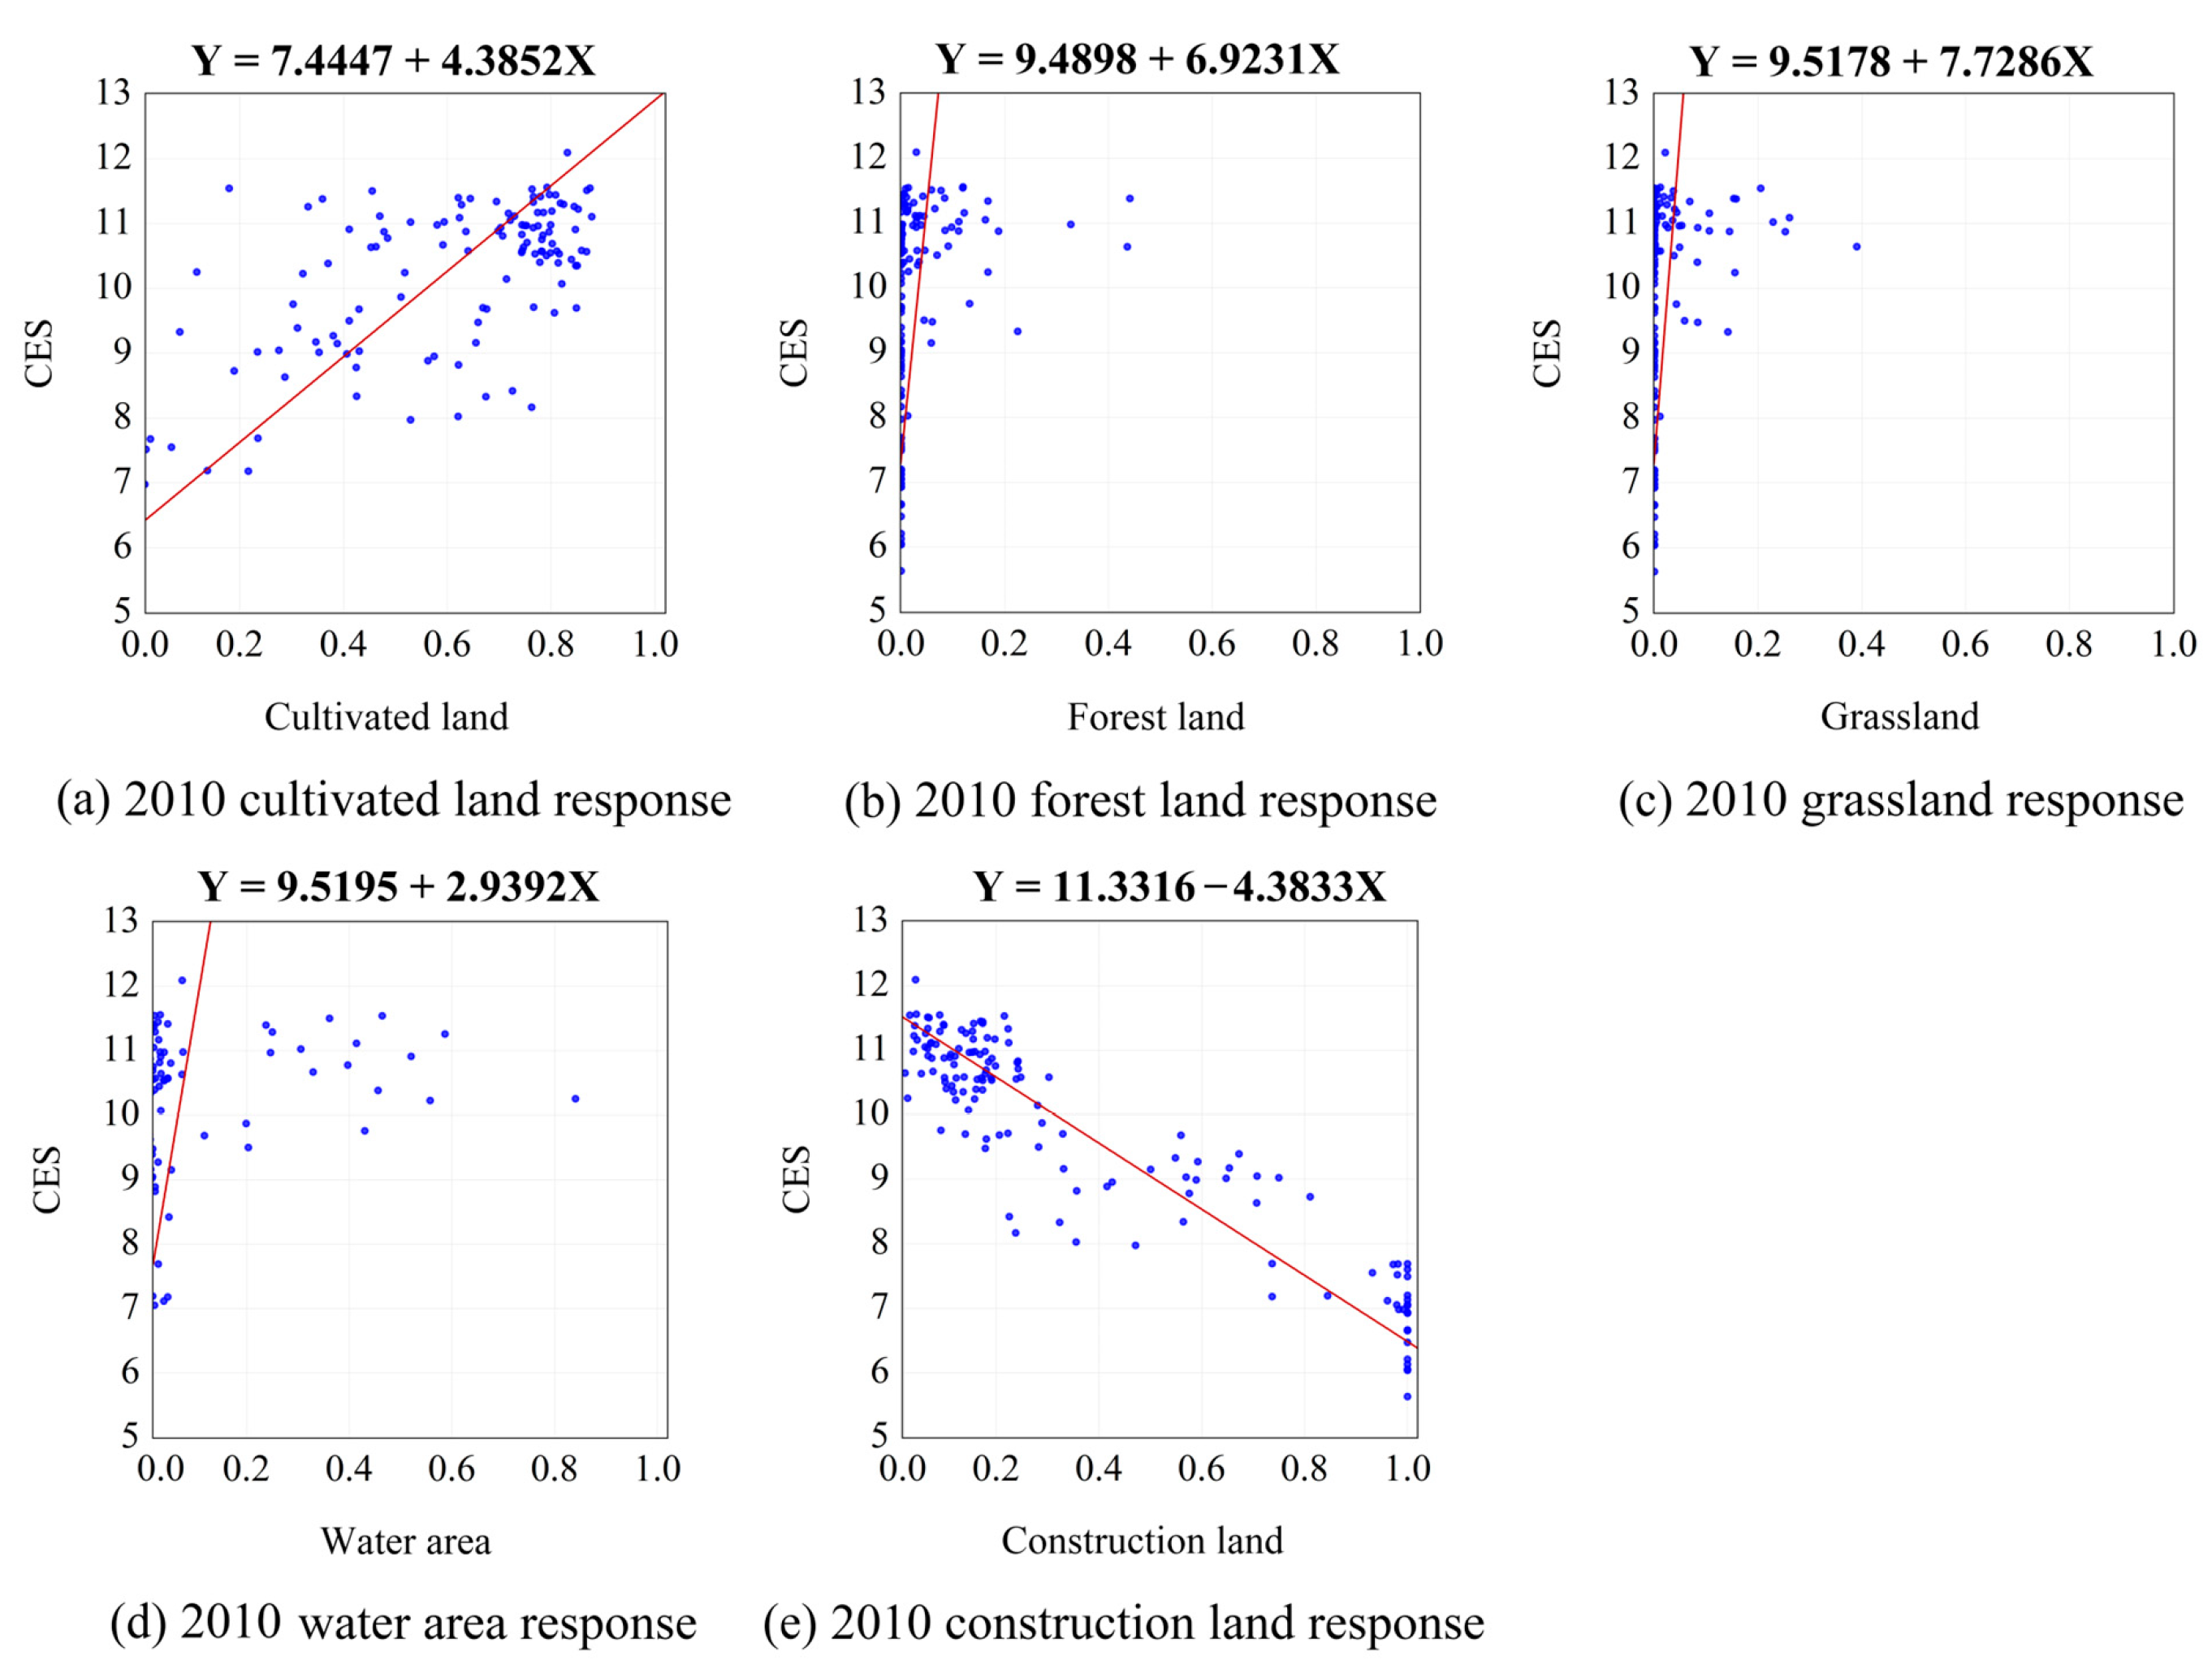
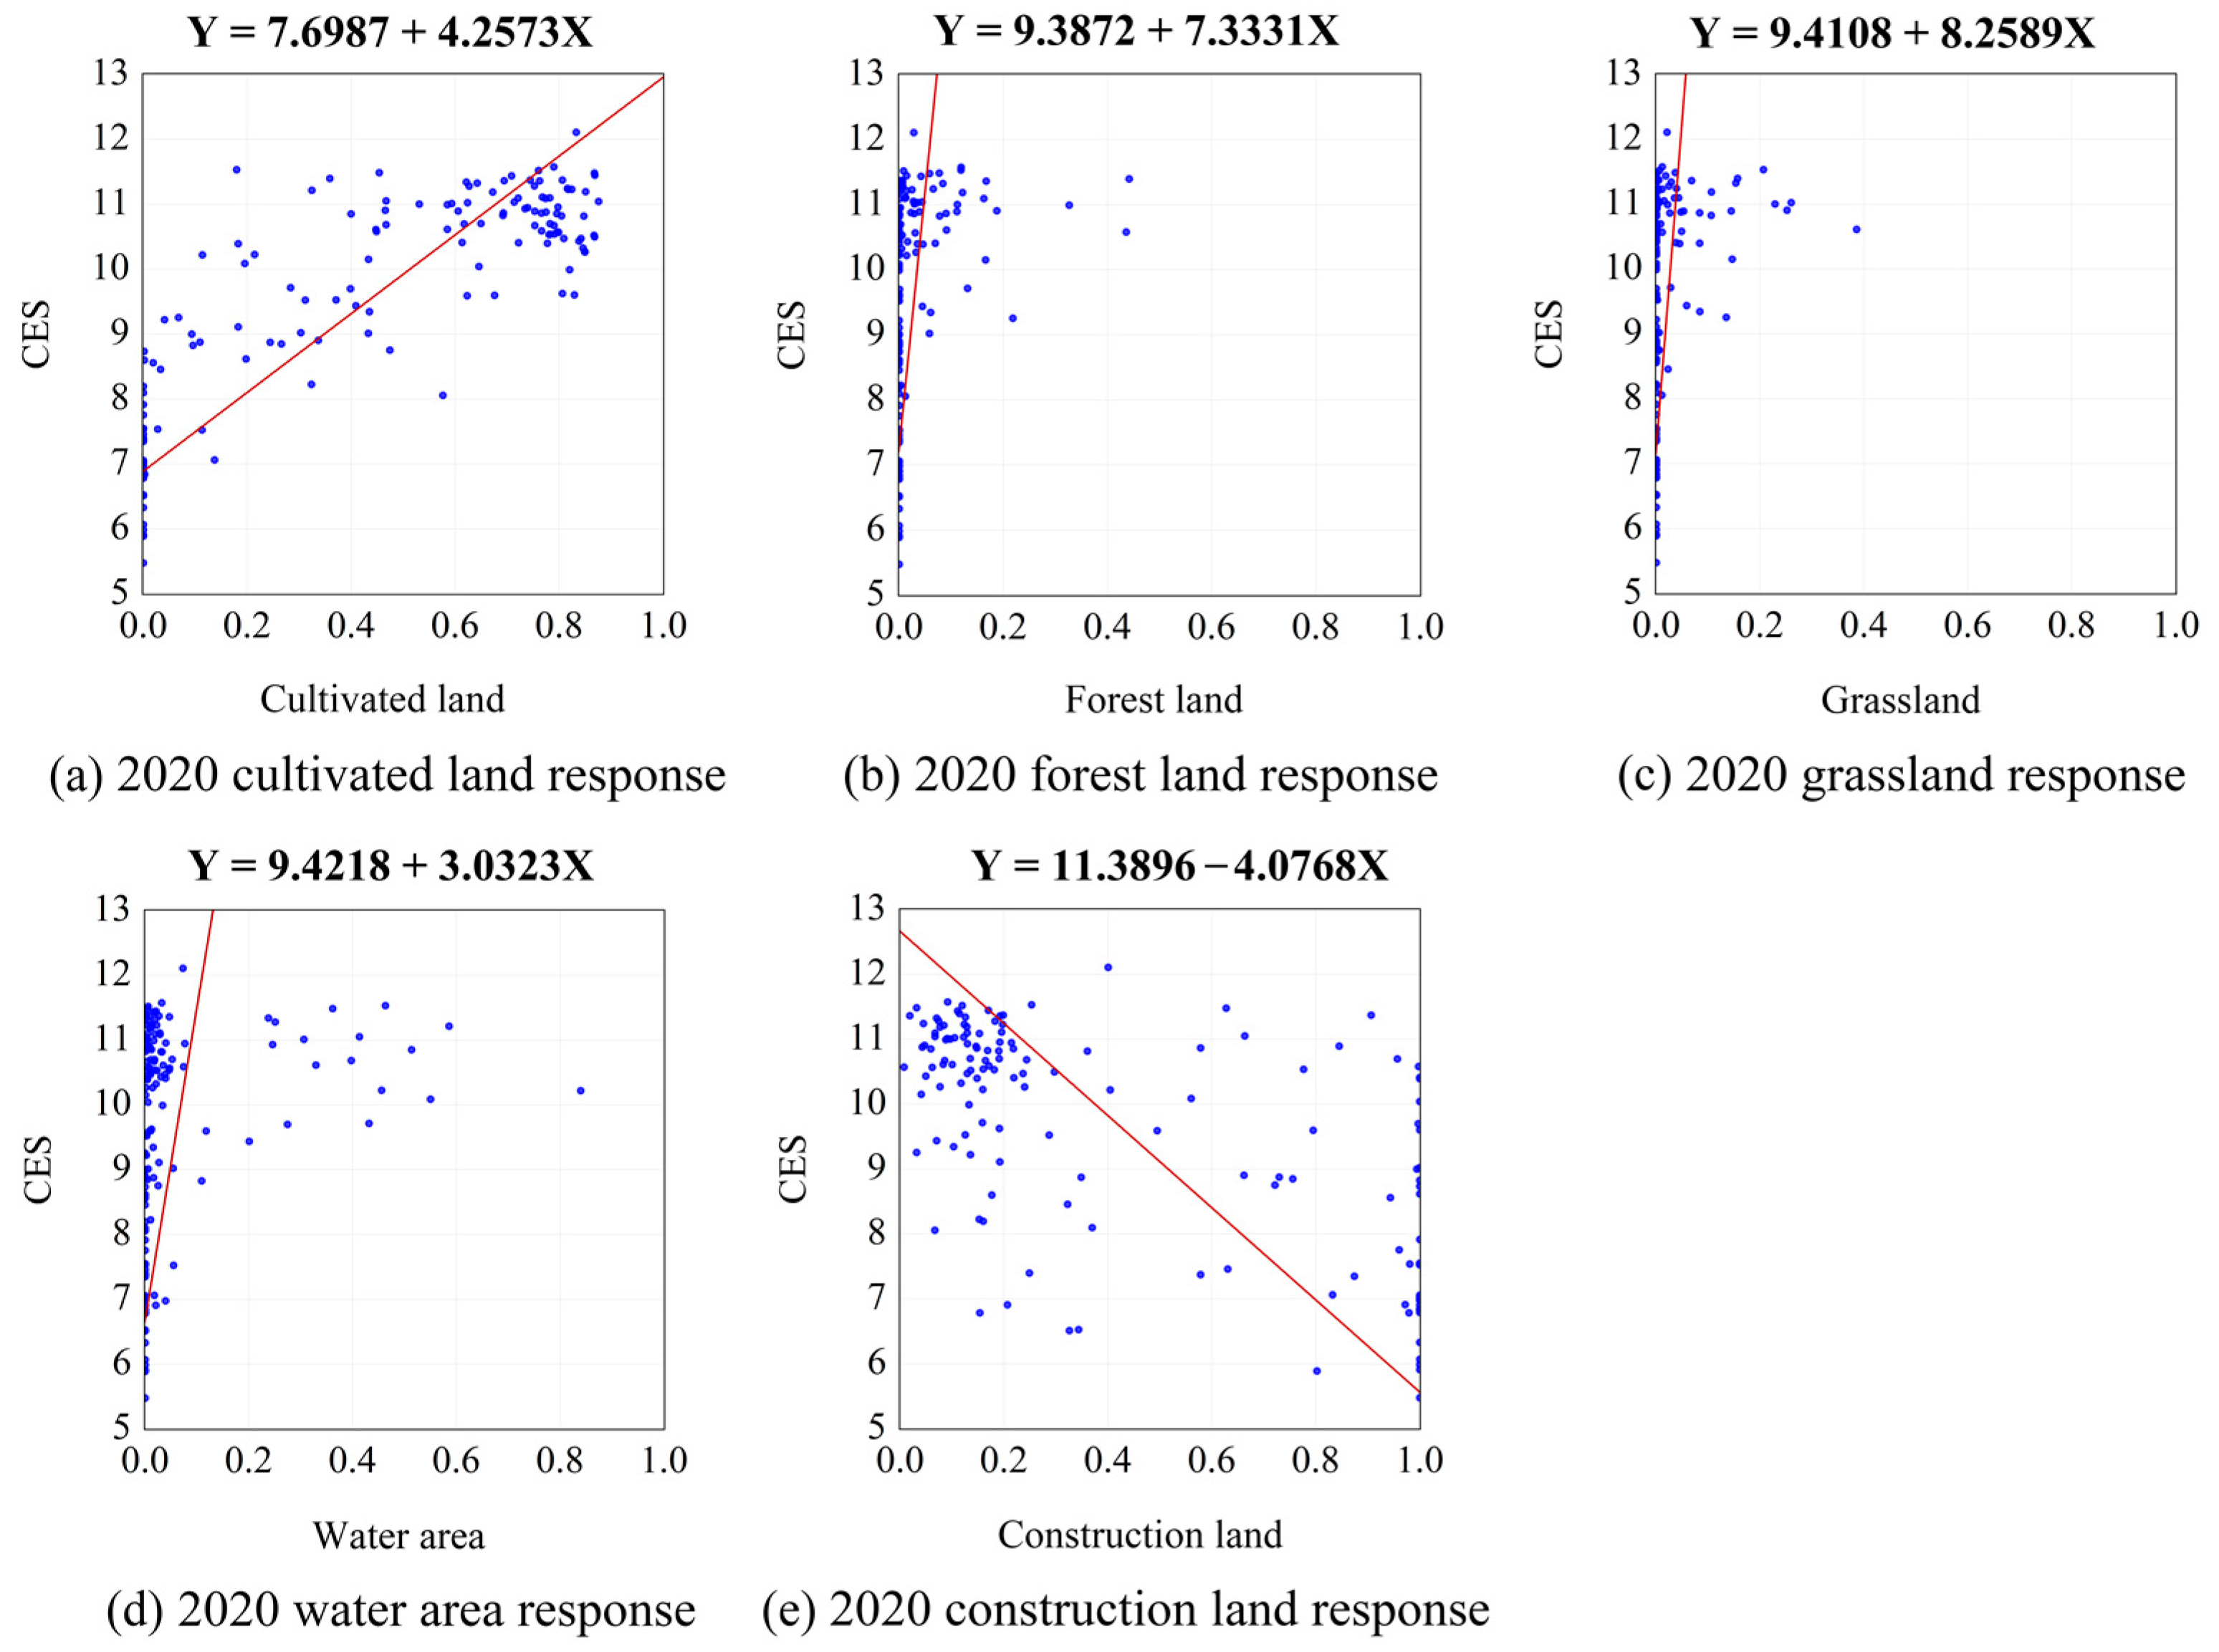
3.4. Ecosystem Services Response to Land-Use Change

3.4.1. Characteristics of Land-Use Quantity Evolution

Eviews 11 software was used to conduct the Granger causality analysis on the evolution of land-use spatial structure and ecosystem service value in Hefei City, and the Granger causality test was conducted on X and Y. After the calculation, the Pearson coefficients were all negative, the p-values were all less than 0.05. The results showed that X was the Granger cause of the change of Y at the 5% significant level, and the two were highly correlated, indicating that the land-use structure was the Granger cause of the change in the comprehensive ecosystem service index.

3.4.2. Linear Regression Analysis

The data pertaining to the distribution of various land types and the ecological service value of street units within the township were retrieved. The proportion of different land types in township units was denoted as X, while Y represented the CES value of each township unit. The linear regression analysis on the data mentioned above was performed using Eviews software, and the findings are presented in Figure 9, Figure 10 and Figure 11. The positive X coefficients for cultivated land, forest land, grassland, and water area are 4.18, 6.92, 7.78, and 2.88, respectively. The mean X coefficient for construction land is −4.33. Due to the limited extent of unused land, a comprehensive analysis has yet to be conducted. The partial regression coefficient X of grassland has the highest magnitude among the variables. Exemplifying the response equation of grassland in the year 2020, based on the calculation of Y = 9.4108 + 8.2589X, it can be inferred that a 1% augmentation in the proportion of grassland area will result in a 17.6697% rise in the value of ecosystem services. Hence, it is imperative to undertake endeavors aimed at transforming additional land into grassland, with the primary objective of safeguarding the existing grassland area, thereby enhancing the overall value of ecological services. The land type that exhibits a negative correlation is construction land. Using the response equation of construction land in 2020 as an illustration, we can calculate Y = 11.3896 − 4.0768 X. Assuming a 1% increase in the area of construction land, the value of ecosystem services will decrease by 7.3131%. This indicates that converting other land to construction land will result in a certain loss of value in terms of ecological services. Therefore, it is necessary to regulate the occupation of other land for construction purposes. The value of ecosystem services is positively correlated with cultivated land, forest land, grassland, and water areas. It is essential to promote the orderly development of these areas to prevent encroachment by other types of land. Conversely, construction land shows a negative correlation, so its expansion should be strictly controlled in order to further enhance the value of ecosystem services.

3.5. Analysis of the Dynamics of Spatial Heterogeneity of Ecosystem Services

A correlation study and significance test were conducted on the driving factors prior to the utilization of the geodetector. All factors demonstrated statistical significance in the results. The geodetector model objectively investigated the contribution rate of comprehensive ecological value and the interaction of factors, using ecological value as the dependent variable and the other ten index parameters as the independent variables.
The geodetector’s analysis reveals that both natural and societal factors exert a discernible impact on the regional variation of ecological service value in Hefei City. The driving elements ranked based on the explanatory power (q) statistic are as follows: percentage of ecological land area (0.4986) has a higher value than population density (0.4587), ≥10 °C accumulated temperature (0.4346), soil erosion (0.4337), precipitation (0.4154), elevation (0.3546), GDP per square kilometer (0.2952), road density (0.2676), slope (0.2435), and NDVI (0.2435). The study demonstrates that the ecological land area and population density have the greatest influence on spatial differentiation. In contrast, the impact of land-use structure on ecological value is particularly significant. Simultaneously, the q values of accumulated temperature, soil erosion, rainfall, and elevation of natural elements. Furthermore, the q values for GDP per square kilometer and road density are approximately 30%, suggesting that they have significantly contributed to the geographic variation in ecological values are also substantial, making them the primary determinants of ecological value. Ultimately, the q values for slope and NDVI in natural factors fall within the range of 20% to 30%, suggesting that they exert a discernible influence on the spatial variation of ecological parameters.
The investigation of the geodetector’s “interactive detection” reveals the presence of interactive relationships among the influencing elements. Based on the findings from Figure 12, the combined effect of two factors has a bigger impact on geographical differentiation than the individual effect of a single component. From the perspective of interaction types, two-factor enhancement and non-linear enhancement are mainly used. This indicates that the spatial differentiation of ecological value in Hefei is the result of the interaction between multiple factors, not caused by a single factor. Among these parameters, the interaction between natural elements is very significant. The ecological land area index ∩ soil erosion has the greatest value, with an explanatory power of 0.9411. The interplay between natural causes and social factors significantly impacts the regional variation of ecological values. Other factors with interaction degrees greater than 80% of the spatial variation include GDP per square kilometer ∩ percentage of ecological land (q-value of 0.8926), soil erosion ∩ population density (q-value of 0.8891), elevation ∩ population density (q-value of 0.8399), and road density ∩ percentage of ecological land (q-value of 0.8041). The degree of interaction of the remaining factors was below 80% but still had a large effect on the degree of spatial differentiation of ecological values.

3.6. Multi-Scenario Modeling Projections of Ecosystem Services

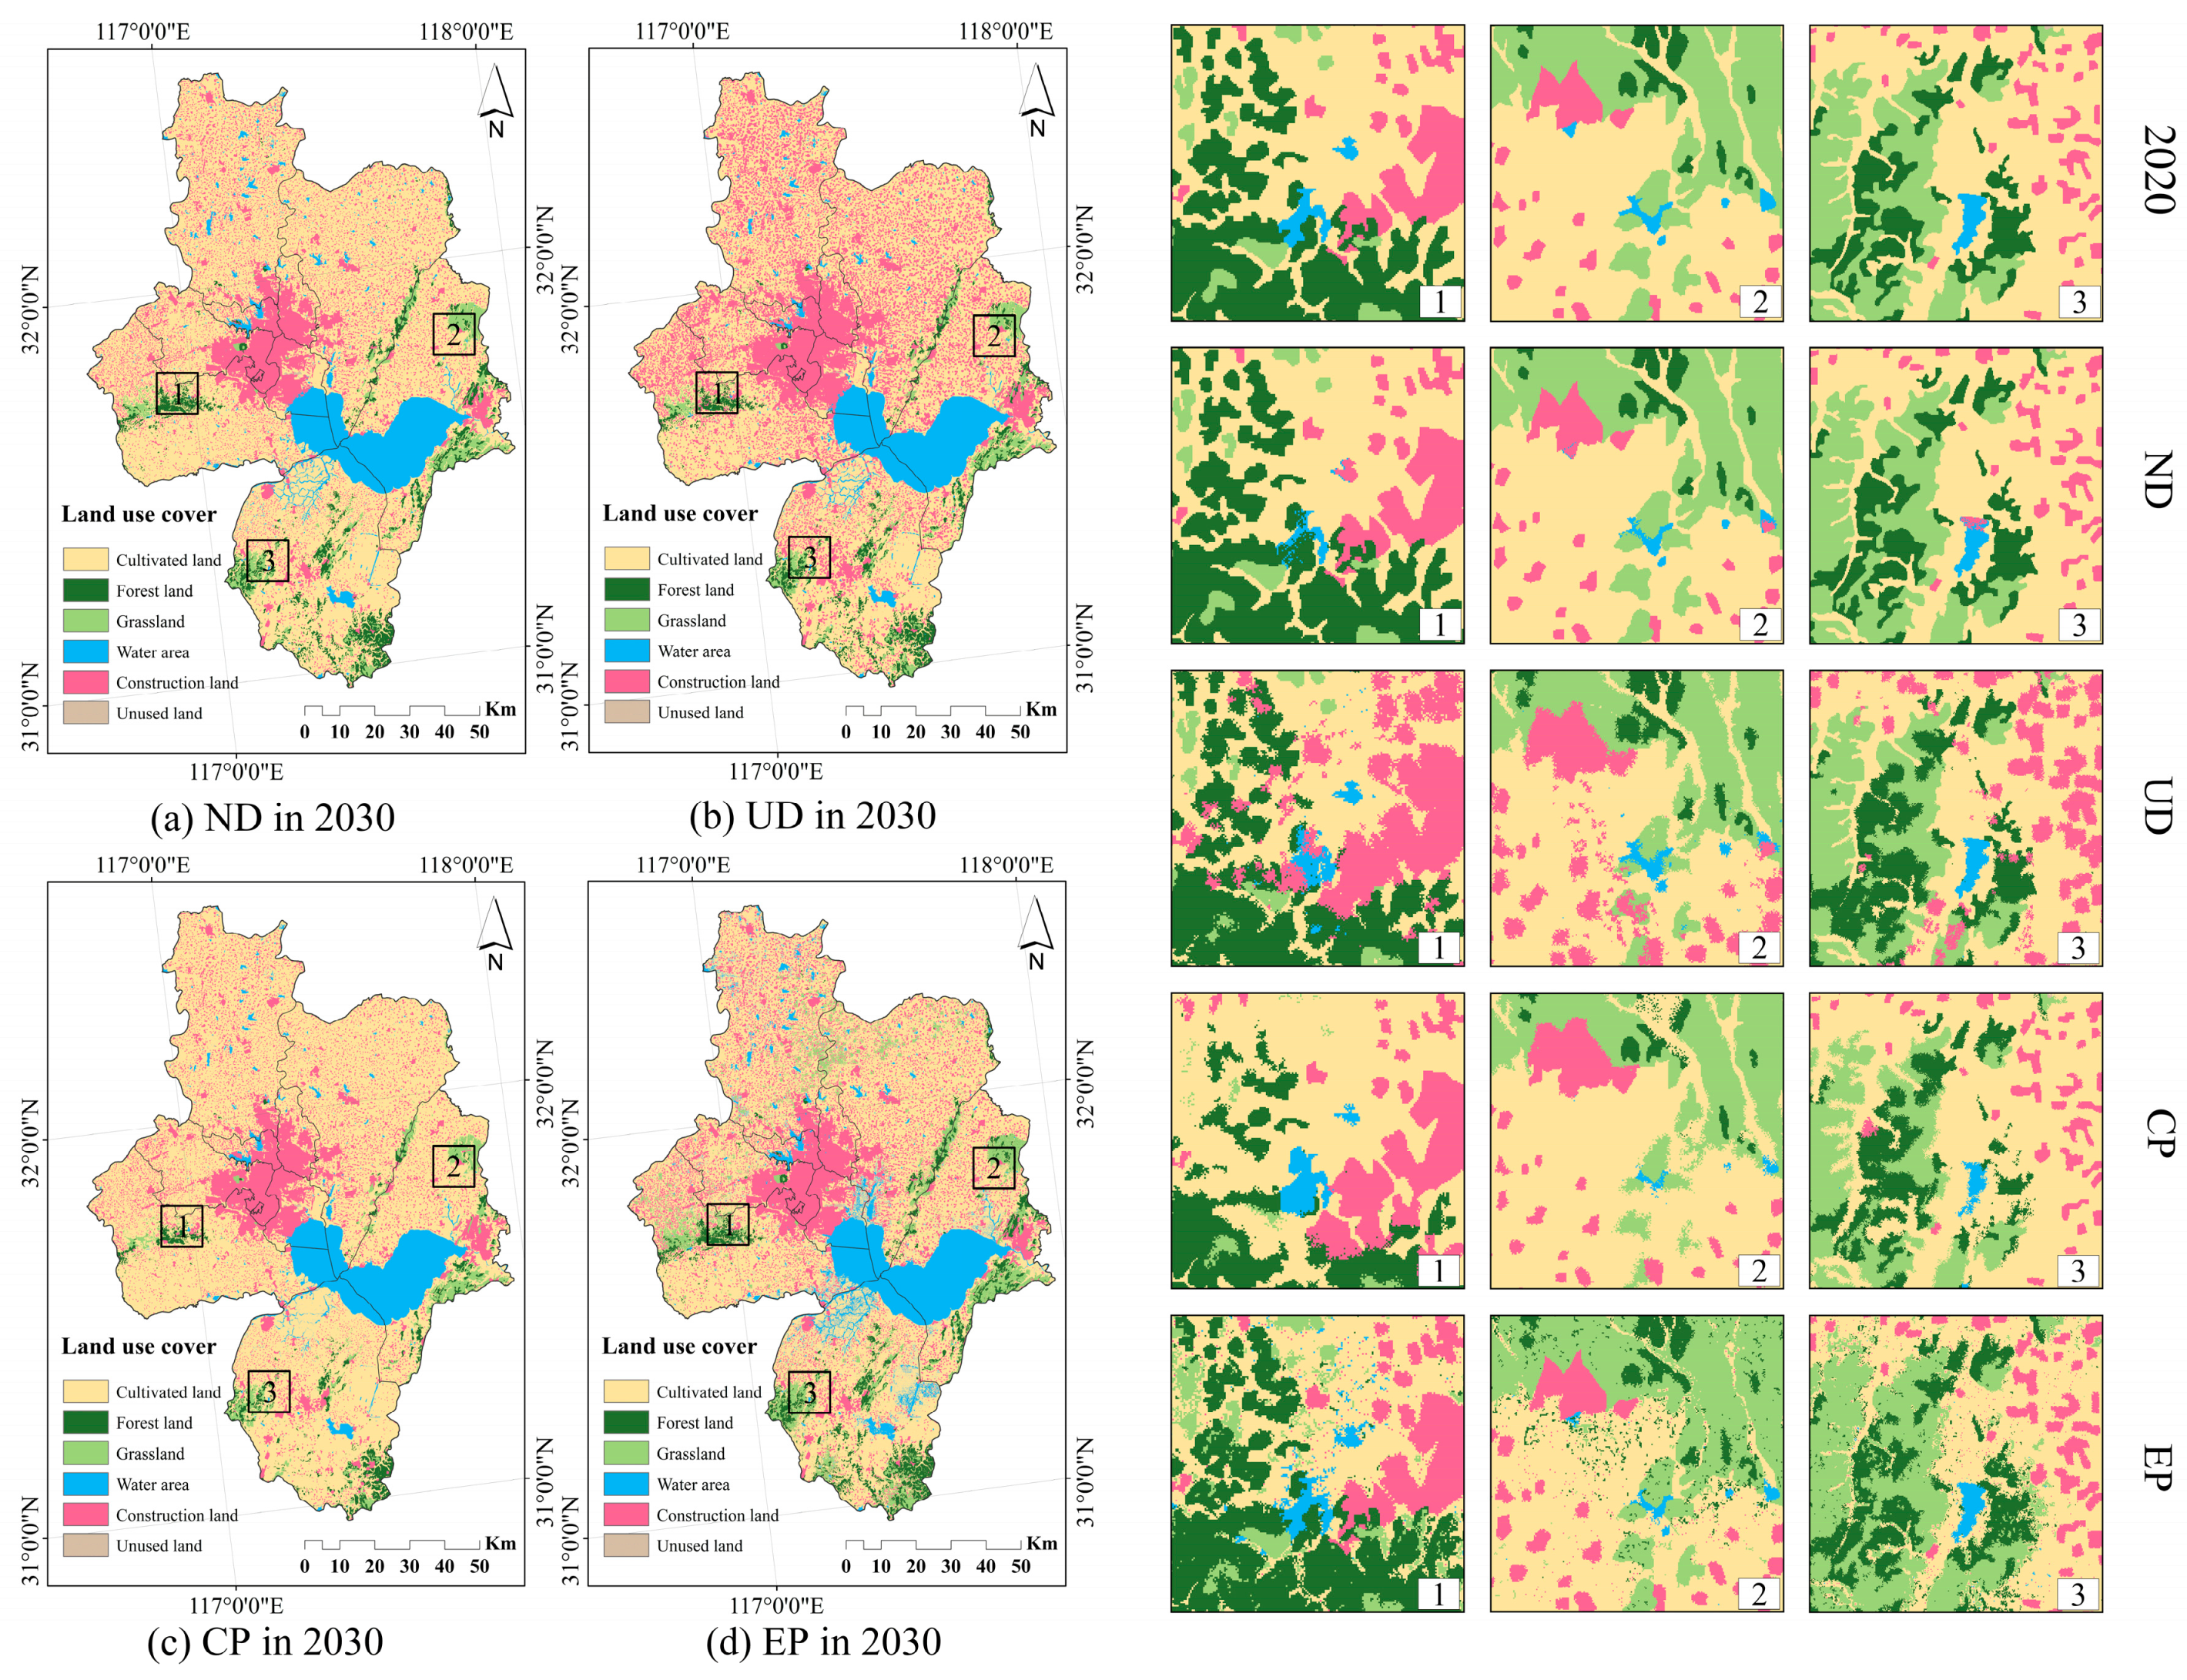
3.6.1. Characteristics of Projected Changes in Land Use

Figure 13 exhibits the land-use distribution maps for Hefei City in 2030, classified based on ND (natural development), UD (urban development), CP (cultivated land protection), and EP (ecological protection). The data show an increase in construction land, a little rise in forest land and grassland, and a decrease in cultivated land and water area under ND. Among the recorded alterations, there was a 49.49 km2 (0.43%) expansion in construction land, a 4.80 km2 (0.04%) reduction in forest land, and a 0.81 km2 (0.01%) decline in grasslands. In contrast, the amount of land suitable for cultivated land decreased by 8.89 km2, representing a decline of 0.08%. The water area had a loss of 46.34 km2, which corresponds to a reduction of 0.40%. The UD scenario has led to a significant decrease in the extent of cultivated land, forest land, grassland, and water area. The most significant decline is found in the extent of cultivated land, which totals 1133.58 km2 (9.88%). The forest land, grassland, and water area have decreased by 48.07 km2 (0.42%), 31.58 km2 (0.28%), and 107.51 km2 (0.94%), respectively. The land area designated for construction witnessed a significant growth, increasing from 2025.14 km2 in 2020 to 3348.24 km2. Among all the land categories, this was the sole category that exhibited growth in this specific scenario. In the context of CP, there has been a significant increase in the amount of land used for cultivated land and construction land. Specifically, cultivated land has expanded by 393.39 km2 (3.43%), and construction land has increased by 26.68 km2 (0.23%). In contrast, there is a significant decrease in the amount of forest land, grassland, and water areas, with corresponding decreases of 210.07 km2 (1.83%), 72.98 km2 (0.64%), and 134.86 km2 (1.18%). In the context of EP, there is a significant decrease in cultivated land, while other types of land see differing degrees of growth. The data indicate a significant reduction in the amount of cultivated land by 973.00 km2, which corresponds to a decrease of 8.48%. In contrast, there was a notable rise in the extent of construction land and grassland, with an increase of 382.15 km2 (3.33%) and 324.43 km2 (2.83%), respectively. In addition, there was a rise in the extent of forest land and water areas, amounting to 86.93 km2 (0.76%) and 175.83 km2 (1.53%). The changes in unused land were minimal and were not analyzed in any of the four scenarios.

3.6.2. Multi-Scenario Modeling Analysis of Temporal Evolution of Ecosystem Services

Using the PLUS model, four scenarios were created to predict the quantitative changes in ecosystem services in Hefei City by 2030. The presented scenarios are in Table 5. According to the findings, in the ND scenario, the average water yield had the highest increase, rising from 1468.32 mm in 2020 to 1478.05 mm in 2030, representing a growth rate of 0.66%. The carbon storage likewise exhibited a rising pattern, with a growth rate of 0.36%. The mean habitat quality declined from 0.4280 in 2020 to 0.4029 in 2030, representing a decrease of 5.87%. The soil conservation exhibited a reduction, with a decline rate of 0.06%.
In the context of UD, the most notable rate of transformation is the augmentation in water yield. In this specific scenario, the increase is more than in the other three scenarios. It goes up from 1468.32 mm in 2020 to 1492.61 mm in 2030, showing a growth rate of 1.65%. The habitat quality has undergone a substantial decrease, decreasing from 0.4280 in 2020 to 0.3471, resulting in a reduction rate of 18.89%. The reduction rate in this scenario is the highest compared to the other three situations. Unlike the typical scenario of ND, there is a slight decrease in carbon storage, with a decline of 1.64%, and a slight improvement in soil conservation, with a growth rate of 0.53%.
In the context of CP, the growth rate of carbon storage is higher than that of water yield and soil conservation in terms of change rate. This makes carbon storage the highest growth rate in this scenario. The mean carbon storage rose from 7.19 t in 2020 to 7.29 t, exhibiting a growth rate of 1.28%, which is also the highest growth rate among the four scenarios. Water yield and soil conservation exhibited different magnitudes of increase, with growth rates of 0.84% and 0.12%, respectively. The only indicator that indicates a decreasing tendency in this situation is the habitat quality, which has an average value of 0.3754 and has experienced a 12.28% decline compared to 2020.
In the context of EP, there is a significant and consistent increase observed in both carbon storage and soil conservation, which closely corresponds to the current circumstances. There was a significant decrease in the amount of water yield, which was strongly linked to the type of land use and the amount of vegetation covering the area. Moreover, a significant association was observed between the amount of water yield and the extent of plant growth in areas with forested vegetation and steep inclines. The mean habitat quality value was 0.4396, which was the highest among the mean values of the four scenarios. The value experienced a growth rate of 2.70% in comparison to the preceding year, 2020. Furthermore, it was the sole scenario that had a consistently increasing trajectory. Improving the habitat quality is a key factor in changing the value of ecological services in the context of ecological conservation. The carbon storage rate has increased by 0.88%, making it the main factor influencing the fluctuation in the value of ecosystem services. Soil conservation, while exhibiting a positive trajectory, demonstrates a relatively modest average growth rate of approximately 0.46%, rendering it comparatively less relevant when compared to the other three indicators.

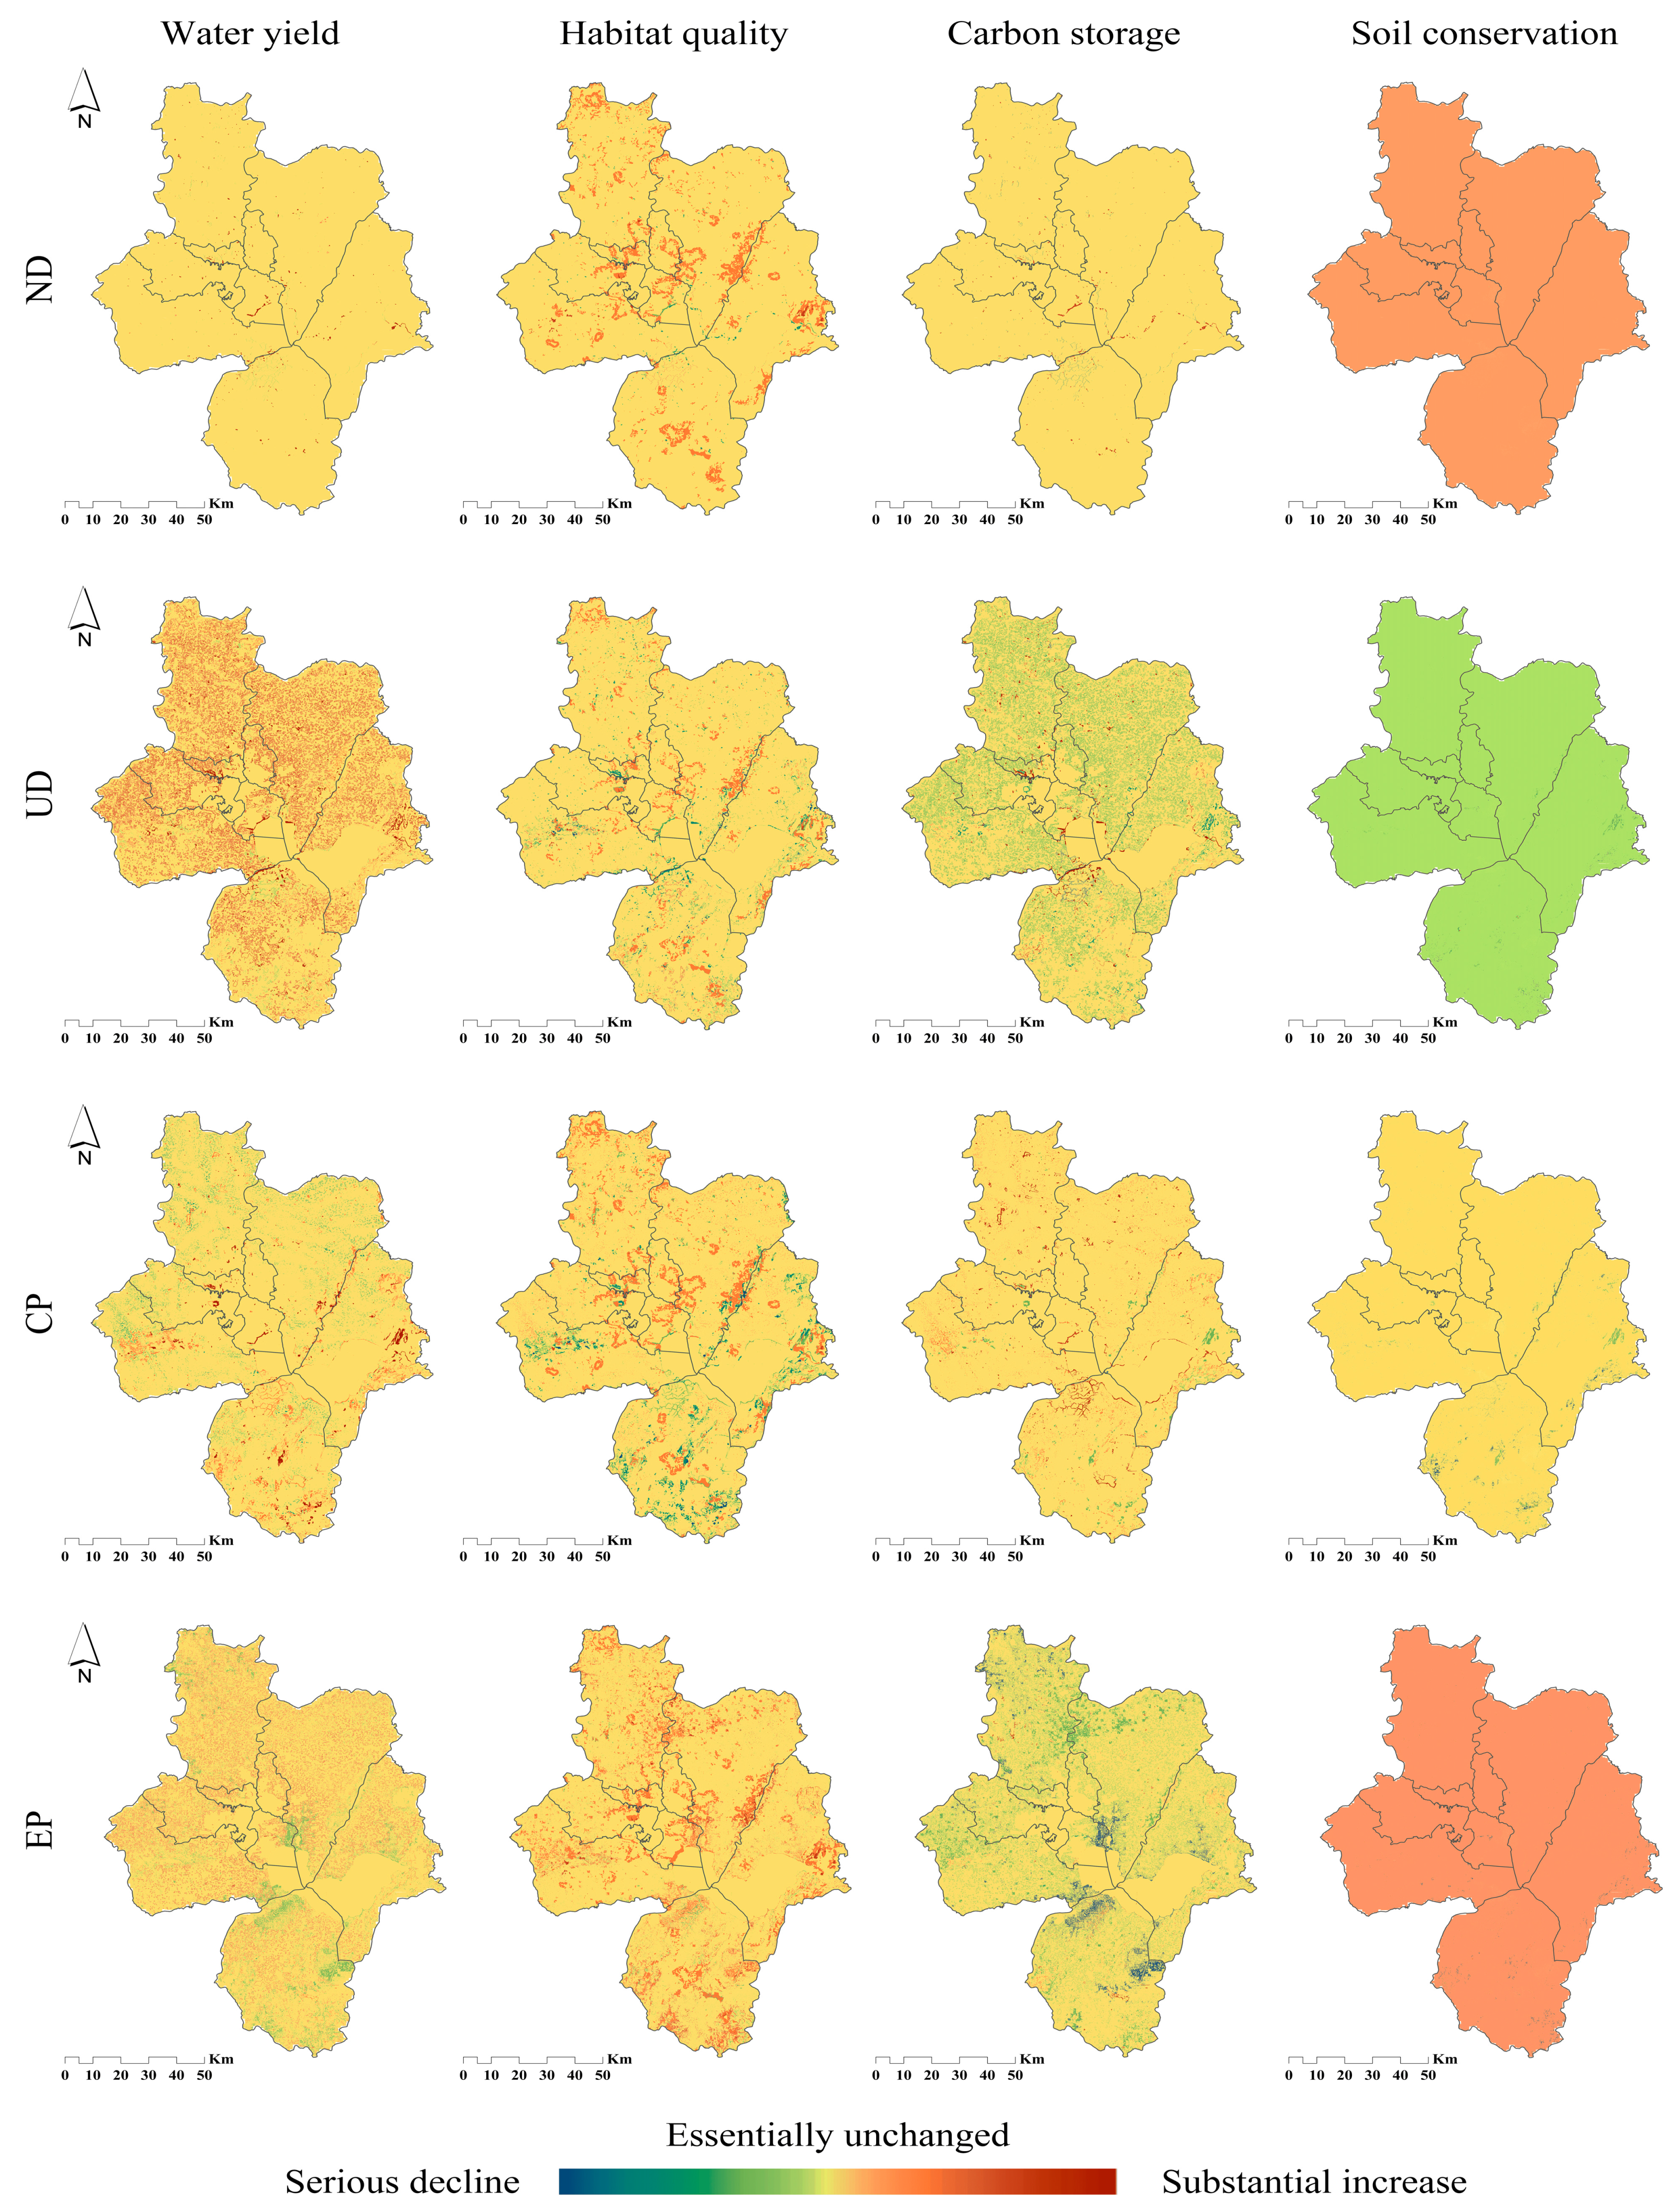
3.6.3. Multi-Scenario Modeling Analysis of the Spatial Distribution of Changes in Ecosystem Services

The spatial alterations of each ecological indicator under different circumstances were more clearly shown by rasterizing the distribution maps of each indicator in the two periods before and after. The change values were categorized into seven groups using the natural breakpoint approach to examine the changes in each ecological indicator. The results are displayed in Figure 14.
In the context of ND, there is no significant change in water yield and carbon storage as a whole. Nevertheless, there is a significant increase in some areas along the northwestern coast of Chaohu Lake. Furthermore, there is a significant general rise in soil conservation. The spatial discrepancy in changes to habitat quality is clearly visible, with a concentration of small improvements near the core city and different degrees of augmentation in the surrounding mountainous areas. The northwestern shore of Chaohu Lake exhibits mild and moderate decline due to its predominant conversion into construction land, which is more pronouncedly impacted by human development activities.
In the context of UD, there is a noticeable upward trajectory in water yield throughout many regions, with the exception of mountainous areas. However, the Chaohu region and the central metropolitan area exhibit minimal alterations in water yield. Newly constructed land surrounding the center metropolitan region, which has a high certain amount of of impervious surfaces and low evapotranspiration, makes up the majority of the areas with increasing water production. The mountainous area’s land surface is mostly covered in forests, with high tree evapotranspiration and low water yield as a result of deforestation and farmland reclamation. The original cultivated land, forest land, and grassland are being encroached upon by urban and rural settlement growth, which is seriously compromising soil conservation and carbon storage.
Under the CP scenario, the spatial distribution of ecological indicators was similar to that under the natural development scenario. In this scenario, the areas with increased water yield coincided with the areas with decreased habitat quality. The water yield increased significantly in the mountainous region, where the original land-use type was forest land but changed to cultivated land under this scenario. The forest land has not been disturbed by frequent human activities, the soil structure is relatively compact, and the water permeability is low. Compared with forest land, cultivated land operation is beneficial to soil porosity and, thus, increases water production. The region’s declining habitat quality suggests that forest land is crucial to preserving habitat quality. The total amount of carbon storage rose when compared to the ND scenario, but it decreased in the areas mentioned above. This suggests that forest land has a higher capacity to sequester carbon than cultivated land and that it contributes more to carbon storage overall. Soil conservation capacity improved overall when compared to the ND and UD scenarios, but it also did not manifest any clear geographical heterogeneity.
In the context of EP, there is a general reduction in water yield and a general improvement in the quality of habitats and soil conservation. The areas in this scenario that see a decrease in water yield are similar to the regions that see an increase in water yield in the UD scenario. This finding suggests that land use and human activity have a significant impact on water yield. The amount of improved habitat quality increases, mostly in areas that have been converted from cultivable land to grassland and forest land. The change of cultivated land to grassland and grassland to forest land resulted in a significant increase in the amount of carbon storage in the northern plains and mountains. This suggests that the adoption of ecological initiatives, including converting farmed land back to grassland and forest, significantly influenced the rise in carbon storage. In some areas, the conversion of cultivated and grassland land to water areas has resulted in a little decrease in carbon storage, indicating that the amount of carbon stored in water is lower than that in cultivated and grassland land. This development scenario is the most favorable for soil conservation since it shows a significant improvement in soil conservation capabilities over the other three scenarios.

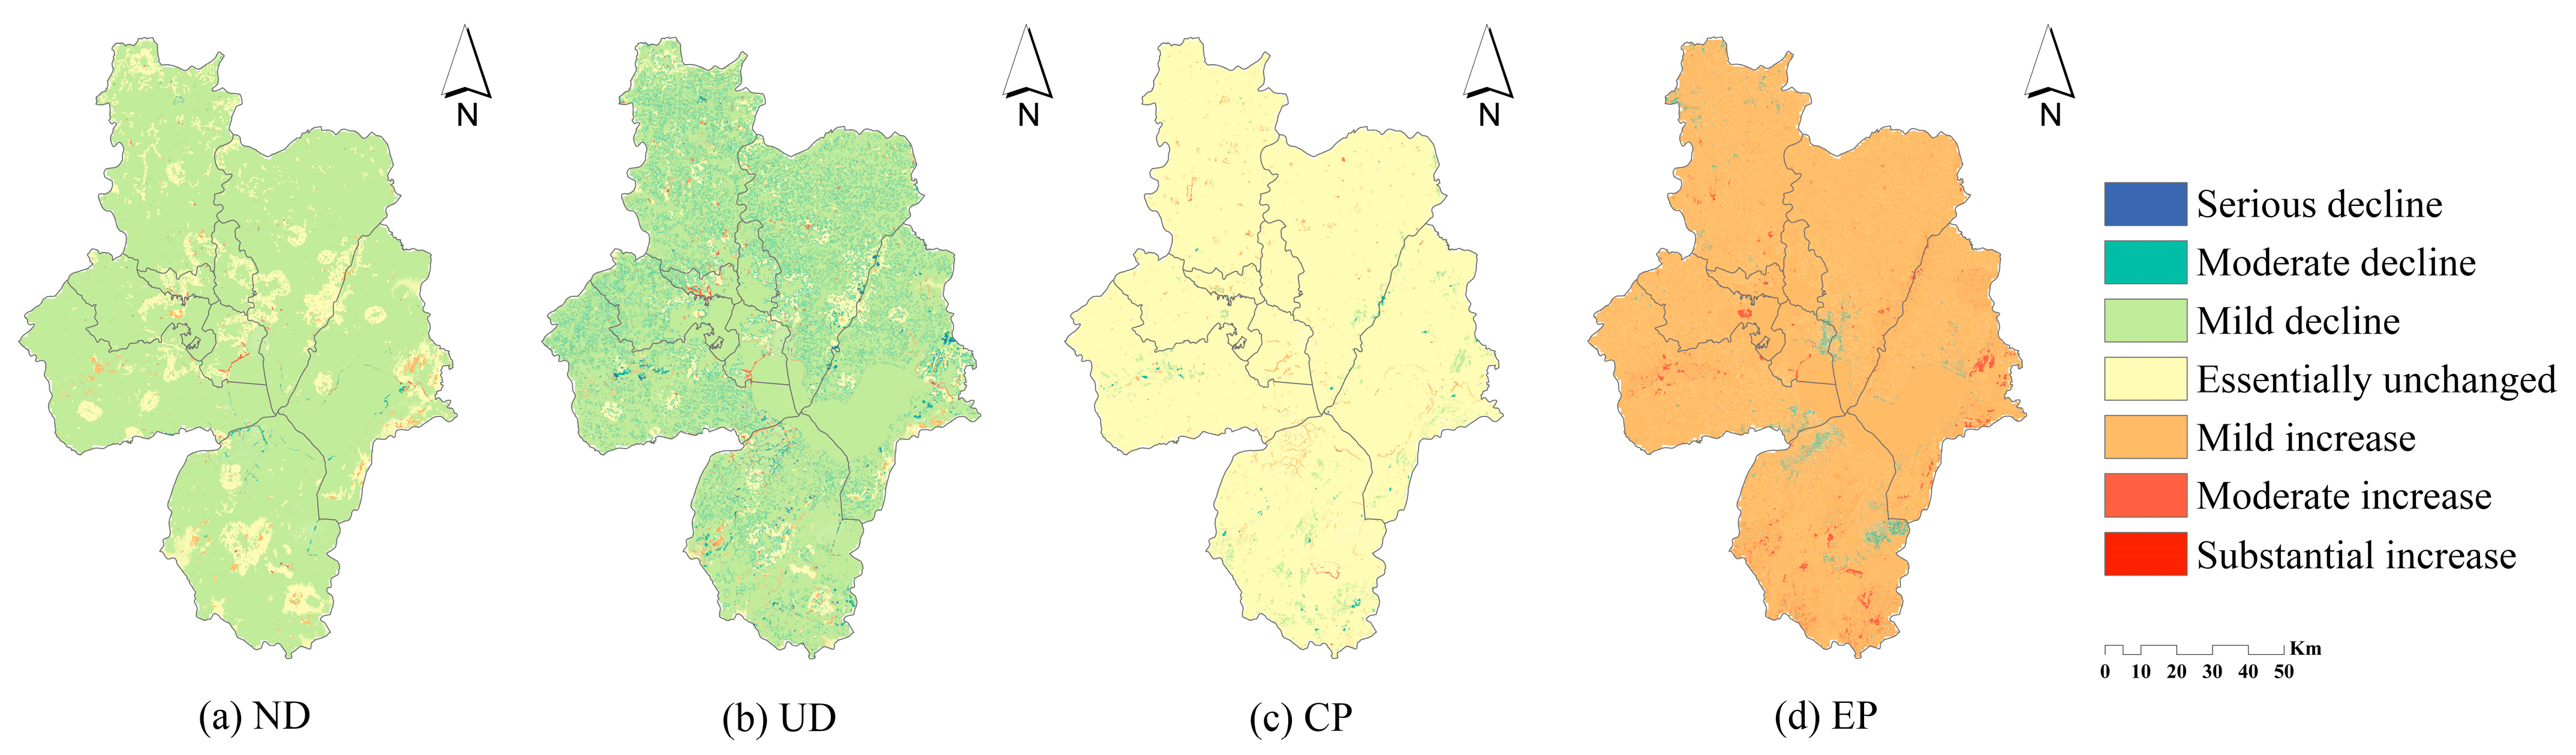
3.6.4. Spatial and Temporal Variation in the Composite Index of Ecosystem Services

The general state of the ecosystem services provision can be inferred from the average value of CES. In Hefei City, the average CES value in 2020 was 0.3984. The only scenario in which the average value of CES decreases is the UD scenario, where it is 0.3893 (a loss of 2.28%). In the case of the ND and CP scenarios, the average CES value increased by 4.62 percent and 0.4026 percent, respectively, with a smaller change; in the case of the EP scenario, the average CES value increased by 7.51%, indicating a significant increase in the overall level of ecosystem services.
In order to more specifically reflect the performance of each land-use type under different scenarios, the change chart of CES under the four scenarios and the land-use type in 2020 are superimposed and analyzed, and the results are shown in Table 6. Under the ND scenario, 99.88% of the construction land showed a mild decline in CES, followed by 83.28% of the cultivated land showed a mild decline. In the UD scenario, the proportion of mild decline of construction land is still the largest, except water area; the proportion of serious decline and moderate decline of other land in the urban development scenario is significantly increased. Under the CP scenario, the CES index of 99.93% of cultivated land was basically unchanged, which was an overall increase compared with the previous two scenarios. Under the ecological development scenario, the change degree of CES in various places has significantly increased. The area in the mild increase raised by about 90%, and the proportion of moderate increase has also increased.
The spatial heterogeneity and degree of change of the CES varies under different in-development scenarios (Figure 15), with a mild decline in the CES as a whole under the natural development scenario, essentially unchanged at the urban fringes of the central city and the surrounding districts and counties, and a mild increase in the hilly and mountainous areas. The UD scenario exhibits the largest area and breadth of CES reduction, and the geographical distribution pattern of change bears similarities to the ND scenario. This suggests that the current development pattern of Hefei City is more in line with the UD scenario. The overall CES under the CP scenario is essentially unchanged, with some areas experiencing a mild decline in CES in the shift from forest land and grassland to cultivated land and a substantial increase in CES in areas shifted from other land to water area. The EP scenario shows a substantial increase in the level of the CES index, with the overall performance showing a mild increase, with the mountainous hills showing a significant contiguous increase, and only a small portion of the water area experiencing a serious decrease in the index. The EP scenario changes the trend of decreasing forest land and grassland areas in the ND scenario, making the CES index better in the EP scenario than in the other three development scenarios.

4. Discussion

This study coupled the PLUS-InVEST model to construct a comprehensive ecosystem service index CES to measure the value of ecosystem services and explore the response of ecosystem services to land use/cover change. This paper examines the research innovations and contributions, policy recommendations, limitations, and weaknesses based on the analysis of the findings as mentioned above.
The CES index, which is made up of multiple ecosystem service indicators, has more explanatory power for the number of ecosystem services in the study area and strengthens the scientific validity of the study’s conclusions. This study overcomes the drawback of using a single ecosystem service indicator. In order to determine how much each land category contributes to the value of ecosystem services in the study area, the CES index of each township unit was regressed against the area share of that land category. The results show how ecosystem services respond to changes in land use and cover. The PLUS model is used to predict and analyze land use under individual scenarios, to develop a more realistic future land-use pattern, and to measure fluctuations and spatial changes in the values and rates of change of ecological indicators under different scenarios. The CES index gain/loss and changes in spatial distribution values of multiple land types under different scenarios were calculated. Then, planning strategies to improve ecosystem services were proposed from the perspective of optimizing land-use structure.
When creating suitable solutions, decision-makers must consider aspects such as socioeconomic development and natural ecological conditions. Hefei, being a secondary hub in the Yangtze River Delta urban cluster, has undergone significant alterations in its biological surroundings due to rapid urbanization over the years. In terms of policy implications, we, therefore, make two recommendations: (1) According to the result of the negative correlation between construction land and ecosystem service value in the linear regression and the requirements of the planning content of the Hefei City Territorial Spatial Master Plan (2021–2035), it is necessary to finely adjust the land-use structure and optimise the allocation of resources. Adjustment of the construction land structure within the built-up area of Hefei City, especially within the central urban area. Under the premise of ensuring sufficient space for urban development, the industrial layout will be optimized through reasonable land replacement or adjustment, the area of green space will be increased, and the local ecological environment will be improved. (2) According to the result, the proportion of ecological land has an important influence on the spatial differentiation of ecological service values; blue-green space has an important role in ecosystems for providing provisioning services, regulating and supporting services, and cultural services. Based on Hefei City’s urban green space structure of “three rings and three wedges”, the interconnection of the urban green space system will be realized. We must strengthen the connectivity of the water system within the wedge-shaped green space, build ecological corridors, enhance the ecological function of the green wedge, and improve the role of the urban green wedge as an ecological barrier.
The coupled PLUS-InVEST model addresses the limitations of using a single model and leverages the strengths of both models in terms of quantitative prediction and spatial distribution. It optimizes land use and ecosystem service prediction, thereby enhancing the accuracy of future land-use patterns to some degree. Nevertheless, shortcomings persist, as follows: (1) This research focuses on simulating the process of exploiting future land use by specifically selecting the land use in 2020. This paper utilizes the 2020 land-use data, along with climate, population, and economic statistics from corresponding years, to simulate future land usage. While the model’s accuracy has been evaluated, the primary determinant of the forecast results is not the data from the current year, which could influence the outcomes. (2) The evolution and spatial distribution of ecosystems are intricate and influenced by intense human activities and severe climate change. Consequently, the process of ecosystem degradation and the underlying driving mechanisms are becoming increasingly complex. The driving factors chosen in this study need to be revised in replicating the process of ecosystem change. Further investigation is required to understand the response mechanism and relationship between ecosystem services and land-use change. In the future, by expanding the refined database and utilizing geographic information rasterization, we will be able to provide more comprehensive and precise data support for research. This will help to prevent the homogenization of results caused by data errors and enhance the accuracy of research findings. At the same time, land-use change is also affected by social economy and policy. In the ‘National Territorial Space Planning Outline (2021–2035)’, it is proposed to make good use of the results of the ‘three zones and three lines’ and strengthen and standardize the management of urban development boundaries in the development, protection, and utilization of territorial space. Future research needs to be combined with land-use prediction and land space development requirements, which will further improve the reliability and scientificity of research. Across the globe, the urbanization trend of today is unstoppable. Under the background of rapid land use change, construction land encroaches on cultivated land and ecological land represented by grassland and forest land, which poses a serious threat to food security and ecological security. This is the most common land conflict issue that many cities worldwide are dealing with. The CES index applied in this work offers a more thorough explanation of ecosystem service conditions and makes future LUCC planning easier to understand. The study’s findings are supported by science. In terms of land use and ecosystem service function planning, it can provide a reference for many fast-growing cities, especially more cities in developing countries.

5. Conclusions

Based on the current situation of land-use change and ecosystem services in Hefei from 2000 to 2020, this study used the InVEST model to evaluate the ecosystem services in the study area. An analysis was conducted on the dynamic process of land-use change using spatial autocorrelation, linear regression, and geographic detector. The PLUS model was used for multi-scenario simulation to predict the spatial pattern of ecosystem services in the study area in 2030. The main conclusions are as follows:
(1)
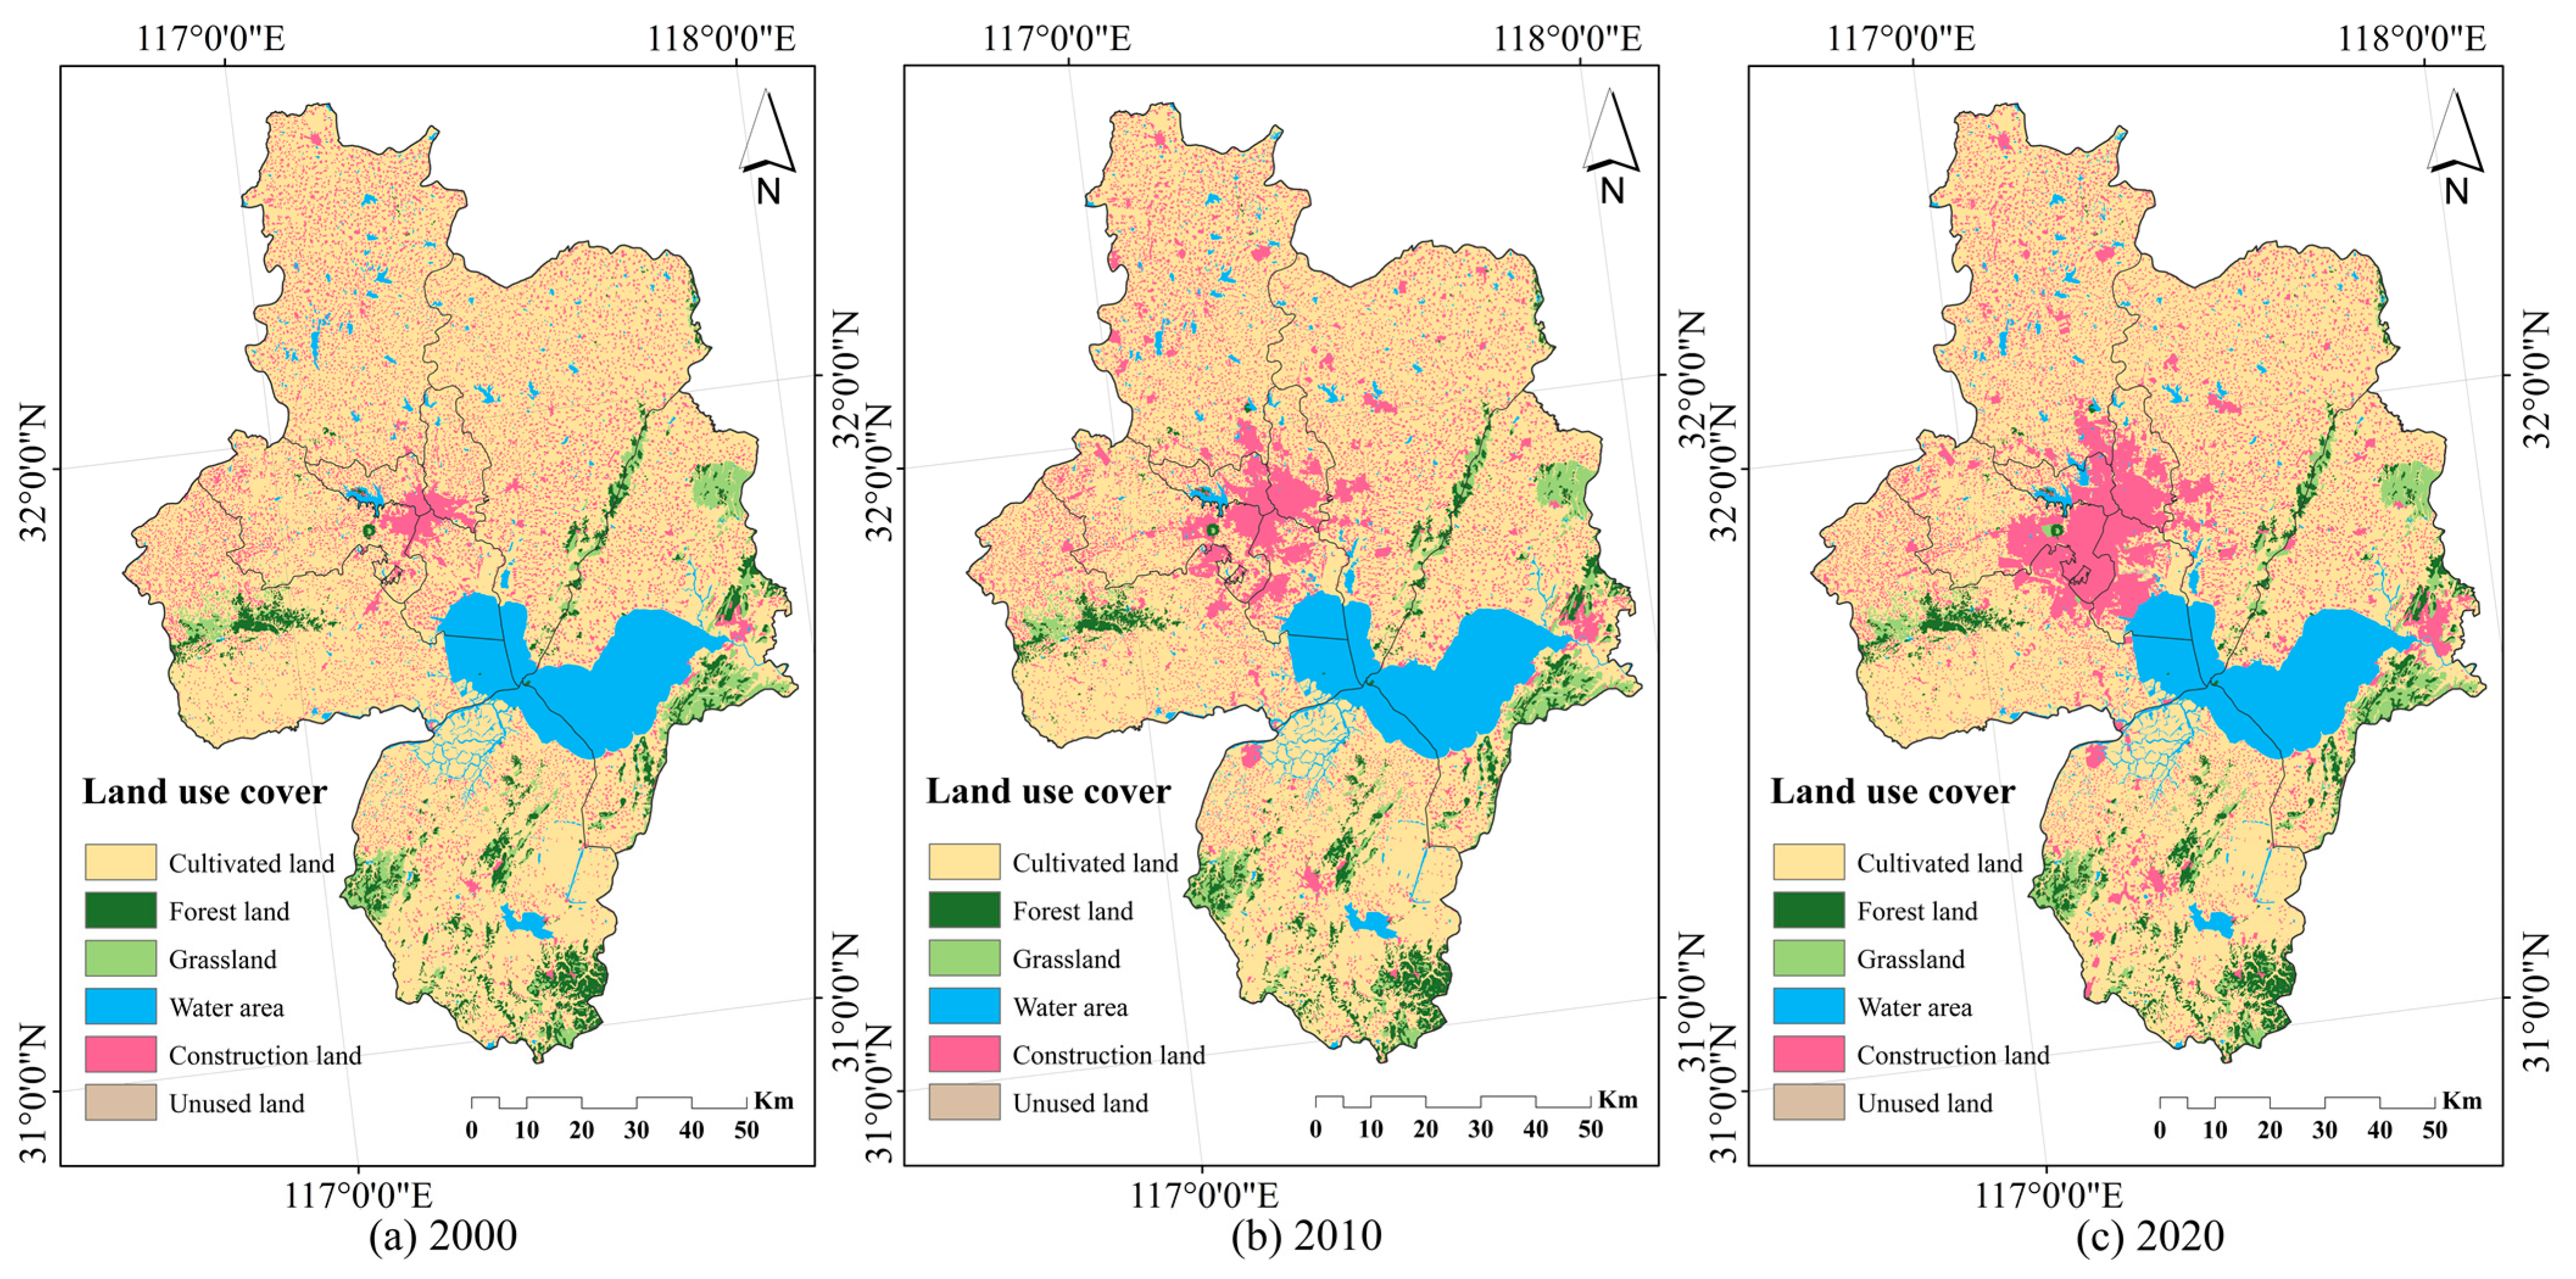
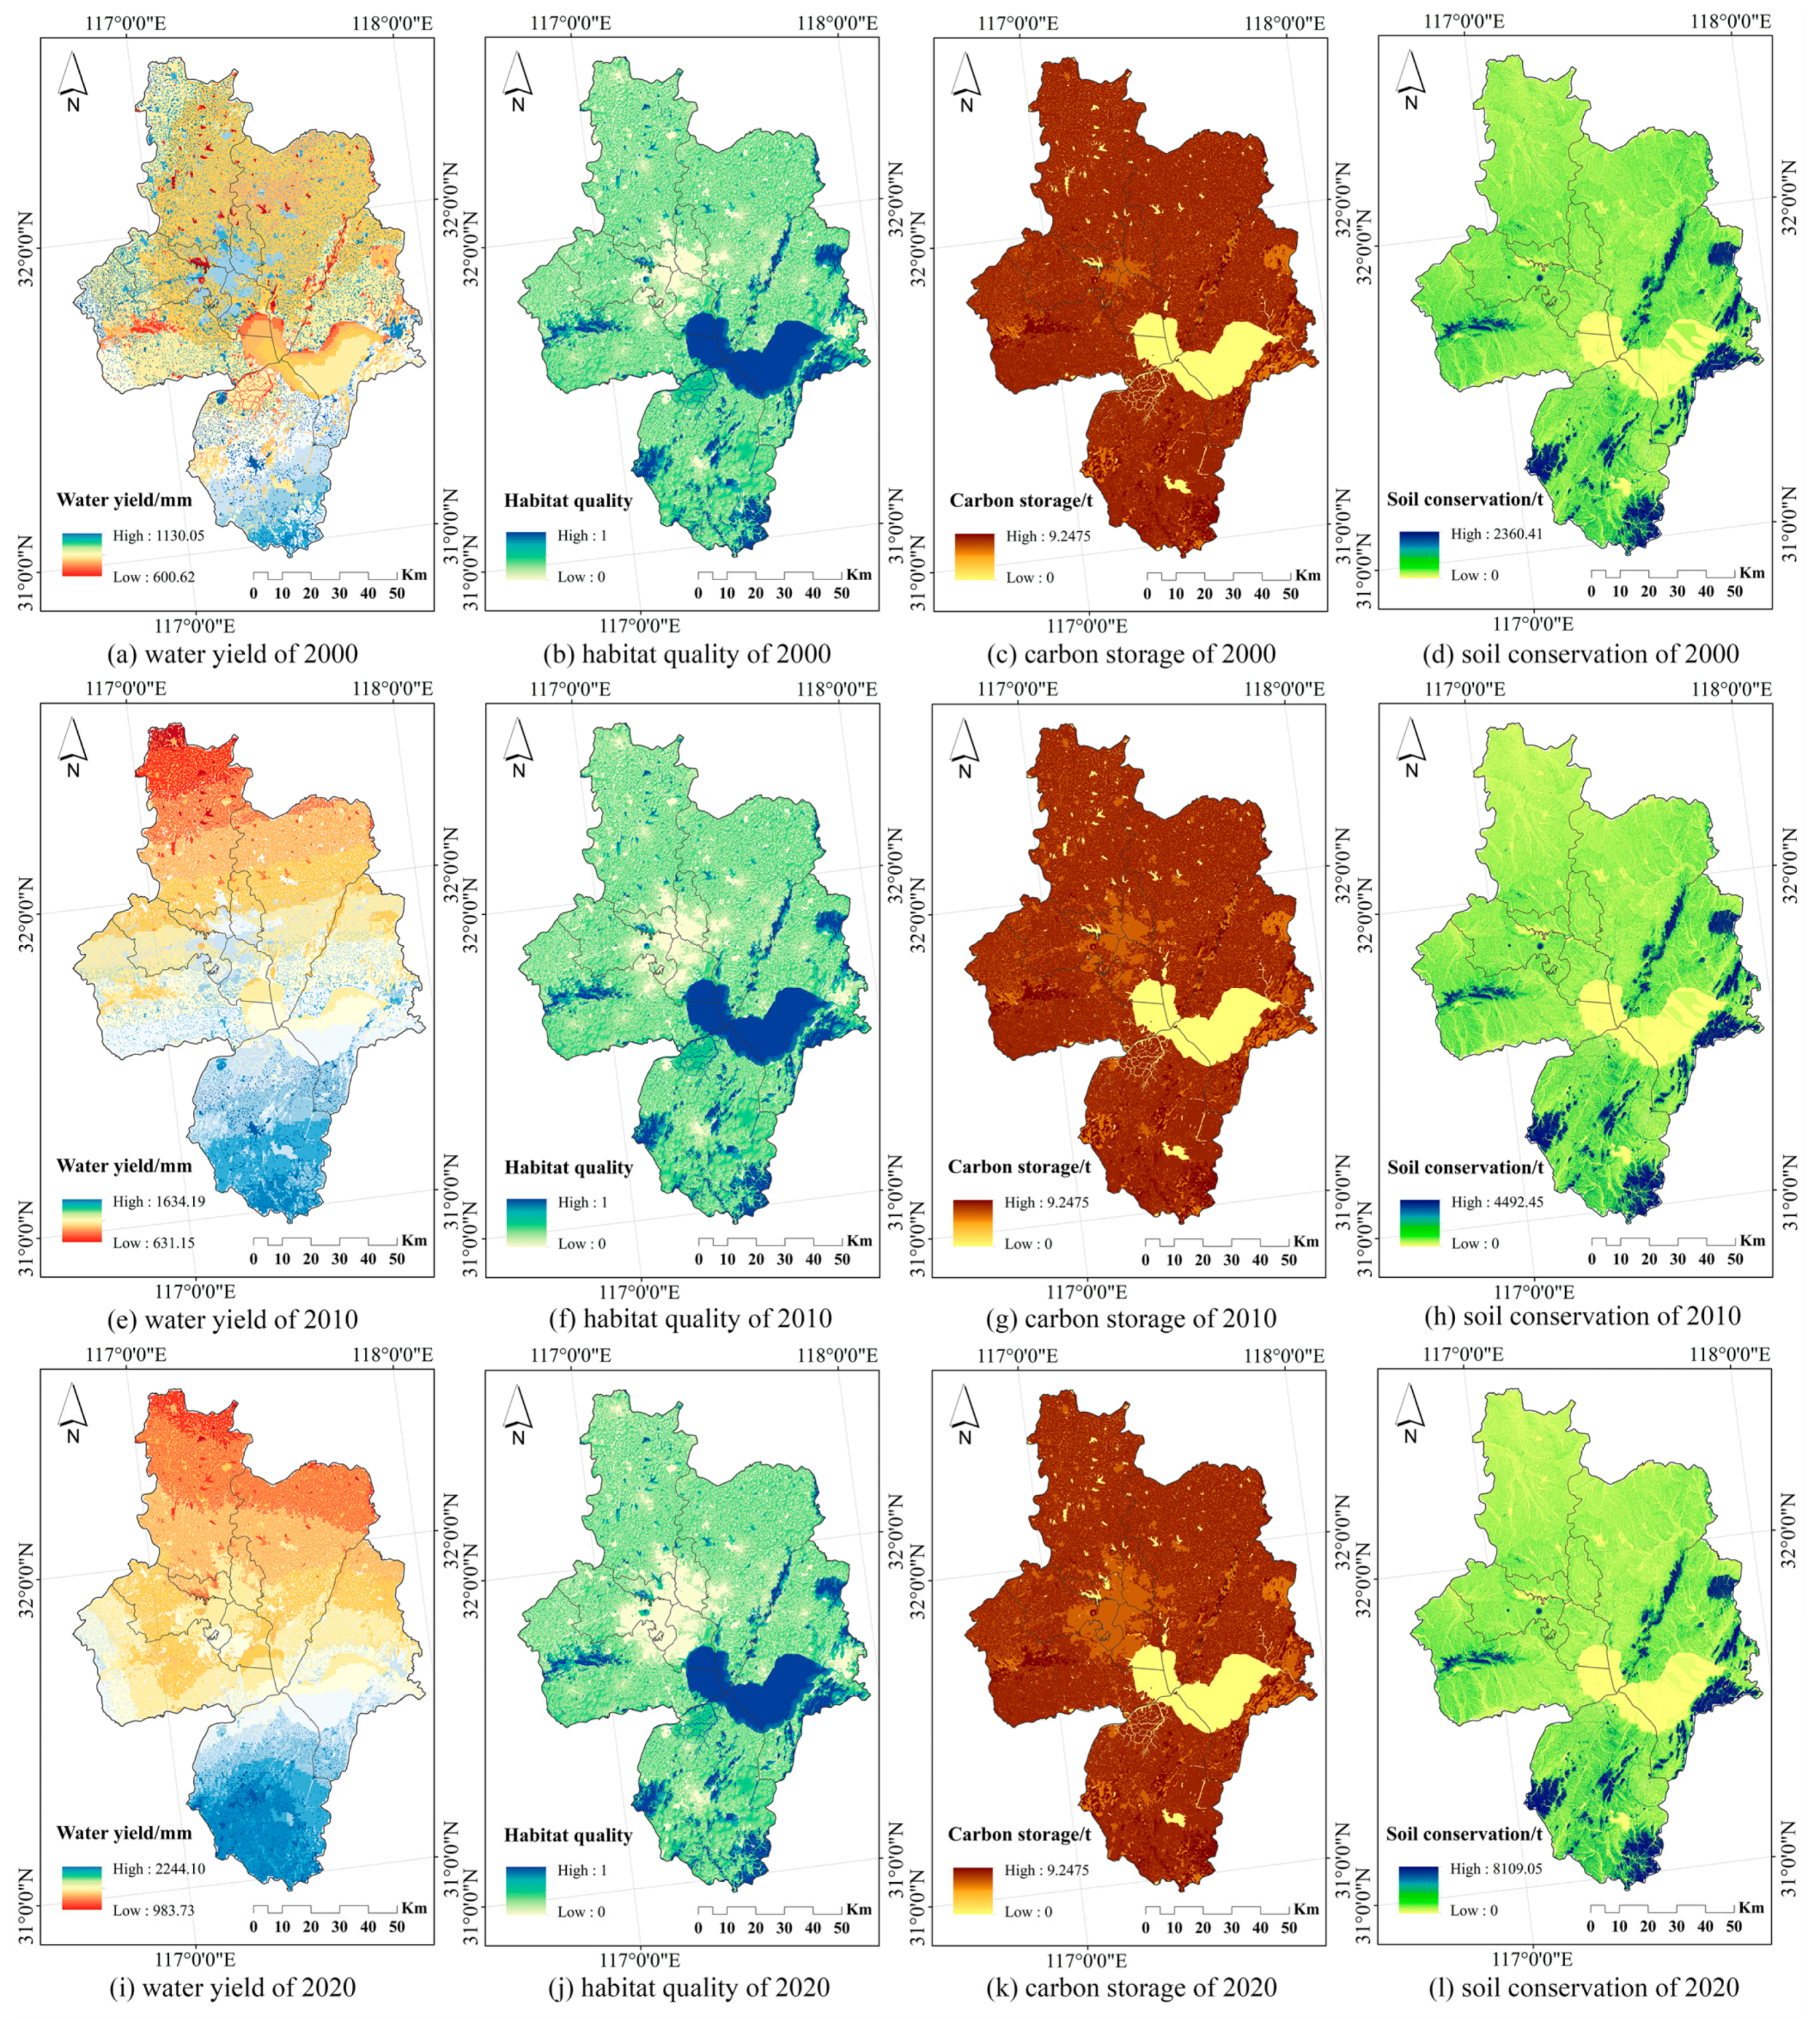
From the perspective of the evolution characteristics of land-use status, from 2000 to 2020, the construction land in Hefei increased significantly, the cultivated land decreased continuously, and the changing trend of other land types was heterogeneous. From the perspective of the spatial distribution pattern of ecosystem services, the spatial distribution of carbon storage, habitat quality, and soil conservation is similar, and the high values are distributed in the eastern and southern mountainous areas and forest lands of Hefei City; the depth of water yield increased year by year, and gradually decreased from south to north. The average value of CES showed a trend of increasing first and then decreasing, and the overall level of ecosystem services needs to be further improved.
(2)
In terms of global spatial autocorrelation, all three periods of data show positive spatial correlation and a high level of Moran’s index, and in terms of local spatial autocorrelation, the values of each agglomeration type change in a more stable manner. From the factor detection results, the ecological land area proportion, population density, and cumulative temperature were the main influencing factors. From the interaction detection, the interaction effect of any two factors was greater than the effect of a single factor on the spatial differentiation. From the response results, grassland and forest land contributed more to the value of ecosystem services, cropland, and watershed also showed a positive correlation with the value of ecosystem services, and construction land was the only land category that showed a negative correlation.
(3)
The PLUS model is used to predict the land-use types in 2030. Under the ND scenario, the expansion of construction land is obvious; under the UD scenario, the area of construction land increased more significantly, and the area of cultivated land, forest land, grassland, and water area showed a decreasing trend under both scenarios. In the scenario of CP, the area of cultivated land increased significantly. Under the EP scenario, the area of forest land, grassland, and water areas increased.
In terms of ecosystem service indicators, under the ND scenario, the water yield and carbon storage of Hefei City showed an increasing trend. Under the UD scenario, the water yield increased significantly, and the habitat quality decreased significantly. Carbon storage has been effectively improved under the scenario of CP. Under the EP scenario, the habitat quality was significantly enhanced, the carbon storage and soil conservation were improved to varying degrees, and the water yield decreased significantly.
The change of comprehensive ecosystem service index under different scenarios has obvious rules. Under the ND scenario, most regions show a mild decline and are basically unchanged; under the UD scenario, the proportion of moderate decline is as high as 12.27%, and the overall regional decline is obvious. Under the scenario of CP, 96.70% of the study area is basically unchanged. Under the EP scenario, CES performed best; 92.82% of the region showed a mild increase, and 3.41% of the region remained basically unchanged, which was the most conducive development scenario to improve the value of ecosystem services and the sustainability of land use.

Author Contributions

Conceptualization, M.H. and X.Y.; methodology, M.H., X.Y. and G.Z.; software, X.Y., Q.G., Y.T. and G.Z.; formal analysis, X.Y., M.H., Y.T., Q.G. and X.W.; investigation, X.Y., Q.G., Y.T. and X.W.; writing—original draft preparation, X.Y.; writing—review and editing, M.H., X.Y. and Q.G.; funding acquisition, M.H. All authors have read and agreed to the published version of the manuscript.

Funding

This research was supported by the Humanities and Social Sciences planning fund project of the Ministry of Education, China, grant number 20YJAZH038; Research projects on Innovative Development of Social Sciences in Anhui Province, grant number 2022CX527; Anhui Provincial Department of Education College excellent top talent cultivation project, grant number gxgnfx2022018; Humanities and Social Sciences project of Anhui Jianzhu University, grant number JR202228. We thank the anonymous reviewers of this manuscript whose comments and suggestions considerably improved the paper.

Data Availability Statement

The data presented in this study are available on request from the corresponding author.

Conflicts of Interest

The authors declare no conflicts of interest.

References

  1. Sun, X.; Lu, Z.; Li, F.; Crittenden, J.C. Analyzing Spatio-Temporal Changes and Trade-Offs to Support the Supply of Multiple Ecosystem Services in Beijing, China. Ecol. Indic. 2018, 94, 117–129. [Google Scholar] [CrossRef]
  2. Yao, F.; Chen, L.; Wang, B.; Guo, Y.; Zhang, T.; Zhou, T. Coordination and Integration between Industrial Structure and Land Economic Density in Hefei. China Land Sci. 2016, 30, 53–61. [Google Scholar] [CrossRef]
  3. Fu, H.; Yan, Y. Ecosystem Service Value Assessment in Downtown for Implementing the “Mountain-River-Forest-Cropland-Lake-Grassland System Project”. Ecol. Indic. 2023, 154, 110751. [Google Scholar] [CrossRef]
  4. Liu, J.; Pei, X.; Zhu, W.; Jiao, J. Understanding the Intricate Tradeoffs among Ecosystem Services in the Beijing-Tianjin-Hebei Urban Agglomeration across Spatiotemporal Features. Sci. Total Environ. 2023, 898, 165453. [Google Scholar] [CrossRef] [PubMed]
  5. Daily, G.C. Nature’s Services: Societal Dependence on Natural Ecosystems; Island Press: Washington, DC, USA, 1997. [Google Scholar] [CrossRef]
  6. Daily, G.C.; Söderqvist, T.; Aniyar, S.; Arrow, K.; Dasgupta, P.; Ehrlich, P.R.; Folke, C.; Jansson, A.; Jansson, B.O.; Kautsky, N.; et al. The value of nature and the nature of value. Science 2000, 289, 395–396. [Google Scholar] [CrossRef] [PubMed]
  7. Costanza, R.; De Groot, R.; Sutton, P.; Van Der Ploeg, S.; Anderson, S.J.; Kubiszewski, I.; Farber, S.; Turner, R.K. Changes in the global value of ecosystem services. Glob. Environ. Chang. 2014, 26, 152–158. [Google Scholar] [CrossRef]
  8. Zhao, S.; Zhang, Y. Ecosystems and HumanWell-Beng: The Achievem ents Contributions and Prospects of the Millennium Ecosystem Assessment. Adv. Earth Sci. 2006, 9, 895–902. [Google Scholar]
  9. Li, L.; Wang, X.; Luo, L. A systematic review on the methods of ecosystem services value assessment. Chin. J. Ecol. 2018, 37, 1233–1245. [Google Scholar] [CrossRef]
  10. Xie, G.; Lu, C.; Leng, Y.; Zheng, D.; Li, S. Ecological assets valuation of the Tibetan Plateau. J. Nat. Resour. 2003, 18, 189–196. [Google Scholar] [CrossRef]
  11. García-Ontiyuelo, M.; Acuña-Alonso, C.; Valero, E.; Álvarez, X. Geospatial mapping of carbon estimates for forested areas using the InVEST model and Sentinel-2: A case study in Galicia (NW Spain). Sci. Total Environ. 2024, 922, 171297. [Google Scholar] [CrossRef]
  12. Zheng, X.; Zhang, J.; Cao, S. Net value of grassland ecosystem services in mainland China. Land Use Policy 2018, 79, 94–101. [Google Scholar] [CrossRef]
  13. Botzas-Coluni, J.; Crockett, E.T.; Rieb, J.T.; Bennett, E.M. Farmland heterogeneity is associated with gains in some ecosystem services but also potential trade-offs. Agric. Ecosyst. Environ. 2021, 322, 107661. [Google Scholar] [CrossRef]
  14. Athukorala, D.; Murayama, Y.; Bandara, C.M.; Lokupitiya, E.; Hewawasam, T.; Gunatilake, J.; Karunaratne, S. Effects of urban land change on ecosystem service values in the Bolgoda Wetland, Sri Lanka. Sustain. Cities Soc. 2024, 101, 105050. [Google Scholar] [CrossRef]
  15. Arkema, K.K.; Field, L.; Nelson, L.K.; Ban, N.C.; Gunn, C.; Lester, S.E. Advancing the design and management of marine protected areas by quantifying the benefits of coastal ecosystems for communities. One Earth 2024, 7, 989–1006. [Google Scholar] [CrossRef]
  16. Nelson, E.; Mendoza, G.; Regetz, J.; Polasky, S.; Tallis, H.; Cameron, D.; Shaw, M. Modeling multiple ecosystem services, biodiversity conservation, commodity production, and tradeoffs at landscape scales. Front. Ecol. Environ. 2009, 7, 4–11. [Google Scholar] [CrossRef]
  17. Liu, X.; Wei, M.; Li, Z.; Zeng, J. Multi-Scenario Simulation of Urban Growth Boundaries with an ESP-FLUS Model: A Case Study of the Min Delta Region, China. Ecol. Indic. 2022, 135, 108538. [Google Scholar] [CrossRef]
  18. Fu, F.; Deng, S.; Wu, D.; Liu, W.; Bai, Z. Research on the Spatiotemporal Evolution of Land Use Landscape Pattern in a County Area Based on CA-Markov Model. Sustain. Cities Soc. 2022, 80, 103760. [Google Scholar] [CrossRef]
  19. Huang, D.; Huang, J.; Liu, T. Delimiting Urban Growth Boundaries Using the CLUE-S Model with Village Administrative Boundaries. Land Use Policy 2019, 82, 422–435. [Google Scholar] [CrossRef]
  20. Liang, X.; Guan, Q.; Clarke, K.C.; Liu, S.; Wang, B.; Yao, Y. Understanding the Drivers of Sustainable Land Expansion Using a Patch-Generating Land Use Simulation (PLUS) Model: A Case Study in Wuhan, China. Comput. Environ. Urban Syst. 2021, 85, 101569. [Google Scholar] [CrossRef]
  21. Li, S.; Cao, Y.; Liu, J.; Wang, S. Simulating Land Use Change for Sustainable Land Management in China’s Coal Resource-Based Cities under Different Scenarios. Sci. Total Environ. 2024, 916, 170126. [Google Scholar] [CrossRef]
  22. Luan, C.; Liu, R.; Zhang, Q.; Sun, J.; Liu, J. Multi-Objective Land Use Optimization Based on Integrated NSGA–II–PLUS Model: Comprehensive Consideration of Economic Development and Ecosystem Services Value Enhancement. J. Clean. Prod. 2024, 434, 140306. [Google Scholar] [CrossRef]
  23. Li, M.; Liang, D.; Xia, J.; Song, J.; Cheng, D.; Wu, J.; Cao, Y.; Sun, H.; Li, Q. Evaluation of Water Conservation Function of Danjiang River Basin in Qinling Mountains, China Based on InVEST Model. J. Environ. Manag. 2021, 286, 112212. [Google Scholar] [CrossRef] [PubMed]
  24. Ren, Y.; Liu, X.; Xu, X.; Sun, S.; Zhao, L.; Liang, X.; Zeng, L. Multi–scenario simulation of land use change and its impact on ecosystem services in Beijing–Tianjin–Hebei region based on the FLUS–InVEST Model. Acta Ecol. Sin. 2023, 43, 4473–4487. [Google Scholar] [CrossRef]
  25. Huang, M.; Fang, B.; Yue, W.; Feng, S. Spatial differentiation of ecosystem service values and its geographical detection in Chaohu Basin during 1995–2017. Geogr. Res. 2019, 38, 2790–2803. [Google Scholar] [CrossRef]
  26. Li, X.; Fu, J.; Jiang, D.; Lin, G.; Cao, C. Land Use Optimization in Ningbo City with a Coupled GA and PLUS Model. J. Clean. Prod. 2022, 375, 134004. [Google Scholar] [CrossRef]
  27. Yao, Y.; Jiang, Y.; Sun, Z.; Li, L.; Chen, D.; Xiong, K.; Dong, A.; Cheng, T.; Zhang, H.; Liang, X.; et al. Applicability and Sensitivity Analysis of Vector Cellular Automata Model for Land Cover Change. Comput. Environ. Urban Syst. 2024, 109, 102090. [Google Scholar] [CrossRef]
  28. Yang, Y.; Lu, Z.; Yang, M.; Yan, Y.; Wei, Y. Impact of Land Use Changes on Uncertainty in Ecosystem Services under Different Future Scenarios: A Case Study of Zhang-Cheng Area, China. J. Clean. Prod. 2024, 434, 139881. [Google Scholar] [CrossRef]
  29. Ouyang, X.; He, Q.; Zhu, X. Simulation of Impacts of Urban Agglomeration Land Use Change on Ecosystem Services Value under Multi-Scenarios: Case Study in Changsha-Zhuzhou-Xiangtan Urban Agglomeration. Econ. Geogr. 2020, 40, 93–102. [Google Scholar] [CrossRef]
  30. Zhang, X.; Zhang, X.; Li, D.; Lu, L.; Yu, H. Multi–Scenario Simulation of the Impact of Urban Land Use Change on Ecosystem Service Value in Shenzhen. Acta Ecol. Sin. 2022, 42, 2086–2097. [Google Scholar] [CrossRef]
  31. Zhang, S.; Yang, P.; Xia, J.; Wang, W.; Cai, W.; Chen, N.; Hu, S.; Luo, X.; Li, J.; Zhan, C. Land Use/Land Cover Prediction and Analysis of the Middle Reaches of the Yangtze River under Different Scenarios. Sci. Total Environ. 2022, 833, 155238. [Google Scholar] [CrossRef]
  32. Gao, L.; Tao, F.; Liu, R.; Wang, Z.; Leng, H.; Zhou, T. Multi-Scenario Simulation and Ecological Risk Analysis of Land Use Based on the PLUS Model: A Case Study of Nanjing. Sustain. Cities Soc. 2022, 85, 104055. [Google Scholar] [CrossRef]
  33. Gao, J.; Li, F.; Gao, H.; Zhou, C.; Zhang, X. The Impact of Land-Use Change on Water-Related Ecosystem Services: A Study of the Guishui River Basin, Beijing, China. J. Clean. Prod. 2017, 163, S148–S155. [Google Scholar] [CrossRef]
  34. Tang, Z.; Ning, R.; Wang, D.; Tian, X.; Bi, X.; Ning, J.; Zhou, Z.; Luo, F. Projections of Land Use/Cover Change and Habitat Quality in the Model Area of Yellow River Delta by Coupling Land Subsidence and Sea Level Rise. Ecol. Indic. 2024, 158, 111394. [Google Scholar] [CrossRef]
  35. Huang, M.; Yue, W.; Feng, S.; Zhang, J. Spatial-temporal evolution of habitat quality and analysis of landscape patterns in Dabie Mountain area of west Anhui province based on InVEST model. Acta Ecol. Sin. 2020, 40, 2895–2906. [Google Scholar] [CrossRef]
  36. Zhu, C.; Fan, W.; Wu, X.; Zhang, Z.; Chen, Y. Spatial Mismatch and the Attribution Analysis of Carbon Storage Demand and Supply in the Yangtze River Economic Belt, China. J. Clean. Prod. 2024, 434, 140036. [Google Scholar] [CrossRef]
  37. Yang, Y.; Li, H.; Qian, C. Analysis of the Implementation Effects of Ecological Restoration Projects Based on Carbon Storage and Eco-Environmental Quality: A Case Study of the Yellow River Delta, China. J. Environ. Manag. 2023, 340, 117929. [Google Scholar] [CrossRef]
  38. He, X.; Miao, Z.; Wang, Y.; Yang, L.; Zhang, Z. Response of Soil Erosion to Climate Change and Vegetation Restoration in the Ganjiang River Basin, China. Ecol. Indic. 2024, 158, 111429. [Google Scholar] [CrossRef]
  39. Qiao, X.; Li, Z.; Lin, J.; Wang, H.; Zheng, S.; Yang, S. Assessing Current and Future Soil Erosion under Changing Land Use Based on InVEST and FLUS Models in the Yihe River Basin, North China. Int. Soil Water Conserv. Res. 2024, 12, 298–312. [Google Scholar] [CrossRef]
  40. Anselin, L. The local indicators of spatial association-LISA. Geogr. Anal. 1995, 27, 93–115. [Google Scholar] [CrossRef]
  41. Ord, J.K.; Getis, A. Local spatial auto correlation statistics: Distributional issues and application. Geogr. Anal. 1995, 27, 286–306. [Google Scholar] [CrossRef]
  42. Wu, L.; Fan, F. Assessment of Ecosystem Services in New Perspective: A Comprehensive Ecosystem Service Index (CESI) as a Proxy to Integrate Multiple Ecosystem Services. Ecol. Indic. 2022, 138, 108800. [Google Scholar] [CrossRef]
Figure 1. Research location.
Sustainability 16 05364 g001
Figure 2. Research framework.
Sustainability 16 05364 g002
Figure 3. Driving factors of land-use change.
Sustainability 16 05364 g003
Figure 4. Land-use status in Hefei from 2000 to 2020. (a) Land-use cover in 2000; (b) land-use cover in 2010; (c) land-use cover in 2020.
Sustainability 16 05364 g004
Figure 5. Land transfer matrix chord chart in Hefei from 2000 to 2020. (a) Land transfer matrix chord chart 2000–2010; (b) land transfer matrix chord chart 2010–2020; (c) land transfer matrix chord chart 2000–2020.
Sustainability 16 05364 g005
Figure 6. Temporal and spatial distribution of ecosystem services in Hefei from 2000 to 2020.
Sustainability 16 05364 g006
Figure 7. Spatiotemporal distribution of CES index in Hefei. (a) Spatial distribution of the CES index in 2000; (b) spatial distribution of the CES index in 2010; (c) spatial distribution of the CES index in 2020.
Sustainability 16 05364 g007
Figure 8. LISA cluster map of CES index in Hefei from 2000 to 2020. (a) LISA clusters for the CES index 2000; (b) LISA clusters for the CES index 2010; (c) LISA clusters for the CES index 2020.
Sustainability 16 05364 g008
Figure 9. Scatter fitting plot of different land-use types and CES index in 2000.
Sustainability 16 05364 g009
Figure 10. Scatter fitting plot of different land-use types and CES index in 2010.
Sustainability 16 05364 g010
Figure 11. Scatter fitting plot of different land-use types and CES index in 2020.
Sustainability 16 05364 g011
Figure 12. Interactive detection results of spatial differentiation driving factors in the CES index.
Sustainability 16 05364 g012
Figure 13. Land-use simulation under four scenarios in 2030.
Sustainability 16 05364 g013
Figure 14. Spatial distribution of changes in various ecological indicators under multiple scenarios in 2030.
Sustainability 16 05364 g014
Figure 15. Spatial distribution of changes in the CES index under four scenarios in 2030. (a) Spatial distribution of changes in the CES index under the ND scenario; (b) spatial distribution of changes in the CES index under the UD scenario; (c) spatial distribution of changes in the CES index under the CP scenario; (d) spatial distribution of changes in the CES index under the EP scenario.
Sustainability 16 05364 g015
Table 1. Data sources.
Data NameYearResolution/mData SourcesModelStudy Resources
Annual precipitation2000, 2010, 20201http://www.geodata.cn, accessed on 16 August 2023.InVESTLi, M. (2021) [23]
Ren, Y. (2023) [24]
Evapotranspiration2000, 2010, 20201http://www.geodata.cn, accessed on 16 August 2023InVEST
Rainfall erosivity2000, 2010, 202030https://www.geodata.cn, accessed on 16 August 2023.InVEST
Soil erodibility2000, 2010, 202030https://www.geodata.cn, accessed on 18 August 2023.InVEST
DEM2000, 2010, 202030http://www.gscloud.cn, accessed on 16 August 2023.InVEST
Temperature2000, 2010, 20201000http://www.resdc.cn, accessed on 19 August 2023InVEST
GDP2000, 2010, 20201000http://www.resdc.cn, accessed on 20 November 2023.PLUSLiang, X. (2021) [20]
Land use2000, 2010, 202010http://www.resdc.cn, accessed on 23 July 2023.PLUS
Population density2000, 2010, 20201000http://www.resdc.cn, accessed on 30 September 2023.Geographical detectorHuang, M. (2019) [25]
Table 2. Scenario notes.
ScenariosScenario Notes
Natural Development (ND)It is the extent of land utilization remains constant between the years 2000 and 2020.
Urban Development (UD)It strictly forbids the transformation of property designated for construction land purposes into other types of land while adhering to the policy guidelines aimed at minimizing the unregulated growth of construction land.
Cultivated land Protection (CP)It simulates the impacts of implementing the cultivated land protection policy, which prohibits the conversion of cultivated land to other land uses and ensures the preservation of essential farmed land.
Ecological Protection (EP)It places a high priority on the protection of forest land and other ecological land. The objective is to reduce the transformation of forest land into other land uses while promoting the conversion of non-forested land into forested areas.
Table 3. Reference table of neighborhood weights.
Cultivated LandForest LandGrasslandWater AreaConstruction LandUnused Land
ND0.50.70.30.410.01
UD0.40.50.20.410.01
CP0.80.50.30.20.80.01
EP0.310.70.80.80.01
Table 4. Weights of different ecosystem service indicators in Hefei City.
Impact LayerInfluence Layer WeightIndicator LayerIndicator Layer WeightsFinal Weights
Regulation Services0.53Carbon storage0.590.31
Soil conservation0.410.22
Supply Services0.25Water yield10.25
Support Services0.22Habitat quality10.22
Table 5. Changes in various ecological indicators under different scenarios.
ScenariosChanges in Values of Ecological IndicatorsRate of Change of Ecological Indicators
Water YieldHabitat QualityCarbon StorageSoil ConservationWater YieldHabitat QualityCarbon StorageSoil Conservation
ND1478.050.407.2212.570.66%−5.87%0.36%−0.06%
UD1492.610.357.0812.651.65%−18.89%−1.64%0.53%
CP1480.710.387.2912.600.84%−12.28%1.28%0.12%
EP1477.640.446.9512.60−0.93%2.70%0.88%0.46%
Table 6. CES index gains and losses by site type under different scenarios.
Types of LandSerious DeclineModerate DeclineMild DeclineEssentially UnchangedMild IncreaseModerate IncreaseSubstantial Increase
NDCultivated land0.07%0.04%83.28%16.60%0.01%0.00%0.00%
Forest land 0.02%0.06%54.78%28.91%16.23%0.00%0.00%
Grassland0.00%0.09%63.65%34.65%1.61%0.00%0.00%
Water area0.09%15.17%71.99%7.59%2.65%2.22%0.28%
Construction land0.00%0.00%99.88%0.11%0.01%0.00%0.00%
Unused land0.00%0.00%99.50%0.50%0.00%0.00%0.00%
UDCultivated land0.19%15.17%77.01%7.48%0.05%0.10%0.00%
Forest land 4.13%30.18%43.90%15.45%6.17%0.18%0.00%
Grassland0.22%5.82%76.01%14.34%0.90%2.71%0.00%
Water area0.08%12.97%71.23%4.45%6.26%4.96%0.04%
Construction land0.00%0.79%99.15%0.05%0.00%0.00%0.00%
Unused land0.01%0.70%37.66%0.46%60.22%0.96%0.00%
CPCultivated land0.00%0.00%0.03%99.93%0.03%0.01%0.00%
Forest land 0.08%4.57%41.46%53.10%0.78%0.00%0.00%
Grassland0.00%0.03%2.32%94.40%3.25%0.00%0.00%
Water area0.00%0.00%0.02%88.08%10.78%1.12%0.00%
Construction land0.00%0.00%0.01%99.97%0.02%0.00%0.00%
Unused land0.00%0.00%0.00%51.08%48.57%0.35%0.00%
EPCultivated land0.00%2.61%0.00%1.61%95.04%0.74%0.00%
Forest land0.00%3.13%0.38%0.10%89.32%7.07%0.00%
Grassland0.00%0.10%0.02%0.01%94.66%5.20%0.00%
Water area0.00%0.07%0.00%0.13%98.54%0.91%0.35%
Construction land0.00%1.41%0.05%2.84%88.74%6.96%0.00%
Unused land0.00%0.33%0.00%0.35%96.10%2.59%0.62%
Disclaimer/Publisher’s Note: The statements, opinions and data contained in all publications are solely those of the individual author(s) and contributor(s) and not of MDPI and/or the editor(s). MDPI and/or the editor(s) disclaim responsibility for any injury to people or property resulting from any ideas, methods, instructions or products referred to in the content.

