Article

An Analysis of Policy Transmission Flow in the Chengdu Plain Urban Agglomeration in Southwest China: Towards Building an Ecological Protection Network

1
School of Civil Engineering and Architecture, Southwest University of Science and Technology, Mianyang 621010, China
2
Research Institute for Eco-Civilization, Sichuan Academy of Social Sciences, Chengdu 610071, China
3
Department of Earth System Science, Ministry of Education Key Laboratory for Earth System Modeling, Institute for Global Change Studies, Tsinghua University, Beijing 100084, China
4
College of Earth Science, Chengdu University of Technology, Chengdu 610059, China
*
Author to whom correspondence should be addressed.
Sustainability 2024, 16(13), 5398; https://doi.org/10.3390/su16135398
Submission received: 9 April 2024 / Revised: 6 June 2024 / Accepted: 12 June 2024 / Published: 25 June 2024

Abstract

:
Regional ecological protection is an urgent task in today’s social development, and constructing an ecological protection network is an important way to achieve regional ecological coordination. However, previous studies have lacked a systematic review and analysis of policy document transmission paths, failing to consider the spatial network structure and its complex characteristics of regional ecological protection policies, resulting in deficiencies in regional coordinated governance of the ecological environment. To address this gap, this study constructs an ecological policy transmission network lineage for the Chengdu Plain urban agglomeration (CDPUA) based on 400 ecological environmental protection policy documents issued by cities in the CDPUA from 2015 to 2022, focusing on the transmission perspective of policy documents. Social network analysis methods, a GIS spatial analysis, and other methods were employed to construct the ecological protection network of the CDPUA and analyze the complex spatial structure and characteristics of the network. It was found that the integrated ecological protection network of the CDPUA exhibits a multi-core triangular pattern with spatial characteristics of density in the east and sparsity in the west. The integrated ecological protection network has a density of 60.71%, indicating a strong intercity linkage, with Suining as the central nucleus transmitting policies to surrounding cities, forming the Suining–Chengdu–Mianyang policy transmission triangle. The urban agglomeration has formed an ecological protection network dominated by multiple cities, offering diverse and distinct types of ecosystem services. This study provides insights to enhance regional collaborative ecological governance and protection, promoting sustainable development in the region.

1. Introduction

In recent years, with the rapid development of cities and continuous population growth, the intensity of land development has gradually increased, and the contradictions between cities and the natural environment have become increasingly prominent [1]. Issues such as land development, resource utilization, and environmental pollution in the process of urbanization have placed severe pressures and threats on ecosystems [2]. Urban agglomerations, as compactly organized geographical units with close economic ties, are products of industrialization and urbanization reaching a certain level [3]. Urban agglomerations have a significant impact on regional socio-economic development and the ecological environment through the agglomeration and radiation effects of central cities [4]. However, the current disparities in socio-economic development and environmental governance have led to the degradation of the regional natural environment, a reduction in the carrying capacity of the ecological environment, and the forced compression of ecological space, resulting in negative ecological consequences [5]. To address these environmental challenges, urban agglomerations serve practical roles as ecological conservators and ecological barriers, taking on the important responsibility of breaking free from administrative division constraints and achieving environmental protection and integrated ecological development [6]. Therefore, by studying the collaborative development pathways of urban agglomerations, identifying policy-related networks, and assessing policy cooperation strength, it is hoped that the conflicts between socio-economic development and the ecological environment can be alleviated, providing new insights for solving current regional ecological integration issues and promoting the sustainable development of urban agglomerations.

2. Literature Review

After Castells introduced Theory of the Space of Flows [7], urban network research shifted from “local space” to “flowing space”. The spatial structure of information flow between urban agglomerations has gradually become the focus of scholars and continues to evolve [8]. The orderly flow of multiple elements and information within urban agglomerations has promoted the concentration of regional industries and populations, driving regional economic growth [9]. Based on the theory of flow space, by examining the connections of urban elements, we can objectively analyze urban network relationships, reveal the composition of nodes and circuits within the network, and understand the spatial patterns of network element flow [10]. Initial flow space research typically focused on a static perspective, covering transportation networks such as aviation, railways, and highways [11]. With the advancement of urbanization, elements like population [12], economy [13], and information [14] within cities have become crucial mediators for intercity connections. With the advancement of information technology, information flow has gradually become a key element of urban development. Its virtual and borderless nature has, to a certain extent, eliminated geographical constraints and provided strong support for the study of physical urban networks, thereby enhancing our understanding of the comprehensive network characteristics of urban systems [15]. Based on this trend, many scholars have utilized various data sources such as internet backbone networks [16], Weibo [17], Baidu Index [18], GPS trajectories [19], and applied methods like a social network analysis to study urban network characteristics and their evolution [20]. For instance, they have employed multiple data sources, including Points of Interest (POIs) and mobile signaling data, to construct coupled development degree models for exploring the characteristics of business systems and the mobility of the actual service population [21]. Using Baidu Index data as a foundation, they have introduced improved noise reduction techniques and employed directed network analysis methods to analyze features and their evolution related to the hierarchical structure, asymmetry, and spatial organization of information flow networks. Taking a perspective based on Weibo, they have used “social relationships” and “social frequency” as key metrics for measuring the characteristics of social networks within universities in Nanjing.
The aforementioned research enhances our understanding of urban network characteristics formed by actual material flows. However, there is less consideration given to the relationship networks formed by virtual policy flows. Currently, sustainable urban development is crucial for human survival. In light of this, our study aims to construct an ecological protection network between cities by examining the ecosystem service functions facilitated by policy interactions. Ecosystem services are conditions and processes provided by natural ecosystems and their organisms to fulfill human survival needs [22]. These services are products or benefits directly or indirectly obtained through ecosystem functions [23]. In recent years, research and assessment related to ecosystem services have become a hot topic in the fields of international ecology and ecological economics [24]. Quantitative research on the economic value of ecosystem services in relation to biodiversity has been widely conducted, encompassing different types of ecosystems, including terrestrial [25], forest [26], grassland [27], wetland [28], and marine ecosystems. However, previous flow space research primarily focused on network structures formed by the mutual transmission of public information nodes, often based on tangible elements. Nevertheless, there has been a lack of research from the perspective of government-specific information transmission flows regarding the ecological elements of urban agglomerations. Simultaneously, research regarding ecosystem services has not delved into the role of policies, and there has been relatively little research on the connection between virtual information flows, policy geographic relevance, and regional cooperation. To address this gap, recent studies have constructed an analytical framework based on Nature-Based Solutions (NBSs) and systematically reviewed the knowledge system of urban sustainable development [29]. An NBS integrates previously related research areas such as ecosystem services, green infrastructure, and urban forests to address real social challenges and form a new research field. These research findings indicate that an NBS plays a significant role in promoting urban sustainable development and helps address the ecological challenges brought by urbanization and economic development through interdisciplinary research and implementation frameworks [30].
On this basis, this study will primarily focus on the connection between urban agglomeration ecosystem services and policy transmission linkages, exploring the interrelationships among urban agglomeration ecological protection networks. The policy transmission linkages in this study are a special form of information flow, distinct from traditional factor flows [31]. Policy transmission linkages operate in the domain of ecological protection and are reflected in the strength of the interrelation of policy documents among regions regarding the real ecosystem services elements, thus forming a collaborative regional ecological protection network. Policy “transmission flows” depict the process or pathways through which urban agglomeration ecological policies are mutually transmitted and influence one another between cities. Cities within urban agglomerations flow through policy documents to different urban nodes, facilitating the mutual exchange and transmission of ecological policies between urban agglomerations, ultimately achieving regional collaborative protection and the construction of the ecological environment. For example, after City A promulgates an ecological environmental policy, City B can evaluate the effectiveness of City A’s policy implementation and, based on their own city’s circumstances, formulate similar policy documents, thus constituting a policy transmission flow that promotes the transmission of policies within the urban agglomeration. This study draws upon a policy analysis framework to construct a policy transmission flow network lineage [32], reflecting the interrelationships and spatial structure acting upon ecosystem services elements between regions. Analyzing the spatial structure of a policy transmission flow ecological protection network and the internal network structures within urban agglomerations will help guide communication and cooperation among urban agglomerations, efficiently utilize and allocate ecological protection resources, and promote regional collaborative governance.
The CDPUA is one of the important regional urban agglomerations in western China, belonging to a region in Sichuan Province with the best industrial foundation, active economic development, strong innovation capabilities, and the highest degree of openness. However, it faces severe ecological and environmental challenges. The rapid urbanization and economic development in this area have placed enormous pressure on the ecosystem. Therefore, this study, from the perspective of policy transmission flows, attempts to construct an ecological protection network within the CDPUA, enriching the content of urban agglomeration network research. Simultaneously, it aims to optimize and improve the existing policy system for ecological and environmental protection. Through the analysis of the regional ecological protection network, it provides new ideas for future regional collaborative ecological and environmental protection, enhancing environmental quality, improving resource utilization efficiency, and promoting a green lifestyle.
The rest of this paper is organized as follows: In Section 3, we describe the data and methods used in this study. This section includes details about the study area and data sources (Section 3.1), with further subdivisions into study area (Section 3.1.1) and data sources (Section 3.1.2). The methodology is explained in Section 3.2, which covers the policy transmission flow model (Section 3.2.1) and social network analysis (Section 3.2.2). Section 4 presents the results of our study. It starts with an analysis of the ecological protection network characteristics (Section 4.1), including both the integrated ecological protection network (Section 4.1.1) and categorized ecological protection network characteristics (Section 4.1.2). This is followed by the ecological protection network point-degree centrality analysis (Section 4.2), which examines the point-degree centrality of the integrated ecological protection network (Section 4.2.1) and classified ecological protection networks (Section 4.2.2). Additionally, this section includes an analysis of cohesive subgroups (Section 4.3) and a core–periphery structure analysis (Section 4.4). Section 5 provides a discussion of the findings and concludes this paper.

3. Data and Methods

3.1. Study Area and Data Sources

3.1.1. Study Area

The Chengdu Plain urban agglomeration refers to eight cities in Sichuan Province in southwestern China, Chengdu, Mianyang, Deyang, Leshan, Meishan, Ya’an, Ziyang, and Suining, with a total area of approximately 86,500 km2 (Figure 1). The CDPUA, as one of the regions with the highest urbanization rates in the western part of China and an essential component of the Chengdu–Chongqing Economic Zone, plays a crucial role in regional integrated development. This urban agglomeration possesses abundant industrial resources and diversified economic activities, with a focus on pillar industries like manufacturing, communication technology, modern services, and agriculture. It has seen the development of modern service industries such as culture and sports, modern logistics, commercial trade, and financial services. Furthermore, the construction of the Western Financial Center is accelerating, providing strong support for the region’s economic development. Additionally, the CDPUA enjoys a favorable natural environment with rich biological resources. According to statistical data, the forest coverage in this region reached 47.4% in 2020, making it an important ecological barrier area in the western part of China. This provides favorable conditions for ecological protection and sustainable development in the urban agglomeration. However, the rapid urbanization and economic development in the region have brought enormous pressure to the ecosystem.

3.1.2. Data Sources

The policy text data involved in this study include approximately 415 policy documents from the CDPUA. These documents were obtained from the government websites and public announcements of various city governments, municipal agencies, and vertically managed institutions (Table 1). The policy documents consist of notifications, announcements, opinions, orders, management measures, regulations, implementation methods, and planning ordinances related to ecological environment protection. They form the database of ecological policy documents for the CDPUA. By organizing the relevant data on ecological protection from various cities within the region, it was observed that the government documents related to ecological protection have shown a relatively stable trend since 2015. Therefore, this study selected a total of 401 policy documents from the period of 2015 to 2022 as the research objects to explore the ecological protection network of the CDPUA. By considering the main contents covered in the documents and referencing relevant research findings, this study categorizes and identifies types of ecosystem services based on the various ecological service functions generated within the ecosystem, such as material flow, energy flow, and information flow, which provide direct or indirect benefits to humans in terms of resource provisioning and environmental regulation [33]. Ecological policy documents issued by cities within urban agglomerations can influence urban ecosystems and thus generate relevant values. By considering the potential changes in ecosystem services resulting from the ecological environment protection indicated in the policy documents of the CDPUA, this study categorized ecosystem services into five primary classes: provisioning services, regulation services, supporting services, cultural services, and integrated services. Integrated services, in this context, refer to policy documents that do not specifically target a particular aspect of ecological environment protection, but encompass the integrated nature of ecosystem services that are not fully covered by the other four primary categories. The presence of integrated services is due to the emphasis of these policy documents on overall ecological environment protection. Then, the first-level category was further divided into 9 second-level types. The provisioning services include two secondary types: grain production and water supply. The regulation services category includes gas regulation, climate regulation, environmental purification, and hydrological regulation. The supporting services category includes soil erosion control. The cultural services category includes the provision of aesthetic landscapes. The comprehensive service category encompasses various comprehensive services. In summary, these classifications provide a framework to analyze the possible impacts of different types of policy documents on ecosystem services in urban agglomerations.

3.2. Methodology

The primary aim of this research is to determine the strength of ecological protection policy connections between cities in the Chengdu Plain urban agglomeration (CDPUA) and to construct an ecological protection network. By demonstrating the effectiveness of policy formulation and implementation, this research seeks to refine policy transmission, thereby promoting improvements in regional ecological environment quality and contributing to the practical construction of ecological networks.
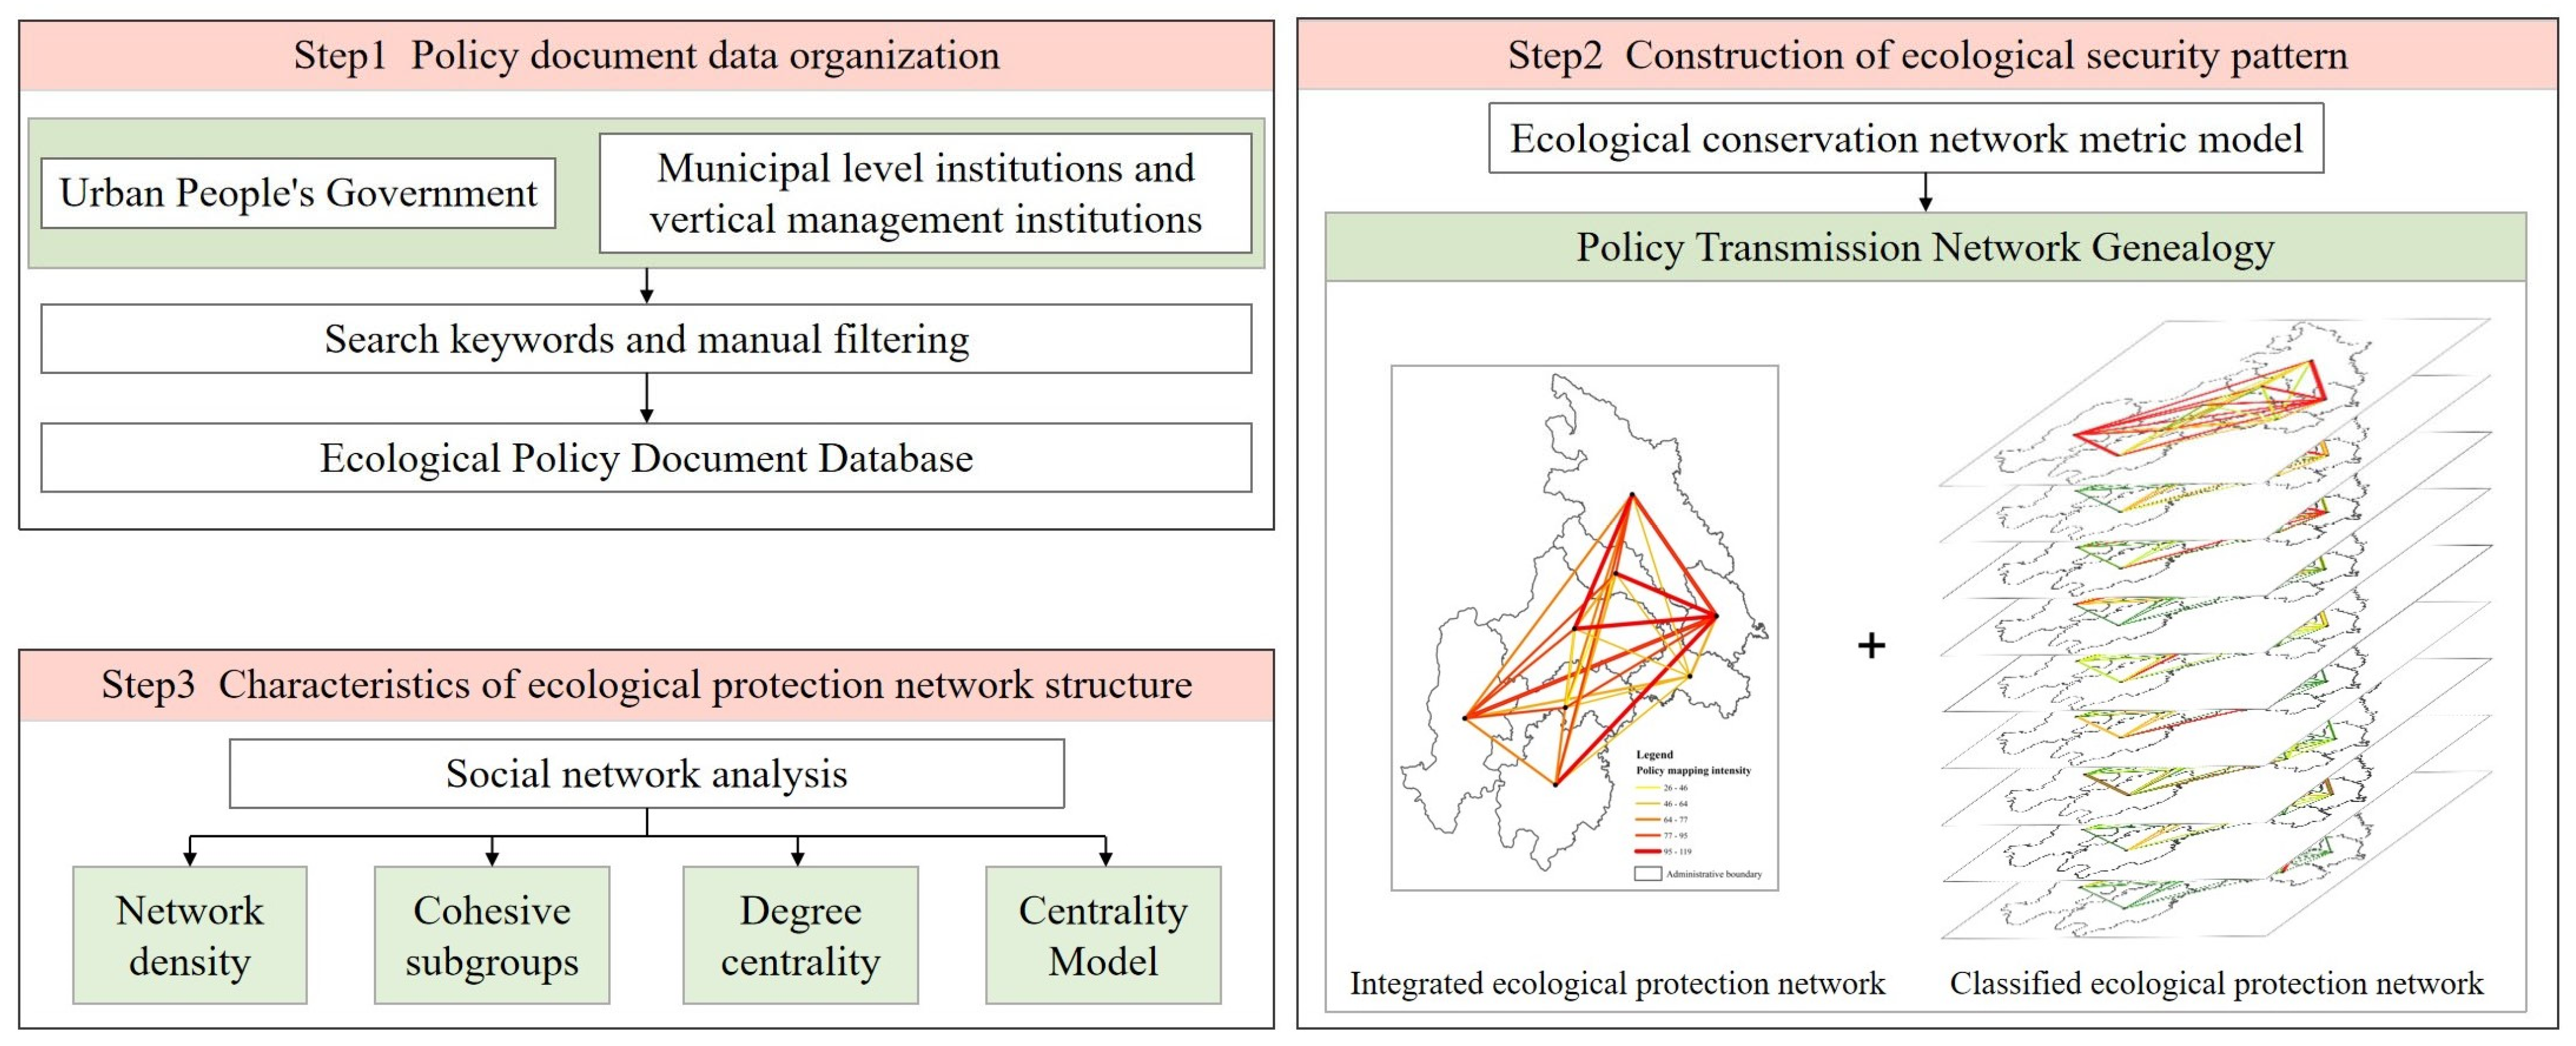
We have proposed a comprehensive research framework (Figure 2) that integrates methods such as ecosystem services differentiation, policy transmission relationships, and a social network analysis. This framework allows us to explore the ecological protection network formed by the policy transmission flows within the CDPUA and comprehensively study its network structure characteristics. This research consists of three main parts. The first part involves organizing ecological and environmental protection-related policy document data. We categorize policies related to ecological protection within the CDPUA based on their impact on different ecosystem functions and establish a policy database. The second part focuses on the construction of the policy ecological protection network. Firstly, we create a matrix that represents the flow relationships of ecological protection elements in the study area using policy time as a measuring axis. Then, we use a gravity model to measure the transmission relationships within the ecological protection network of the CDPUA. This allows us to construct an ecological protection network lineage with cities as nodes and policies as pathways affecting ecosystem services. The third part involves the analysis of structural characteristics within the ecological protection network. We select various network structure analysis metrics from the social network analysis, including network density, cohesive subgroups, degree centrality, core–periphery structure, and others. More importantly, based on the results of the network construction and analysis, we explore new areas of regional ecological cooperation policies and their potential extensions.

3.2.1. Policy Transmission Flow Model

To study the flow of ecological and environmental protection policies between cities in urban clusters, this paper uses a policy transmission flow model. The model draws on the methodology of the city network study and uses ecological protection policy documents from 2015 to 2022 as the data for this study, with the time of release of each policy as the measurement axis [41]. The hypothesis of this study is that ecological policies issued by one city have an impact on subsequent ecological policy documents of the same type issued by other cities, thus forming a transmission relationship between the policy documents of the two cities. Based on this hypothesis, this paper constructs a relationship matrix for the flow of ecological protection elements between cities in an urban agglomeration by counting the number of policy linkages between the cities (using integrated services as an example, Table 2). The calculation formula is as follows:
E i j = G i C s i T t i + + G j C s j T t j
where E i j is the transmission of ecological conservation policies generated by city i to city j; G i and G j denote the cities where ecological conservation policies are associated, respectively; C s i and C s j denote the types of ecosystem services involved in the ecological policy documents promulgated by cities i and j, respectively; and T t i and T t j denote the time of ecological policy documents promulgated by cities i and j, respectively.
For the purpose of the analysis, the statistical eco-policy linkage data were binarized (in the case of integrated services, Table 3), and data above the mean linkage heat were assigned a value of 1, indicating a significant association, while data below the mean linkage heat were assigned a value of 0, indicating a non-significant association.

3.2.2. Social Network Analysis

A social network analysis is a relatively mature method in the field of social sciences aimed at explaining social phenomena through the analysis of the exchange relationships among actors [42]. In geography, this method is commonly used to study the space of flow [43]. By incorporating social networks into the study of ecological protection networks, it becomes possible to examine the spatial transmission of ecological conservation elements and uncover the flow relationships and transmission patterns between different regions. The social network analysis method primarily utilizes matrices to fulfill its analytical functions by transforming geographical and temporal data into the matrix form through the determination of appropriate network thresholds. Building upon this, the present study employs a social network analysis to analyze the characteristics and structure of the policy transmission flow ecological protection network in the CDPUA. This allows for a deeper understanding of the network’s spatial dynamics and structural patterns.
(1)
Network density: Network density is used to reflect the level of network completeness in a region and the degree of spatial interaction among individual nodes within the network [44]. A higher network density indicates a stronger connection among network members and a more complete urban network. The calculation formula is as follows:
D = i = 1 k   j = 1 k   d ( i , j ) / k ( k 1 )
where D is the network density; k is the city node; and d ( i , j ) represents the number of policy linkages between city i and city j .
(2)
Cohesive subgroups: Cohesive subgroups are a descriptive study of social structures that can reveal the actual or potential relationships or substructures among actors in a social network [45]. When there are close connections among cities within an urban cluster, a secondary cohesive subgroup can form. The presence of cohesive subgroups in a network indicates tight information exchange and transmission among cities within the subgroup.
(3)
Degree centrality: Network centrality can be measured in three forms: degree centrality, betweenness centrality, and closeness centrality [46]. These measures reflect the status and influence of city nodes within the network. Degree centrality refers to the comprehensive connectivity of a node in the network. If a node is connected to multiple nodes, it has a higher degree centrality, which effectively represents the city’s communicative capacity in the region [47]. The calculation formula is as follows:
C D ( n i ) = j = 1 k X i j
where C D ( n i ) is the out-degree and in-degree indicators of point-degree centrality; X i j is the spatial association strength between cities i and j .
(4)
Centrality model: The centrality model of core–periphery structure is capable of measuring the centrality of cities, thereby assessing their level of power within the network. Core cities are situated at the top of the hierarchy, exerting dominant control over the flow of regional resources and playing a leading role in regional development [48]. Periphery cities, on the other hand, are located at the lower end of the hierarchy, possessing the resource elements that core cities require and engaging in resource exchange with them [49].

4. Results

4.1. Analysis of Ecological Protection Network Characteristics

4.1.1. Analysis of the Characteristics of the Integrated Ecological Protection Network

From the integrated ecological protection network of the Chengdu Plain City Cluster’s policy transmission flow (Figure 3), it can be observed that the overall connectivity density in the region exhibits a multi-core triangular pattern, with weak geographical proximity and a network density of 60.71%. The integrated ecological protection network of the city cluster shows a strong interconnected state. However, within the region, there is an imbalance in the connections between cities, with some areas showing strong connectivity while the policy transmission intensity between certain cities is relatively weak. For example, the policy transmission between cities such as Ziyang–Meishan, Mianyang–Meishan, and Deyang–Meishan is significantly weaker compared to other cities, with intensities of 26, 34, and 39, respectively. Additionally, the northeast region exhibits the highest network density, which gradually decreases towards the southeast. The overall ecological protection network of the city cluster is primarily transmitted westward from Suining, which has strong connections with Mianyang, Deyang, Chengdu, Ya’an, and Leshan, with intensity values all above 50. Furthermore, under the strong connectivity between Suining, Chengdu, and Mianyang, a policy transmission triangle is formed, indicating a relatively stable network structure. The city nodes of Ziyang and Meishan in the network exhibit relatively weak connections.

4.1.2. Analysis of Categorized Ecological Protection Network Characteristics

To further demonstrate the characteristics of the spatial network of policy transmission flow in the Chengdu Plain City Cluster, a detailed analysis of each categorized document is conducted. The ecological protection network connectivity strength is divided into four levels using the natural break method, Level 1 connection, Level 2 connection, Level 3 connection, and Level 4 connection, ranked from strong to weak. The network density shows that the density of the comprehensive ecological protection network is the highest at 58.93%. This indicates a broader coverage of protection within the comprehensive service network, suggesting that cities have a strong level of connectivity within this network (Table 4). However, the overall density is relatively low, indicating that there is still significant room for development. The climate regulation protection network follows with a density of 53.57%. As the economic scale increases, cities are experiencing extreme weather events. In order to effectively enhance climate risk prevention and resilience, cities have strengthened environmental governance in key areas and implemented actions to adapt to climate change. They have issued a series of policies to improve the climate change governance system and framework. The protection network for grain production exhibits the lowest density at 21.43%. Food security is an important foundation for national security. Currently, there are relatively few policy documents related to ecological protection in the context of food production, mostly consisting of guiding principles. In the future, it is necessary to accelerate the construction of a higher-level, higher-quality, more efficient, and sustainable food security system. The integration of ecological security and food security should be emphasized. This approach can effectively alleviate the pressure on the ecological environment while ensuring national food security and the effective supply of key agricultural products.
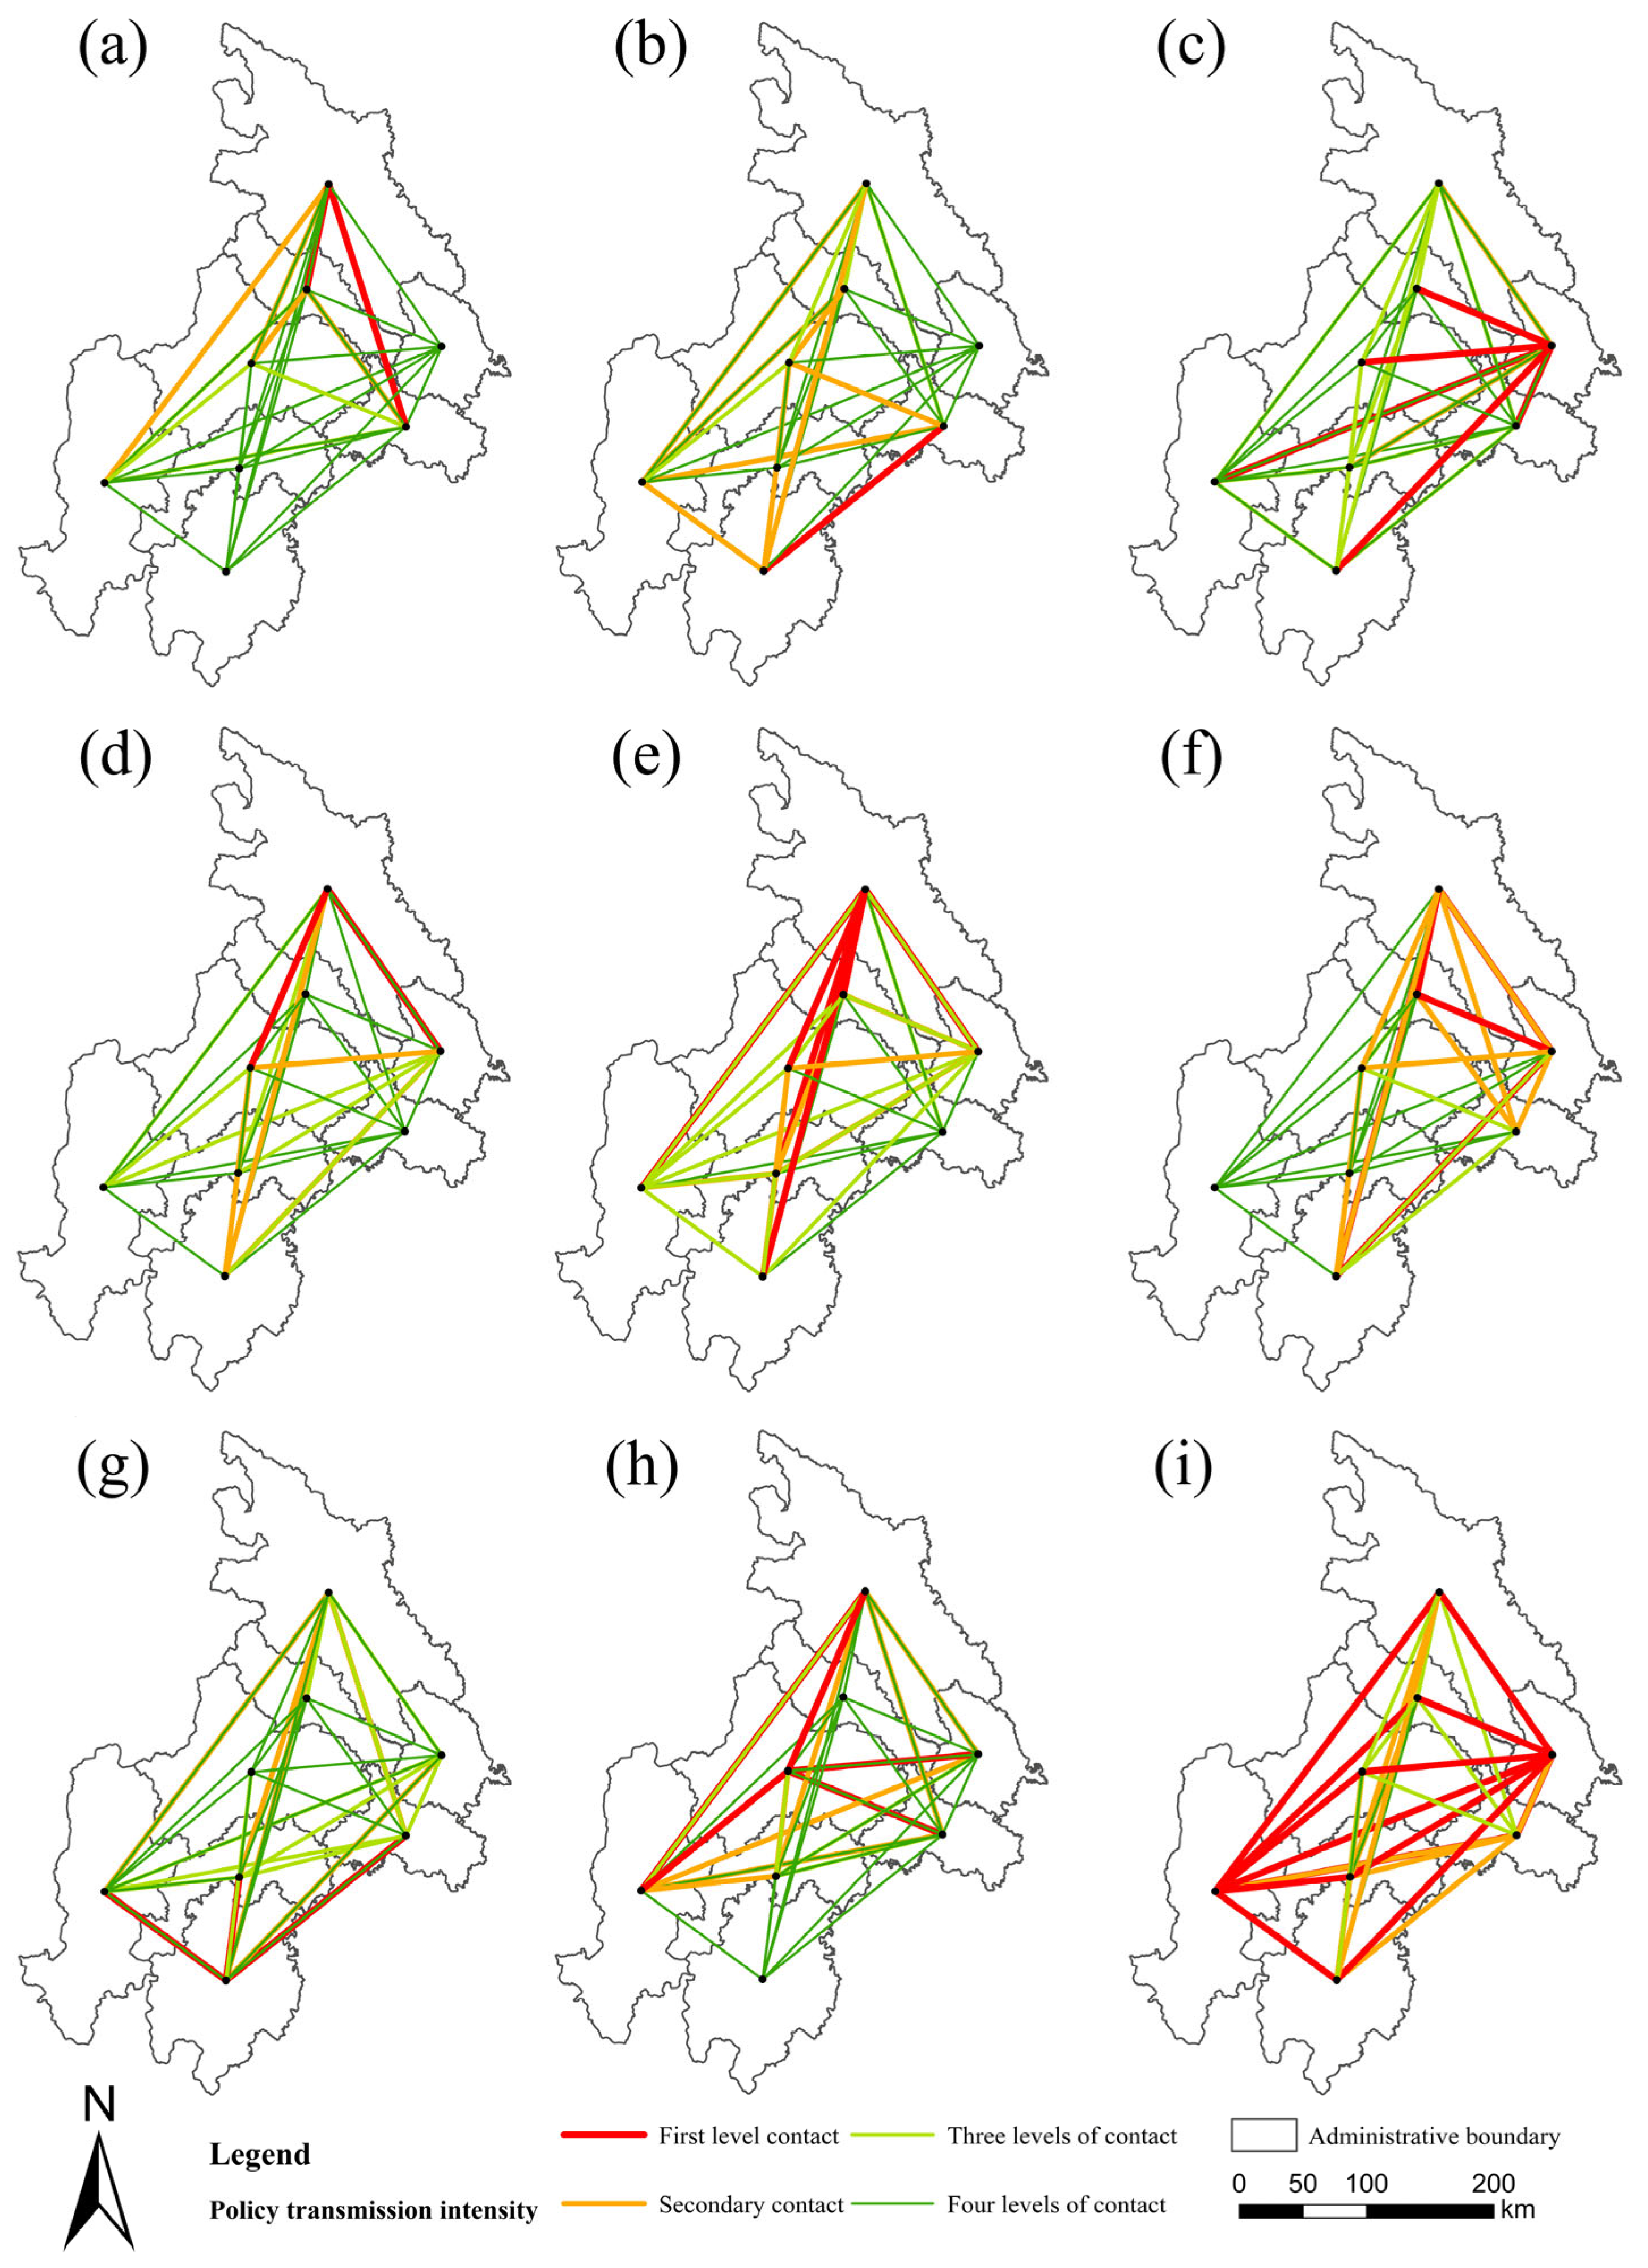
The first-level connections of the ecological protection network in different categories exhibit three types of spatial structures (Figure 4), “V”-shaped, single-center, and multi-center. Among them, the networks for grain production, gas regulation, and hydrological regulation show a “V”-shaped spatial structure. The networks for soil erosion control and climate regulation exhibit a single-center radial spatial structure. The networks for the water supply, environmental purification, provision of an aesthetic landscape, and comprehensive services display a multi-center radial spatial structure.

4.2. Ecological Protection Network Point-Degree Centrality Analysis

4.2.1. Point-Degree Centrality Analysis of the Integrated Ecological Protection Network

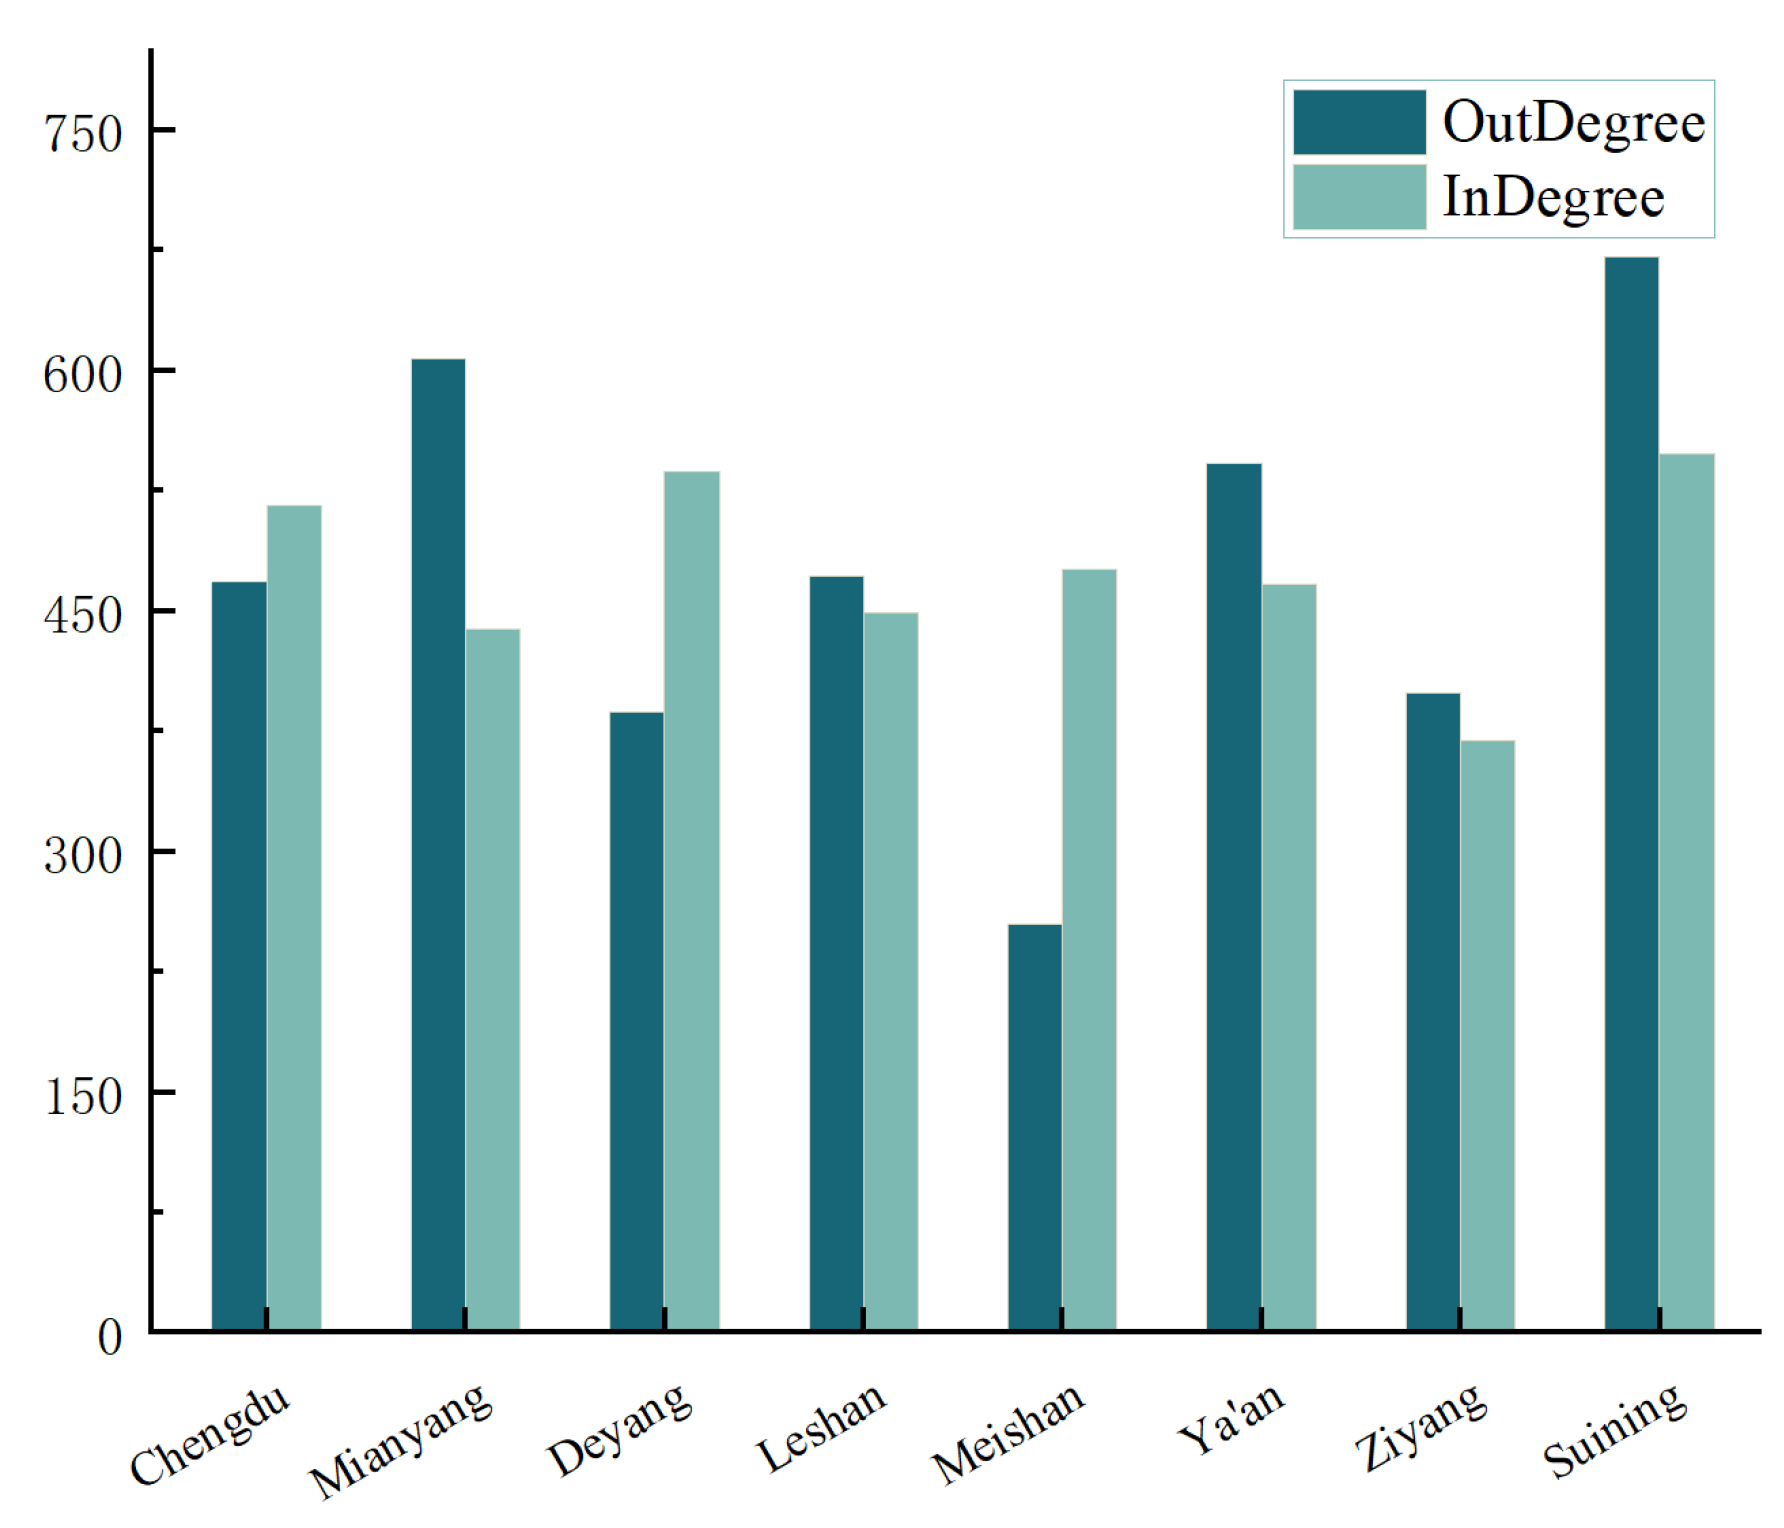
By analyzing the degree centrality (out-degree and in-degree) of the CDPUA, we can evaluate its ecological protection network characteristics (Figure 5). In this context, out-degree expresses the ability of transmission, while in-degree signifies the capacity for aggregation. Within the integrated ecological protection network of policy transmission flow, the cities of Suining, Mianyang, and Ya’an exhibit the strongest external connectivity. Among them, Suining has the highest overall comprehensive degree centrality within the network, while Mianyang’s connectivity is second only to Suining. Ya’an, on the other hand, is an ecologically advantaged city within the CDPUA. It places great importance on environmental protection and influences the urban ecosystem through policy implementation, which further extends to surrounding cities. In contrast, the cities of Meishan, Deyang, and Ziyang have weaker connectivity, resulting in relatively less impact on other cities within the urban agglomeration. They can be considered as weak conduits for ecological protection transmission within the CDPUA, with policies primarily affecting the local ecosystem and having limited communication with the outside world. Within the integrated ecological protection network, the cities of Suining, Deyang, and Chengdu exhibit strong attracting capabilities. Among them, Suining also possesses strong transmission capacity and occupies an important position in the policy transmission flow. Deyang, being adjacent to Suining, takes full advantage of its absorptive effects and actively explores ecological protection policy strategies, becoming a major beneficiary city that benefits from Suining’s transmission efficiency. Ziyang has the weakest aggregation capacity and should accelerate its integration with other cities in terms of ecosystem services, in order to enhance its own capacity for ecological protection within the urban agglomeration.

4.2.2. Point-Degree Centrality Analysis of Classified Ecological Protection Networks

The CDPUA has formed a diverse classification of ecological protection networks with multiple cities taking the lead. The core cities for the flow of elements between different types of ecosystem services vary. There are differences in the ecological protection network system within the urban agglomeration, and overall, it exhibits a relatively balanced development trend (Figure 6).
Based on the node in-degree and out-degree results in the classified ecological protection network of the CDPUA, there are significant differences in policy transmission capabilities among cities. In the comprehensive service network, Suining, Ya’an, Chengdu, and Ziyang exhibit strong transmission capabilities, with high out-degree values, radiating ecological environmental protection to the surrounding areas. They serve as core nodes for ecological protection. Cities with strong aggregating capabilities include Meishan, Deyang, Ya’an, and Suining, where they can acquire more information or resources from other city nodes. In the climate regulation and gas regulation network, Mianyang occupies a central position in transmission, with its out-degree value being higher than other cities. In the hydrological regulation network, Leshan has the highest out-degree, indicating the strongest transmission capability in terms of hydrological regulation. It can transfer ecological system protection elements to other city nodes. In the network providing aesthetic landscapes, Chengdu demonstrates the strongest aggregating capability, signifying its effectiveness in developing ecological civilization, such as the Park City and Excellent Cultural Tourism City initiatives. Chengdu is an active region in the cultural service network of ecological protection.

4.3. Analysis of Cohesive Subgroups

Using the Concor algorithm in Ucinet6 software, we conducted a cohesive subgroup analysis of the ecological protection network. This analysis describes the clustering phenomenon when relationships between certain actors in the network are so close that they form a secondary group. In this study, the actors are the cities in the CDPUA. In a social network analysis, such a group is called a cohesive subgroup. If the network has cohesive subgroups and the density of these subgroups is high, it indicates that the actors within these subgroups have close connections and frequent interactions in terms of information sharing and cooperation.
This study found that in the integrative ecological protection network of policy transmission flow in the CDPUA, there are three cohesive subgroups as shown in Figure 7: Deyang and Meishan, Mianyang and Suining, and Ya’an and Ziyang. Overall, the network structure is relatively tight, which facilitates the transmission of ecological protection element information and improves network efficiency. Deyang and Meishan are both located in the vicinity of Chengdu and have developed agriculture. They are also important tourist destinations. Mianyang and Suining are adjacent to each other and both are located in the upper reaches of the Min River Basin. They jointly build the ecological security pattern of the Fujiang River Eco-Belt. Ya’an and Ziyang are closely related in terms of soil conservation ecosystem services elements. However, neither Leshan nor Chengdu is included in any cohesive subgroup within the policy transmission flow ecological protection network. Leshan has less close connections with other cities and cannot form urban agglomeration subgroups, which to some extent affects the transmission of ecological protection elements and protection efficiency. Chengdu has relatively balanced connections with other cities and has not formed any cohesive subgroup.
There are three cohesive subgroups in the six categories of classified ecological protection networks, four cohesive subgroups in the two categories of classified networks, and two cohesive subgroups in the one category of classified networks (Figure 8). Among them, Chengdu is involved in two or more cohesive subgroups in the classified ecological protection network with Mianyang, Deyang, Suining, and Ya’an, indicating a relatively close connection between Chengdu and these cities. Ziyang, on the other hand, does not form subgroups with other cities in the climate regulation, gas regulation, grain production, and hydrological regulation categories of the ecological protection network, indicating weaker connections with other cities in terms of ecological protection elements.

4.4. Core–Periphery Structure Analysis

By analyzing the core–periphery structure of the policy transmission flow ecological protection network in the CDPUA using the Core/Periphery algorithm in Ucinet6 software, it was found that the core block cities include Chengdu, Deyang, Mianyang, Leshan, Suining, and Ya’an. These core cities are mainly located in the northern and southern regions of the urban agglomeration, comprising provincial capital cities, economically developed cities, and cities with abundant ecological resources. The majority of cities in the urban agglomeration are located within the core block, indicating a compact core structure of the network. However, Meishan in the central–southern region and Ziyang in the eastern region are situated in the peripheral areas of the ecological protection network. These cities have relatively weaker economic development and ecological resources compared to other cities, hence their position at the network’s periphery. This suggests that the core–periphery structure of the ecological protection network may be influenced by urban ecological resources and social development. Additionally, there is still connectivity between the peripheral and core cities, with the potential for future connections. The transmission effect of ecological policies helps to make the structure of the ecological protection network more compact and stable.
The core–periphery structure of the classified ecological protection network in the CDPUA, as depicted in Table 5, reveals that the core cities in the policy transmission flow are primarily Chengdu, Deyang, Mianyang, Leshan, and Ya’an, while the peripheral cities include Meishan, Suining, and Ziyang. In terms of water resource provisioning and gas regulation, the edge cities of Meishan, Suining, Mianyang, and Ziyang exhibit similar distributions, while for climate regulation, Ziyang is the only edge city. Chengdu, Deyang, and Mianyang enjoy advantageous geographical locations, convenient transportation and logistics, and significant policy support and investment. Therefore, they are more likely to become the core cities of the ecological protection network. On the contrary, other cities are located farther away from the central cities of the urban agglomeration, lacking investment and policy support, which positions them as peripheral cities within the network. It is important to consider the peripheral cities in the planning and development of subsequent ecological environmental protection efforts, and to explore suitable strategies and mechanisms to compensate for policy deficiencies.

5. Discussion and Conclusions

With the rapid societal transformation and the demand for high-quality development, the flow of various spatial elements has become more frequent [50]. While past research has explored urban networks, there has been a lack of research from the perspective of policy transmission flow. Under the influence of human activities and self-regulation within ecosystems, the structure and function of urban ecological spaces have undergone significant changes [51], resulting in a more complex and diverse regional ecological space network [52].
When constructing ecological networks, scholars have typically used a research framework based on the “ecological source area–resistance surface–corridor construction” to establish physical spatial ecological networks to ensure ecological security [53]. The innovation in this study lies in the introduction of policy documents to obtain data on policy information between urban clusters. This study constructs an ecological protection network from the perspective of the policy “transmission flow”. This approach relies on collaboration among various stakeholders, information sharing, and resource integration to establish a cooperative network relationship. Research on regional policy networks has shown that the strength and structure of inter-regional connections significantly influence policy outcomes. This validates the approach of mapping and analyzing policy networks to understand ecological protection efforts.
This study first selects the urban agglomeration in western China as the research area for ecological protection policy transmission flow, identifying the transmission relationships of ecological protection elements among cities and revealing the structure and characteristics of the ecological protection network within the urban agglomeration. Specifically, the comprehensive ecological protection network of policy transmission flow in the CDPUA presents a multi-core and east–west linkage density disparity spatial pattern. The overall linkage density of the comprehensive ecological protection network in the urban agglomeration is 60.71%, indicating a strong linkage state.
The classified protection networks in the CDPUA exhibit three main spatial structures: “V” shape, single-center radial, and multi-center radial. By employing degree centrality, cohesive subgroups, and core–periphery structure analyses, this study finds that there are three cohesive subgroups in the comprehensive ecological protection network of the CDPUA, indicating a relatively tight network structure. In the classified protection networks, six categories have three cohesive subgroups, two categories have four cohesive subgroups, and one category has two cohesive subgroups.
The analysis of the core–periphery structure of the ecological protection network indicates that the core cities in the classified networks of the CDPUA are mainly Chengdu, Deyang, Mianyang, Leshan, and Ya’an, while the peripheral cities are Meishan, Suining, and Ziyang. By fostering regional cooperation and building network relationships, resource sharing, information sharing, and shared risk-taking can be achieved, thereby reinforcing the regional ecological security pattern [54]. Furthermore, enhancing the density and connection strength of interurban flow space networks and strengthening regional collaborative development are essential goals.
By constructing an ecological protection network in the CDPUA, we can analyze the urban network structure and identify its weak points. This allows for the effective implementation of policy transmission, thereby building a robust ecological protection network. This will help local governments strengthen regional cooperation and governance, adjust network structures, and optimize regional resource allocation, ultimately achieving high-quality social development. The formulation and promotion of the policy transmission network can effectively advance regional ecological protection efforts, with the demonstrative effect of policies being particularly important. Once the demonstration is successful, the policy transmission will be more refined, becoming an important measure and approach in social governance and ecological construction. However, effective governance requires not only a strong policy framework but also the willingness and capacity to execute these policies. The structure of the policy transmission network is just one crucial aspect influencing regional policy effectiveness. It is also necessary to consider potential discrepancies between policy intentions and actual actions during implementation.
Based on the above analysis, the following policy recommendations are proposed:
  • Strengthen the construction of the ecological protection network and enhance regional cooperative governance capabilities. Governments and relevant institutions should enhance the formulation and implementation of ecological protection policies, ensuring a smooth transmission and execution of policies between cities, promoting resource sharing and information exchange among cities, thereby improving the overall level of regional ecological protection.
  • Improve the execution and effectiveness of ecological protection policies. Local governments should strengthen their execution capabilities, clearly define responsibilities, and improve the efficiency and effectiveness of policy implementation.
  • Promote diversified cooperation and establish cross-regional ecological protection coordination mechanisms. Actively promote cooperation between cities, build cross-regional ecological protection coordination mechanisms, and enhance coordination and cooperation among cities in ecological protection.
By implementing the above policy measures, the ecological protection network of the CDPUA can be further improved, enhancing regional ecological quality and achieving sustainable and high-quality regional development goals.
The study of policy flow can reveal the complex mechanisms involved in policy formulation and dissemination, enhance the effectiveness of policy implementation, aid in regional policy coordination, and provide new perspectives for policy development and the field of social science. However, this study does have some limitations. One major limitation is its heavy reliance on the analysis of policy document content. While this approach provides valuable insights into the policy landscape, it does not consider the actual implementation of policies and their specific effects, which may vary among cities due to differences in execution capabilities and timing. To address this limitation and obtain a more comprehensive understanding of the actual impacts of policies, future research can consider combining a policy document analysis with field surveys and data collection. This would enable a more in-depth evaluation of policy effectiveness in practice and a better understanding of the outcomes of ecological protection actions.
In conclusion, this study focuses on the ecological protection network formed by policy transmission flow among cities in the CDPUA in western China. By examining regional urban ecological space organization theory, it extracts the characteristics of regional ecological relationships from the perspective of policy transmission flow, exploring pathways for collaborative urban ecological environment protection. The findings highlight the need for coordinated efforts in physical and policy-driven ecological networks to enhance regional ecological security and sustainability. The insights gained from this research provide a valuable reference for policymakers and stakeholders in their efforts to improve regional ecological environment quality and build robust ecological networks.

Author Contributions

Conceptualization, L.H.; Data curation, Y.D.; Methodology, L.H.; Writing—original draft, Y.D.; Writing—review and editing, L.H. and Y.D.; Supervision, X.W.; Resources, T.L., Y.X. and J.W. All authors have read and agreed to the published version of the manuscript.

Funding

This research was funded by the Postgraduate Innovation Fund Project by Southwest University of Science and Technology (grant number: 124ycx1116).

Institutional Review Board Statement

Not applicable.

Informed Consent Statement

Not applicable.

Data Availability Statement

The data presented in this study are available on request from the corresponding author.

Conflicts of Interest

The authors declare no conflicts of interest.

References

  1. Guo, M.; Cong, X.; Zheng, H.; Zhang, M.J.; Wang, L.J.; Gong, J.W.; Ma, S. Integrating the ordered weighted averaging method to establish an ecological security pattern for the Jianghuai ecological economic zone in China: Synergistic intraregional development. Ecol. Indic. 2022, 135, 108543. [Google Scholar] [CrossRef]
  2. Yu, H.; Huang, J.; Ji, C.; Li, Z.A. Construction of a landscape ecological network for a large-scale energy and chemical industrial base: A case study of Ningdong, China. Land 2021, 10, 344. [Google Scholar] [CrossRef]
  3. Fang, C.L. Progress and the future direction of research into urban agglomeration in China. Acta Geogr. Sin. 2014, 69, 1130–1144. [Google Scholar]
  4. Ran, Z.; Gao, S.; Zhang, B.; Guo, C.; Ouyang, X.; Gao, J. Non-linear effects of multi-dimensional urbanization on ecosystem services in mega-urban agglomerations and its threshold identification. Ecol. Indic. 2023, 154, 110846. [Google Scholar] [CrossRef]
  5. Feng, Y.W.; Zhen, J.H.; Ma, C.Y. Research on Spatial Optimization of Urban Ecological Security Pattern in Arid Area—A Case Study of Hohhot City, Inner Mongolia. Res. Soil Water Conserv. 2020, 27, 336–341. [Google Scholar]
  6. Zeng, X.; Ma, Y.; Ren, J.; He, B. Assessing the network characteristics and structural effects of eco-efficiency: A case study in the urban agglomerations in the middle reaches of Yangtze River, China. Ecol. Indic. 2023, 150, 110169. [Google Scholar] [CrossRef]
  7. Castells, M. The Informational City: Information Technology, Economic Restructuring, and the Urban-Regional Process; Blackwell: Oxford, UK, 1989. [Google Scholar]
  8. Townsend, A.M. Network cities and the global structure of the Internet. Am. Behav. Sci. 2001, 44, 1697–1716. [Google Scholar] [CrossRef]
  9. Shen, L.Z.; Gu, C.L. Integration of Regional Space of Flows and Construction of Global Urban Network. Sci. Geogr. Sin. 2009, 29, 787–793. [Google Scholar]
  10. Wang, Y.; Niu, X.Y.; Song, X.D. Research Progress on Regional Spatial Structure from the Perspective of “Flow Space”. Int. Urban Plan. 2017, 32, 27–33. [Google Scholar] [CrossRef]
  11. Li, Y.; Li, T.; Qiu, M.L.; Li, J.Y.; Cao, X.S. The Impact of Intercity Interaction on Urban Space Growth in the Guanzhong Plain Urban Agglomeration Based on Traffic Flows. Hum. Geogr. 2023, 38, 147–157. [Google Scholar]
  12. Liang, L.; Zhao, Y.B.; Wu, X.J. Research on the Temporal and Spatial Characteristics of Beijing-Tianjin-Hebei City Network from the Perspective of Population Flow: A Comparison Before and After the Establishment of Xiong’an New Area. Econ. Manag. 2019, 33, 1–8. [Google Scholar]
  13. Wei, G.E.; Sun, P.J.; Zhang, Z.K. Comprehensive Comparative Study on the Core System of Metropolitan Areas: A Case Study of the Three Metropolitan Areas in the Middle Reaches of the Yangtze River. Resour. Environ. Yangtze Basin 2021, 30, 11. [Google Scholar]
  14. Castells, M. Globalisation, networking, urbanisation: Reflections on the spatial dynamics of the information age. Urban Stud. 2010, 47, 2737–2745. [Google Scholar] [CrossRef]
  15. Vanli, T.; Akan, T. Mapping synergies and trade-offs between smart city dimensions: A network analysis. Cities 2023, 142, 104527. [Google Scholar] [CrossRef]
  16. Wang, N.N.; Chen, R.; Zhao, Y. Internet Information Space Network Analysis Based on Information Flow. Geogr. Res. 2016, 35, 137–147. [Google Scholar]
  17. Wu, X.; Wang, L.J.; Ning, Y.X.; He, Y. From Social Network to Geographic Network: An Analysis of Sina Weibo Users in Colleges and Universities in Nanjing. Econ. Geogr. 2020, 40, 83–95. [Google Scholar]
  18. An, D.; Hu, Y.J.; Wan, Y. Research on the Structural Characteristics of China’s Urban Information Flow Network Space: Based on Denoising Processing and Directed Network Analysis Methods. World Reg. Stud. 2024, 33, 134–148. [Google Scholar]
  19. Ma, S.; Long, Y. Functional urban area delineations of cities on the Chinese mainland using massive Didi ride-hailing records. Cities 2020, 97, 102532. [Google Scholar] [CrossRef]
  20. Ma, W.; Fang, Z.; Zhang, X. Comparative analysis of structural characteristics of China’s 18 typical urban agglomerations based on flows of various elements. Ecol. Model. 2023, 479, 110308. [Google Scholar] [CrossRef]
  21. Wei, X.; Xi, G.L.; Zhen, F. Study on the Coupling Relationship Between Commercial System and Actual Service Population Mobility. Econ. Geogr. 2022, 42, 10. [Google Scholar]
  22. Mashizi, A.K.; Sharafatmandrad, M. Dry forests conservation: A comprehensive approach linking ecosystem services to ecological drivers and sustainable management. Glob. Ecol. Conserv. 2023, 47, e02652. [Google Scholar]
  23. Xiao, J.; Song, F.; Su, F.; Wei, C. Exploring the interaction mechanism of natural conditions and human activities on wetland ecosystem services value. J. Clean. Prod. 2023, 426, 139161. [Google Scholar] [CrossRef]
  24. Mekuria, W.; Gedle, A.; Tesfaye, Y.; Phimister, E. Implications of changes in land use for ecosystem service values of two highly eroded watersheds in Lake Abaya Chamo sub-basin, Ethiopia. Ecosyst. Serv. 2023, 64, 101564. [Google Scholar] [CrossRef]
  25. Zhang, Y.; Hu, X.; Wei, B.; Zhang, X.; Tang, L.; Chen, C.; Wang, Y.; Yang, X. Spatiotemporal exploration of ecosystem service value, landscape ecological risk, and their interactive relationship in Hunan Province, Central-South China, over the past 30 years. Ecol. Indic. 2023, 156, 111066. [Google Scholar] [CrossRef]
  26. Zhai, Y.; Li, W.; Shi, S.; Gao, Y.; Chen, Y.; Ding, Y. Spatio-temporal dynamics of ecosystem service values in China’s Northeast Tiger-Leopard National Park from 2005 to 2020: Evidence from environmental factors and land use/land cover changes. Ecol. Indic. 2023, 155, 110734. [Google Scholar] [CrossRef]
  27. Richter, F.; Jan, P.; El Benni, N.; Lüscher, A.; Buchmann, N.; Klaus, V.H. A guide to assess and value ecosystem services of grasslands. Ecosyst. Serv. 2021, 52, 101376. [Google Scholar] [CrossRef]
  28. Xu, Y.; Xie, Y.; Wu, X.; Xie, Y.; Zhang, T.; Zou, Z.; Zhang, R.; Zhang, Z. Evaluating temporal-spatial variations of wetland ecosystem service value in China during 1990–2020 from the donor side based on cosmic exergy. J. Clean. Prod. 2023, 414, 137485. [Google Scholar] [CrossRef]
  29. Nesshöver, C.; Assmuth, T.; Irvine, K.N.; Rusch, G.M.; Waylen, K.A.; Delbaere, B.; Wittmer, H. The science, policy and practice of nature-based solutions: An interdisciplinary perspective. Sci. Total Environ. 2017, 579, 1215–1227. [Google Scholar] [CrossRef]
  30. Fang, X.; Li, J.; Ma, Q.; Zhou, R.; Du, S. A quantitative review of nature-based solutions for urban sustainability (2016–2022): From science to implementation. Sci. Total Environ. 2024, 927, 172219. [Google Scholar] [CrossRef]
  31. Armah, M.; Bossman, A.; Amewu, G. Information flow between global financial market stress and African equity markets: An EEMD-based transfer entropy analysis. Heliyon 2023, 9, e13899. [Google Scholar] [CrossRef]
  32. Zhao, Z.; Chen, J.C.; Bai, Y.P.; Liu, Y.; Wang, J.Y.; Li, M.H. Combing and Evaluation of Ecological Grass Husbandry Policy in Inner Mongolia—Based on Method of Social Network Analysis. Resour. Dev. Mark. 2019, 4, 7. [Google Scholar]
  33. Xie, G.D.; Zhang, C.X.; Zhang, C.S.; Xiao, Y.; Lu, C.X. The value of ecosystem services in China. Resour. Sci. 2015, 37, 1740–1746. [Google Scholar]
  34. Chengdu Municipal Bureau of Ecological Environment. Notice on Delineating High Polluting Fuel Burning Ban Zones; Chengdu Municipal Bureau of Ecological Environment: Chengdu, China, 2015. [Google Scholar]
  35. Chengdu Municipal Bureau of Ecological Environment. Notice on Restricted Areas and Time Periods for High Pollution Vehicles; Chengdu Municipal Bureau of Ecological Environment: Chengdu, China, 2015. [Google Scholar]
  36. Chengdu Municipal Bureau of Ecological Environment. Implementation Plan for the Construction of Hazardous Waste Centralized Disposal Facilities in Mianyang City (2017–2022); Chengdu Municipal Bureau of Ecological Environment: Chengdu, China, 2017. [Google Scholar]
  37. Chengdu Municipal Bureau of Ecological Environment. Interim Measures for the Rapid Response Management of Environmental Quality “Measurement and Management Collaboration” in Mianyang City; Chengdu Municipal Bureau of Ecological Environment: Chengdu, China, 2017. [Google Scholar]
  38. Ziyang Municipal People’s Government Office. Administrative Interview Measures for Ecological Environment Protection in Ziyang City. 2022. Available online: http://gk.ziyang.gov.cn/policy/details.aspx?id=1179 (accessed on 3 December 2022).
  39. Ya’an Forestry Bureau. The 13th Five Year Plan for Forestry Development in Ya’an City. 2016. Available online: https://www.yaan.gov.cn/gongkai/show/20161031172458-755237-00-000.html (accessed on 3 December 2022).
  40. Ya’an Municipal People’s Government Office. Notice on Issuing the “14th Five Year Plan for Water Safety Guarantee in Ya’an City”. 2022. Available online: https://www.yaan.gov.cn/gongkai/show/9c64c6c6d8d15bf5c6c188a51bc16e95.html (accessed on 3 December 2022).
  41. Wang, Y.Z.; Wang, H.J.; Zhang, B.; Huang, X.X. Analysis on the Network Structure of Urban Agglomeration and Its Influencing Factors Based on the Perspective of Multi-dimensional Feature Flow: Taking Wuhan Urban Agglomeration as an Example. Econ. Geogr. 2021, 41, 68–76. [Google Scholar]
  42. Wang, Z.H.; Qiao, H.H.; Zhang, S.S.; Gao, Y. Evolution of spatial pattern of inbound tourism flows and enlightenment of high-quality development of metropolitan tourism: Acase stady of Shanghai. J. Nat. Resour. 2022, 37, 3167–3182. [Google Scholar] [CrossRef]
  43. Xu, C.; Li, J.; Chen, J.; Yang, Q. Air pollution in heterogenous Chinese cities: Complex network, novel driver and decoupling nexus. Ecol. Indic. 2023, 156, 111077. [Google Scholar] [CrossRef]
  44. Yao, Y.; Guo, Z.; Huang, X.; Ren, S.; Hu, Y.; Dong, A.; Guan, Q. Gauging urban resilience in the United States during the COVID-19 pandemic via social network analysis. Cities 2023, 138, 104361. [Google Scholar] [CrossRef]
  45. Sun, J.P.; Hou, L.G. Research on Characteristics of Network Structure of Chengdu—Chongqing Urban Agglomeration Based on Tencent Population Migration Data. Mod. Urban Res. 2020, 9, 78–85. [Google Scholar]
  46. Yuan, J.; Chen, K.; Li, W.; Ji, C.; Wang, Z.; Skibniewski, M.J. Social network analysis for social risks of construction projects in high-density urban areas in China. J. Clean. Prod. 2018, 198, 940–961. [Google Scholar] [CrossRef]
  47. Rachman, Z.A.; Maharani, W. The analysis and implementation of degree centrality in weighted graph in Social Network Analysis. In Proceedings of the 2013 International Conference of Information and Communication Technology (ICoICT), Bandung, Indonesia, 20–22 March 2013; IEEE: Piscataway, NJ, USA, 2013; pp. 72–76. [Google Scholar]
  48. Su, L.; Stepchenkova, S.; Dai, X. The core-periphery image of South Korea on the Chinese tourist market in the times of conflict over THAAD. J. Destin. Mark. Manag. 2020, 17, 100457. [Google Scholar] [CrossRef]
  49. Dominiak, J. Human and social capital in urban agglomeration and its changes in the core-peripheries pattern. The example of Poznań agglomeration. City Cult. Soc. 2020, 23, 100371. [Google Scholar] [CrossRef]
  50. Zheng, L.; Long, F.; Zhang, S. Comparison of the spaces of call and traffic flows: An empirical study of Qianzhong urban region, China. Cities 2020, 107, 102927. [Google Scholar] [CrossRef]
  51. Zheng, S.; Yang, S.; Ma, M.; Dong, J.; Han, B.; Wang, J. Linking cultural ecosystem service and urban ecological-space planning for a sustainable city: Case study of the core areas of Beijing under the context of urban relieving and renewal. Sustain. Cities Soc. 2023, 89, 104292. [Google Scholar] [CrossRef]
  52. Chen, H.; Yan, W.; Li, Z.; Wende, W.; Xiao, S. A framework for integrating ecosystem service provision and connectivity in ecological spatial networks: A case study of the Shanghai metropolitan area. Sustain. Cities Soc. 2024, 100, 105018. [Google Scholar] [CrossRef]
  53. Kongjian, Y. Landscape ecological security patterns in biological conservation. Acta Ecol. Sin. 1999, 19, 8–15. [Google Scholar]
  54. Kang, J.; Zhang, X.; Zhu, X.; Zhang, B. Ecological security pattern: A new idea for balancing regional development and ecological protection. A case study of the Jiaodong Peninsula, China. Glob. Ecol. Conserv. 2021, 26, e01472. [Google Scholar] [CrossRef]
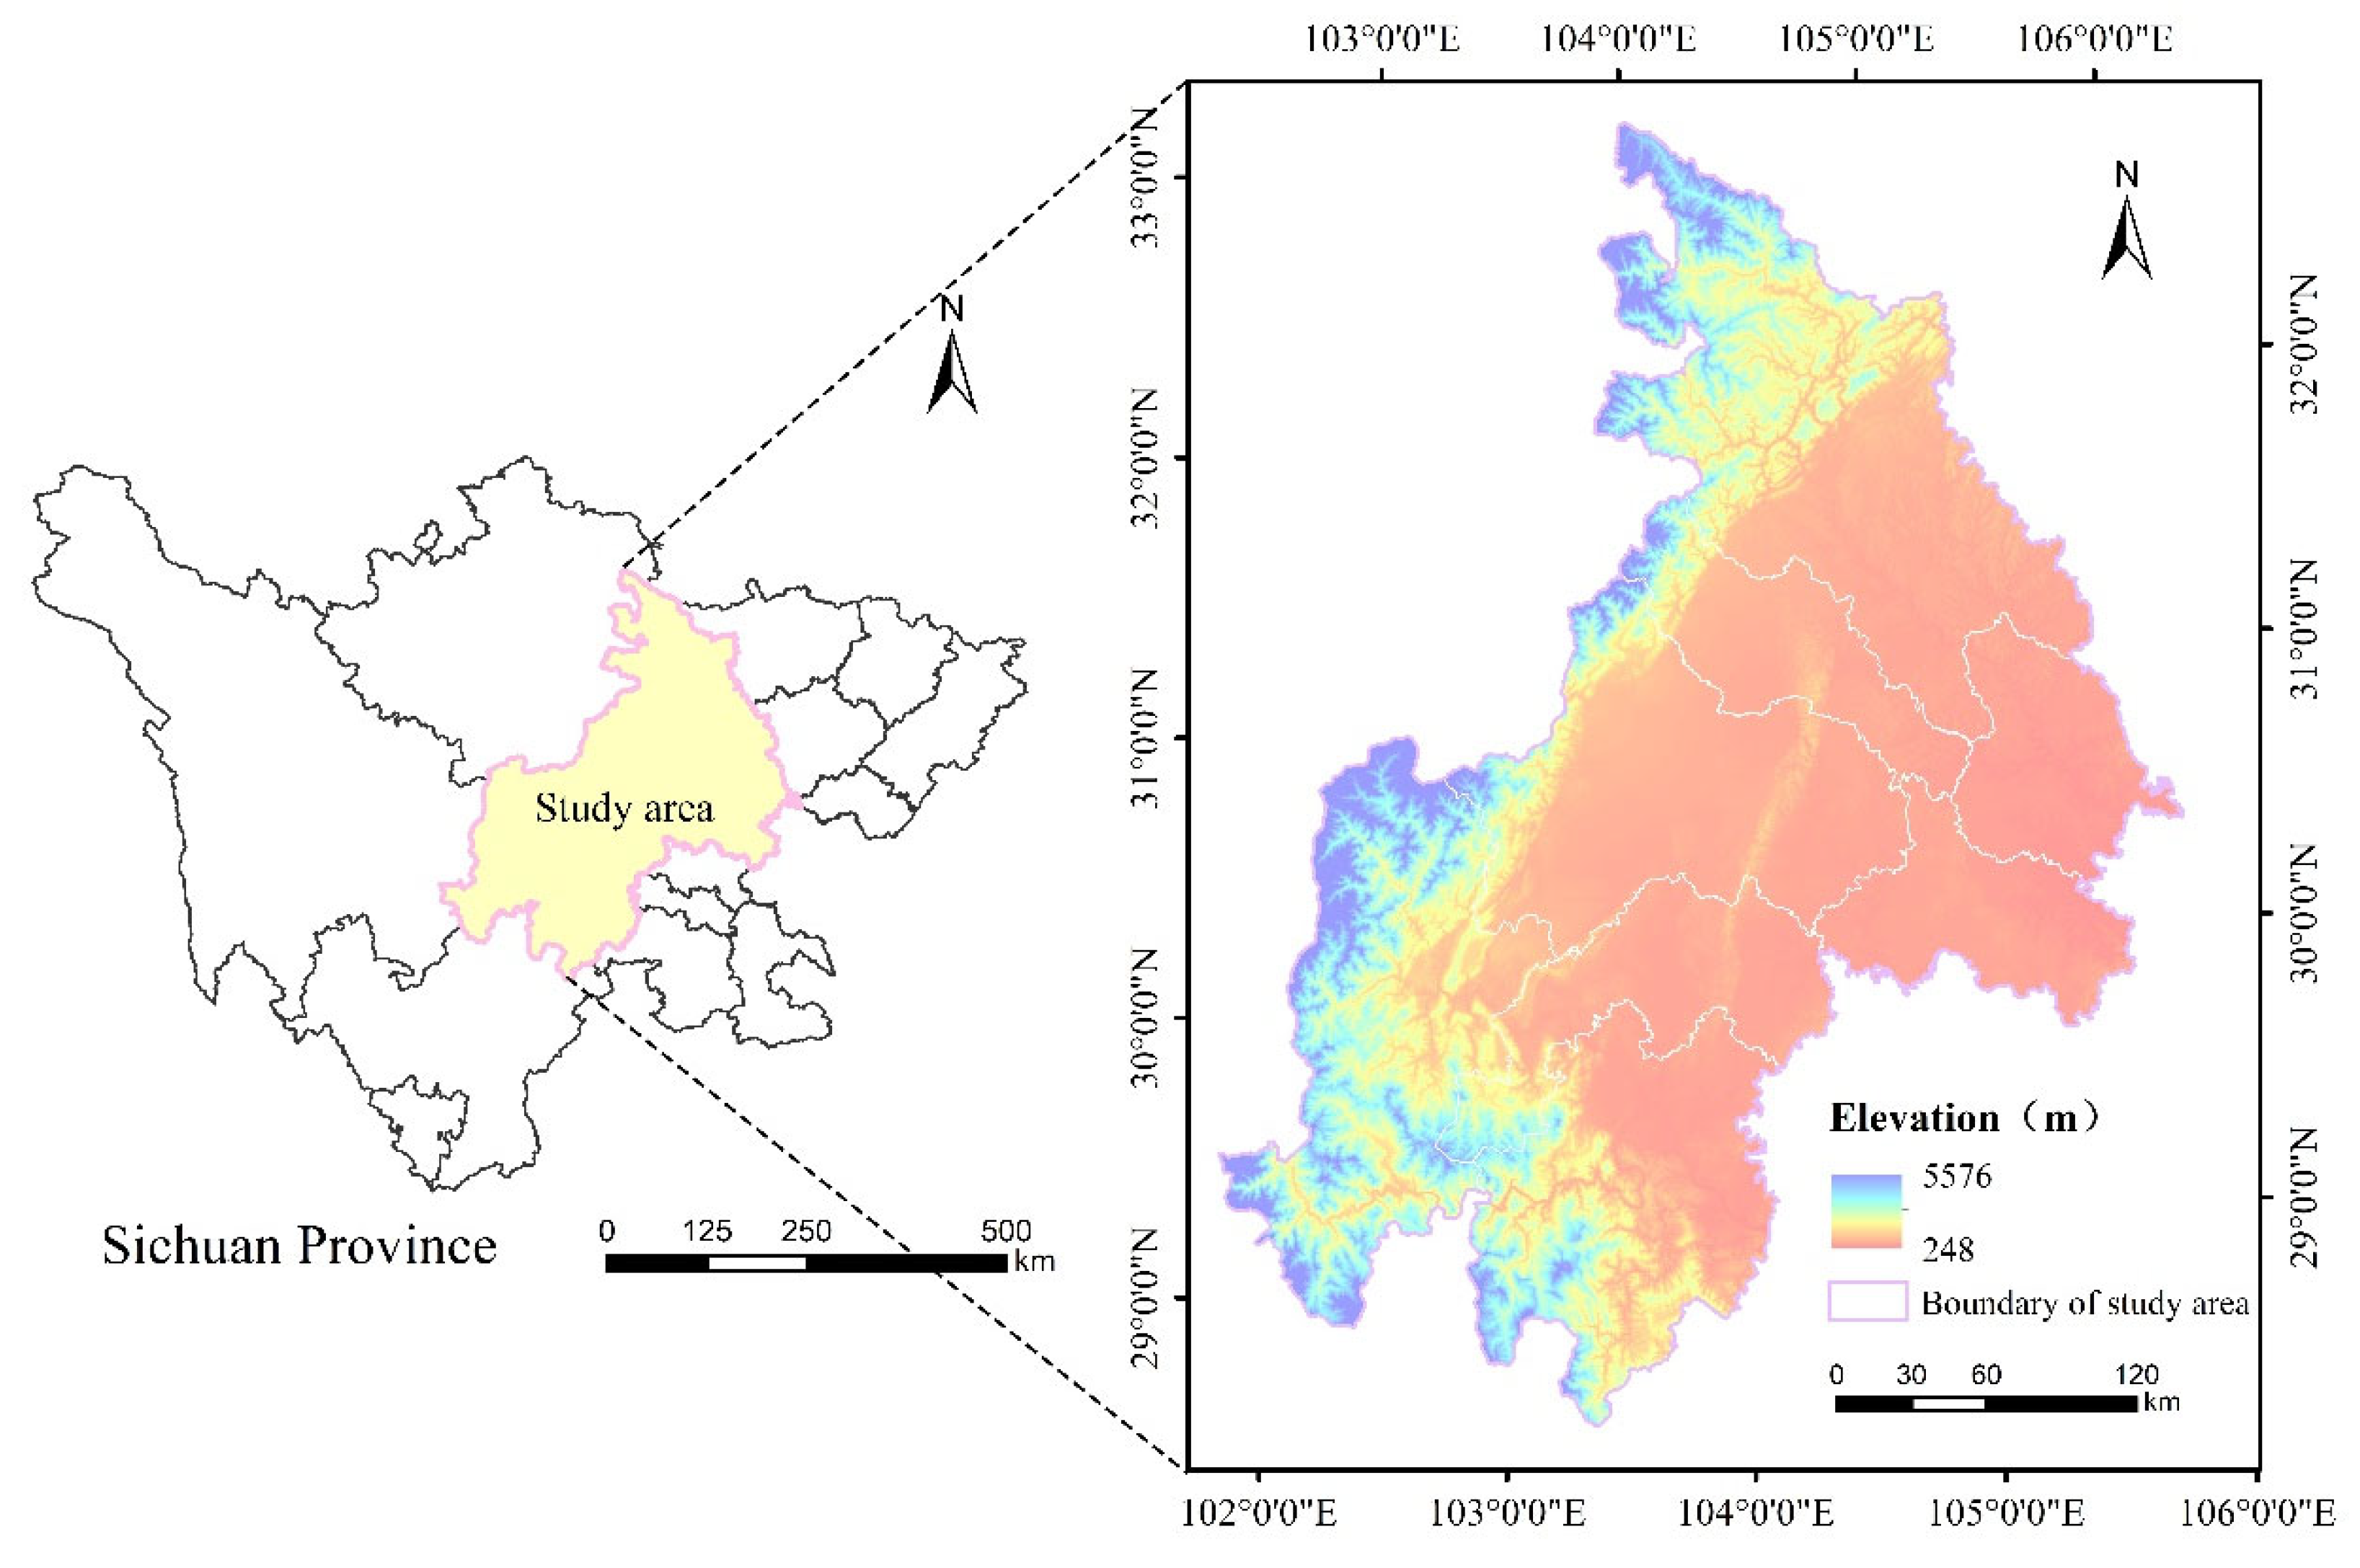
Figure 1. Geographical location of the Chengdu Plain urban agglomeration.
Sustainability 16 05398 g001
Figure 2. The study framework and technical methodology.
Sustainability 16 05398 g002
Figure 3. Spatial characteristics of the integrated ecological protection network of policy transmission flow in the Chengdu Plain urban agglomeration.
Sustainability 16 05398 g003
Figure 4. Spatial characteristics of the ecological protection network of the Chengdu Plain urban agglomeration’s classified ecosystem services element policy transmission flow, Grain production (a), Water supply (b), Soil erosion control (c), Gas regulation (d), Climate regulation (e), Environment purification (f), Hydrological regulation (g), Providing of aesthetic landscape (h), Comprehensive services (i).
Sustainability 16 05398 g004
Figure 5. Point-degree centrality of the urban integrated ecological protection network in the Chengdu Plain urban agglomeration.
Sustainability 16 05398 g005
Figure 6. Point-degree centrality of the Chengdu Plain urban agglomeration classified ecological protection network.
Sustainability 16 05398 g006
Figure 7. Chengdu Plain urban agglomeration policy transmission flow integrated ecological protection network cohesive subgroup.
Sustainability 16 05398 g007
Figure 8. Cohesive subgroups of an ecological protection network for the classification of ecosystem services elements in the Chengdu Plain urban agglomeration, Grain production (a), Water supply (b), Soil erosion control (c), Gas regulation (d), Climate regulation (e), Environment purification (f), Hydrological regulation (g), Providing of aesthetic landscape (h), Comprehensive services (i).
Sustainability 16 05398 g008
Table 1. Policy combining of this study.
Serial NumberPolicy NameTimeFirst-Level TypeSecondary TypeFile Source
1Notice on Delineating High Polluting Fuel Burning Ban Zones14 January 2015Regulation serviceGas regulation[34]
2Notice on Restricted Areas and Time Periods for High Pollution Vehicles7 July 2015Regulation serviceGas regulation[35]
100Interim Measures for the Rapid Response Management of Environmental Quality “Measurement and Management Collaboration” in Mianyang City18 May 2017Comprehensive serviceComprehensive service[36]
101Implementation Plan for the Construction of Hazardous Waste Centralized Disposal Facilities in Mianyang City (2017–2022)4 December 2017Regulation serviceEnvironment purification[37]
270Notice on Issuing the Administrative Interview Measures for Ecological Environment Protection in Ziyang City15 October 2022Comprehensive serviceComprehensive service[38]
350The 13th Five Year Plan for Forestry Development in Ya’an City31 October 2016Comprehensive serviceComprehensive service[39]
401Notice on Issuing the “14th Five Year Plan for Water Safety Guarantee in Ya’an City”12 February 2022Regulation serviceHydrological regulation[40]
Table 2. Urban Integrated Services Ecological Protection Linkage Matrix for the Chengdu Plain Urban Agglomeration.
CityChengduDeyangLeshanMeishanMianyangSuiningYa’anZiyang
Chengdu052435243525243
Deyang410414939494941
Leshan414904941494941
Meishan232623022262623
Mianyang394939490494939
Suining698569856708569
Ya’an647364746173064
Ziyang424942494249490
Table 3. Binarization matrix of ecological protection linkages for integrated services in cities of the Chengdu Plain Urban Agglomeration.
CityChengduDeyangLeshanMeishanMianyangSuiningYa’anZiyang
Chengdu01010110
Deyang00010110
Leshan01010110
Meishan00000000
Mianyang01010110
Suining11111011
Ya’an11111101
Ziyang01010110
Table 4. Density values of ecological protection networks of classified ecosystem services elements in Chengdu Plain urban agglomeration.
Type 1Types of Ecological Protection NetworksNetwork Density
Supply ServiceGrain production21.43%
Water supply26.79%
Regulation ServiceGas regulation35.71%
Climate regulation53.57%
Environment purification35.71%
Hydrological regulation39.29%
Support ServiceSoil erosion control37.50%
Cultural ServiceProviding of aesthetic landscape32.14%
Comprehensive ServiceComprehensive service58.93%
Table 5. Core–periphery characteristics of the core–periphery ecological protection network for the Chengdu Plain Urban Agglomeration Ecosystem Services Policy transmission flow classification.
Network TypeCore CityCity on the Edge
Grain productionCheng, De, Mian, ZiLe, Sui, Ya, Mei
Water supplyCheng, De, Le, YaMei, Sui, Mian, Zi
Gas regulationCheng, De, Mian, Le, SuiMei, Ya, Zi
Climate regulationCheng, De, Le, Mei, Mian, Sui, YaZi
Environment purificationCheng, Sui, Le, MianMei, De, Ya, Zi
Hydrological regulationMian, Mei, LeDe, Cheng, Sui, Ya, Zi
Soil erosion controlCheng, Sui, LeMei, Mian, De, Ya, Zi
Providing of aesthetic landscapeCheng, Mei, Ya, MianDe, Sui, Le, Zi
Comprehensive serviceCheng, De, Ya, SuiMian, Mei, Le, Zi
Notes: Cheng, De, Le, Mei, Mian, Sui, Ya, and Zi are abbreviated names of cities in the Chengdu Plain City Cluster.
Disclaimer/Publisher’s Note: The statements, opinions and data contained in all publications are solely those of the individual author(s) and contributor(s) and not of MDPI and/or the editor(s). MDPI and/or the editor(s) disclaim responsibility for any injury to people or property resulting from any ideas, methods, instructions or products referred to in the content.