Abstract
In pursuit of green, low-carbon, and sustainable development, Belt and Road Initiative (BRI) countries urgently require overseas investment in green projects. However, these investments face significant geopolitical risk (GPR) challenges. This study thoroughly investigates how GPR influences the foreign ownership decisions of Chinese enterprises investing in green projects in BRI countries. It further examines the dual moderating effects of corporate green technology capability and host green governance on this relationship. Empirical analysis was conducted using the fractional logit model, analyzing green overseas investment data from Chinese listed companies spanning from 2013 to 2022. The findings revealed the following: (1) high GPR leads Chinese enterprises to opt for low-ownership entry modes in their BRI green investments; (2) the negative impact of GPR on foreign ownership decisions can be offset by improving enterprises’ green technology capability; and (3) in BRI countries with advanced green governance, the negative impact of GPR on the foreign ownership-level decisions of Chinese enterprises is mitigated, and the moderating effect of corporate green technology capability is magnified. This study offers vital insights for multinational enterprises (MNEs) formulating their foreign entry ownership strategies for green overseas investments based on enterprise characteristics and host country conditions to effectively mitigate the impacts of GPR. Similarly, it offers important implications for host countries on attracting more green investments by enhancing their green governance levels to counteract GPR.
1. Introduction
In pursuit of green, low-carbon, and sustainable development, countries within the Belt and Road Initiative (BRI) (detailed in the Appendix A) critically require overseas investments in green projects to mitigate the global increase in CO2 emissions [1,2,3,4], which contribute to climate change issues such as global warming, rising sea levels, species extinction, and extreme weather events [5]. These environmental challenges pose significant threats to both the living environment and the economic growth of human society [6]. Notably, BRI countries account for 41% of global CO2 emissions [7], with most still categorized as emerging economies at the early stages of the Environmental Kuznets Curve (EKC) [8,9]. These nations are characterized by substantial energy consumption, significant carbon emissions, and delicate ecosystems, striving to balance economic growth with CO2 emission control [10]. Green overseas investment by multinational companies involves undertaking projects in host nations that adhere to principles and goals such as energy efficiency, emission reduction, and environmental pollution control [7,11]. These projects often incorporate renewable energy sources like solar, wind, and hydropower, along with initiatives that promote pollution prevention and ecological restoration [1,2,3,4]. The inflow of high-quality green foreign investment can expedite the adoption of clean technologies and sophisticated management systems, significantly reducing the CO2 emissions in BRI countries [2,3,12], refining their industrial structures, and playing a pivotal role in realizing green, low-carbon development. A report by Tsinghua University Center for Finance and Development, Vivid Economics, and the Climateworks Foundation (2019) suggests that BRI countries would require an additional USD 12 trillion in green investment from 2016 to 2030 to comply with the Paris Agreement [13] (pp. 22–23).
However, geopolitical risk (GPR), often associated with investments in BRI countries, presents a significant challenge [11]. GPR includes uncertainties stemming from political extremism, war, terrorist attacks, and international political tensions [14,15]. Spanning three continents—Europe, Asia, and Africa—the BRI covers nearly all crucial strategic hubs along the route, with several countries located in what are referred to as the ‘fragmented zone’ and ‘contested zone’ of geopolitics [12,16], characterized by significant political instability and conflicts. In the global context driven by geopolitical tensions and state interventions motivated by national security and ideology [15,17], competition among major global political forces further complicates the geopolitical environments of BRI countries [15]. Given their substantial initial investments and long periods for construction and return, green investment projects’ characteristics make multinational enterprises (MNEs) particularly sensitive to GPR when making foreign entry decisions in BRI countries [18,19].
The increasing significance of GPR in shaping the international business landscape has recently prompted researchers to integrate GPR into the analysis of MNEs’ overseas investment decisions [17,20,21]. Studies emphasize the critical role of GPR in these contexts [22,23,24,25,26,27]. While most of these studies focus on location decisions, deciding whether to invest and the scale of investment in specific host countries provide valuable insights. However, it is essential to recognize that MNEs, when investing abroad, must not only decide ‘which markets to enter’ but also ‘how to enter’ them, which involves choosing an appropriate entry strategy. Despite its importance, this aspect of entry strategy receives less attention in the existing literature.
Foreign entry ownership-level decisions have always been core issues in research on MNEs’ overseas investment decision-making [28,29]. When entering a specific host country market, equity-based foreign ownership strategies, which involve the level of control and resource commitment in a host country, are critical [29,30,31]. These strategies are pivotal for optimizing the long-term risk-adjusted efficiency of overseas operations and, to a significant extent, determine the survival and subsequent operational performance of these enterprises [32]. Extensive research has been conducted on how various risks, including macroeconomic risks [33,34], institutional risks [31,35], exchange rate uncertainties [34], and political instability [33,36], influence foreign ownership decisions. A key finding from these studies is that in making decisions regarding the level of foreign ownership in overseas investments, enterprises strive to minimize risks perceptions by balancing investment flexibility with resource commitment [2,4,32]. However, there is a notable gap in the literature concerning how these enterprises adjust their foreign equity ownership levels in response to GPR in the host country.
This leads to the following critical question that needs to be investigated: In the face of GPR in BRI countries, how do MNEs choose the appropriate equity ratio for green foreign investment projects? We particularly focus on the roles of corporate green technology capability and host country green governance in this process. These factors represent the unique characteristics of firm-level and host-country-level sustainable development capacities, respectively, and may significantly alter the impact of GPR on MNEs’ foreign ownership decisions when investing in green overseas investment projects.
This study used green overseas investment events of Chinese listed companies in BRI countries spanning from 2013 to 2022, utilizing the GPR index developed by Caldara and Iacoviello [14] as a measurement indicator for exploring the relationship between GPR and the ownership decisions concerning green overseas investments by MNEs. Collecting information on geopolitical tensions, threats, and events through text analysis of newspaper reports, Caldara and Iacoviello [14] constructed an adverse geopolitical event and related risk index [37]. This index measures the real-time perceptions of GPR among policymakers, the media, and investors [22], offering a nuanced view of the geopolitical landscape.
Given the rising trend of green overseas investments by Chinese firms in BRI countries [1,38] and the availability of comprehensive and accurate data from listed companies, our focus was on the green investment activities of these corporations. We utilized the BvD (Bureau van Dijk, a provider of global financial and corporate information) global cross-border investment database and annual reports of listed companies to gather data on green overseas investment projects by these firms from 2013 to 2022, providing deep insights into their foreign equity ownership levels.
Empirical testing was conducted using fractional logit regression models. Our results indicate that higher GPR is associated with a preference for lower levels of equity ownership in green investments. As the green technology capability of Chinese enterprises improves, their inclination towards low-ownership entry decisions in response to GPR in host countries significantly diminishes. Moreover, in BRI countries with advanced green governance levels, the negative effects of GPR on foreign ownership decisions weaken, and the moderating effect of corporate green technology capability is enhanced.
This study contributes to the existing body of knowledge in three primary ways.
- (1)
- It pioneers the integration of the GPR index developed by Caldara and Iacoviello [14] with green investment data from Chinese listed companies operating in BRI nations, offering a novel perspective on the correlation between GPR and the foreign ownership decisions of MNEs. The entry of green overseas investment projects facilitates the transfer of advanced clean production methods to host businesses, encouraging polluting enterprises to innovate and reduce emissions—crucial for addressing global carbon emissions and achieving sustainable development goals. However, due to high sunk costs, these projects are particularly sensitive to GPR. While the existing research primarily focuses on the relationship between GPR and the location choice of green foreign investments, our study delves into how MNEs adjust the equity ownership ratio of their green overseas investments in response to host GPR, aiming to fill this research gap and enhance the understanding of foreign market entry strategies under geopolitical uncertainty.
- (2)
- By comprehensively considering the micro-level sustainable development capacity of individual firms and the macro-level sustainable development capacity of host countries, along with their interactions, this study provides rich insights into the boundary conditions of GPR influencing MNEs’ foreign ownership decisions. We examine how MNEs mitigate the negative impact of GPR when engaging in overseas green investments by enhancing their green technology capability, a core competitive advantage when making overseas green investments [1,11]. This represents the first-order moderating effect of focusing on the influence of firm-level sustainable development capacity. Furthermore, we explore the heterogeneous effects of GPR on MNEs’ green foreign investment ownership decisions in host countries with different levels of green governance. This constitutes the first-order moderating effect of considering the heterogeneity in host-country-level sustainable development capacity. Importantly, by investigating the heterogeneous variations in the moderating effects of corporate green technology capability across host countries with different green governance levels, we comprehensively examine the dual-layer moderating effects of firm-level sustainable development capacity and host-country-level sustainable development levels in the relationship between GPR and MNEs’ green foreign investment ownership decisions.
- (3)
- Our methodological approach distinguishes this research, focusing on foreign ownership decisions using the equity share of overseas investment projects as a measure, diverging from most of the existing literature that predominantly uses binary variables of wholly owned or joint ventures. This focus provides a more detailed reflection of MNEs’ decision-making processes when entering overseas markets under the threat of GPR. In the empirical test, we employed the fractional logit model, which is adept at handling percentage-dependent variables.
2. Research Hypothesis
2.1. GPR and Foreign Ownership Decisions of Chinese Enterprises
Macro-GPR in host countries is an extreme uncertainty triggered by geopolitical factors deriving from a series of geopolitical conflicts at specific geographical locations. Geopolitical conflict events vary, escalate rapidly in extreme times, and cause significant long-term damage [37,39]. The threat of GPR is a significant concern for Chinese enterprises when considering green overseas investments in BRI countries. Different entities, whether national or non-state, vie for control over territories and resources in specific geographical regions. Their aim is to maximize their power advantages, which could result in geopolitical conflicts [40,41]. The BRI passes through Asia, Europe, and Africa, and several countries along the route are located in the fragmented geopolitical zones and the contested zone of geo-economics, long subjected to the influence of geopolitical strategies imposed by major global powers. Even before the BRI was proposed, the route formed a unique and far-reaching political, economic, and cultural map, gradually forming complex geopolitical and economic interest patterns. As BRI green investment projects by Chinese enterprises advance, they will inevitably touch on these historically formed geopolitical factors, which, on the one hand, would create new historical opportunities and, on the other hand, could trigger GPR because they touch the original geopolitical interest structure [42].
The higher the GPR, the more likely Chinese enterprises are to choose a lower equity ownership stake in their BRI green overseas investments. Lower equity ownership levels represent low resource commitment and a low-control mode of overseas investments [32], providing flexibility in the face of GPR. Such flexibility is particularly important in green investment projects characterized by large initial investments, lengthy construction periods, and delayed returns, such as wind, hydro, and solar energy projects. As initial investments in these projects are typically irreversible and difficult to transfer, Chinese enterprises conventionally prefer lower foreign ownership when confronted with highly uncertain geopolitical environments. Entering the host market with a lower initial resource commitment provides Chinese enterprises with a valuable real option advantage. If GPR does not materialize, corporations could realize higher returns by adding subsequent investments, and if geopolitical conflicts erupt, these corporations could exit the market with limited losses. As GPR increases, the value of this advantage and the likelihood of Chinese enterprises choosing a low-equity ownership increase.
Moreover, potential geopolitical tensions not only significantly impact corporate operations in the short term, but the extreme unpredictability and ensuing fear during such times can also erode the societal basis for business activities in host countries. GPR increases the level of uncertainty in all aspects of business and routine life [15,39]. Under GPR’s sway, the issues of information imbalance and collaboration risk between MNEs and local business partners become more pronounced. At such times, choosing an overseas investment entry mode that shares ownership with local enterprises could help Chinese enterprises to better integrate with local knowledge and information networks. It is crucial for Chinese enterprises to gain a more comprehensive understanding of local information, predict future trends in geopolitical conflicts, and adjust their business strategies accordingly.
When confronted with higher GPR in BRI countries, entering the host market with a lower resource commitment is more valuable in terms of flexibility. Therefore, lower equity ownership levels would more likely be chosen by Chinese enterprises for their green overseas investments. Based on this assumption, we present the following hypothesis.
H1:
The higher the GPR, the more likely Chinese enterprises are to choose lower ownership for their BRI green investments.
2.2. Moderating Effect of Corporate Green Technology Capability
Green technology capability denotes an enterprise’s aptitude for reducing pollution emissions and augmenting energy efficiency [11]. This capability encompasses the knowledge and technologies related to energy saving, pollution prevention, waste recycling, green product design, and environmental management. This powerful corporate capability can yield dual benefits when executed during core operations; it offers significant economic gain while concurrently addressing associated environmental issues. Green technology capability embodies the sustainable development capacity at the individual enterprise level. Scarce, hard-to-imitate, and valuable technological capabilities have always been considered crucial advantages for MNEs investing overseas and are important considerations in choosing their market-entry strategies [31]. Numerous Chinese enterprises have acquired extensive knowledge and experience in the green sector, amassing superior green technology capability [1]. This capability stems from China’s ongoing progression in energy transition and the adoption of green, low-carbon development principles, forming the cornerstone of Chinese enterprises’ competitive advantage in making green overseas investments in BRI countries.
As regards the GPR in BRI countries, the tendency of Chinese enterprises to choose low equity ownership for green overseas investments significantly decreases along with improvements in their own green technology capability. The reasons for this change are the following.
First, technological embeddedness can serve as a barrier to GPR [22], reducing perceptions of uncertainty in the host environment. Clean technology and its international transfer are significant factors in green and sustainable development. A heightened degree of green technology capability indicates the commitment and ability of Chinese enterprises to facilitate the transformation and evolution of energy structures and development paradigms in host countries by leveraging effective technology spillover effects [11]. When geopolitical conflicts erupt and threaten business operations and other economic activities, BRI countries pursuing green development models are motivated to use their limited resources and capabilities to prioritize the safety and prosperity of green-technology-intensive overseas investment projects, thereby effectively reducing the level of risk exposure for Chinese enterprises.
Second, a higher level of green technology capability implies higher learning and innovation capabilities [11], enhancing the strategic flexibility of a corporation. Green technology capability is an intangible and dynamic resource that helps firms identify, absorb, and utilize more market information and resources from host countries and adjust business strategies in a timely manner in the face of GPR shocks. Business strategies include improving technology, adjusting product structures, and transferring production lines. From the perspective of MNEs, intangible assets generated by technology can be easily transferred across borders [22]. When an enterprise has higher flexibility, the value advantage of real options under the low-ownership mode is relatively small.
Finally, green technology represents the core competitive advantage of internationalization for enterprises. In BRI countries where geopolitical conflicts occur frequently, Chinese enterprises may be more inclined to maintain a higher level of equity ownership to better protect their green technology from being copied or misused. Several studies have shown that in terms of assets that are technology-intensive, MNEs tend to maintain a higher degree of control over their overseas operations to reduce technology dispersion and protect their intellectual property rights [31,32,35].
In conclusion, as green technology capability improves, the actual investment losses faced by green overseas investment projects of Chinese enterprises under GPR shocks decrease, the strategic flexibility of the firm increases, and a higher demand for control over overseas operating projects arises, significantly reducing the tendency to choose a low-ownership entry mode. Therefore, we propose the following hypothesis.
H2:
With the improvement in green technology capability, when facing GPR in host countries, the tendency of Chinese enterprises to choose low ownership for their green overseas investments in BRI countries decreases significantly.
2.3. Heterogeneous Impact of Host Green Governance
The concept of green governance has emerged as a response to escalating calls for sustainable development. It aims to balance economic growth and environmental protection while reconsidering humanity’s position in nature and the juxtaposition of economic development and the environment [43]. The level of green governance is a critical reflection of a nation’s capacity for sustainable development. A country’s green governance system encompasses a broad array of stakeholders, including governments, businesses, social groups, and the public. Governments play a leading role in green governance as the primary policymakers. They leverage their political power and dominant standing to create and execute green policies and establish institutional frameworks for sustainable development [44,45]. Other key participants include businesses, non-governmental entities, and the public. They contribute significantly to the protection and management of green spaces by reallocating critical resources such as information, technology, and natural resources [43].
Countries in Southeast Asia, South Asia, West Asia, North Africa, and other regions along the BRI are largely developing nations. They are positioned at the left end of the EKC and generally have weak economic, social, and environmental protection foundations. The 2022 Environmental Performance Index (EPI) Report suggested that the prospects for green development in BRI countries were not promising [46]. While these nations contribute to nearly one-third of the global GDP [47], they are also responsible for over one-third of global CO2 emissions [48]. Despite their strategic need for green development, there is significant disparity in the green governance level among these countries.
In BRI countries with varying green governance levels, the effects of GPR on the green investment ownership decisions of Chinese enterprises and the moderating role of corporate green technology capability can vary significantly.
2.3.1. Moderating Effect of Host Green Governance
The level of green governance in host countries can significantly affect the perceptions of Chinese enterprises regarding the negative effects of GPR and, therefore, alter their equity ownership decisions on BRI green overseas investments.
First, to some extent, the level of green governance reflects the institutional quality of a country. Host institutional quality is crucial for investors when contending with potential GPR shocks [49]. In the face of geopolitical strife, certain governments may feel the need to adjust their policies, such as adopting nationalism or mercantilism. Nevertheless, an efficient and superior institutional framework in the host country can be expected to minimize policy instability caused by variable GPR by shielding policy formations from geopolitical influences [22]. Moreover, swift and effective response measures can shelter the private sector and promote conflict resolution processes, preventing further escalation or recurrence of conflicts [22]. Therefore, robust institutional quality can mitigate the negative effects of geopolitical tensions and help establish greater confidence among enterprises [37], thereby encouraging more resource commitments and establishing a higher degree of control.
Second, in host countries with a higher level of green governance, the government and the public tend to readily accept and approve green investments from MNEs. A higher level of green governance suggests that the country prioritizes environmental protection and sustainable development. Governments provide support for green investments through clear policies and regulations. Moreover, public recognition of the legitimacy of green investments by MNEs tends to be higher [43]. Increased legitimacy helps Chinese enterprises to better embed themselves in local political and business networks, thereby gaining more diverse local information and resource support. When local information and resources are readily available, the inclination of MNEs to choose an entry mode that shares ownership with local enterprises decreases significantly.
In conclusion, in host countries with higher green governance levels, the overall high institutional quality and greater recognition by the host government and society of the legitimacy of green investments enhance opportunities for Chinese enterprises to implement more resource commitments and establish higher control over green overseas investment projects. Therefore, the propensity to choose a low-ownership mode is reduced significantly. Accordingly, we propose the following hypothesis.
H3a:
When facing GPR, the propensity of Chinese enterprises to choose a low-ownership entry mode for green overseas investments is weaker in BRI countries with a higher level of green governance.
2.3.2. Influence of Host Green Governance on Moderating Effect of Corporate Green Technology Capability
Based on theories of international relations and political economy, a country can easily influence enterprises, whereas it is challenging for enterprises to influence a country. Consequently, in BRI countries with varying levels of green governance, the moderating effect of green technology capabilities on the relationship between GPR and the ownership decisions of Chinese enterprises’ green overseas investments will exhibit significant differences.
In BRI countries with heightened green governance, Chinese companies possessing advanced green technology capabilities will opt for substantial equity ownership as their preferred mode of entry into overseas markets, regardless of high GPR. First, a high level of green governance reflects the dedication of BRI countries’ governments towards sustainable development. The creation and enforcement of green policies are strong, providing ample institutional backing for the overseas transfer of green technology capabilities. Second, increased green governance indicates that the public in BRI countries has a higher awareness of the importance of environmental protection, which is conducive to the integration of green overseas investment driven by high green technology capability into local information and resource networks. Therefore, in host countries with a high level of green governance, Chinese enterprises with advanced green technology are more inclined to choose a high ownership mode. At this point, investing more resources and establishing higher control can better leverage green technology capability, play to their core competitive advantages, and achieve better business performance. In this regard, Ashraf et al. [7] emphasize that good institutional support, such as the prohibition of expropriation and protection of property rights, is key to attracting investment in environmentally friendly technologies that can reduce CO2 emissions.
In contrast, if the host country has low green governance, even if enterprises possess advanced green technology capability, they will still choose a low-ownership mode with less resource commitment when facing high GPR. Therefore, we propose the following hypothesis:
H3b:
In host countries with a higher level of green governance, Chinese enterprises with advanced green technology capability are less inclined to choose a low-ownership entry mode when facing a high GPR.
The theoretical framework of this study is shown in Figure 1.
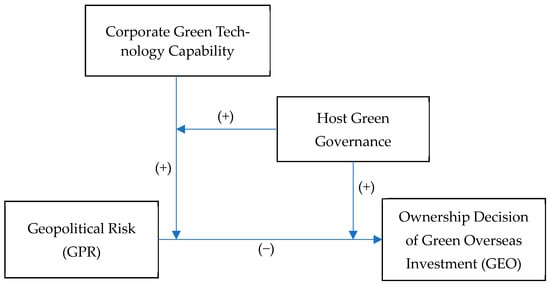
Figure 1.
The theoretical framework.
3. Data and Methodology
3.1. Data and Sample
Our sample included Chinese companies listed on the Shanghai and Shenzhen Stock Exchanges that engaged in green investment activities in BRI countries from 2013 to 2022. We adapted Du et al.’s [11] and Chang et al.’s [50] definition of green investments and referred to the green industry guidance catalogue [51]. Green overseas investment in our study refers to investment initiatives in host nations focusing on industries like clean energy, ecological environment, energy conservation, environmental protection, green infrastructure upgrades, and green services [11].
The specific process for constructing the sample was as follows:
Initially, we accumulated data on foreign investments by Chinese firms from the BvD Orbis cross-border investment database. These data were then matched with the names of the investment companies and stock codes from A-share listed companies on the Shanghai and Shenzhen stock exchanges. Overseas event data pertaining to listed Chinese firms were retained for further analysis.
Next, we sifted through the companies’ annual reports for details on their overseas investments and business scope. This information was then compared with the overseas business scope disclosed in the BvD database to pinpoint green foreign investment by Chinese firms. In gathering data from the annual reports of listed firms, we compiled details such as the investment year-end, host country, and equity ownership level of foreign subsidiaries among other company data. We cross-referenced these data with relevant investment event information in the BvD database to amend any missing or incorrect data.
Finally, during the data filtering process, we removed financial companies and firms registered in Hong Kong, the British Virgin Islands, the Cayman Islands, Luxembourg, and Bermuda. The final sample comprised data from 426 green foreign investment projects executed by Chinese listed firms in 20 countries. These countries were Argentina, Chile, Egypt, Hungary, Indonesia, Italy, South Korea, Malaysia, Peru, the Philippines, Poland, Portugal, Russia, Saudi Arabia, Thailand, Tunisia, Turkey, Ukraine, Venezuela, and South Africa.
3.2. Empirical Models and Variable Selection
To evaluate the hypotheses, the following empirical models are presented:
where i, j, and t represent firms, host countries, and time, respectively; β and γ are the parameters to be estimated; α, μ, and δ represent the firms, host countries, and time-fixed effects; and ε is a random disturbance term. GEO measures the foreign ownership decisions using the percentage of equity ownership by Chinese parent companies in green overseas investment projects in host countries, ranging from 10% to 100%. We only considered investment projects with a level of ownership above 10%. When a multinational enterprise enters a host country, the enterprise holds at least a 10% stake in the subsidiary to exercise managerial control. Lower ownership levels could reflect speculative, short-term, or portfolio motives. The 10% threshold has already been accepted by previous scholars [35,52]. A continuous variable for GEO captures more nuances than dichotomous variables, such as the distinction between sole proprietorship and joint venture, or whole and partial ownership, as typically used in previous research [53].
GPR represents geopolitical risk, measured using the GPR index developed by Caldara and Iacoviello [14]. This index is based on an automated search of articles on geopolitical tensions from 11 major international newspapers, including The New York Times, Financial Times, and The Wall Street Journal, etc. [37]. The index constructs real-time measurements of policymakers, media, and investor perceptions of GPR through text analyses [22]. Currently, a monthly GPR index is available for 43 countries and is normalized to ensure comparability across markets [11]. We measured the annual GPR using the average of the GPR index for each of the 12 months in a year.
GTC represents the green technology capability of an enterprise. As the number of green patents granted to enterprises reflects their green technology capabilities, we considered this number and the logarithm of this measure [11,54,55]. The data were derived from the Chinese Research Data Services Platform (CNRDS) [56].
SDG, the host green governance, is represented by a binary variable. If the host green governance level was higher than the sample mean, it was assigned a value of 1; otherwise, it was assigned a value of 0. Owing to the complexity of the host green governance system, no unified measurement indicator exists at the national level. Considering that the efforts of the host government and society in green governance are aimed at achieving synergistic sustainable development in terms of economic, social, and environmental aspects, this study constructed a measurement indicator for the host green development level based on the 2023 Global Sustainable Development Report (GSDR) [57] (p. 3). The Sustainable Development Goals (SDGs) provide a clear definition and precise measurement of sustainable development. These SDGs comprise the following five spectrums: People, Planet, Prosperity, Peace, and Partnership, and they include 17 subgoals. The Planet spectrum is expressed through Goals 6 (Clean Water and Sanitation), 12 (Responsible Consumption and Production), 13 (Climate Action), 14 (Life Below Water), and 15 (Life on Land) [58]. These goals represent our response to the climate crisis by promoting sustainable consumption and environmental protection efforts [37]. Our measurements of the host green governance level were based on Subgoals 6, 12, 13, 14, and 15.
In the equation, X stands for the control variable. MNEs assess their foreign ownership choices by considering a range of country and enterprise attributes. As such, we integrated controls at both the country and enterprise levels to mitigate the influence of other potential explanatory factors on our results. The variables related to enterprise characteristics comprised the enterprise’s age (Age), denoted as the period from its founding year to the investment year, and the enterprise’s size (Size), depicted by the logarithm of its total assets, a whole number. The enterprise ownership type (Soe) is a binary variable; it is 1 for state-owned enterprises and 0 otherwise. The firm’s financial risk (Frisk) was quantified using the company’s equity multiplier. These data were retrieved from the Wind database and the annual statements of the publicly traded companies.
The host country characteristics variable, the host market potential (HMP), is indicative of the host country’s GDP growth rate for the current year. The geographical distance (GD) was calculated as the logarithm of the straight-line distance between the host nation’s capital and Beijing, China’s capital. The requisite data were obtained from the World Bank and CEPII databases. Table 1 presents the variables used in the regression analysis.

Table 1.
Variable and data sources.
3.3. Econometric Approach
The dependent variable, GEO, is the percentage of equity ownership held by Chinese companies in green overseas investment projects. For estimation, the proportional nature and distribution of GEO must be considered. As an international business phenomenon, GEO naturally spikes at approximately 50% and 100%. The 50% boundary defines whether investors have majority, minority, or equal shares in foreign operations, and 100% indicates full operational control. This makes the least squares estimate inefficient and the estimate of marginal effects possibly biased. Tobit and fractional logit regressions are appropriate models for proportional dependent variables [53]. We utilized fractional logit regression because it relies on fewer assumptions and provides simpler data representation than the Tobit model.
Additionally, we conducted a robustness test using Tobit regression as an alternative method to examine the robustness of our findings. The regression analysis for this study was generated using Stata 15.
4. Results
4.1. Descriptive Statistics
The descriptive results of the variables in Table 2 showed that the mean value of GEO was 0.899, with a standard deviation of 0.231. The variation ranged from a minimum of 0.1 to a maximum of 1, indicating significant differences in the foreign ownership decisions of Chinese listed companies regarding green investments in BRI countries.
Table 2.
Descriptive statistics.
For the explanatory variable, the average GPR value was 1.307, with a standard deviation of 1.812. The variation range was [0, 13.27], suggesting variations in the GPR among Chinese enterprises in different BRI countries. The remaining variables were within reasonable ranges.
The results of the multicollinearity test for the model showed that the average value of the variance inflation factor (VIF) for the selected variables was 1.79 (lower than the traditional threshold of 6), with a maximum VIF of 2.69 (lower than the traditional threshold of 10). Therefore, multicollinearity was disregarded.
4.2. Cross-Sectional Dependence (CD) Test
Before conducting panel data analysis, it is crucial to test for cross-sectional dependence. We used two methods for this purpose: the Baltagi–Pinnoi LM test and the Pesaran CD test [59,60]. As displayed in Table 3, the results indicate that both tests rejected the null hypothesis of “no cross-sectional dependence” at the 1% significance level. Therefore, it was imperative to account for the effects of cross-sectional dependence in the subsequent empirical analysis.
Table 3.
Results of cross-sectional dependence tests.
4.3. Analysis of Regression Results
Table 4 presents the results of the fractional logit analysis. Model 1 examined the impact of GPR on the ownership level of green overseas investments (H1). Model 2 tested the moderating effect of the firms’ green technological capabilities (H2). Models 3 and 4 investigated the moderating effects of the host countries’ green governance levels (H3a) and the dual moderating effects (H3b), respectively. Models 5 and 6 were used to analyze the influence of the firms on the project control rights. In Model 1, the coefficient of GPR was negative and significant at the 1% level (β = −0.218, p < 0.01), suggesting that a higher host GPR led Chinese enterprises to prefer a lower foreign ownership of their green investments in BRI countries, thereby supporting H1.
Table 4.
Fractional logit models result.
An interaction term (GTC×GPR) was introduced in Model 2. The results showed that the coefficient of GPR×GTC was significantly positive (β = 0.068, p < 0.05), indicating that a higher green technology capability weakened the negative effect of GPR on the foreign ownership decisions of Chinese enterprises. The moderating effect of green technology capability is shown in Figure 2a; as the GTC increased, the negative effect of GPR on investment was significantly alleviated. In other words, as the green technology capability of enterprises improved, the inclination of Chinese enterprises to choose lower ownership modes for their green overseas investments in BRI countries decreased significantly, even in the face of high GPR. Therefore, H2 is supported. This research finding validates the first-order moderating effect of firm-level sustainable development capacity in the relationship between GPR and corporate green foreign investment ownership decisions, facilitated by the attention to the moderating role of corporate green technology capability.
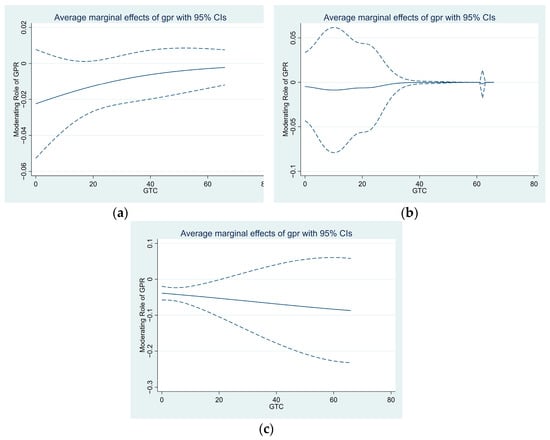
Figure 2.
(a) The moderating role of GTC on the marginal effects of GPR; (b) the moderating role of GTC on the marginal effects of GPR in countries with higher green governance levels; (c) the moderating role of GTC on the marginal effects of GPR in countries with lower green governance levels.
Models 3 and 4 present the subsample regression results based on the level of green governance of the host country. Compared with the subsample with a lower green governance level (Model 4), in the subsample with a higher green governance level (Model 3), the negative impact of GPR on the foreign ownership decisions of Chinese enterprises in BRI countries was no longer significant (the coefficient of GPR was only significant and negative in Model 4). In other words, in host countries with higher green governance levels, Chinese enterprises were less inclined to choose lower ownership modes for green overseas investments in response to the GPR. Therefore, H3a is supported. This research finding validates the first-order moderating effect of the host-country-level sustainable development capacity in the relationship between GPR and corporate green foreign investment ownership decisions, mediated by the heterogeneous impact of host country green governance levels.
Compared with the subsample with a lower green governance level (Model 4), in the subsample with higher green governance levels (Model 3), the moderating effect of green technology capability on the relationship between GPR and the ownership decisions of Chinese enterprises was more significant. The coefficient of the GPR×GTC term was only significant and positive in Model 3, whereas in Model 4, the coefficient of the GPR×GTC term was negative and insignificant. The moderating effect of green technology capability is shown in Figure 2b,c. Figure 2c also shows that the firms’ green technology capability even played a negative role. In other words, in host countries with higher green governance levels, Chinese enterprises with high green technology capability had a weaker inclination to choose lower ownership modes in the face of high GPR. Conversely, in host countries with lower green governance levels, Chinese enterprises with high green technology capability were more likely to choose lower ownership modes in response to high GPR. Therefore, H3b is supported. This research finding confirms the dual-layer moderating effects of firm-level sustainable development capacity and host-country-level sustainable development capacity in the relationship between GPR and corporate green foreign investment ownership decisions. This validation was achieved through an examination of the constraining impact of host green governance on the moderating role of corporate green technology capability.
4.4. Endogeneity Discussion and Robustness Tests
4.4.1. Endogeneity Discussion
We attempted to overcome potential endogeneity issues by following two approaches. First, regarding the relationship between GPR and the foreign ownership decisions by Chinese enterprises for green overseas investments, we aimed to address potential endogeneity problems caused by self-selection bias or sample selection bias using Heckman’s two-stage models. In the first stage, we used a Probit model to examine the influence of GPR on whether Chinese enterprises would engage in green overseas investments (Green). We expanded our sample to include all Chinese listed companies conducting overseas investments in the BRI countries. If they chose to engage in green overseas investments, they were assigned a value of 1; otherwise, they were assigned a value of 0. In the second stage, we included the inverse Mills ratio (IMR) obtained from the first-stage Probit regression in Equation (1) and examined the impact of GPR on the foreign ownership decisions of Chinese enterprises. The results of Model 2 (Table 5) showed that even after incorporating the IMR, the coefficient of GPR remained significantly negative (β = −0.023, p < 0.05). This result indicated that after controlling for potential endogeneity issues caused by sample self-selection bias, GPR still had a significant negative effect on the foreign ownership decisions of Chinese enterprises in BRI countries.
Table 5.
Endogeneity discussion: Heckman’s two-stage and Iv-2sls tests.
Second, following the methodology presented by Shen et al. [61], we tackled the potential endogeneity problem using an instrumental variable two-stage least squares estimation (IV-2SLS) method. This was carried out considering the interconnected GPR environments globally, utilizing the mean GPR index value of nations excluding the host country as an instrumental variable (IV2-AGPR) to encapsulate GPR [61]. Our findings indicated no correlation between IV2-AGPR and the foreign ownership decisions of Chinese firms in a specific host country, thereby fulfilling the exogeneity criteria of a fitting instrumental variable. Model 3 in Table 5 depicts the initial regression result of IV-2SLS, suggesting a positive correlation between IV2-AGPR and GPR at the 1% significance level, reinforcing the relevance of a suitable instrumental variable. The F-value in the Cragg–Donald test was 94.18, surpassing the critical threshold of 10, suggesting that IV2-AGPR did not raise weak identification concerns. Model 4 represents the second-stage regression outcome for IV2-AGPR, illustrating a negative correlation between GPR and GEO at the 5% significance level, aligning with H1. The regression outcomes obtained employing the IV-2SLS method verified that the negative impact of GPR on the foreign ownership decisions of Chinese firms remained significantly negative even after taking potential endogeneity issues into account, thereby affirming the resilience of the fundamental findings of our investigation.
4.4.2. Robustness Tests
We aimed to ascertain the dependability of our conclusions by exploring their robustness using different econometric models and an essential variable measurement index. Initially, we replaced the fractional logit models with Tobit models. The empirically determined results of the Tobit model, as displayed in Table 6, were akin to those in Table 4, thereby affirming the robustness of our findings.
Table 6.
Robustness test for using Tobit regression.
Subsequently, we conducted another robustness examination by estimating replication using a binary dependent variable for ownership, where 1 denoted complete ownership and 0 signified shared ownership. Following earlier studies, we used a 95% equity threshold to differentiate between wholly owned subsidiaries and joint ventures [36]. For the binary dependent variable, logit regression models were employed. As evidenced in Table 7, the results were in line with those in Table 4 when using a binary dependent variable. The signs and statistical significance levels of all coefficients remained comparable, reinforcing the consistency of our findings.
Table 7.
Robustness test for using logit regression.
5. Discussion
Although GPR can negatively affect green investments, MNEs continue to increase their investments in such sustainable development projects because of the significant market opportunities. This research provides an important reference for guiding MNEs in deciding on overseas green investments and selecting appropriate ownership proportions, particularly in environments with high GPR. First, it is crucial for enterprises to fully recognize and assess the level of GPR that green overseas investments may encounter in host countries when choosing investment entry modes. Second, there should be a focus on nurturing and enhancing the green technology capabilities of enterprises to enhance their strategic flexibility in the presence of GPR. Finally, it underscores the need for host countries to enhance their green governance to attract more green investment and promote sustainable development in the drive for global green development.
This is the first systematic exploration of the relationship between GPR and foreign ownership decisions by MNEs on green overseas investments. A similar study was conducted by Bussy and Zheng [22]. Both studies emphasize the effect of GPR on overseas investment decisions. However, Bussy and Zheng [22] focused on FDI location decisions and relied primarily on national-level data for their analysis. Building on the construction of a unique micro-level sample of green investments by Chinese listed companies, we explored how MNEs adjusted their foreign ownership decisions when they perceived GPR threats. Similar to location decisions, ownership decisions for overseas market entry are core issues in the study of overseas investment decisions by MNEs. Moreover, we focused on the choice of ownership entry mode for green overseas investments by MNEs, which provides important insights into mitigating the negative effects of the GPR and drives the flow of green overseas investments to achieve global sustainable development.
In our exploration of the effects of GPR on green overseas investment ownership choices by MNEs, we also considered the moderating influence of the firms’ green technology capability. Green technology capability embodies the sustainable development capacity at the individual enterprise level. Being a potent strategy to achieve economic benefits while addressing environmental concerns, green technology capability and its international diffusion aid in minimizing pollution and optimizing resource usage. This is particularly applicable to BRI nations striving for low-carbon transformations via industrial shifts, enhanced energy conservation and efficiency, and technological modifications [3,10,31]. The spread of green technology triggered by superior overseas investment initiatives is vital for their economic viability and environmental sustainability. Within this framework, our findings validate that for MNEs partaking in green overseas investments, possessing a high green technology capability can form their core competitive edge. This, in turn, assists businesses in retaining significant foreign ownership in host countries with high GPR.
The level of green governance in host countries plays a pivotal role in the relationship between GPR and MNEs’ ownership decisions regarding green overseas investments. The green governance level is a critical reflection of a nation’s capacity for sustainable development. Host green governance plays a crucial role in the correlation between GPR and the ownership decisions of MNEs regarding green overseas investments. Both in the study of GPR and sustainable environmental development, the importance of the institutional environment at the country level is underlined [33,37,49]. In the ongoing debate between the “pollution haven” and the “pollution halo” hypotheses concerning the relationship between foreign direct investment and the environment, scholars unanimously agree that the quality of a country’s institutions plays a key role in whether the inflow of overseas investment can bring environmentally friendly advanced technology, thereby helping the country achieve green and low-carbon development [9,37]. Green governance reflects the quality of host institutional design in terms of the environment as well as an indication of the public’s active participation in sustainable development. However, there is no systematic research on how the level of green governance affects the ownership decision of MNEs’ green overseas investment in host countries with high GPR. Our study not only confirms that a higher level of host green governance can mitigate the adverse effects of GPR on MNEs’ green overseas investments but also identifies the significant constraining role of host green governance on the portability of corporate green technology capability within the host country. Given the expanding consensus on the global demand for sustainability practices, our findings hold implications for all countries, particularly those in the developing world, to enhance their green governance to attract more green overseas investments and boost green and sustainable development.
Corporate green technology capability and the green governance levels of host countries are both related to ESG. For companies, ESG performance, as a proactive corporate social responsibility strategy, is a component of maintaining or enhancing organizational resilience in global operations [62]. This can effectively mitigate the negative impact of geopolitical risk on overseas investments. Firstly, positive ESG performance, especially in environmental and social responsibility, not only reduces regulatory pressure and the likelihood of violations in the host country but also helps companies obtain key external resources such as government subsidies and preferential tax rates, thus enhancing their ability to withstand GPR shocks. Secondly, good internal governance can increase operational flexibility, giving companies a significant competitive advantage in the market. The green governance level of the host country not only directly affects the environmental and social responsibility performance of companies in that country but also indirectly enhances the overall ESG performance of companies by improving the transferability of green technology. A high level of green governance in the host country implies stricter requirements and enforcement from the government and regulatory agencies regarding environmental protection and social responsibility. This prompts companies to improve their ESG performance to gain the trust and support of government and regulatory bodies, thereby increasing their competitiveness and operational resilience in the global market.
6. Conclusions
The surge in CO2 emissions over recent decades has raised severe climate and ecological issues, with BRI countries being significant contributors. To achieve a green economic transition and sustainable development, there is a growing demand for green investments in these countries. However, high GPR poses severe threats to the green overseas investments of MNEs. Thus, it is crucial to investigate how MNEs adjust their ownership levels based on host GPR when entering BRI countries for green investments.
This study examined the impact of GPR on the ownership decisions of Chinese enterprises in green overseas investments in BRI countries, considering the moderating role of their green technology capabilities and the host countries’ green governance levels. Using data from Chinese listed companies’ green overseas investment projects in BRI countries from 2013 to 2020, we constructed a comprehensive dataset to empirically test our hypotheses with fractional logit regression models.
Our results indicate that higher GPR leads Chinese enterprises to prefer entry modes with lower equity ownership in BRI countries. However, enterprises with strong green technology capabilities are less likely to choose low-ownership entry modes under high GPR, as their green technology offers a competitive advantage, particularly in BRI countries with higher green governance levels. These countries’ superior institutional quality and commitment to green governance alleviate the adverse effects of GPR, instilling confidence in enterprises to make greater resource commitments and maintain higher control over their investments. Furthermore, the degree of green governance in host countries influences the transferability and practicality of firms’ green technology capability within these countries. In BRI countries with higher green governance levels, where government policies are relatively stable and the negative effect of the GPR is lower, enterprises are more willing to engage in high-ownership investments to maintain control over overseas investment projects and better leverage their green technology advantages.
The findings demonstrated that MNEs should consider both their green technology capabilities and the host country’s green governance level when facing high GPR in BRI countries. This approach allows for more comprehensive and informed foreign investments decisions, aligning with the increasing environmental awareness and geopolitical instability in the global business environment.
This study has several limitations that provide possibilities for further research. First, we focused on the initial market-entry strategies of MNEs in green investments, but future research could explore the impact of different ownership entry modes on the performance of green investments under GPR. Second, the analysis was limited to listed companies. Future research could extend to small- and medium-sized enterprises, which are more susceptible to GPR effects and may exhibit different entry mode dynamics.
Author Contributions
Conceptualization, C.T. and X.D.; methodology, C.T. and X.D.; software, C.T.; validation, C.T.; formal analysis, C.T.; investigation, C.T.; data curation, C.T.; writing—original draft preparation, C.T.; writing—review and editing, C.T. and X.D.; visualization, C.T. and X.D.; funding acquisition, X.D.; supervision, X.D. All authors have read and agreed to the published version of the manuscript.
Funding
This research was funded by the Key Project of the National Social Science Fund of China (grant No. 19AGL004).
Institutional Review Board Statement
Not applicable.
Informed Consent Statement
Not applicable.
Data Availability Statement
The datasets used in this study are available upon request from the corresponding author.
Acknowledgments
We wish to express our sincere gratitude to the anonymous reviewers for their invaluable feedback and constructive criticism, which have greatly contributed to the refinement of our work.
Conflicts of Interest
The authors declare no conflicts of interest.
Appendix A. Presentation on the Belt and Road Initiative (BRI)
The BRI was proposed in 2013. The “Belt” refers to the “Silk Road Economic Belt”, and the “Road” refers to the “21st Century Maritime Silk Road”.
The geographic range of the “Silk Road Economic Belt” is approximately 34° N–56° N, 4° E–109° E, entirely located in the Northern and Eastern Hemispheres, spanning Asia and Europe, extending westward to the Atlantic Ocean, eastward to the Pacific Ocean, and southward to the Mediterranean Sea. The “Silk Road Economic Belt” also passes through the southern parts of the Caspian Sea and Black Sea.
The “21st Century Maritime Silk Road” covers a geographic range of approximately 6° S–45.5° N, 12° E–121° E. Asia, Africa, and Europe are connected by the “21st Century Maritime Silk Road” through water bodies.
Therefore, the geographic range of the BRI is approximately 6° S–56° N, 4° E–121° E, primarily distributed in the Northern and Eastern Hemispheres, involving the continents of Asia, Africa, and Europe, as well as the Pacific Ocean, Indian Ocean, and Atlantic Ocean.
As of 1 April 2024, China has signed BRI cooperation documents with 159 countries [63].
Asia: Afghanistan, United Arab Emirates, Oman, Azerbaijan, Pakistan, Palestine, Bahrain, Timor-Leste, Philippines, Georgia, Kazakhstan, South Korea, Kyrgyzstan, Cambodia, Qatar, Kuwait, Laos, Lebanon, Maldives, Malaysia, Mongolia, Bangladesh, Myanmar, Nepal, Saudi Arabia, Sri Lanka, Tajikistan, Thailand, Turkey, Turkmenistan, Brunei, Uzbekistan, Singapore, Syria, Armenia, Yemen, Iraq, Iran, Indonesia, Jordan, Vietnam.
Africa: Algeria, Egypt, Ethiopia, Angola, Benin, Botswana, Burkina Faso, Burundi, Equatorial Guinea, Togo, Eritrea, Cape Verde, Gambia, Republic of Congo, Democratic Republic of Congo, Djibouti, Guinea, Guinea-Bissau, Ghana, Gabon, Zimbabwe, Cameroon, Comoros, Ivory Coast, Kenya, Lesotho, Liberia, Libya, Rwanda, Madagascar, Malawi, Mali, Mauritania, Morocco, Mozambique, Namibia, South Africa, South Sudan, Niger, Nigeria, Sierra Leone, Senegal, Seychelles, São Tomé and Príncipe, Sudan, Somalia, Tanzania, Tunisia, Uganda, Zambia, Chad, Central African Republic.
Europe: Albania, Estonia, Austria, Belarus, Bulgaria, North Macedonia, Bosnia and Herzegovina, Poland, Russia, Montenegro, Czech Republic, Croatia, Latvia, Lithuania, Luxembourg, Romania, Malta, Moldova, Portugal, Serbia, Cyprus, Slovakia, Slovenia, Ukraine, Greece, Hungary, Italy.
North America: Antigua and Barbuda, Barbados, Panama, Dominican Republic, Dominica, Grenada, Costa Rica, Cuba, Honduras, Nicaragua, El Salvador, Trinidad and Tobago, Jamaica.
South America: Argentina, Peru, Bolivia, Ecuador, Guyana, Suriname, Venezuela, Uruguay, Chile.
Oceania: Papua New Guinea, Fiji, Kiribati, Cook Islands, Federated States of Micronesia, Nauru, Niue, Samoa, Solomon Islands, Tonga, Vanuatu, New Zealand.
References
- Liu, H.; Wang, Y.; Jiang, J.; Wu, P. How green is the “Belt and Road Initiative”?—Evidence from Chinese OFDI in the energy sector. Energy Policy 2020, 145, 111709. [Google Scholar] [CrossRef]
- Huang, Y. Environmental risks and opportunities for countries along the Belt and Road: Location choice of China’s investment. J. Clean Prod. 2019, 211, 14–26. [Google Scholar] [CrossRef]
- Yin, W. Integrating sustainable development goals into the Belt and Road Initiative: Would it be a new model for green and sustainable investment? Sustainability 2019, 11, 6991. [Google Scholar] [CrossRef]
- Zhao, L.; Liu, J.; Li, D.; Yang, Y.; Wang, C.; Xue, J. China’s green energy investment risks in countries along the Belt and Road. J. Clean Prod. 2022, 380, 134938. [Google Scholar] [CrossRef]
- Nema, P.; Nema, S.; Roy, P. An overview of global climate changing in current scenario and mitigation action. Renew. Sust. Energy Rev. 2012, 16, 2329–2336. [Google Scholar] [CrossRef]
- Heshmati, H.M. Impact of climate change on life. In Environmental Issues and Sustainable Development; Sarvajayakesavalu, S., Charoensudjai, P., Eds.; IntechOpen: London, UK, 2021. [Google Scholar] [CrossRef]
- Ashraf, J.; Ashraf, Z.; Javed, A. The spatial-temporal effects of energy consumption and institutional quality on CO2 emission: Evidence from Belt and Road Initiative (BRI) countries. Environ. Sci. Pollut. Res. 2023, 30, 121050–121061. [Google Scholar] [CrossRef] [PubMed]
- Rahman, A.; Murad, S.M.W.; Ahmad, F.; Wang, X. Evaluating the EKC Hypothesis for the BCIM-EC member countries under the Belt and Road initiative. Sustainability 2020, 12, 1478. [Google Scholar] [CrossRef]
- Liu, P.; Ur Rahman, Z.; Jóźwik, B.; Doğan, M. Determining the environmental effect of Chinese FDI on the Belt and Road countries CO2 emissions: An EKC-based assessment in the context of pollution haven and halo hypotheses. Environ. Sci. Eur. 2024, 36, 48. [Google Scholar] [CrossRef]
- Li, H.; Li, F.; Yu, X. China’s Contributions to global green energy and low-carbon development: Empirical evidence under the Belt and Road framework. Energies 2018, 11, 1527. [Google Scholar] [CrossRef]
- Du, X.; Tang, C.; Qi, Q.; Zhao, Z. Geopolitical risk and green outward foreign direct investment location choice: Evidence from Chinese listed companies. Environ. Sci. Pollut. Res. 2023, 30, 103602–103619. [Google Scholar] [CrossRef]
- Li, J.; Van Assche, A.; Li, L.; Qian, G. Foreign direct investment along the Belt and Road: A political economy perspective. J. Int. Bus. Stud. 2022, 53, 902–919. [Google Scholar] [CrossRef]
- Decarbonizing the Belt and Road: A Green Finance Roadmap. Available online: https://www.climateworks.org/wp-content/uploads/2019/09/Decarbonizing-the-Belt-and-Road_report_final_lo-res.pdf (accessed on 13 January 2024).
- Caldara, D.; Iacoviello, M. Measuring geopolitical risk. Am. Econ. Rev. 2022, 112, 1194–1225. [Google Scholar] [CrossRef]
- Hu, W.; Shan, Y.; Deng, Y.; Fu, N.; Duan, J.; Jiang, H.; Zhang, J. Geopolitical risk evolution and obstacle factors of countries along the belt and road and its types classification. Int. J. Environ. Res. Public Health 2023, 20, 1618. [Google Scholar] [CrossRef] [PubMed]
- Morris, D. Political risk on the Belt and Road. In Business Performance and Financial Institutions in Europe: Business Models and Value Creation across European Industries; Horobet, A., Polychronidou, P., Karasavvoglou, A., Eds.; Springer: Cham, Switzerland, 2020; pp. 145–163. ISBN 978-3-030-57517-5. [Google Scholar] [CrossRef]
- Fjellström, D.; Bai, W.; Oliveira, L.; Fang, T. Springboard internationalization in times of geopolitical tensions. Int. Bus. Rev. 2023, 32, 102144. [Google Scholar] [CrossRef]
- Piao, Z.; Liu, X.; Teng, Z. The political risk analysis on China’s direct investment environment of the Belt and Road Initiative. In China’s Belt and Road Initiatives and Its Neighboring Diplomacy; Zhang, J., Xu, M., Eds.; World Scientific: Singapore, 2016; pp. 223–248. ISBN 978-981-3140-22-6. [Google Scholar] [CrossRef]
- Yu, M.; Wang, N. The influence of geopolitical risk on international direct investment and its countermeasures. Sustainability 2023, 15, 2522. [Google Scholar] [CrossRef]
- Truong, L.D.; Friday, H.S.; Pham, T.D. The effects of geopolitical risk on foreign direct investment in a transition economy: Evidence from Vietnam. J. Risk Financ. Manag. 2024, 17, 101. [Google Scholar] [CrossRef]
- Wang, Y.; Liu, C.; Wang, G. Geopolitical risk revealed in international investment and world trade. Risk Manag. 2020, 22, 133–154. [Google Scholar] [CrossRef]
- Bussy, A.; Zheng, H. Responses of FDI to geopolitical risks: The role of governance, information, and technology. Int. Bus. Rev. 2023, 32, 102136. [Google Scholar] [CrossRef]
- Feng, C.; Han, L.; Vigne, S.; Xu, Y. Geopolitical risk and the dynamics of international capital flows. J. Int. Financ. Mark. Inst. Money 2023, 82, 101693. [Google Scholar] [CrossRef]
- Nguyen, T.T.T.; Pham, B.T.; Sala, H. Being an emerging economy: To what extent do geopolitical risks hamper technology and FDI inflows? Econ. Anal. Policy 2022, 74, 728–746. [Google Scholar] [CrossRef]
- Ahmed, Z.U.; Mohamad, O.; Tan, B.; Johnson, J.P. International risk perceptions and mode of entry: A case study of Malaysian multinational firms. J. Bus. Res. 2002, 55, 805–813. [Google Scholar] [CrossRef]
- Ahmed, Z.; Rasool, S.; Saleem, Q.; Khan, M.A.; Kanwal, S. Mediating role of risk perception between behavioral biases and investor’s investment decisions. Sage Open 2022, 12, 21582440221097394. [Google Scholar] [CrossRef]
- Kraus, S.; Ambos, T.C.; Eggers, F.; Cesinger, B. Distance and perceptions of risk in internationalization decisions. J. Bus. Res. 2015, 68, 1501–1505. [Google Scholar] [CrossRef]
- Buckley, P. Foreign Direct Investment and Multinational Enterprises; Palgrave Macmillan: London, UK, 1995; pp. 47–59. ISBN 978-0-333-61370-2. [Google Scholar] [CrossRef]
- Dikova, D.; Van Witteloostuijn, A. Foreign direct investment mode choice: Entry and establishment modes in transition economies. J. Int. Bus. Stud. 2007, 38, 1013–1033. [Google Scholar] [CrossRef]
- Ilhan-Nas, T.; Okan, T.; Tatoglu, E.; Demirbag, M.; Glaister, G.W. The effects of ownership concentration and institutional distance on the foreign entry ownership strategy of Turkish MNEs. J. Bus. Res. 2018, 93, 173–183. [Google Scholar] [CrossRef]
- Li, K.S.; Xiong, Y.Q. Host country’s environmental uncertainty, technological capability, and foreign market entry mode: Evidence from high-end equipment manufacturing MNEs in emerging markets. Int. Bus. Rev. 2022, 31, 101900. [Google Scholar] [CrossRef]
- Trąpczyński, P.; Halaszovich, T.F.; Piaskowska, D. The role of perceived institutional distance in foreign ownership level decisions of new MNEs. J. Bus. Res. 2020, 108, 435–449. [Google Scholar] [CrossRef]
- Anser, M.K.; Syed, Q.R.; Lean, H.H.; Alola, A.A.; Ahmad, M. Do economic policy uncertainty and geopolitical risk lead to environmental degradation? Evidence from emerging economies. Sustainability 2021, 13, 5866. [Google Scholar] [CrossRef]
- Cuypers, I.R.P.; Martin, X. What makes and what does not make a real option? A study of equity shares in international joint ventures. J. Int. Bus. Stud. 2010, 41, 47–69. [Google Scholar] [CrossRef]
- Falaster, C.; Ferreira, M.P.; Li, D. The influence of generalized and arbitrary institutional inefficiencies on the ownership decision in cross-border acquisitions. J. Int. Bus. Stud. 2021, 52, 1724–1749. [Google Scholar] [CrossRef]
- Lu, J.W.; Li, W.; Wu, A.; Huang, X. Political hazards and entry modes of Chinese investments in Africa. Asia Pac. J. Manag. 2018, 35, 39–61. [Google Scholar] [CrossRef]
- Nguyen, D.T.; Le, T.H.; Do, D.D.; Nguyen, H.N. Does geopolitical risk hinder sustainable development goals? Evidence from a panel analysis. J. Environ. Manag. 2023, 347, 119204. [Google Scholar] [CrossRef] [PubMed]
- Jiang, Q.; Ma, X.; Wang, Y. How does the one belt one road initiative affect the green economic growth? Energy Econ. 2021, 101, 105429. [Google Scholar] [CrossRef]
- Bondarenko, Y.; Lewis, V.; Rottner, M.; Schüler, Y. Geopolitical Risk Perceptions; CEPR Discussion Paper; CEPR Press: Paris, France; London, UK, 2023; Number 18123; Available online: https://cepr.org/publications/dp18123 (accessed on 25 March 2024).
- Alami, I.; Dixon, A.D. The strange geographies of the ‘new’ state capitalism. Political Geogr. 2020, 82, 102237. [Google Scholar] [CrossRef]
- Shi, W.; Hoskisson, R.E.; Zhang, Y.A. A geopolitical perspective into the opposition to globalizing state-owned enterprises in target states. Glob. Strategy J. 2016, 6, 13–30. [Google Scholar] [CrossRef]
- Zhang, X.; Xu, Z. BRI projects’ geopolitical risks: Concepts and theorization. Glob. Rev. 2020, 12, 80–96. (In Chinese) [Google Scholar] [CrossRef]
- Debbarma, J.; Choi, Y. A taxonomy of green governance: A qualitative and quantitative analysis towards sustainable development. Sust. Cities Soc. 2022, 79, 103693. [Google Scholar] [CrossRef]
- Li, W.; Xu, J.; Zheng, M. Green governance: New perspective from open innovation. Sustainability 2018, 10, 3845. [Google Scholar] [CrossRef]
- Lin, R.; Gui, Y.; Xie, Z.; Liu, L. Green governance and international business strategies of emerging economies’ multinational enterprises: A multiple-case study of Chinese firms in pollution-intensive industries. Sustainability 2019, 11, 1013. [Google Scholar] [CrossRef]
- The 2022 Environmental Performance Index Report. Available online: https://epi.yale.edu/downloads/epi2022report06062022.pdf (accessed on 25 March 2024).
- Three Opportunities and Three Risks of the Belt and Road Initiative. Available online: https://blogs.worldbank.org/en/trade/three-opportunities-and-three-risks-belt-and-road-initiative (accessed on 25 March 2024).
- Liu, F.; Khan, Y.; Marie, M. Carbon neutrality challenges in Belt and Road countries: What factors can contribute to CO2 emissions mitigation? Environ. Sci. Pollut. Res. 2023, 30, 14884–14901. [Google Scholar] [CrossRef]
- Rao, S.; Koirala, S.; Aldhawyan, S.; Corbet, S. Geopolitical risk and M&A: The role of national governance institutions. Econ. Lett. 2023, 225, 111062. [Google Scholar] [CrossRef]
- Chang, K.; Ding, J.; Lou, Q.; Li, Z.; Yang, J. The impact of capital leverage on green firms’ investment: New evidence regarding the size and age effects of Chinese green industries. Financ. Res. Lett. 2021, 38, 101529. [Google Scholar] [CrossRef]
- The National Development and Reform Commission and Other Departments on the Issuance of the Green Low-Carbon Transformation Industry Guidance Directory (2024 Edition) Notice. Available online: https://www.gov.cn/zhengce/zhengceku/202403/content_6935418.htm (accessed on 25 March 2024).
- Fuentelsaz, L.; Garrido, E.; Maicas, J.P. The effect of informal and formal institutions on foreign market entry selection and performance. J. Int. Manag. 2020, 26, 100735. [Google Scholar] [CrossRef]
- Wulff, J.N.; Villadsen, A.R. Keeping it within bounds: Regression analysis of proportions in international business. J. Int. Bus. Stud. 2020, 51, 244–262. [Google Scholar] [CrossRef]
- Sahoo, S.; Kumar, A.; Upadhyay, A. How do green knowledge management and green technology innovation impact corporate environmental performance? Understanding the role of green knowledge acquisition. Bus. Strategy Environ. 2023, 32, 551–569. [Google Scholar] [CrossRef]
- Zhao, Q.; Tang, C. The impact of economic policy uncertainty on green technology innovation of new energy vehicle enterprises in China. Sustainability 2024, 16, 4206. [Google Scholar] [CrossRef]
- Chinese Research Data Services Platform. Available online: https://www.cnrds.com (accessed on 20 November 2023).
- Global Sustainable Development Report (GSDR). 2023. Available online: https://sdgs.un.org/gsdr/gsdr2023 (accessed on 20 November 2023).
- THE 17 GOALS|Sustainable Development. Available online: https://sdgs.un.org/goals (accessed on 20 November 2023).
- De Hoyos, R.E.; Sarafidis, V. Testing for cross-sectional dependence in panel-data models. Stata J. 2006, 6, 482–496. [Google Scholar] [CrossRef]
- Pesaran, M.H. General diagnostic tests for cross-sectional dependence in panels. Empir. Econ. 2021, 60, 13–50. [Google Scholar] [CrossRef]
- Shen, H.; Liang, Y.; Li, H.; Liu, J.; Lu, G. Does geopolitical risk promote mergers and acquisitions of listed companies in energy and electric power industries. Energy Econ. 2021, 95, 105115. [Google Scholar] [CrossRef]
- Napier, E.; Knight, G.; Luo, Y.; Delio, A. Corporate social performance in international business. J. Int. Bus. Stud. 2023, 54, 61–77. [Google Scholar] [CrossRef]
- China BRI Network. Available online: https://www.yidaiyilu.gov.cn/country (accessed on 1 April 2024).
Disclaimer/Publisher’s Note: The statements, opinions and data contained in all publications are solely those of the individual author(s) and contributor(s) and not of MDPI and/or the editor(s). MDPI and/or the editor(s) disclaim responsibility for any injury to people or property resulting from any ideas, methods, instructions or products referred to in the content. |
© 2024 by the authors. Licensee MDPI, Basel, Switzerland. This article is an open access article distributed under the terms and conditions of the Creative Commons Attribution (CC BY) license (https://creativecommons.org/licenses/by/4.0/).