Article

Reaction to Idiosyncratic Economic Shocks—Economic Resilience of Small- and Medium-Sized Enterprises

by
Ferenc Tolner
1,2,*,
Balázs Barta
2 and
György Eigner
3,4
1
Doctoral School of Applied Informatics and Applied Mathematics, Óbuda University, Bécsi út 96/b, H-1034 Budapest, Hungary
2
Pannon Business Network Association, 32-36 Zanati út, H-9700 Szombathely, Hungary
3
Biomatics and Applied Artificial Intelligence Institute, Óbuda University, Bécsi út 96/b, H-1034 Budapest, Hungary
4
University Research and Innovation Center, Physiological Controls Research Center, Óbuda University, Bécsi út 96/b, H-1034 Budapest, Hungary
*
Author to whom correspondence should be addressed.
Sustainability 2024, 16(13), 5470; https://doi.org/10.3390/su16135470
Submission received: 12 April 2024 / Revised: 11 June 2024 / Accepted: 19 June 2024 / Published: 27 June 2024
(This article belongs to the Section Economic and Business Aspects of Sustainability)

Abstract

:
The objective of this research is to present a qualitative methodology for the empirical investigation of enterprises’ responses to economic shocks. Annual balance sheets and income statements of nearly 26,000 Hungarian small- and medium-sized enterprises (SMEs) in the production sector have been examined. A data-driven resilience metric is introduced, based on annual sales growth fluctuations in response to idiosyncratic economic disturbances. Accordingly, Logistic Regression and Random Forest classification of company-year observations have been conducted. Non-parametric statistical tests based on pair-matching suggest that while resilience against economic downturns is critical for short-term survival, it does not necessarily translate to any enhanced long-term development or prosperity. This study demonstrates that companies exposed to economic setbacks tend to lag behind compared to control pairs and illuminate the aftermath of resilient shock reactions at the population level. Our findings suggest that enterprises that have experienced an economic shock should be considered vulnerable and monitored regardless of their shock reaction history as part of a sustainable national economic strategy to foster overall competitiveness and productivity and maintain supply chains.

1. Introduction

Resilience, defined as the ability of an abstract system to bounce back after a negative disturbance and return to its pre-disturbance state, was firstly introduced by Holling in 1973 from an ecological perspective [1,2]. For economic systems as well, the reaction to sudden, unpredictable disturbances is of great importance. Economic resilience has been mentioned in the literature since the year 2000 [3,4]. Although an economic issue is primarily considered, it has to be noted that various other factors (e.g., human, technological, macro- or microeconomic, etc.) often interfere in a case-dependent manner [5,6]. Furthermore, economic disturbances are typically unpredictable, leaving no means to predict them in advance. Therefore, there are no means of preparing for them either [7].
In the following, we will consider small- and medium-sized enterprises (SMEs) as the subject of our investigations. Within the European Union, according to the common definition used for SMEs, we will consider economic entities with less than 250 employees and with an annual turnover smaller than EUR 50 million [8]. This sector is the backbone of the European economy, and this segment constitutes the majority (∼99%) of all enterprises. Additionally, this sector provides approximately more than two-thirds of the total employment and can still enable further employment increase. For this reason, among others, it is of paramount importance to support SMEs in order to boost economic competitiveness [9].
In the resilience maturity model proposed by Ruiz-Martin et al. [10], resilience is depicted as an intermediary stage rather than the optimal response pattern to shocks. According to this framework, SMEs’ responses to shocks are categorised as fragile, robust, resilient, or antifragile (see Figure 1). Fragile systems collapse immediately in the face of sudden disruptions. Robust systems can withstand distresses for extended periods but eventually succumb. Resilient systems not only tolerate but also recover from negative impacts with manageable setbacks, whereas antifragile systems not only survive turbulent periods but also derive benefits from them (e.g., through innovation, establishing new contacts, or expanding market presence). This conceptual framework outlines the developmental stages of shock responses and emphasises the importance of exploring the “antifragility of SMEs”. Antifragile behaviour goes beyond restoring the pre-crisis status quo, aiming to achieve a more advantageous or entirely new economic position.
Given the anticipated rise in economic turbulence, it is imperative to examine how enterprises react to these challenges at a population level. Globalisation has led to increasingly complex supply chains and the outsourcing of activities, making periods of distress a regular occurrence. Understanding these shock reactions and identifying best practices and strategic policies can enhance the resilience of companies and economies alike [11,12,13,14].
Our literature review reveals a significant scarcity of studies that utilise extensive real-life financial data to comprehensively analyse economic resilience. There is a notable absence of measures for assessing resilience levels and comparing individual shock responses within the diverse population of companies in an objective and reproducible manner.
The primary aim of this study is to address this gap by proposing a generalizable, objective methodology based on financial and meta-data from enterprises. As a novel contribution to the existing literature, an indicator for measuring resilience has been developed, allowing for the classification of shock responses and facilitating comparisons across different scenarios. To achieve this, reproducible statistical tests were conducted in alignment with established concepts of economic resilience. Methodological experiments were also undertaken to predict favourable shock responses using historical company data, employing Logistic Regression and Random Forest classification models on categorised company-year observations based on the defined resilience criteria.

2. Overview of the Related Literature

2.1. Prior Approaches to Address Economic Resilience

Authors of the corresponding literature tend to agree that resilience should not be treated only as a static but rather as a time-dependent feature of an economic entity that describes the active and advantageous response of the system to disturbances [15]. Therefore, for the mapping of the “resilience time evolution” of a company, time-dependent annual data that incorporate information on negative setbacks should be considered.
Feedback from senior managers collected through questionnaires was investigated in [3]. The study utilised linguistic expressions provided on a Likert scale to rank the vulnerability and importance of key company areas. Individual responses of respondents were aggregated using a fuzzy ordered weighted averaging operator (FOWA). The relevance of each feedback was assessed relative to reference values from industrial best practices. Subsequently, a fuzzy decision matrix was constructed to provide a clear method for characterising the resilience of business processes and entire organisations, within a [0, 1] range.
According to [16], resilience can be understood as an attribute that manifests when a disturbance occurs and the company successfully survives. The author introduced resilience as a latent attribute, an inherent property of the system that is not immediately evident. This characteristic was evaluated through questionnaires focusing on factors assumed to be related to resilience. Additionally, correlation calculations, one-way ANOVA, and multiple regression were employed to assess the impact of organisational behavioural patterns on resilience.
In [17], a Cox regression survival analysis was conducted using panel data to examine the influence of R&D expenditures and other innovative activities on long-term company survival. Their model incorporated time-dependent “hard data” and dummy variables indicating the presence of patents and innovations. The study analysed 588 South Korean SMEs over a five-year period, examining correlations between selected input factors and the companies’ survival capabilities.
Sauser et al. [18] outlined an agent-based modelling approach to investigate the collapse of an entire network of companies and the potential shock reactions affecting communities and regions. Their novel simulation placed SMEs in a grid structure, assigning properties such as resilience (defined by their ability to reopen after a shock), type of customers (local/global), and dependency thresholds (level of reliance on neighbouring grid elements being open/closed). Following random initialisation, the simulation demonstrated the progressive spread of SME failures and eventual collapse of the interconnected network after reaching a tipping point of disturbance magnitude.
The speed of returning to a stable position and the level compared to the pre-disturbance state, where this new stability settles, may be diverse for various reasons. Therefore, several time-dependent shock reaction modes are expected as well. These modes should be investigated based on objective “hard data” that must necessarily be monitored throughout the turbulent period in question [19]. The observed variables are anticipated to have different levels for each company and show an alternate relaxation dynamic in the post-disturbance period. This time-dependent dynamic of observable explanatory variables is of great interest. Its investigation requires some kind of standardisation of the descriptive data that can eventually lead to segmentation and further elaboration of the accessed company information.
The corresponding literature contains numerous alternatives for characterising resilient behaviour. Nevertheless, many authors highlight the lack of consensus on a standardised indicator or adequate mathematical definition that would meet every practical expectation and urge greater attention to this scientific insufficiency [1]. However, several concepts can be found, which rarely manage to utilise financial hard data. Only a few authors have presented longitudinal data covering more than a decade and containing information on multiple industrial branches [20]. This difficulty may be due to the challenges in accessing sufficient and trustworthy financial data for scientific purposes. A proper definition and way of measuring economic resilience are of high importance, since what is not measured cannot be controlled [5,7,12].

2.2. Prospects of Predicting SME Resilience

SMEs are often centralised organisations lacking in business management processes and managerial layers. The influence of human factors is magnified compared to larger enterprises. Since SMEs are primarily family-owned, owners should be actively involved in resilience-enhancing activities. These activities can also include collaborations, for instance, with local governments, educational institutes, and chambers of commerce. Such collaborations can lead to advancements in local strategies that contribute to better responses to imminent global challenges [21].
SMEs constitute important units within economic networks, where income opportunities and threats are shared. The collapse of individual elements or smaller parts of the network can trigger a domino effect of bankruptcies that endanger local economies or might have a negative impact on a regional level [13,22]. Therefore, favourable short-term reactions to economic disturbances are not only relevant to individual companies but also to local economies. Consequently, an “early-warning system” should be developed to forecast resilient and non-resilient shock reactions of companies on a large scale in a relatively general manner.
Bankruptcy prediction might serve as an analogous field where early-warning systems are created years before a potential downturn. Numerous classification schemes, such as k-nearest neighbour, decision tree-based methods, Logistic Regression, or neural networks, utilise financial data from balance sheets and income statements [22,23,24,25].
However, there exists a scientific gap regarding similar early-warning systems for predicting shock responses of companies. While several conceptual models are outlined, they primarily evaluate questionnaire information instead of financial hard data, constructing indicators for shock reactions accordingly. Therefore, a reproducible characterisation of resilience based on accessible financial data is desired, which could facilitate widespread comparisons of varying shock reactions across industrial sectors, countries, and time periods [5,7,12,26].

3. Methodological Approach

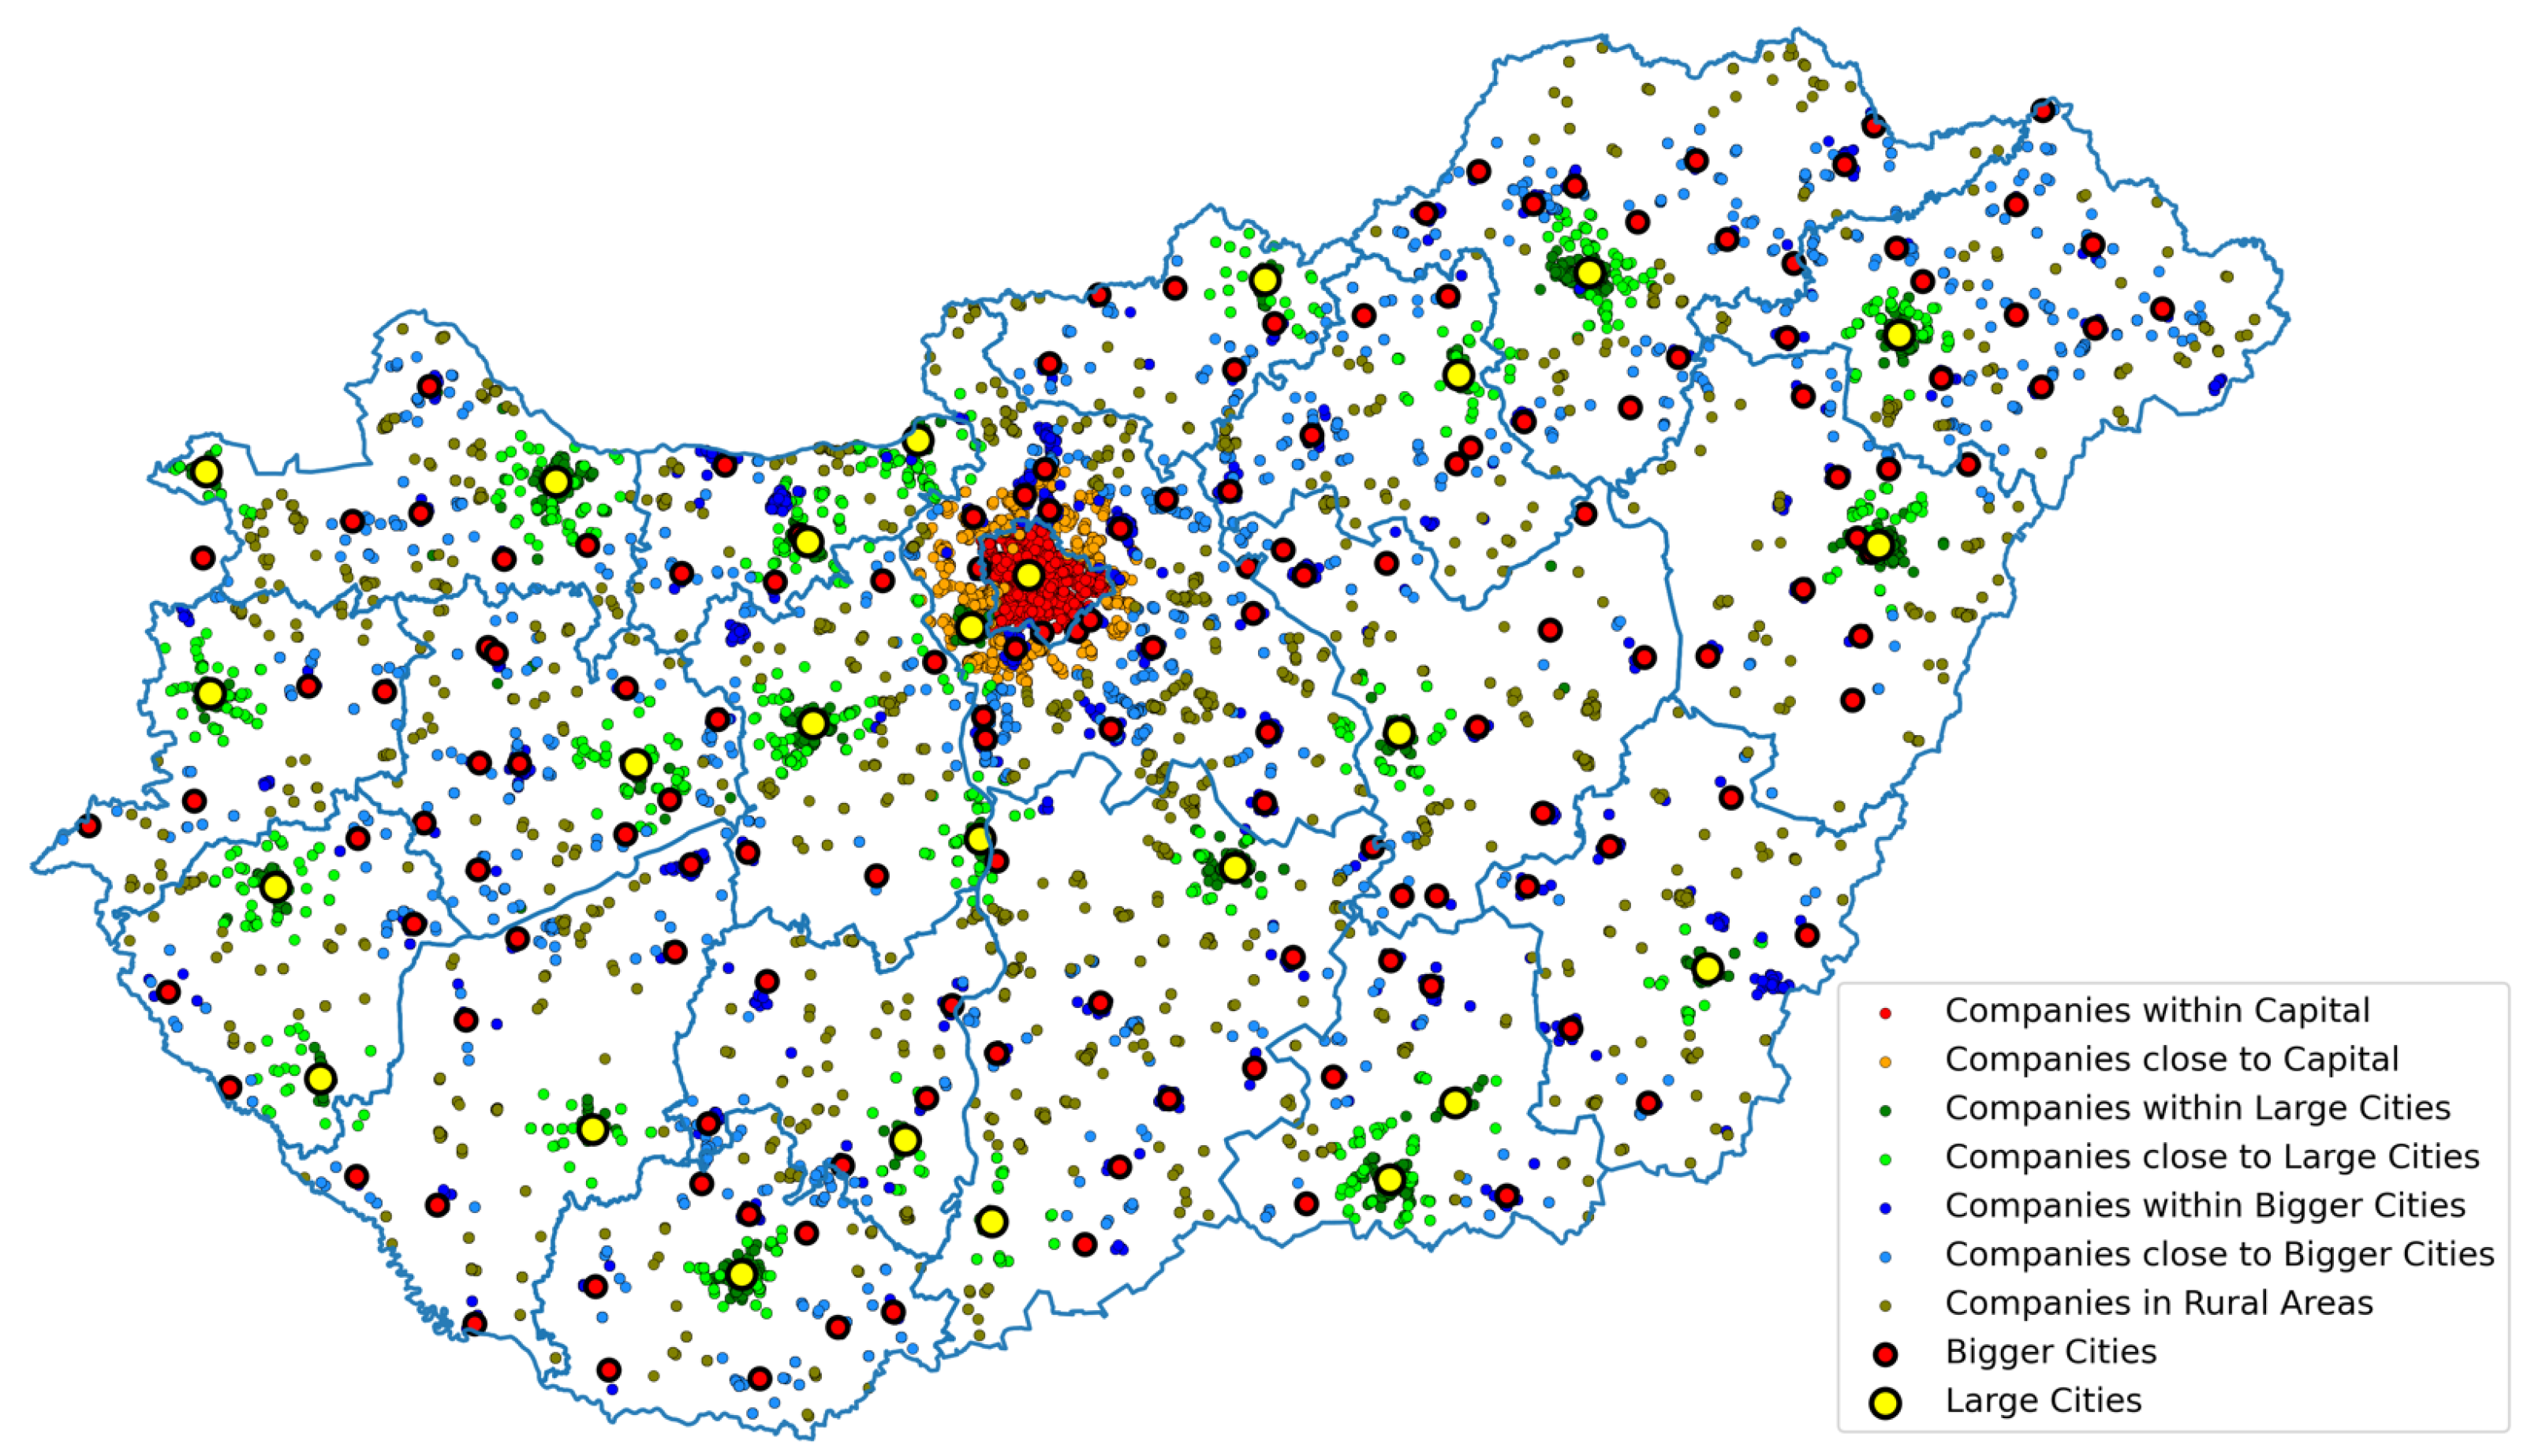
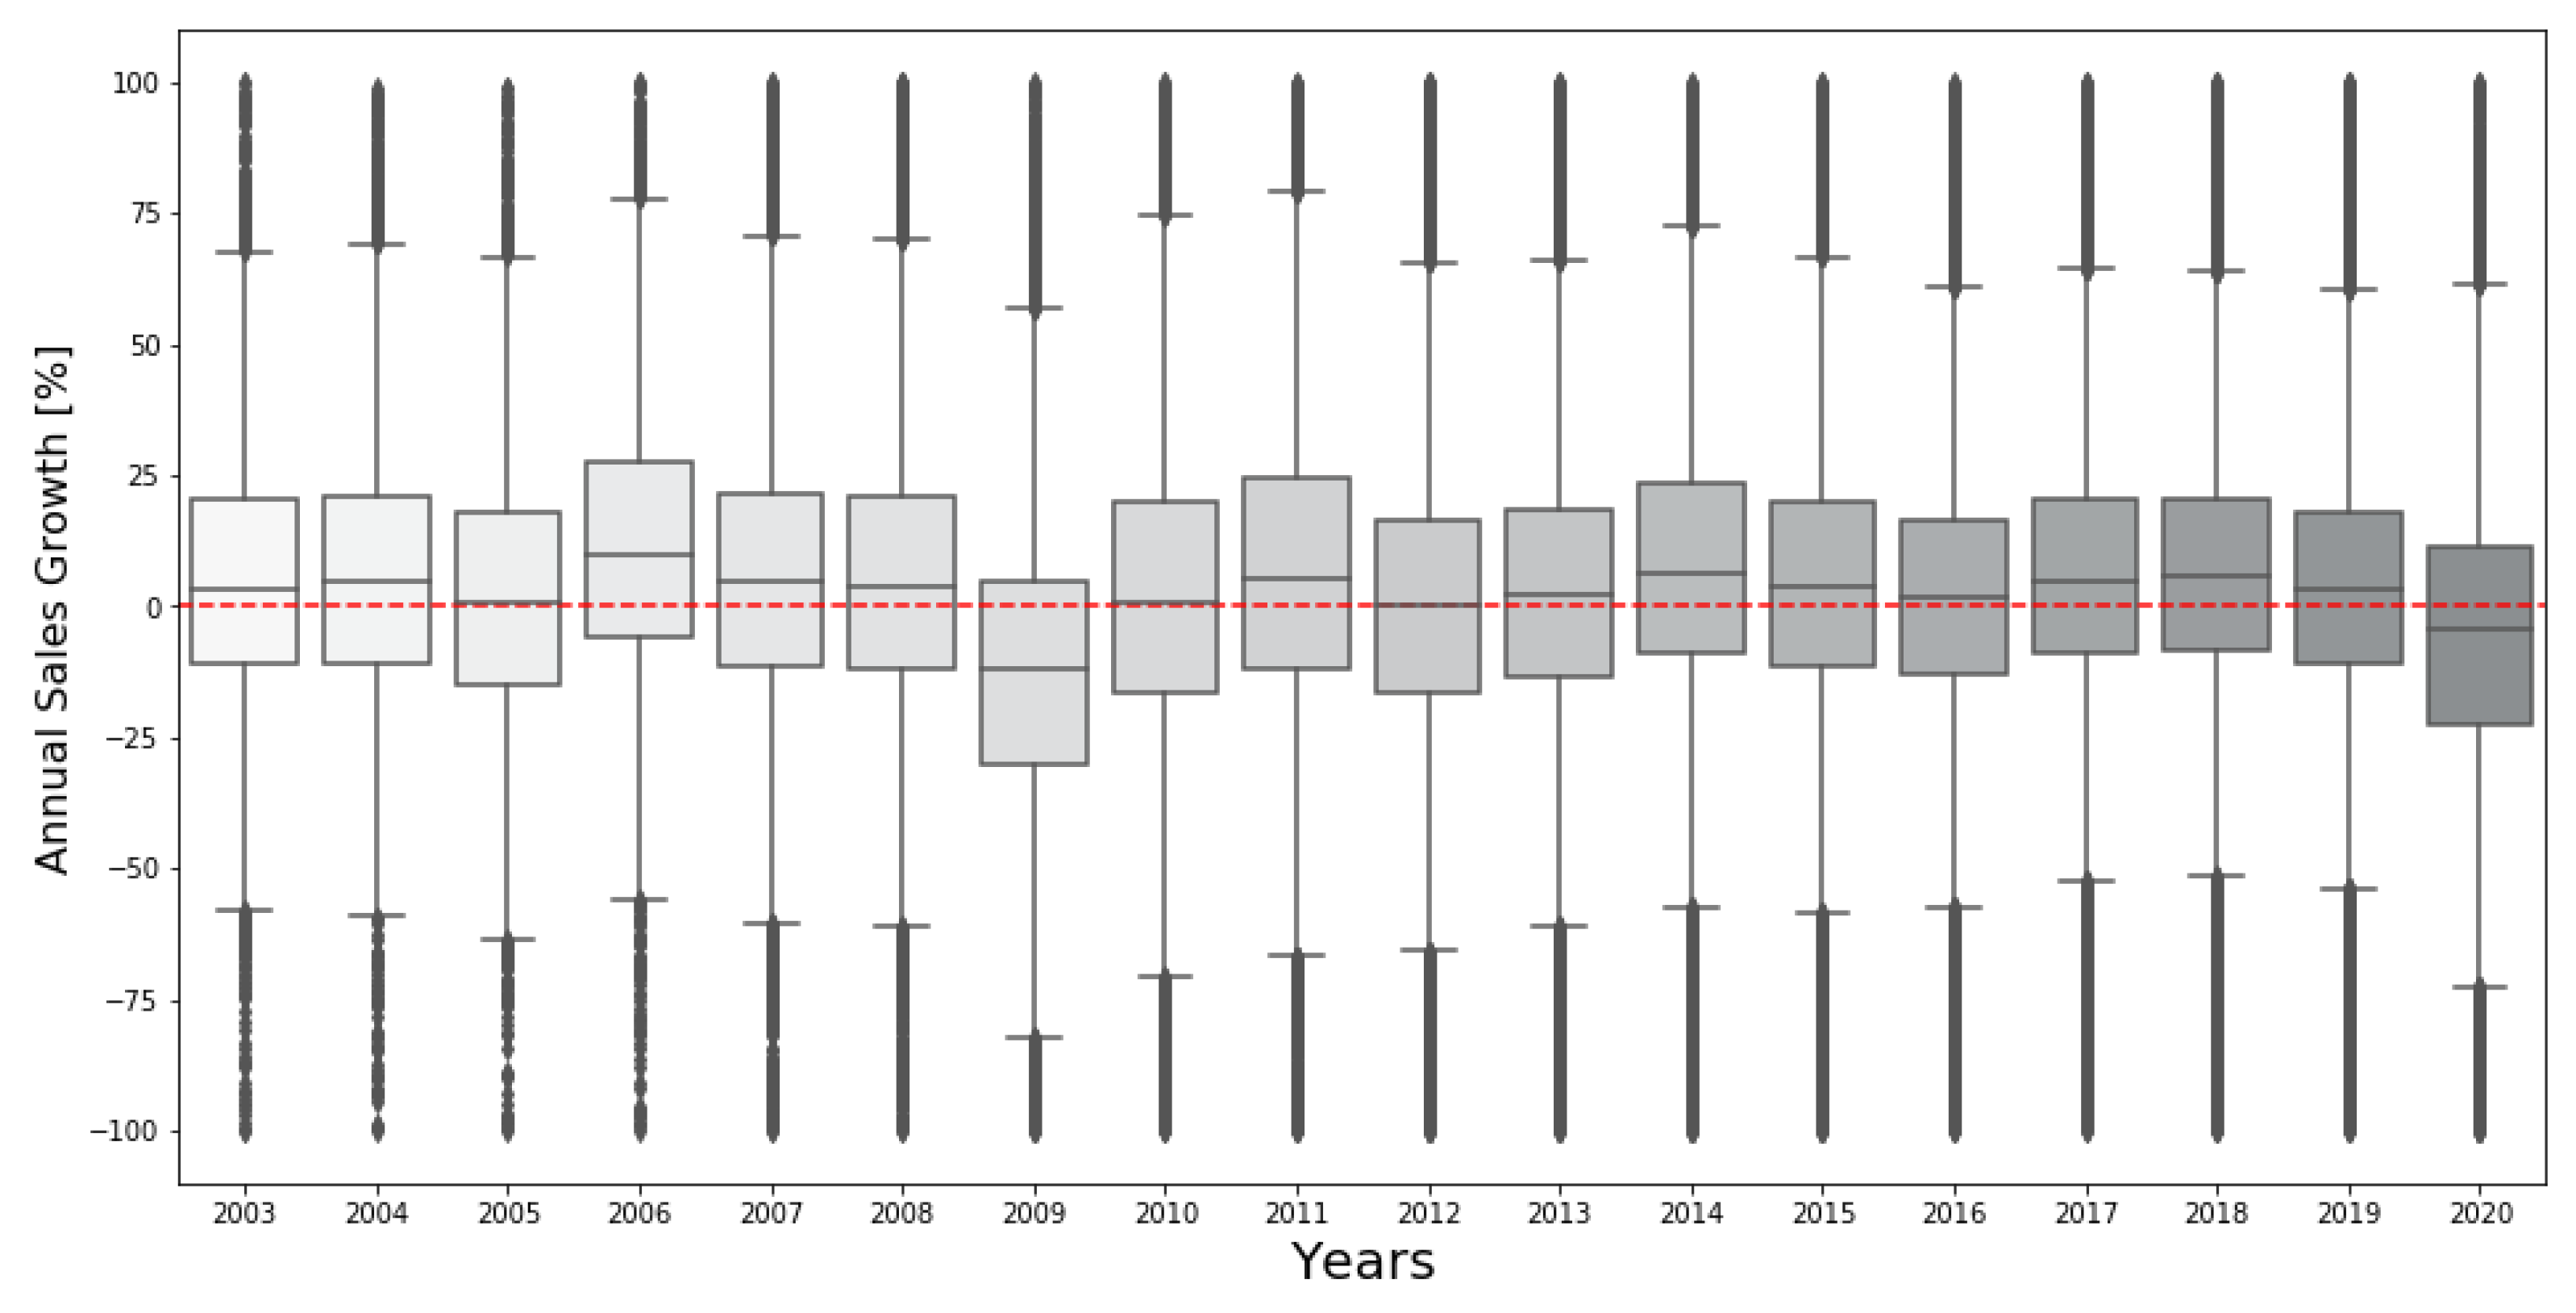
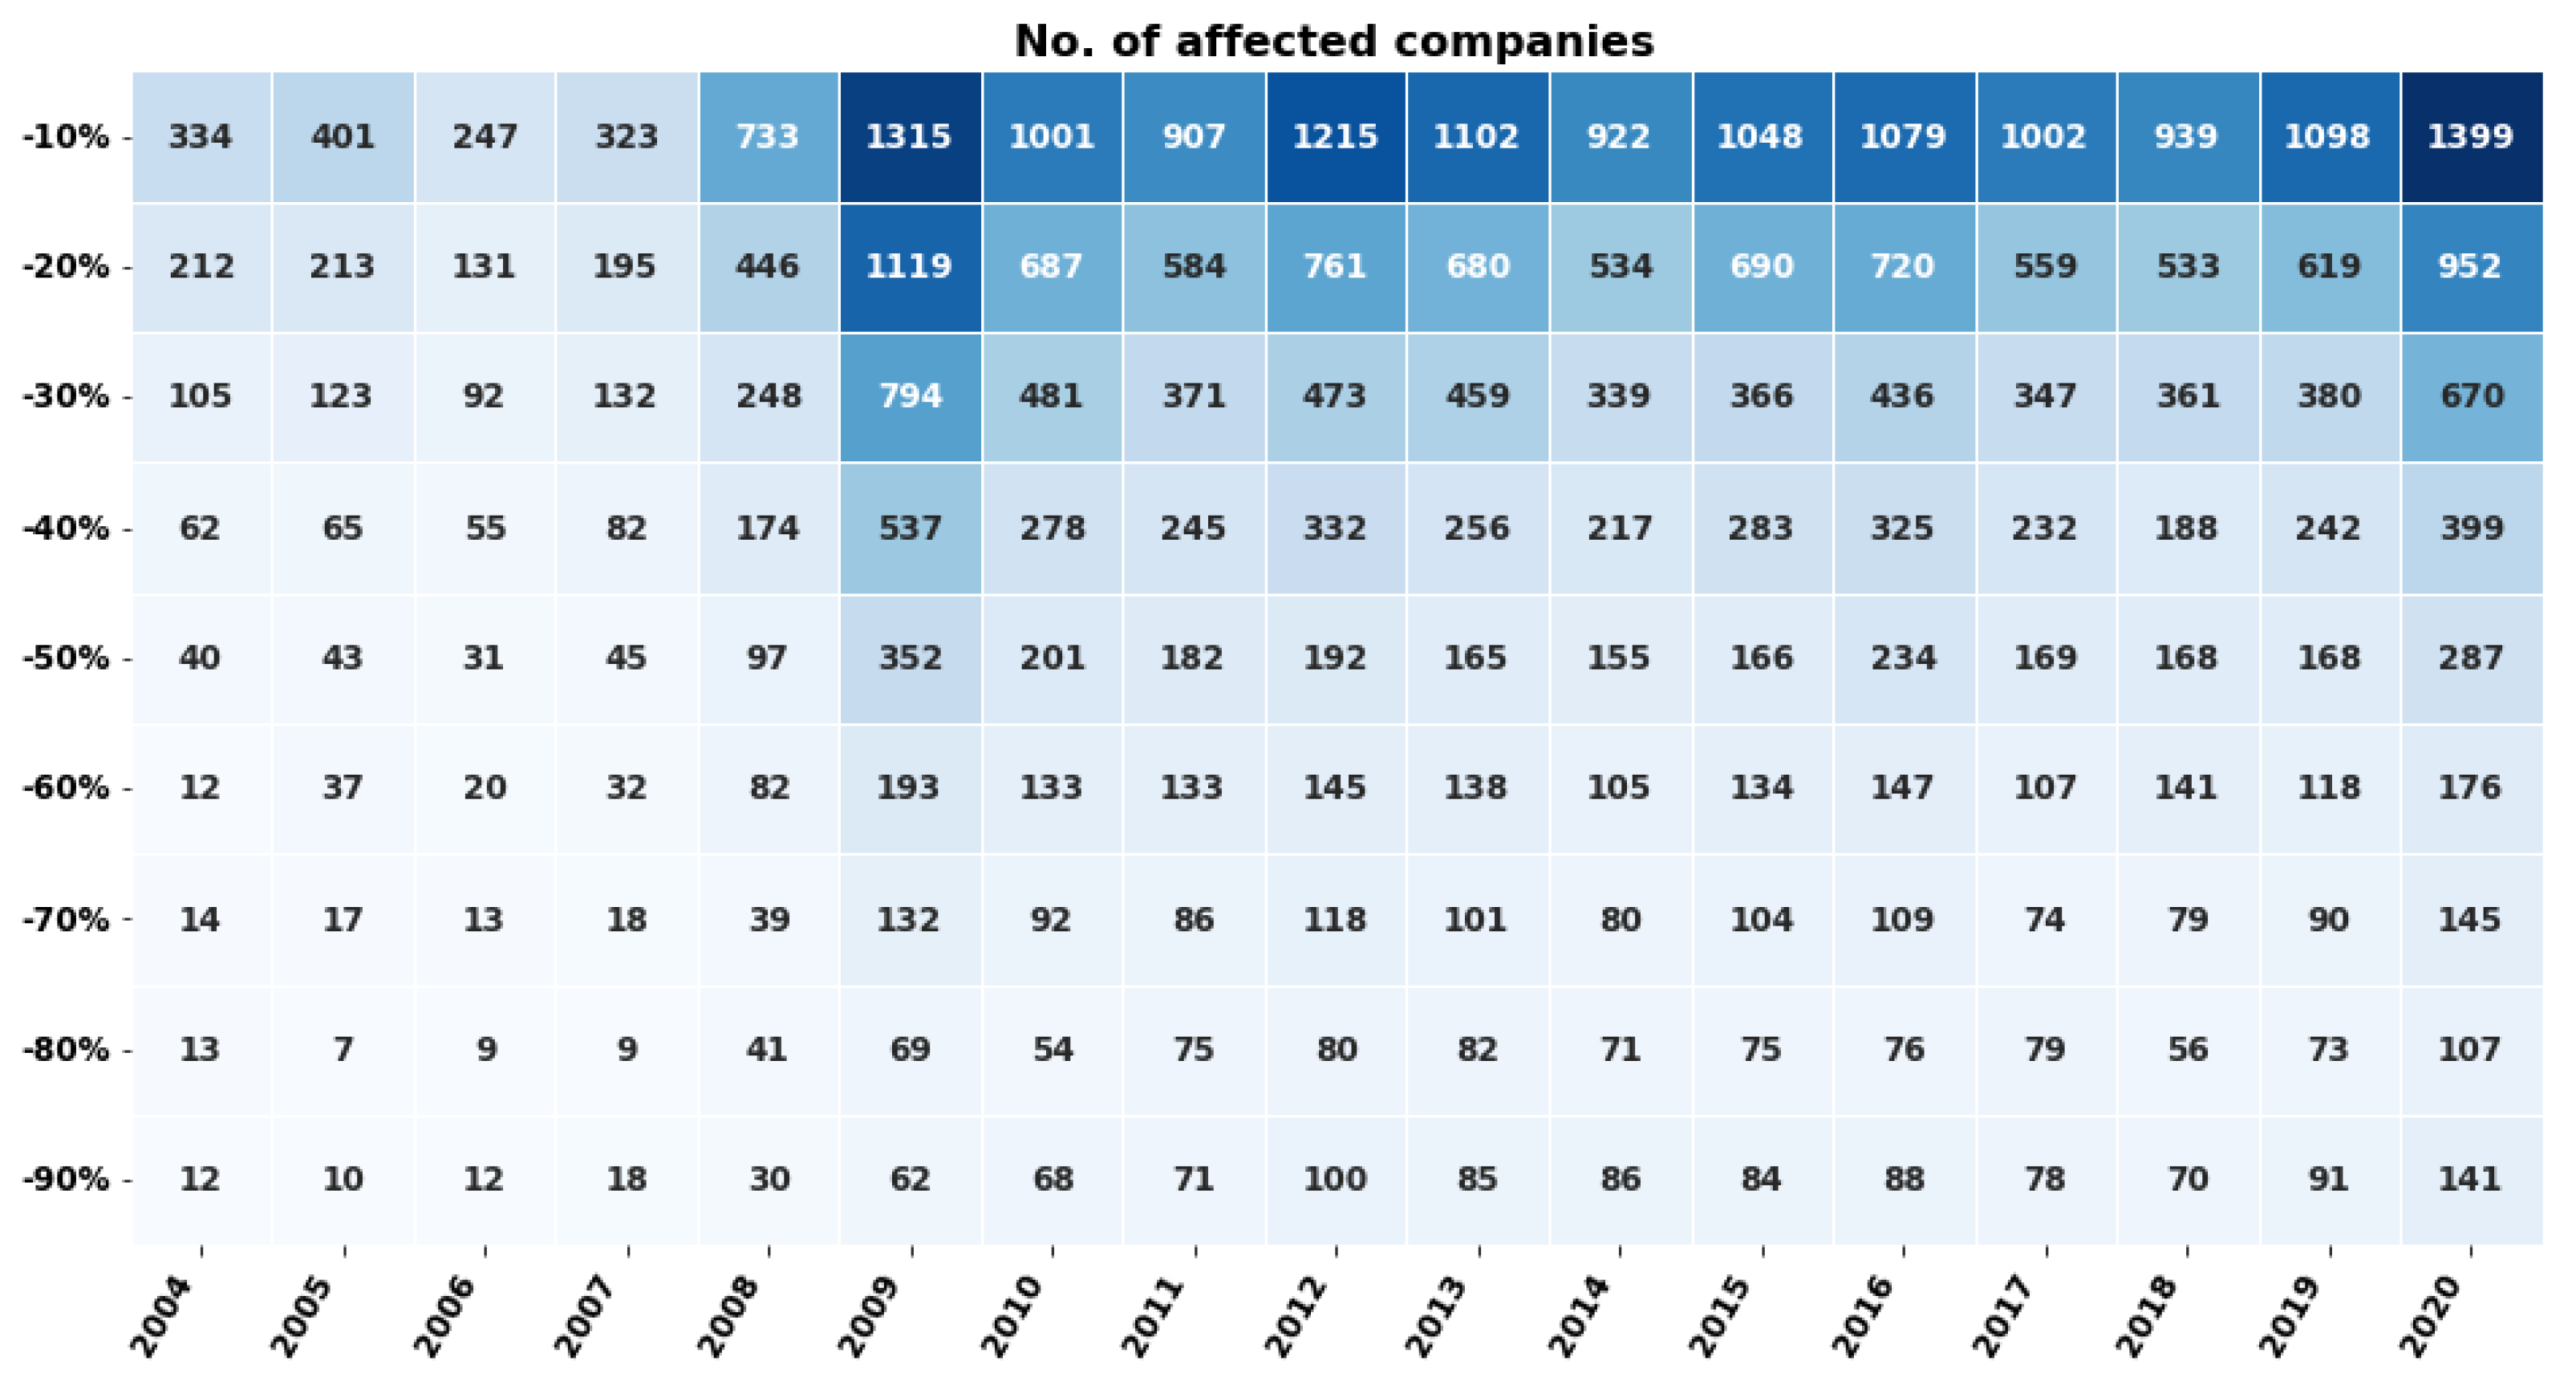
3.1. Data Description

In the outlined study, a longitudinal dataset of financial information has been analysed. The dataset primarily focused on the SME sector, which is particularly significant in terms of Hungary’s total generated GDP. In 2022, its contribution was 22.5%, the largest share among industrial branches [27]. The dataset comprised balance sheets and income statements on a yearly basis, employee numbers (provided in interval scale e.g., 5–9, 10–25, etc.), industrial branches, address information, and further historical data on bankruptcies, mergers, and legal statuses from 2002 to 2020. Altogether, time-dependent data from 26,783 different tax numbers were available.
In the following analysis, companies with an annual net income of at least HUF 100 million (for the base year of 2020) and with at least 10 employees at some point during the investigated time period were considered. This selection criterion narrowed the participants mainly to the SME sector and, according to Virág et al., helped to ensure the exclusion of enterprises that operated only periodically or might have unreliable financial data reported [24,28].
It is important to note that the Hungarian administration implemented changes that also affected the companies under study. These amendments included the recategorisation of industrial branches, bankruptcies, company mergers, and acquisitions, resulting in tax number alterations that needed to be harmonised. After data cleaning and unification, 79 different industrial branches remained and were represented by their corresponding NACE equivalent (see Table 1). The ranges of employee numbers were unified and aggregated for years when data existed, using the midpoint of interval endpoints as their annual estimates.
The available address information was used to generate geographical positions of the companies through geocoding performed by the geopandas 0.8.0 Python module [29]. Throughout this process, latitude and longitude values were assigned to each instance based on their geocoded addresses. After visualising the resulting positions on the map, the overall distribution of companies within Hungary can be observed. Most observations originated from county municipalities and primarily from the capital, Budapest, although rural areas also contained a significant number of registered economic entities.
These location data were further utilised to create new variables related to the level of urbanisation proximity. In addition to the presence of the capital, the proximity to “Large Cities” (cities with county rights) and “Bigger Cities” (district seats) was identified. During the further classification of company-year observations regarding levels of resilient behaviours using Logistic Regression and Random Forest models, the generated “urbanisation closeness” served as a supplementary feature variable (see Section 3.4).
Figure 2 illustrates the companies for which shock information could be assigned (defined as a minimum setback of −10% in sales growth at least once throughout their time-series data, as outlined in Section 3.2). Nodes are coloured according to their proximity to urbanised regions or larger regional centres.

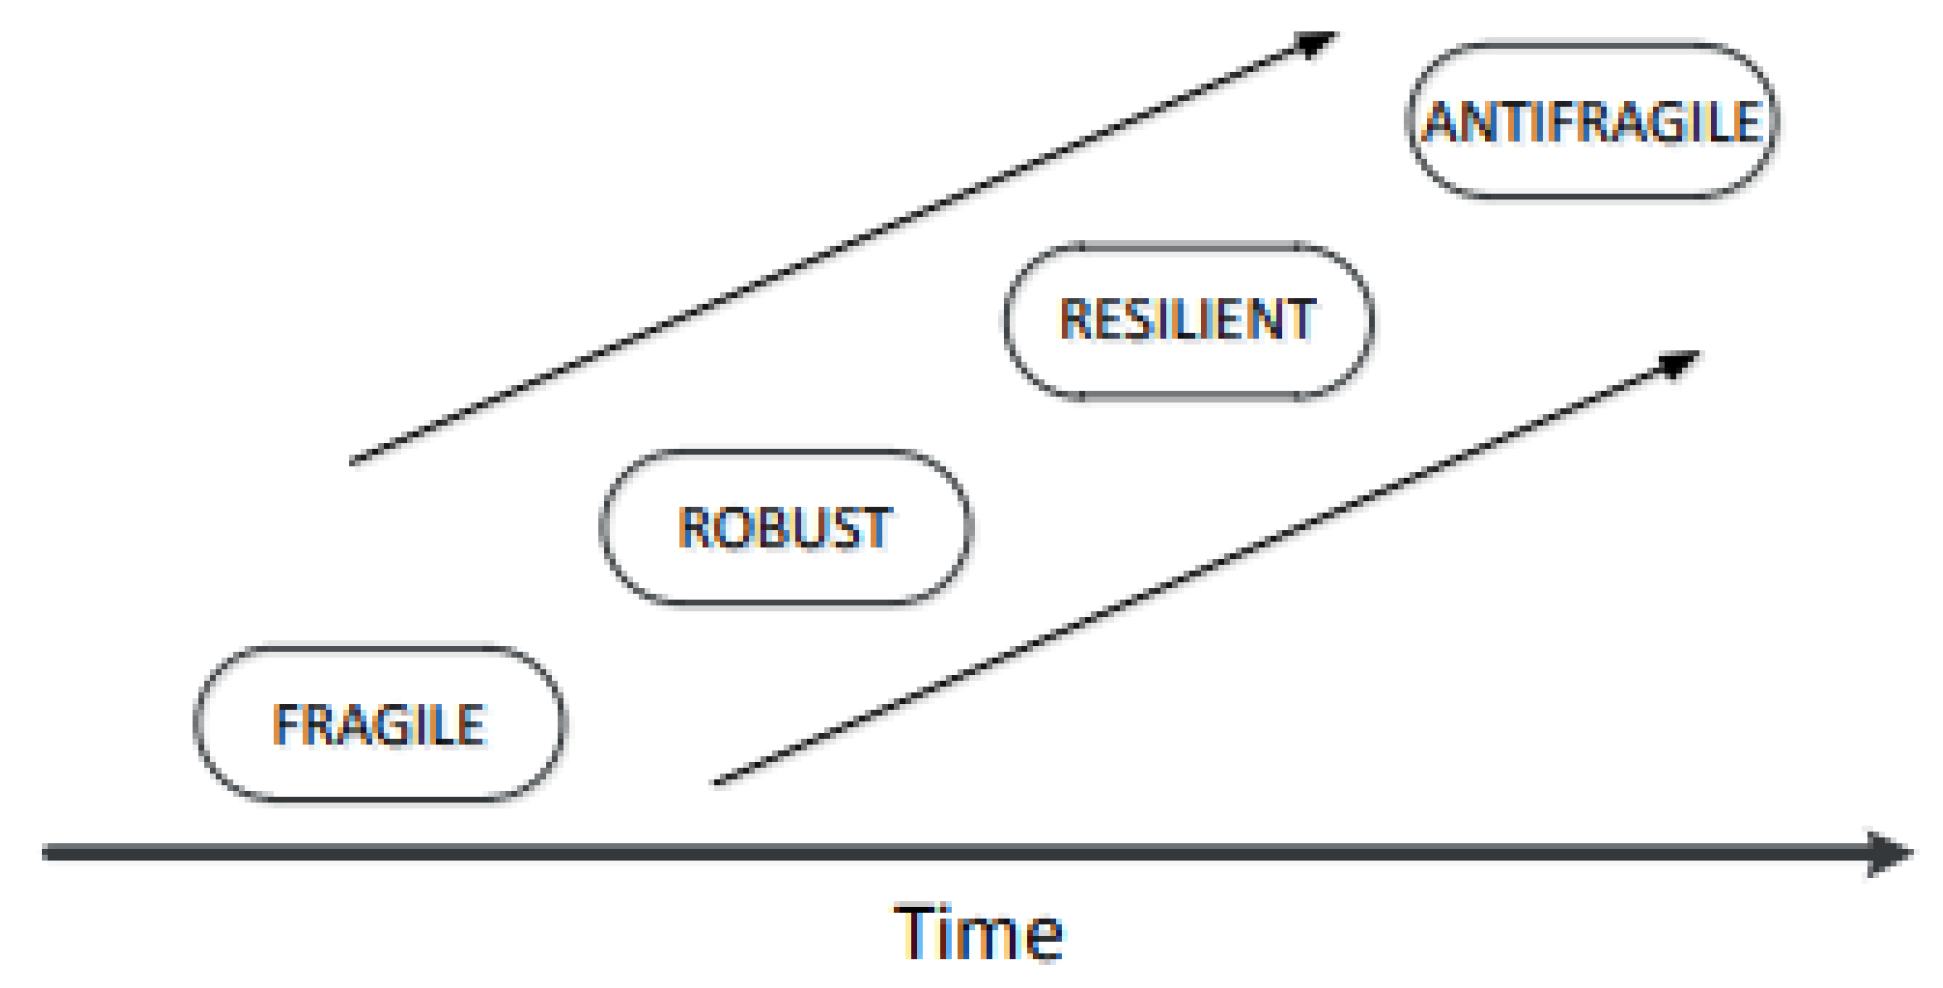
3.2. Proposed Resilience Index
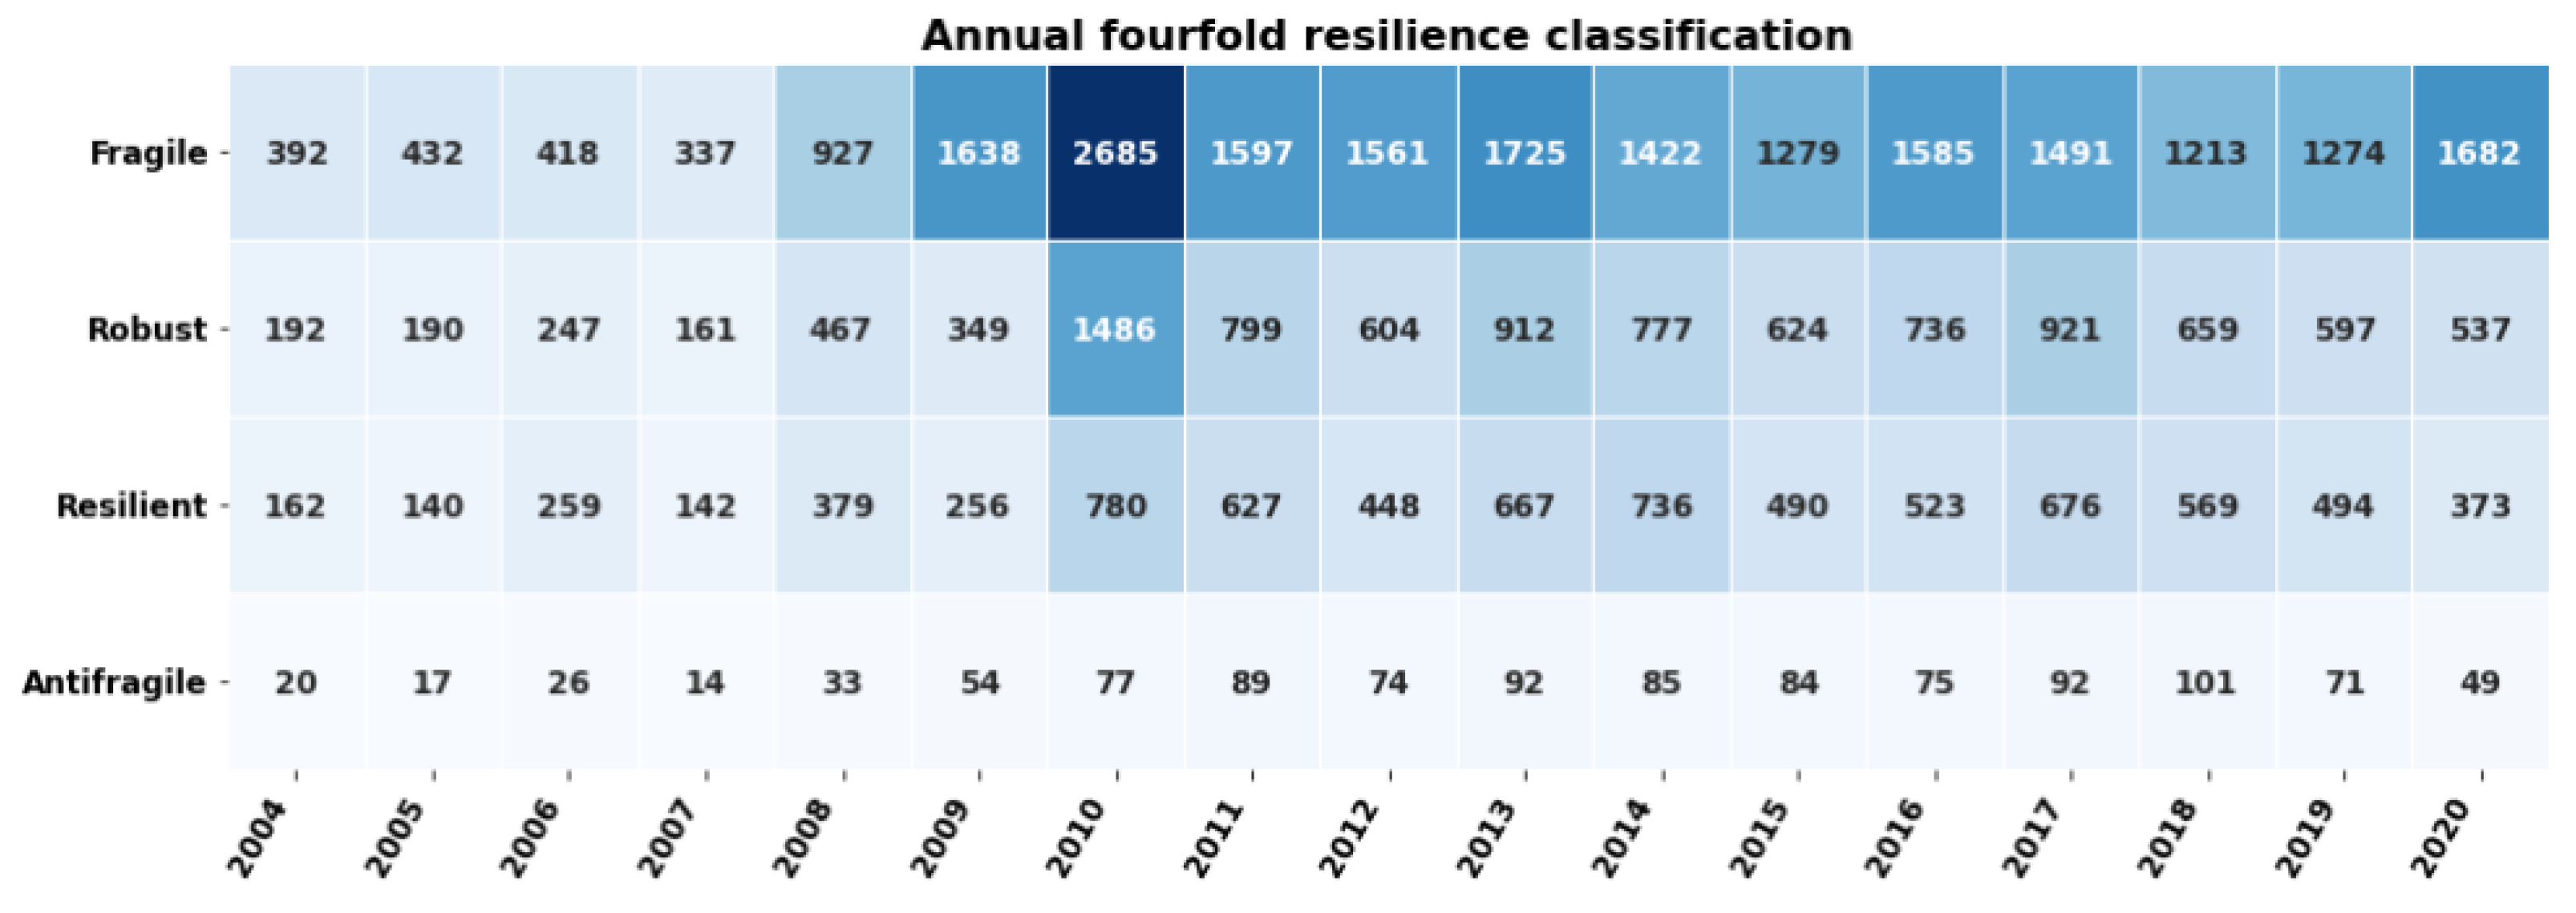
Since favourable shock reactions are considered to be related to economic performance, in the following section, resilience will be defined via changes in economic performance indicators. For the characterisation of economic resilience, several financial performance metrics are suggested in the literature; however, it is also emphasised that financial ratios (e.g., Return on Equity, Return on Assets, Return on Investment, etc.) might easily be biased [30]. The mentioned biases can originate from company-dependent book-keeping procedures, which can cause problems in statistical analyses. Although widely used, such ratio-type financial metrics can show contradictory time trajectories (e.g., in a growing phase due to management decisions or changes in the capital structure, ROE can increase or even decrease) [31]. Therefore, the use of these widespread metrics can imply spurious correlations that would not have otherwise occurred and can contribute to data-dependent, non-robust, and contradictory results in statistical investigations [32,33,34,35,36].
Therefore, for defining a simple and broadly applicable index to measure economic resilience, annual sales growth has been selected to characterise financial performance. The corresponding literature also often utilises sales growth, which represents the relative change in annual turnover. As such, it can reflect market conditions influenced by technological changes, competitor activities, shifts in customer requirements, and other economic crises, etc. The annual variation in sales growth among investigated Hungarian SMEs in the production sector between 2003 and 2020 is depicted in Figure 3. Macroeconomic crises negatively impacting the majority of the sector are clearly distinguishable from the figure for the years 2009 and 2020 [37,38,39].
Since sales growth is a relative quantity, it can be used to generate results regarding economic resilience that can be used in a comparative manner independently of industrial branch and company size. Therefore, it can serve as a basis for standardisation. However, according to our exploratory data analysis, rapid fluctuations in sales growth were present that made long-term investigations problematic. Only a few long-term steady states could be found in the time-series, and in many cases, only a few years showed relatively balanced figures among the companies’ consecutive setbacks. Therefore, due to practical reasons, short-term resilience investigations are supported, which fit real-life conditions more compared to long-term investigations, since the data at hand do not support the analysis of long-term effects caused by economic shocks [38,40,41].
On the other hand, the “life” and behaviour of an SME are largely influenced by human factors (owner, CEO, managers, etc.), which are also barely extensible to long-run investigations. According to the literature, resilience is treated as a behavioural pattern of an economic entity that covers a rapid reaction to an unpredictable crisis phenomenon and characterises the organisation’s capabilities to alleviate negative impacts from the year of the crisis to the following one [41,42]. Moreover, resilient behaviour is strictly treated as a specific type of economic crisis reaction. Consequently, only those companies can be said to be resilient that were exposed to an economic distress and could favourably react to it and survive at least once in their lifetimes [43]. The effect of a crisis was measured by the setbacks in the sales growth time-series of the company. The level of a −10% drop was used as the minimum threshold for defining a critical impact [39,44].
For the construction of a widely applicable and easy-to-interpret index for characterising shock reactions, the four-staged resilience maturity model outlined in Section 1 is utilised, but extended with practical considerations based on our data analysis. Consequently, fragile, robust, resilient, and antifragile behaviours are defined based on the following criteria [45]:
  • Fragile: R( year i + 1 ) < R( year i ) or
    SG( year i 1 , i ) > SG( year i 1 , i + 1 ) > −100%;
  • Robust: R( year i ) < R( year i + 1 ) < R( year i 1 ) or
    0% > SG( year i 1 , i + 1 ) > SG( year i 1 , i );
  • Resilient: R( year i 1 ) < R( year i + 1 ) < 2 · R( year i 1 ) or
    100% > SG( year i 1 , i + 1 ) > 0%;
  • Antifragile: 2· R( year i ) < R( year i + 1 ) or
    SG( year i 1 , i + 1 ) > 100%.
where R( year i ) stands for the revenue of year i when the crisis hits, while SG( year j , k ) denotes the sales growth from year j to year k. The outlined definition implicitly indicates that R( year i ) < R( year i 1 ). This means that there is an inevitable fallback in the annual turnover in the year of distress. According to the shock response observed through the enterprise’s economic input, represented by its annual revenue or sales growth in the subsequent years of those particularly overwhelmed by a shock, a time-dependent “crisis-reaction classification” can be assigned (see Figure 4).
The above-outlined definition considers resilience as a swift reaction interpreted in the short term as a response to a disturbance that results in an adequate restructuring of the organisation’s activities. Therefore, time-dependent reactions to idiosyncratic economic shocks can be labelled on an annual basis. Furthermore, the presented approach identifies companies requiring more than a single year to recover to their pre-crisis level, in terms of their annual revenue, to be non-resilient (fragile, robust) against the shock at hand. In this sense, organisations labelled as resilient or antifragile can also be denoted as “one-year reactive resilient companies” (OYRRCs). This concept aligns with everyday realistic expectations regarding the shock reactions of companies, which is of more interest in the short term.
For further investigations, companies with sufficiently long financial histories were considered, and rapid fluctuations belonging to company starting periods (start-up phase) were omitted. Thus, only companies without their first 3 years of financial data and with at least five existing financially closed fiscal years were analysed. In the resulting filtered dataset, 25,889 different tax numbers remained, providing 301,684 country-year observations. Among the filtered data, 40,695 country-year observations showed a setback in sales growth worse than −10%. In these cases, an indication of shock exposure and shock reaction was assigned to the corresponding observations. The number of survived economic downturns of different sales growth setbacks within the population can be seen on Figure 5.
The detection of drops in sales growth enables for the identification of annual company-level, idiosyncratic crises independently of their trigger factor or type (e.g., whether it is caused by any external macroeconomic circumstance, market condition, internal issues, etc.).
As a subgroup of shock reactions, the number of favourable shock responses to distress, defined by the drop in sales growth, can be given. In Figure 6, the joint number of resilient and antifragile observations is provided as a function of the exerted shock levels. These numbers aggregate the company-year observations in each year of the investigated time period when an organisation could respond positively to a shock in the consecutive year, in accordance with the concept illustrated in Figure 4.
With the four-level classification defined above, the characterisation of the whole Hungarian processing industry regarding annual idiosyncratic crisis responses has been completed. This classification could, of course, be broken down to any artificial subpopulations depending on scientific interest. Figure 7 shows the number of observations belonging to each classified group in each year, while further insight into crisis-related behaviour of the total population can be gained based on Figure 8, which provides a layout that aggregates the different responses to each shock level. In the top-left part of the matrix, company-year observations are presented where poor reactions took place even to small disturbances, while the bottom-right aggregates observations corresponding to powerful and effective reactions even for extreme negative impacts. These are technically the most interesting ones when speaking of best practices and could be utilised as invaluable input for further in-depth company-level resilience research.

3.3. Hypothesis Testing Regarding Resilient Shock Reactions

In order to collect the best practices regarding shock preparation, examples of praiseworthy crisis alleviations, and shock survival techniques, the quantitative identification of favourable shock reactions (resilient and antifragile) is required. For the latter, the generated “resilience history log” of the companies with group labels enables the comparison of companies reacting resiliently or antifragilely with those that were never exposed to economic disturbances of any kind that would have caused an annual setback in sales growth greater than −10% throughout their lifetimes [44].
In accordance with the general literature opinion on the positive aspects of resilience, the following hypotheses were formed in order to verify in a data-driven manner. These hypotheses fundamentally suppose that companies which are able to present successful crisis management and survive an economic downturn will gather invaluable experience that will eventually lead to decreased shock exposure later and an increased chance for prosperity:
Hypothesis 1 (H1).
Companies able to present resilient behaviour at least once are living longer than those that were never exposed to any shock.
Hypothesis 2 (H2).
Companies able to present resilient behaviour at least once have higher annual net revenue in the long run than those that were never exposed to any shock.
Hypothesis 3 (H3).
Companies able to present resilient behaviour at least once develop better regarding employee number in the long run than those that were never exposed to any shock.
Hypothesis 4 (H4).
Companies able to present resilient behaviour at least once can cope with the next shock better than companies showing non-resilient behaviour.
Hypothesis 5 (H5).
Companies able to present resilient behaviour at least once have less probability of going bankrupt than those that were never exposed to any shock.
Hypothesis 6 (H6).
Companies able to present resilient behaviour at least once have higher sales growth in the subsequent years after the shock than those that were never exposed to any shock.
Hypothesis 7 (H7).
Companies able to present resilient behaviour at least once have less equity-to-asset ratio than those that were never exposed to any shock.
Throughout the above-sketched hypothesis testing, a quasi-experimental setup was employed. A matched-pair analysis was conducted where idiosyncratic economic shocks of unknown origins were considered as treatment within the time-series data of each company. This setup helped to bypass issues arising to a certain extent from missing data, non-normal distributions, and the presence of outliers. For matching purposes, no data cleaning had to be performed in advance, as only complete company-year observations could be considered. Incomplete observations were therefore automatically excluded by the matching procedure. Pairs were selected to meet the following restrictions in accordance with the suggestions of [39]:
  • Within each pair, members were from the same main industrial sector.
  • Within each pair, members were of the same size regarding employment grouping.
  • Within each pair, members’ annual net revenue did not differ by more than 10% in the year following the shock, when corresponding shock reactions manifested.
  • Within each pair, members were selected so that neither had any “shock experience” before the investigated one (no previous sales growth drop greater than −10% in their time-series).
  • The formation of treatment and controlled group pairs was conducted on a random basis to minimise selection bias.

3.4. Predictive Model for Resilience

Since resilient behaviour of economic entities is essential for short-term survival and might have further favourable consequences in the long run, it is of special interest to identify possible common patterns in large datasets. By understanding the relationship among each type of shock reaction as output and available explanatory data as input, an “early-warning system” could be constructed to explore companies that might be jeopardised by a non-resilient reaction in the case of a certain level of setback [46]. According to the literature, the range of accessible data on enterprises is rather scarce, and only a few publications elaborate on comprehensive analyses based on longitudinal data from industrial branches with a wide scope. Thus, our data pool can provide valuable input for such a model construction [20].
To establish such a system, predictive models need to be created. Therefore, the analogous field of bankruptcy prediction has been investigated, since predicting resilient behaviour involves a relatively similar mathematical problem. However, in the case of bankruptcy prediction, we are dealing with a process, whereas for “resilience prediction”, we seek a swift reaction to an unpredictable negative deviation. Nonetheless, it is unclear whether the time-dependent financial variables, extended with other metadata on industrial branch and geographical location, contain the necessary information to predict shock reactions. Moreover, for bankruptcy prediction, more financial variables might collectively trend towards a negative direction, whereas in our case, only the sales growth data serves as the basis for labelling each company-year observation.
Within the framework of the early-warning system, the classification of company-year observations aims to predict the shock response of a company in year “i + 1” after an idiosyncratic shock in its sales growth time-series is detected. For this purpose, within the three datasets outlined above, financial variables of the three preceding years of shock occurrence are included as distinct feature vectors.
For the attempt of resilience prediction, three cleaned and transformed datasets have been prepared. The first one utilised financial variables that were extracted from the original balance sheets and income statements in their raw form (Data_1). Each company-year observation contained data from 4 years preceding the idiosyncratic shock of the company (i − 4, i − 3, i − 2, i − 1), the year of the shock (i), and a label based on the data of the consecutive year (i + 1) following the shock (see Figure 4).
The considered financial variables were as follows: (1) net sales, (2) operating income, (3) profit after tax, (4) fixed assets, (5) current assets, (6) liabilities, (7) inventories, (8) liquid assets, (9) shareholders’ equity, (10) current receivables, (11) current liabilities, (12) long-term liabilities, and (13) profit or loss of the year. These variables had less than 1% missing data per each and were essential for the calculation of financial ratios presented in Data_2 and Data_3.
The second dataset (Data_2) contained derived financial ratios from the listed variables that are recommended and broadly applied in bankruptcy prediction analyses according to [28]. The third dataset (Data_3) consisted of financial variables in the form of relative changes representing transitions from one year to the following one. The three datasets were handled separately without pooling their variables to avoid artificial multicollinearities. Missing values were addressed using the Multiple Imputation by Chained Equations (MICE) algorithm.
In addition to the above-described financial variables, other proxy variables were included in our investigations. The size of a company was represented by the number of employees, while its proximity to urbanised regions was determined based on Figure 2, defining surroundings of urbanised regions within a 10km distance radius. The age of companies at the time of crisis was measured in years, and the severity of shocks they experienced was quantified as percentages based on our definition outlined in Section 3.2. The number of crises causing setbacks worse than −10% in the preceding 3 years to the year under investigation was also incorporated. Similarly, their impact was measured as the sum of negative percentages of sales growth drops. This approach allowed for the consideration of the effects of crises in the preceding three years when developing the early-warning system. Furthermore, the average development rate based on annual sales growth increments, taking the year “i − 4” as the base year, was also added [47].

4. Results, Discussion

During the matched-pair analysis, enterprises were assigned to control groups if they had never experienced negative sales growth fluctuations worse than −10% throughout their lifetimes, except for the control group testing H4. In this case, fragile and robust observations constituted the control pairs. According to Shapiro–Wilk tests, all formed groups exhibited non-normal, highly left-skewed distributions for most variables. Therefore, one-tailed Wilcoxon signed-rank tests (W-values) were computed to check the validity of the hypotheses. However, one-tailed two-sample t-tests were also computed to strengthen results further, but W-values were considered decisive in cases of ambiguity.
To verify H4 and H5, χ 2 statistics were calculated along with corresponding odds ratios. The different statistical results and decisions are listed in Table 2. The pair-matching procedure and hypothesis testing were conducted for several years following the idiosyncratic shock occurrence to understand the dynamics of “relaxation”, or recovery, of the differences caused by the negative impact. The time shifts from the year of the shock are denoted by Δ t in years, while the sample sizes for each case are given by N (sample size variations are a direct consequence of the amount of missing data occurrence and finite company lifespans). Table 2 also includes mean and median values within the treated and control groups to illustrate the time evolution of corresponding group values in line with each hypothesis statement.
While the general literature perspective on resilience is optimistic and hopeful, the results from the matched-pair analysis do not explicitly suggest any competitive long-term benefits for companies that react favourably compared to their control pairs. Quite the opposite, technically, at the population level, companies exhibiting resilient or antifragile reactions tend to lag behind, and reacting favourably once does not imply enhanced resistance against future economic downturns. Therefore, the present results align with the findings of [39], where similarly analysed shocked companies showed increased susceptibility to future bankruptcy scenarios and financial difficulties. In our analysis, companies reacting resiliently actually formed a subset of shocked entities that tended to lag behind in the midterm and long run compared to their control group pairs in the post-shock period.
For the creation of the early-warning system for favourable shock reactions, a predictive model analogous to bankruptcy prediction trials was constructed. Logistic Regression (LR) and Random Forest (RF) models were applied to classify the labelled data, as described in Section 3.2. To mitigate collinearity issues arising from highly skewed, non-normal data distributions present in all three generated datasets, Mann-Whitney U-statistics were used to select more relevant variables for further modelling steps.
Results from the RF and LR classification models, along with descriptive information on the three generated datasets, are listed in Table 3. Classification metrics were calculated using a 10-fold cross-validation and presented together with corresponding mean values and standard deviations.
RF models demonstrated significantly better classification results than LR models. AUC scores greater than 0.7 were achieved with RF models, which is promising for future research. Furthermore, when considering only antifragile company-year observations (as a favourable subset of resilient reactions), even higher AUC scores were attained using the same RF and LR approaches.
However, restricting analysis to the antifragile subset of favourable shock reactions led to greater imbalance in the datasets for this class. This imbalance is evident in the lower F1 scores compared to those obtained when both resilient and antifragile reactions were considered for classification [48]. This highlights potential deficiencies in the definition of shock reactions given in Section 3.2 and the limitations of the classification procedure, which parallels bankruptcy prediction models utilising balance sheet and income statement data. It should also be noted that the generalizability of the outlined methodology and results should be tested on other datasets, as they are currently validated only for the dataset described.

4.1. Conclusions

Based on the pair-matching results outlined, economic entities that successfully navigate economic setbacks tend to lag behind in economic performance and momentum compared to un-shocked control pairs. This conclusion stems from a population-level analysis of financial data from Hungarian companies in the processing industry. Statistical analysis indicates that these negative effects are noticeable over a 5- to 10-year perspective. This finding contradicts common assumptions, as even effective short-term crisis management implies a sustained lag compared to control group members overall. Nonetheless, it is crucial to emphasise that proper crisis response in the short term is essential for survival and long-term operations. Therefore, it holds significant implications for future development prospects and job retention, which also yield numerous positive effects at local and regional levels.
These data-driven empirical findings align with the existing literature, which has shown that enterprises exposed to economic shocks tend to lag behind compared to control pairs [39]. Thus, in this aspect, the present research corroborates previous studies. However, this study extends the methodological approach by focusing on shock reactions. Specifically, it examines a subgroup of economic entities exposed to shocks but reacting favourably to them. To the best of the authors’ knowledge, this study is unique in assessing economic resilience with a financial data-based indicator that is generalizable and applicable for classifying and comparing shock reactions. Another unique contribution is its nuanced perspective on “resilient companies”, challenging the overly optimistic portrayal often found in scientific literature.
The key takeaway from these findings is that policymakers should view resilient organisations as economically “wounded”. Despite their short-term operational successes demonstrating resilience, continuous monitoring is essential. In cases where there is a national economic interest, resources should be promptly allocated to prevent setbacks and remove obstacles hindering their individual and regional economic growth. The delayed recovery of these seemingly resilient but economically affected actors can undermine economic competitiveness, productivity, and sustainability, factors that are often obscured by short-term survival successes and varying timescales.

4.2. Limitations, Future Work

While the analysed data provided a satisfactory foundation for economic investigations, it is important to acknowledge its limitations. Firstly, due to the absence of financial data-based indicators for foreign enterprises, we were constrained to Hungarian data, which may limit generalizability to other national economies. Moreover, the study focused on companies with an annual net revenue exceeding HUF 100 million, excluding smaller companies and start-ups. This exclusion could introduce bias when extrapolating results to the entire SME population. However, our primary goal was to examine responses to idiosyncratic economic shocks across the entire production sector. It is plausible, though beyond the scope of this study, that more homogeneous subsections (e.g., specific industrial sectors, sizes, ages) might yield slightly different results.
Sales growth was selected as an indicator of economic shocks based on the literature, without detailed information on specific causes. More comprehensive data on root causes could have facilitated the generation of additional feature variables, potentially enhancing predictive model capabilities. Currently, however, the available data and methodology proved inadequate for predicting resilient shock reactions based on the proposed Resilience Index. Similar to bankruptcy prediction models, future research could explore various combinations of variables and alternative indexes, drawing on economic or literature-based considerations.
Future work could also refine the Resilience Index by incorporating additional performance indicators. For instance, future studies might aim to identify and compare two-year and three-year resilient behaviours alongside one-year observations to enrich current findings. Machine learning-based classification techniques could potentially mitigate data heterogeneity within individual industrial branches or based on other relevant criteria.

Author Contributions

Conceptualisation, F.T.; methodology, F.T.; software, F.T.; validation, F.T.; formal analysis, F.T.; investigation, F.T.; resources, B.B.; data curation, B.B.; writing—original draft preparation, F.T.; writing—review and editing, G.E.; visualisation, F.T.; supervision, B.B. and G.E.; project administration, G.E.; funding acquisition, G.E. All authors have read and agreed to the published version of the manuscript.

Funding

The presented study was supported by the National Research, Development and Innovation Fund of Hungary within the framework of the TKP2021-NKTA-36 funding scheme. Further supported by the National Research, Development and Innovation Fund of Hungary within the framework of the project 2019-1.3.1-KK-2019-00007 by the 2019-1.3.1-KK funding scheme. The publication was supported by the Applied Informatics and Applied Mathematics Doctoral School of Óbuda University and by the Pannon Business Network Association.

Institutional Review Board Statement

Not applicable.

Informed Consent Statement

Not applicable.

Data Availability Statement

Utilised raw data were used under license for the current study and are not available publicly for secondary analysis. Restrictions apply to the availability of these data. Data were obtained from the Pannon Business Network Association (Hungary) and are available from the authors with the permission of the Pannon Business Network Association.

Conflicts of Interest

The authors declare no conflicts of interest.

References

  1. Bhamra, R.; Dani, S.; Burnard, K. Resilience: The concept, a literature review and future directions. Int. J. Prod. Res. 2011, 49, 5375–5393. [Google Scholar] [CrossRef]
  2. Holling, C. Resilience and stability of ecological systems. Annu. Rev. Ecol. Syst. 1973, 4, 1–23. [Google Scholar] [CrossRef]
  3. Aleksić, A.; Stefanović, M.; Arsovski, S.; Tadić, D. An assessment of organizational resilience potential in SMEs of the process industry, a fuzzy approach. J. Loss Prev. Process Ind. 2013, 26, 1238–1245. [Google Scholar] [CrossRef]
  4. Karácsony, P. Analyzing the Relationship between Leadership Style and Corporate Social Responsibility in Hungarian Small and Medium-sized Enterprises. Acta Polytech. Hung. 2020, 17, 183–198. [Google Scholar] [CrossRef]
  5. Aldea, A.; Vaicekauskaité, E.; Daneva, M.; Piest, J.P.S. Assessing Resilience in Enterprise Architecture: A Systematic Review. In Proceedings of the 2020 IEEE 24th International Enterprise Distributed Object Computing Conference (EDOC), Eindhoven, The Netherlands, 5–8 October 2020. [Google Scholar] [CrossRef]
  6. Varga, J. Defining the Economic Role and Benefits of Micro, Small and Medium-sized Enterprises in the 21st Century with a Systematic Review of the Literature. ACTA Polytech. Hung. 2021, 28, 209–228. [Google Scholar] [CrossRef]
  7. Kennon, D.; Schutte, C.S.; Lutters, E. An alternative view to assessing antifragility in an organisation: A case study in a manufacturing SME. CIRP Ann.-Manuf. Technol. 2015, 64, 177–180. [Google Scholar] [CrossRef]
  8. Masood, T.; Sonntag, P. Industry 4.0: Adoption challenges and benefits for SMEs. Comput. Ind. 2020, 121, 103261. [Google Scholar] [CrossRef]
  9. Némethné Gál, A. Competitiveness of Small and Medium-Sized Enterprises (In Hungarian). Ph.D. Thesis, István Széchenyi University, Doctoral School of Regional- and Business Administration, Győr, Hungary, 2009. Available online: https://rgdi.sze.hu/files/Ertekezesek,%20tezisek/Magyar%20Tezis%20NGA.pdf (accessed on 1 June 2023).
  10. Ruiz-Martina, C.; López-Paredes, A.; Wainer, G. What we know and do not know about organizational resilience. Int. J. Prod. Manag. Eng. 2018, 6, 11–28. [Google Scholar] [CrossRef]
  11. Eckardt, O. Company Maturity Matrix. Emerg. Mark. J. 2008, 8, 28–30. [Google Scholar] [CrossRef]
  12. Man, T.K. Measuring and Analysing Resilience of Enterprise Architectures. In Proceedings of the 31th Twente Student Conference on IT, University of Twente, Enschede, The Netherlands, 5 July 2019. [Google Scholar]
  13. Ramezani, J.; Camarinha-Matos, L.M. Approaches for resilience and antifragility in collaborative business ecosystems. Technol. Forecast. Soc. Change 2020, 151, 119846. [Google Scholar] [CrossRef]
  14. Taleb, N.N.; Douady, R. Mathematical Definition, Mapping, and Detection of (Anti)Fragility. Quant. Financ. 2013, 13, 1677–1689. [Google Scholar] [CrossRef]
  15. Graça, P.; Camarinha-Matos, L.M. Performance indicators for collaborative business ecosystems—Literature review and trends. Technol. Forecast. Soc. Change 2017, 116, 237–255. [Google Scholar] [CrossRef]
  16. Somers, S. Measuring Resilience Potential: An Adaptive Strategy for Organizational Crisis Planning. J. Contingencies Crisis Manag. 2009, 17, 12–23. [Google Scholar] [CrossRef]
  17. Jung, H.; Hwang, J.; Kim, B.K. Does R&D investment increase SME survival during a recession? Technol. Forecast. Soc. Change 2018, 137, 190–198. [Google Scholar] [CrossRef]
  18. Sauser, B.; Baldwin, C.; Pourreza, S.; Randall, W.; Nowicki, D. Resilience of small- and medium-sized enterprises as a correlation to community impact: An agent-based modeling approach. Nat. Hazards 2018, 90, 79–99. [Google Scholar] [CrossRef]
  19. Erol, O.; Henry, D.; Sauser, B.; Mansouri, M. Perspectives on Measuring Enterprise Resilience. In Proceedings of the 2010 IEEE International Systems Conference, San Diego, CA, USA, 5–8 April 2010; pp. 587–592. [Google Scholar] [CrossRef]
  20. saad, M.H.; Hagelaar, G.; van der Velde, G.; Omta, S.W.F. Conceptualization of SMEs’ business resilience: A systematic literature review. Cogent Bus. Manag. 2021, 8, 1938347. [Google Scholar] [CrossRef]
  21. Gunasekaran, A.; Rai, B.K.; Griffn, M. Resilience and competitiveness of small and medium size enterprises: An empirical research. Int. J. Prod. Res. 2011, 49, 5489–5509. [Google Scholar] [CrossRef]
  22. Jabeur, S.B. Bankruptcy prediction using Partial Least Squares Logistic Regression. J. Retail. Comput. Serv. 2017, 36, 197–202. [Google Scholar] [CrossRef]
  23. Zizi, Y.; Oudgou, M.; Moudden, A.E. Determinants and Predictors of SMEs’ Financial Failure: A Logistic Regression Approach. Risks 2020, 8, 107. [Google Scholar] [CrossRef]
  24. Kristóf, T.; Virág, M. A Comprehensive Review of Corporate Bankruptcy Prediction in Hungary. J. Risk Financ. Manag. 2020, 13, 35. [Google Scholar] [CrossRef]
  25. Tinoco, M.H.; Wilson, N. Financial distress and bankruptcy prediction among listed companies using accounting, market and macroeconomic variables. Int. Rev. Financ. Anal. 2013, 30, 391–419. [Google Scholar] [CrossRef]
  26. Johnson, J.; Gheorghe, A.V. Antifragility Analysis and Measurement Framework for Systems of Systems. Int. J. Disaster Risk Sci. 2013, 4, 159–168. [Google Scholar] [CrossRef]
  27. Hungarian Central Statistical Office, Distribution of the Hungarian Gross Domestic Product among Industries. Available online: https://www.ksh.hu/stadat_files/gdp/hu/gdp0006.html (accessed on 10 June 2024). (In Hungarian).
  28. Virág, M.; Kristóf, T.; Fiáth, A.; Varsányi, J. Financial Analysis, Bankruptcy Prediction, Crisis Management; Kossuth Kiadó: Budapest, Hungary, 2013; ISBN 978 963 09 7724 1. (In Hungarian) [Google Scholar]
  29. Jordahl, K. GeoPandas: Python Tools for Geographic Data. 2014. Available online: https://github.com/geopandas/geopandas (accessed on 15 June 2023).
  30. de Wet, J.; du Toit, E. Return on equity: A popular, but flawed measure of corporate financial performance. S. Afr. J. Bus. Manag. 2007, 38, 59–69. [Google Scholar] [CrossRef]
  31. Murphy, G.B.; Trailer, J.W.; Hill, R.C. Measuring performance in entrepreneurship research. J. Bus. Res. 1996, 36, 15–23. [Google Scholar] [CrossRef]
  32. Brambor, T.; Clark, W.R.; Golder, M. Understanding Interaction Models: Improving Empirical Analyses. Political Anal. 2006, 14, 63–82. [Google Scholar] [CrossRef]
  33. Curran-Everett, D. Explorations in statistics: The analysis of ratios and normalized data. Adv. Physiol. Educ. 2013, 37, 213–219. [Google Scholar] [CrossRef]
  34. Kim, J.H. Spurious Correlation between Ratios with a Common Divisor. Stat. Probab. Lett. 1999, 44, 383–386. [Google Scholar] [CrossRef]
  35. Barnes, P. The Analysis and Use of Financial Ratios: A Review Article. J. Bus. Financ. Account. 1987, 14, 3311–3323. [Google Scholar] [CrossRef]
  36. Lev, B.; Sunder, S. Methodological Issues in the Use of Financial Ratios. J. Account. Econ. 1979, 1, 187–210. [Google Scholar] [CrossRef]
  37. Tognazzo, A.; Gubitta, P.; Favaron, S.D. Does slack always affect resilience? A study of quasi-medium-sized Italian firms. Entrep. Reg. Dev. 2016, 28, 768–790. [Google Scholar] [CrossRef]
  38. de Mandojana, N.O.; Bansal, P. The Long-term Benefits of Organizational Resilience Through Sustainable Business Practices. Strateg. Manag. J. 2015, 37, 1615–1631. [Google Scholar] [CrossRef]
  39. Pálovics, R.; Dolenc, P.; Leskovec, J. Companies under stress: The impact of shocks on the production network. EPJ Data Sci. 2021, 10, 57. [Google Scholar] [CrossRef] [PubMed]
  40. Markman, G.M.; Venzin, M. Resilience: Lessons from banks that have braved the economic crisis—And from those that have not. Int. Bus. Rev. 2014, 23, 1096–1107. [Google Scholar] [CrossRef]
  41. Pal, R.; Torstensson, H.; Mattila, H. Antecedents of Organizational Resilience in Economic Crises—an Empirical Study of Swedish Textile and Clothing SMEs. Int. J. Prod. Econ. 2014, 147, 410–428. [Google Scholar] [CrossRef]
  42. Rose, A.; Krausmann, E. An economic framework for the development of a resilience index for business recovery. Int. J. Disaster Risk Reduct. 2013, 5, 73–83. [Google Scholar] [CrossRef]
  43. Henry, D.; Ramirez-Marquez, J.E. A Generic Quantitative Approach to Resilience: A Proposal. INCOSE Int. Symp. 2010, 20, 291–301. [Google Scholar] [CrossRef]
  44. Nyikos, G.; Soha, B.; Béres, A. Entrepreneurial resilience and firm performance during the COVID-19 crisis–Evidence from Hungary. Reg. Stat. 2021, 11, 29–59. [Google Scholar] [CrossRef]
  45. Tolner, F.; Pálovics, R.; Barta, B.; Eigner, G. Long-term Development Perspectives of Resilient Companies. In Proceedings of the 2023 IEEE 21th Jubilee World Symposium on Applied Machine Intelligence and Informatics (SAMI), Herl’any, Slovakia, 19–21 January 2023; IEEE: Piscataway, NJ, USA, 2023. [Google Scholar] [CrossRef]
  46. Soroka, A.; Bristow, G.; Naim, M.; Purvis, L. Measuring regional business resilience. Reg. Stud. 2019, 54, 838–850. [Google Scholar] [CrossRef]
  47. Tolner, F.; Barta, B.; Eigner, G. Economic Resilience and Antifragility: Classification of SME’s Shock Reactions based on Balance Sheet and Income Statement Data. In Proceedings of the 2023 IEEE 17th International Symposium on Applied Computational Intelligence and Informatics (SACI), Timisoara, Romania, 23–26 May 2023; IEEE: Piscataway, NJ, USA, 2022. [Google Scholar] [CrossRef]
  48. Pejić, A.; Molcer, P.S. Predictive Machine Learning Approach for Complex Problem Solving Process Data Mining. ACTA Polytech. Hung. 2021, 18, 45–63. [Google Scholar] [CrossRef]
Figure 1. Four stages of shock reactions to an external disturbance [10].
Sustainability 16 05470 g001
Figure 2. Geographical location of investigated Hungarian SMEs from the processing industry with economic shock experience observable in their sales growth data.
Sustainability 16 05470 g002
Figure 3. Annual sales growth box-plots restricted to the [−100%, +100%] interval within the investigated time period (dashed line indicates the zero reference).
Sustainability 16 05470 g003
Figure 4. Time-dependent annual sales growth based on the classification of company-year observations for crisis reaction when a minimum of −10% setback occurs in fiscal history.
Sustainability 16 05470 g004
Figure 5. Number of companies exposed to a given level of idiosyncratic economic shocks throughout the investigated time period.
Sustainability 16 05470 g005
Figure 6. Number of companies on annual basis with a resilient or antifragile shock reaction at given sales growth setback levels.
Sustainability 16 05470 g006
Figure 7. Annual categorisation of company-year observations of the investigated Hungarian SMEs of the processing industry based on the improved and quantified resilience maturity model.
Sustainability 16 05470 g007
Figure 8. Detailed crisis influence or shock response layout for the total investigated time period at different shock levels (given in percentage on the x-axis).
Sustainability 16 05470 g008
Table 1. Main industrial sectors represented in the cleaned dataset listed in descending order by cardinality.
NACE CodeCardinalityIndustrial Sector
254981Manufacture of fabricated metal products
103284Food production
281827Manufacture of machinery and equipment n. e. c.
221555Manufacture of rubber and plastic products
461347Wholesale trade, except of motor vehicles and motorcycles
161330Manufacture of wood and of products of wood and cork, except furniture
331215Repair and installation of industrial machinery, equipment and tools
23987Manufacture of non-metallic mineral products
31920Furniture production
26709Manufacture of computer, electronic and optical products
29629Manufacture of road vehicles
47591Retail trade, except of motor vehicles and motorcycles
27548Manufacture of electrical equipment
32468Other manufacturing
15417Manufacture of leather and related products, footwear
1380Crop and animal production, hunting and related service activities
18339Printing and other reproduction activities
43336Special construction
36321Water production, treatment and supply
24290Manufacture of basic metals
45258Trade and repair of motor vehicles and motorcycles
20232Manufacture of chemicals and chemical products
51203Air Transport
41182Construction of buildings
30179Manufacture of other transport equipment
56154Hospitality
13150Manufacture of textiles
17132Manufacture of paper and paper products
52106Warehousing and support activities for transportation
4996Land transport by pipeline
4290Construction of other civil engineering projects
2178Manufacture of pharmaceuticals
1969Coke production, petroleum refining
1147Manufacture of beverages
3534Electricity, gas, steam and air conditioning supply
1431Manufacture of wearing apparel
3828Waste management
5024Water transportation
5523Accommodation service
222Forestry
536Postal and courier activities
33Fishing, fish farming
393Decontamination and other waste treatment
372Sewage collection and treatment
51Coal mining
Table 2. Main attributes of the resulted matched data in case of the proposed hypothesis with corresponding statistics and decisions. Tests were evaluated with progressing years—denoted by Δ t—measured from the year of shock reaction for indicating time evolution of relaxation dynamics (N.A. stands for not applicable).
HypothesisNGroup Means (Resilient/Control)Group Medians (Resilient/Control)t-ValuesW-ValuesOdds Ratio χ 2 (Df = 1)Decision
H113495.8/5.9 (years)6.0/6.0 (years)−0.597 (0.275)12,559 (0.036)N.A.N.A.Rejected
H2 ( Δ t = 2)1161320.1/395.2 (M HUF)129.5/179.3 (M HUF)−2.823 (0.002)184,387 (0.000)N.A.N.A.Rejected
H2 ( Δ t = 5)766331.5/550.9 (M HUF)125.1/246.5 (M HUF)−5.564 (0.000)51,920 (0.000)Rejected
H2 ( Δ t = 7)530482.1/721.5 (M HUF)134.6/314.3 (M HUF)−5.892 (0.000)24,692 (0.000)Rejected
H2 ( Δ t = 10)225490.3/1008.5 (M HUF)187.5/415.9 (M HUF)−4.788 (0.000)4170 (0.000)Rejected
H3 ( Δ t = 2)116418.2/20.87.0/14.5−1.121 (0.131)64,034 (0.000)N.A.N.A.Rejected
H3 ( Δ t = 5)76917.4/25.47.0/14.5−4.212 (0.000)28,920 (0.000)Rejected
H3 ( Δ t = 7)53120.4/30.87.0/14.5−2.906 (0.002)11,839 (0.000)Rejected
H3 ( Δ t = 10)22827.8/42.214.5/34.5−1.841 (0.033)2351.5 (0.000)Rejected
H4104N.A.N.A.N.A.N.A.0.095 (0.758)1.153 (0.759)Rejected
H5345N.A.N.A.N.A.N.A.0.120 (0.729)1.198 (0.729)Rejected
H6 ( Δ t = 1)10596.0/20.5 (%)−1.9/11.6 (%)−6.468 (0.000)177,337 (0.000)N.A.N.A.Rejected
H6 ( Δ t = 2)104812.8/19.3 (%)3.3/13.1 (%)−2.761 (0.003)203,523 (0.000)Rejected
H6 ( Δ t = 3)101210.9/18.4 (%)2.9/11.3 (%)−3.431 (0.000)188,676 (0.000)Rejected
H6 ( Δ t = 5)76710.0/16.8 (%)5.1/10.5 (%)−2.880 (0.002)111,607 (0.000)Rejected
H6 ( Δ t = 7)53014.2/12.6 (%)4.7/8.9 (%)0.471 (0.681)60,264 (0.002)Rejected
H6 ( Δ t = 10)2284.7/4.0 (%)−0.6/4.8 (%)0.186 (0.574)11,559 (0.067)Failed to reject
H7 ( Δ t = 2)10950.6/0.50.6/0.54.201 (0.000)345,400 (0.000)N.A.N.A.Rejected
H7 ( Δ t = 5)7300.6/0.60.6/0.63.975 (0.000)157,209 (0.000)Rejected
H7 ( Δ t = 7)5060.6/0.60.6/0.64.415 (0.000)78,097 (0.000)Rejected
H7 ( Δ t = 10)2200.7/0.60.7/0.63.979 (0.000)15,914 (0.000)Rejected
Table 3. Dataset info and metrics for classification performance evaluation for resilient + antifragile and for antifragile shock reactions.
Classification Results for Resilient + Antifragile Observations
 Data Info Random ForestLogistic Regression
 No. of SamplesNo. of VariableNo. of Missing DataNo. of True LabelsNo. of False LabelsAUCF1 ScoreRecallPrecisionAccuracyAUCF1 ScoreRecallPrecisionAccuracy
Data_140,6956036,728877431,9210.75 ± 0.020.48 ± 0.020.55 ± 0.040.42 ± 0.010.74 ± 0.010.64 ± 0.010.36 ± 0.020.43 ± 0.030.31 ± 0.010.67 ± 0.01
Data_240,695132115,660877431,9210.67 ± 0.010.39 ± 0.010.44 ± 0.020.34 ± 0.010.70 ± 0.010.48 ± 0.020.28 ± 0.020.45 ± 0.090.20 ± 0.010.50 ± 0.05
Data_340,6954874,950877431,9210.74 ± 0.010.46 ± 0.020.49 ± 0.030.43 ± 0.020.75 ± 0.010.57 ± 0.010.34 ± 0.010.50 ± 0.060.26 ± 0.010.58 ± 0.04
Classification Results for Antifragile Observations
 Data InfoRandom ForestLogistic Regression
 No. of SamplesNo. of VariableNo. of Missing DataNo. of True LabelsNo. of False LabelsAUCF1 ScoreRecallPrecisionAccuracyAUCF1 ScoreRecallPrecisionAccuracy
Data_140,6956036,728105339,6420.88 ± 0.020.30 ± 0.050.41 ± 0.090.25 ± 0.050.95 ± 0.010.78 ± 0.040.14 ± 0.030.36 ± 0.050.08 ± 0.020.88 ± 0.02
Data_240,695132115,660105339,6420.83 ± 0.020.21 ± 0.040.28 ± 0.050.17 ± 0.040.94 ± 0.010.53 ± 0.030.05 ± 0.010.35 ± 0.080.03 ± 0.000.67 ± 0.05
Data_340,6954874,950105339,6420.84 ± 0.010.20 ± 0.060.21 ± 0.080.22 ± 0.090.96 ± 0.010.61 ± 0.040.06 ± 0.000.63 ± 0.090.03 ± 0.000.53 ± 0.07
Disclaimer/Publisher’s Note: The statements, opinions and data contained in all publications are solely those of the individual author(s) and contributor(s) and not of MDPI and/or the editor(s). MDPI and/or the editor(s) disclaim responsibility for any injury to people or property resulting from any ideas, methods, instructions or products referred to in the content.

