Article

Cascade Failure-Based Identification and Resilience of Critical Nodes in Automotive Supply Chain Networks

School of Economics and Management, Xiamen University of Technology, Xiamen 361024, China
*
Author to whom correspondence should be addressed.
Sustainability 2024, 16(13), 5514; https://doi.org/10.3390/su16135514
Submission received: 23 May 2024 / Revised: 21 June 2024 / Accepted: 26 June 2024 / Published: 28 June 2024

Abstract

:
In the case of cascade failure, due to the close connection of the automobile supply chain network, the chain reaction caused by it should not be ignored; therefore, to find out the important nodes in the automobile supply chain network, to reduce the damage of cascade failure on the supply chain network, and to improve the destruction resistance of the automobile supply chain network is a problem that we should focus on. This paper takes Tesla’s new energy automotive supply chain network as an example to study the impact of cascade failure on the destructive resistance of the automotive supply chain network. From the analysis of the identification results, it is found that the key nodes in the automobile supply chain network with strong influence on risk propagation are mostly charging pile enterprises, motor enterprises, and electronic control enterprises at the core, such as Hengdian Electromagnetics, Wanma Stocks, etc. Meanwhile, Changxin Science and Technology, as a central control panel manufacturer with a large number of indirect suppliers, is also in the top position. Through the proposed key node identification method, it has good practical application value for preventing risk transmission in the automotive supply chain.

1. Introduction

In the context of globalization, the scale of the automotive supply chain has greatly increased, the relationship between enterprises has gone beyond the chain structure, the links between various parts of the automotive supply chain are compact, and the difficulty of operation is increasing day by day. Coupled with the impact of epidemics and the complex and volatile international situation, the risk of the automotive supply chain continues to increase, the operation of which inevitably leads to major failures. The automotive industry, as an indispensable industry in the national economy, and the study of automotive supply chain management can provide certain assistance to the entire manufacturing supply chain management [1]. The intricate relationship between enterprises in the automotive supply chain network has gone beyond the simple chain structure, and the risk of the automotive supply chain continues to increase as operational downtime caused directly or indirectly by various risks such as natural disasters, political and economic factors, labor strikes, and material shortages will inevitably affect the operation of the entire supply chain [2]. The rapid development of new energy vehicles and the manufacturing industry has accelerated the pace of technological iteration and the emergence of new business models. The supply chain of new energy vehicles can drive the automobile industry toward a green, clean, and low-carbon direction, reducing reliance on traditional energy sources while also decreasing environmental pollution and greenhouse gas emissions. Sustainable supply chain management can enhance resource utilization efficiency, minimize waste emissions, safeguard the ecological environment, and stimulate innovation in the new energy automobile industry. Furthermore, a sustainable supply chain can bolster enterprise competitiveness, lower costs, improve brand image, and attract investors and consumers. Therefore, ensuring stability in the complex supply chain network of automobile manufacturing enterprises is more crucial than ever before in today’s fiercely competitive market.
As a representative supply chain network, the automotive supply chain has the characteristics of a large number of enterprises, complex structure, large scale, etc., presenting complex network characteristics, and it is of great practical significance to assess the destructiveness of the automotive supply chain [3]. The development of sharing leads to great changes in the structure of the automotive supply chain network, followed by the risk of transformation, and the prevention of automotive supply chain risk propagation is imminent. Currently, research on the automotive supply chain focuses on three aspects. A part of scholars’ focus on the risk propagation of the supply chain, such as Tang et al. was to establish a cascading failure model of risk propagation by using the lost production capacity as an indicator to compare the robustness of the assembly supply chain network under different connection strengths and node thresholds [4]. Colon analyzed the appropriate level of governance to monitor and manage systematic risks in the supply chain by using complex system and complex network theories [5]. Some scholars focused on supply chain risk influencing factors, such as Zafar who explored supply chain management based on blockchain technology to achieve security and efficiency of the supply chain system [6]. Sathyan used a combination of fuzzy DEMATEL, fuzzy AHP, and fuzzy TOPSIS methods to find the most critical influencing factors on the automotive supply chain [7]. Li et al. established a multi-objective mathematical model to deal with dynamic supplier selection and order allocation to help reduce uncertainty in supply chain risk management [8]. Other studies focused on supply chain resilience, e.g., Li and Zobel developed a multi-dimensional quantitative framework to measure the overall supply chain network resilience, and analyze the short-term and long-term impacts of the network structure and the node risk capacity on the supply chain network resilience [9]. Since supply chains do not belong to any particular network type, some scholars have proposed that a combination of network characteristics will more accurately describe supply chain networks than network types, and therefore the relationship between network characteristics and supply chain resilience has been investigated [10].
In this paper, considering the complex composition of the automotive supply chain network and the interconnection between nodes, the cascade failure model is suitable for the characteristics of the actual automotive supply chain network, and in the constructed cascade failure model, considering that the load of the node enterprises in the automotive supply chain network is closely related to the relationship between the neighboring nodes, the definition of the initial load, and the load re-distribution is innovatively improved.
In complex networks, how to identify influential nodes is an important issue in analyzing the network structure. Node influence refers to the ability of nodes to disseminate information. The identification of influential nodes in complex networks has important theoretical and practical significance, and it is one of the most attractive research topics in recent years. With the deepening of research, many key node identification methods have appeared, such as degree centrality, median centrality, and so on, but all have certain limitations [11,12]. Wang proposed an influential node evaluation algorithm based on entropy and weight distribution of connected edges to ensure the accuracy and efficiency of the algorithm by measuring the uncertainty of the system through information entropy [13]. Maji improved the K-shell hybrid method with standard free parameters to improve the performance of K-shell centrality in node identification, but the free parameters with empirical settings imposed a certain limitations [14]. Wang focuses on the effect of each node on the efficiency of the whole network and defines the efficiency centrality on the basis of network efficiency to increase the generality of the algorithm [15]. For large and complex networks, some scholars have proposed to use the massive computational power of optimization algorithms to solve the node identification problem; for example, Sara proposed a sorting algorithm with a hybrid centrality measure for key node identification based on the topological characteristics of the network, which combines with the topological structure of the network to make the propagation more globally influential, but it cannot get rid of the drawbacks of the low resolution of the K-shell algorithm [16]. Xiao designed a GPU-based parallel algorithm to calculate the influence of nodes in the network, which greatly improved the computational speed of the algorithm, but could not guarantee the accuracy of the algorithm [17]. Nabaei used an artificial fish swarm algorithm for node identification, which could solve the shortcomings of traditional node identification methods that could not cope with the large-scale networks and dynamic networks [18].
Combining the above methods, this paper proposes a K-shell identification method based on neighborhood improvement. The K-shell method is the classical method for identifying key nodes in complex networks, but the method has some drawbacks, as it assigns the same kernel value only based on the positional information of the node without considering the importance of the node’s neighboring nodes to understand the risk propagation ability of the node in the network. Therefore, the K-shell algorithm is improved according to the global and local structure of the automotive supply chain network to improve the resolution and accuracy of the algorithm, is simulated and validated on the Tesla automotive supply chain network, and compared and analyzed with some existing key node identification methods. The method not only has high accuracy and resolution in complex networks, but also helps to improve the efficiency of network security protection and emergency response in the practical application of network security.

2. Materials and Methods

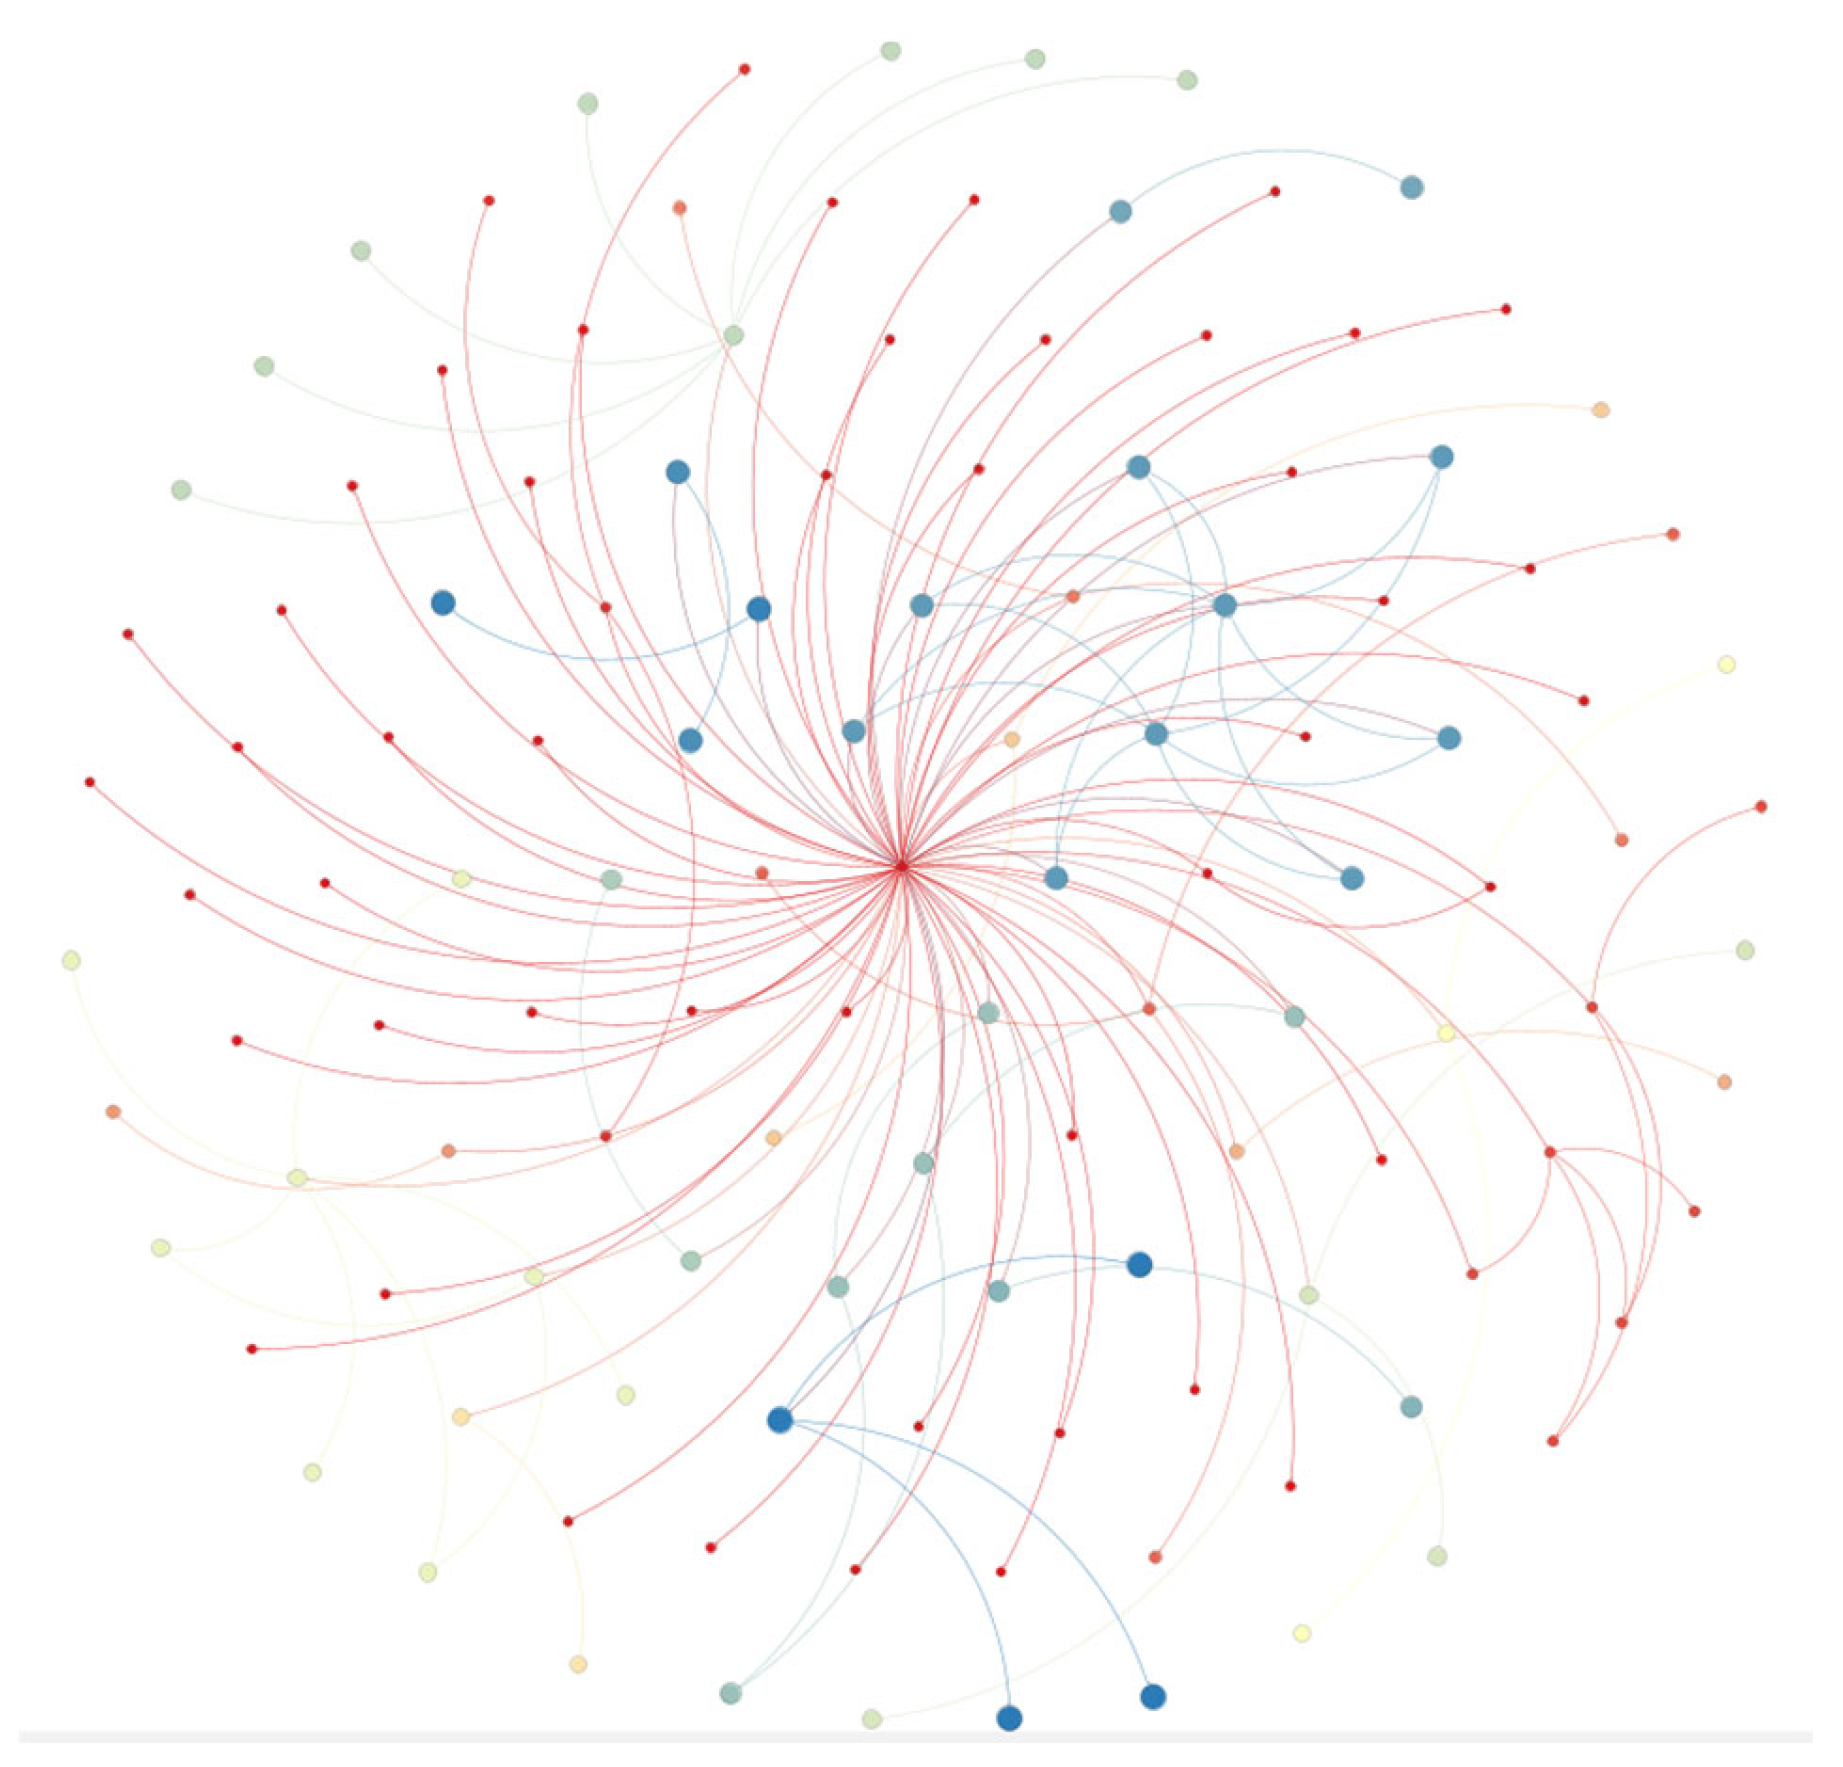
2.1. Automotive Supply Chain Network Modeling

Based on the study of the literature related to supply chain network model construction, complex network theory, and cascade failure theory, (the failure of a few nodes will cause other nodes to fail through the coupling relationship between nodes, leading to the collapse of most or even the whole network) the automotive supply chain network presents typical complex network characteristics due to the many subjects involved, and new energy vehicles face greater risks due to the high complexity of its integration and the high cost of components. Tesla, with its profound accumulation in the field of new energy, has steadily become the leader of the global new energy automobile market, so this paper takes the supply chain network of Tesla’s new energy vehicles as an example to study the impact of cascade failure on the destruction resistance of the automotive supply chain network.
When constructing the Tesla automobile supply chain network model, each enterprise in the automobile supply chain is taken as a node, and based on the correlation and connectivity between them, it is abstracted into a complex network structure diagram, which is represented by G = ( P , L ) , where P = { p 11 , p 12 , , p i j } represents all the node enterprises in the automotive supply chain network; L = p i j , p i j | l i j = 0   o r   1 } is the adjacency matrix, which represents the connection relationship of each node; if there is a connecting edge between node p i j and node p i j , then l i j = 1 , if there is no connecting edge between node p i j and node p i j , then l i j = 0 .
In this paper, the Tesla automobile supply chain network is divided into three layers: Tesla enterprises, direct suppliers of automobile parts, and indirect suppliers. The data of the Tesla automobile supply chain are collected from the “Overview of China’s New Energy Vehicle Industry in 2022” published by China Logistics and Purchasing Network, which includes a total of 125 node enterprises, and there are 146 connecting edges between Tesla and direct suppliers of new energy automobile parts and indirect suppliers. The network diagram is generated by Gephi 0.10.1, and the nodes of different modules are divided by colors to obtain the network diagram of the Tesla automobile supply chain under the Fruchterman Reingold layout, as shown in Figure 1, where each of the dots represents a company in Tesla’s automotive supply chain.
Tesla companies, as core companies in the overall supply chain network, generate a large number of links with different core suppliers, giving the node itself an extremely high degree value. The degree of the node enterprise is the connection relationship with other enterprises in the Tesla automobile supply chain network, and the larger the degree value, the more enterprises with which it generates supply relationships. In the Tesla automobile supply chain network, Tesla enterprises has the largest degree value and is in the core position, and all other enterprises have a supply relationship with Tesla enterprises directly or indirectly. In addition, according to the new energy vehicle parts and components system, it is divided into a power train system, central control system, electric drive system, charging system, chassis and body, interior and exterior decoration, and other modules.
The network characteristics of the Tesla car supply chain are calculated using Gephi 0.10.1 as shown in Table 1 The density of this network is 0.019, and the connection between node enterprises is not particularly close, but the average degree is high, 2.336, and each node enterprise in the Tesla car supply chain network has business relations with an average of 2.633 node enterprises. It can be seen that most nodes have small degree values, and the degree distribution of the automotive supply chain network follows a power law distribution (a variable possessing a distribution property where the distribution density function is a power function), which satisfies the scale-free nature (this means that when we go to different scales, we find that the system is the same, it does not change) of complex networks. Except for Tesla enterprises and some direct suppliers of component system modules whose degree values are too large, the degree values of the rest of the node enterprises are small, and the nodes with a degree less than or equal to 10 exist in large numbers in the network and produce less connectivity with other nodes, so the density of the network is small.
The average path length of the Tesla Motors’ supply chain network is 2.673, which is consistent with small-worldness using the network formula for small-worldness. Calculated according to the same network size with a small-world nature network (it pertains to a network constituted by numerous densely interconnected node clusters and a few remotely connected nodes. It possesses two attributes: dense interconnection and random connection), the average path length of the network should be 2.71, which can be seen to be very close to the average path length of the network in this paper, which is 2.673.
In summary, the Tesla automobile supply chain network has a small-world network nature, which indicates that the resource exchange efficiency in the network is high, and the resources can flow efficiently among the nodes. The nodes in the Tesla automobile supply chain are closely connected, there are more upstream and downstream enterprises cooperating, and the clustering coefficient indicates that there are very few small groups in the Tesla automobile supply chain. The average shortest path responds to the efficiency of the network, the shorter the path, the faster the response among the network nodes; the average shortest path of the Tesla automobile supply chain network is 2.673, which is comparable with the characteristics of the supply chain network of automobile enterprises obtained by sun’ research [19], and proves that the Tesla automobile supply chain network constructed in this paper is real and reasonable.

2.2. Identification of Key Nodes in Tesla Motors’ Supply Chain Network Based on an Improved K-Shell Algorithm

The K-shell method is the classical method for identifying critical nodes in complex networks, but the method has some drawbacks, as it assigns the same kernel value only based on the positional information of the node without considering the importance of the node’s neighboring nodes, which does not allow understanding the node’s ability to propagate the risk in the network. The importance of different neighboring nodes is different, and nodes with high Ks value neighboring nodes play a more critical role in the network; therefore, considering the importance of neighboring nodes can increase the accuracy of identifying the importance of nodes. In order to solve the deficiency of the K-shell method, as it is difficult to distinguish the key nodes in the same shell layer, this paper proposes a K-shell-based key node identification method for complex networks, which further considers the global and local structure of the network compared to the original K-shell method, which stratifies the network based on the K-shell method. This paper considers the global structure of the network and improves the nodes in the same layer with the same Ks value that cannot distinguish the deficiencies of the degree of importance, proposes to further distinguish the importance of the nodes within the same layer based on their first reachable nodes and second reachable nodes, and considers that the degree of importance of the node’s neighboring nodes affects the node’s ability to propagate throughout the network in order to improve the effectiveness of identifying the node’s criticality.
According to the global and local structure of the automotive supply chain network, this paper proposes a K-shell identification method based on domain improvement, which first stratifies the nodes by the K-shell method to determine the influence of the global structure of the nodes, and then measures the importance of the nodes according to the influence of the node’s first reachable and second reachable points, and defines the node’s importance index as follows:
K s i = E C 1 i · δ + E C 2 i · δ 2
where E C 1 i is the average eigenvector value of the first reachable point of the node, E C 2 ( i ) is the average eigenvector value of the second reachable point of the node, and δ ( 0,1 ) is the scaling factor.
For a node in a network, both neighboring nodes and distant nodes have an influence on that node, although each has a different degree of influence. In order to better distinguish the importance of the nodes without increasing the complexity of the computation, this paper only considers the influence of the first reachable node and the second reachable node. The influence factor δ is set so that the first reachable node is closer and has a greater influence on the node, while the second reachable node is further away and has a smaller influence on the node, and the influence factor δ belongs to the range between 0 and 1. The influence factor δ is set so that the first reachable node is closer and has a greater influence on the node, while the second reachable node is further away and has a smaller influence on the node.
The specific steps are as follows:
  • Decompose the Tesla automotive supply chain network using the K-shell method to obtain the Ks values of different categories of nodes.
  • Obtain the degree values of all nodes in the Tesla automotive supply chain network, using the number of connected edges of the nodes to measure the degree of centrality.
    d i = N d e g r e e
  • Computation of eigenvector centrality for all nodes in the supply chain network of Tesla Motors.
    e c i = e i = 1 λ i , j P l i j e j
    λ is the eigenvalue of the adjacency matrix L . l i j = 1 if the nodes are connected and l i j = 0 if they are not and is normalized by:
    E C i = e c min e c max e c min e c 2 max K s
  • Extract the average eigenvector value of the first reachable point of all nodes E C 1 i .
  • The second reachable point of each node is calculated cyclically using the BFS backtracking algorithm to obtain the neighbor matrix L’ of the second reachable node, and the average eigenvector value of the second reachable point E C 2 ( i ) is extracted.
    E C 2 i = E C i · l i j l i j
  • Based on the formula:
    K s i = E C 1 i · δ + E C 2 i · δ 2
    the weighted importance of each node is calculated.
Taking the Tesla automobile supply chain network as an example, the neighborhood-based K-shell-integrated distribution node identification method is used to rank them and compare them with the classical meso-centrality (BC), eigenvector centrality (EC), degree centrality (DC), and proximity centrality (CC) node identification methods, and the results of the comparison are shown in Table 2.
In order to understand the accuracy of the different node identification methods, a comparative analysis of the results of the different node identification methods is performed on the Tesla Motors’ supply chain network. The obtained node importance ranking is shown in Table 3, which is ranked according to the last column of the improved K-shell method as a criterion.
As can be seen from Table 2 and Table 3, the traditional K-shell method can only classify nodes into three levels, which makes it difficult to distinguish the importance of nodes in the same level, while the median centrality method calculates the number of nodes by the number of shortest paths of nodes, which is not able to calculate the importance value of some nodes at the edge of the network, such as Sugo, Kodari, Yazaki, Tradelink, Junsun, Dana, and Sanko, which have an importance value of zero. The eigenvector centrality method defines the centrality of a node in terms of the centrality of neighboring nodes, and proximity centrality is measured by the distance between nodes, both of which are overly dependent on the network topology, and the importance values of the node firms are relatively close to each other, except for the firm Tesla. The degree centrality method, on the other hand, can only classify the node firms into 8 classes, and it considers all neighboring nodes of a node to be equally important and their contributions to be equal, ignoring the importance of the neighboring nodes. The improved K-shell method in this paper divides all the nodes into 27 levels, which can better distinguish the node importance, and can also carry out a good identification of the importance value for the edge node enterprises, and from the experimental results, the improved K-shell method in this paper performs better in the Tesla Motors’ supply chain network.

2.3. Cascade Failure Modeling

In the automotive supply chain network, the connectivity degree can be used to show the connection between node enterprises: the more the number of node enterprises, the larger their network size, and the wider the degree of connectivity between node enterprises in the automotive supply chain network. In order to reflect the degree of direct change in the connectivity of the automotive supply chain network after being disrupted, a node attack sequence Q is constructed in advance, and when nodes in network G are attacked one by one according to the node order in Q , the scale of the maximum connectivity component of network G will decrease as the attack progresses. In reference to Fu’s [20] study, the destructive resistance of the automotive supply chain network is defined as R ( G , Q ) :
R G , Q = M M
where M is the maximum connectivity subgraph size after an attack on a node company in the automotive supply chain network and M is the connectivity subgraph size when it is not attacked. If R ( G , Q ) is close to 1, it means that the network has extremely strong connectivity and the stronger its resistance to disruption.
The failure of individual nodes in a supply chain network is affected by both load propagation and load redistribution. Load propagation leads to the failure of new nodes due to overload, load redistribution, and interactions between nodes, which ultimately leads to the cascading failure of the entire supply chain network. The cascade failure model consists of three parts, which are node initial load, node capacity, and load redistribution method.
Definition of node initial load: Since the load of a node will be transferred to the neighboring enterprises after the node fails, the initial load of a node is closely related to the neighboring nodes, which is defined as:
B i 0 = d i j T d j α
where α is an adjustable parameter and α > 0; d i represents the degree value of the supply chain node, d j represents the degree value of the node’s neighboring nodes, i.e., the number of connecting edges of the node with the upstream and downstream nodes, and T i is the set of the node i’s neighboring nodes.
Define the node capacity: C = { C 1 , C 2 , , C n } denotes the maximum capacity of each node, each node can carry a limited capacity; if it exceeds its maximum load, it will cause node failure, and its maximum capacity is related to the initial load, in accordance with the principle of on-demand allocation, which is defined as:
C i = 1 + β B i 0
where β is an adjustable parameter and 0 < β < 1.
Define the load redistribution method: After the cascade failure occurs, the load of the failed node will usually be preferentially transferred to the node that has a supply relationship with the corresponding node; in addition to this, the residual node capacity of the transferred node is also a factor to be considered. According to the research of previous scholars, after the node failure, its load will be propagated to the neighboring nodes. In this paper, taking into account that the node failure will be preferentially transferred to the high-capacity node reality, the load redistribution strategy based on the real-time residual capacity of the node is selected. Firstly, the residual load of the node is calculated:
Y i = C i B i
If the node capacity is less than the initial load, Y i is 0.
Then considering the initial load of the node, the load handling capacity, and the remaining load of the neighboring nodes, the load distribution ratio between the neighboring nodes is established as:
S i = m i n ( Y i , j T i Y j ) γ
where Y j represents the residual load of the neighboring nodes and γ is an adjustable parameter that regulates the load redistribution ratio of the nodes. Then the load of node j can be expressed as:
B j = B j 0 , Y j 0 B j 0 + i T j B i S j f T i S f , Y j 0

3. Disruptive Analysis of Automotive Supply Chain Networks

In the cascade failure process, α controls the initial load distribution, β indicates the tolerance factor of the node, and the values of the two need to be balanced. The values of α, β, and γ are taken as 1, 1, and 1, respectively. 2, respectively, to verify the accuracy and resolution of the improved K-shell algorithm for identifying the key nodes in the automotive supply chain network, to establish the cascade failure model and perform the destructive resistance analysis, and to compare the maximum remaining in the network after attacking the other nodes; percentage of connected components to measure the reflection of cascade failure by different node enterprises. The simulation comparison in this paper is conducted using Python 3.4.

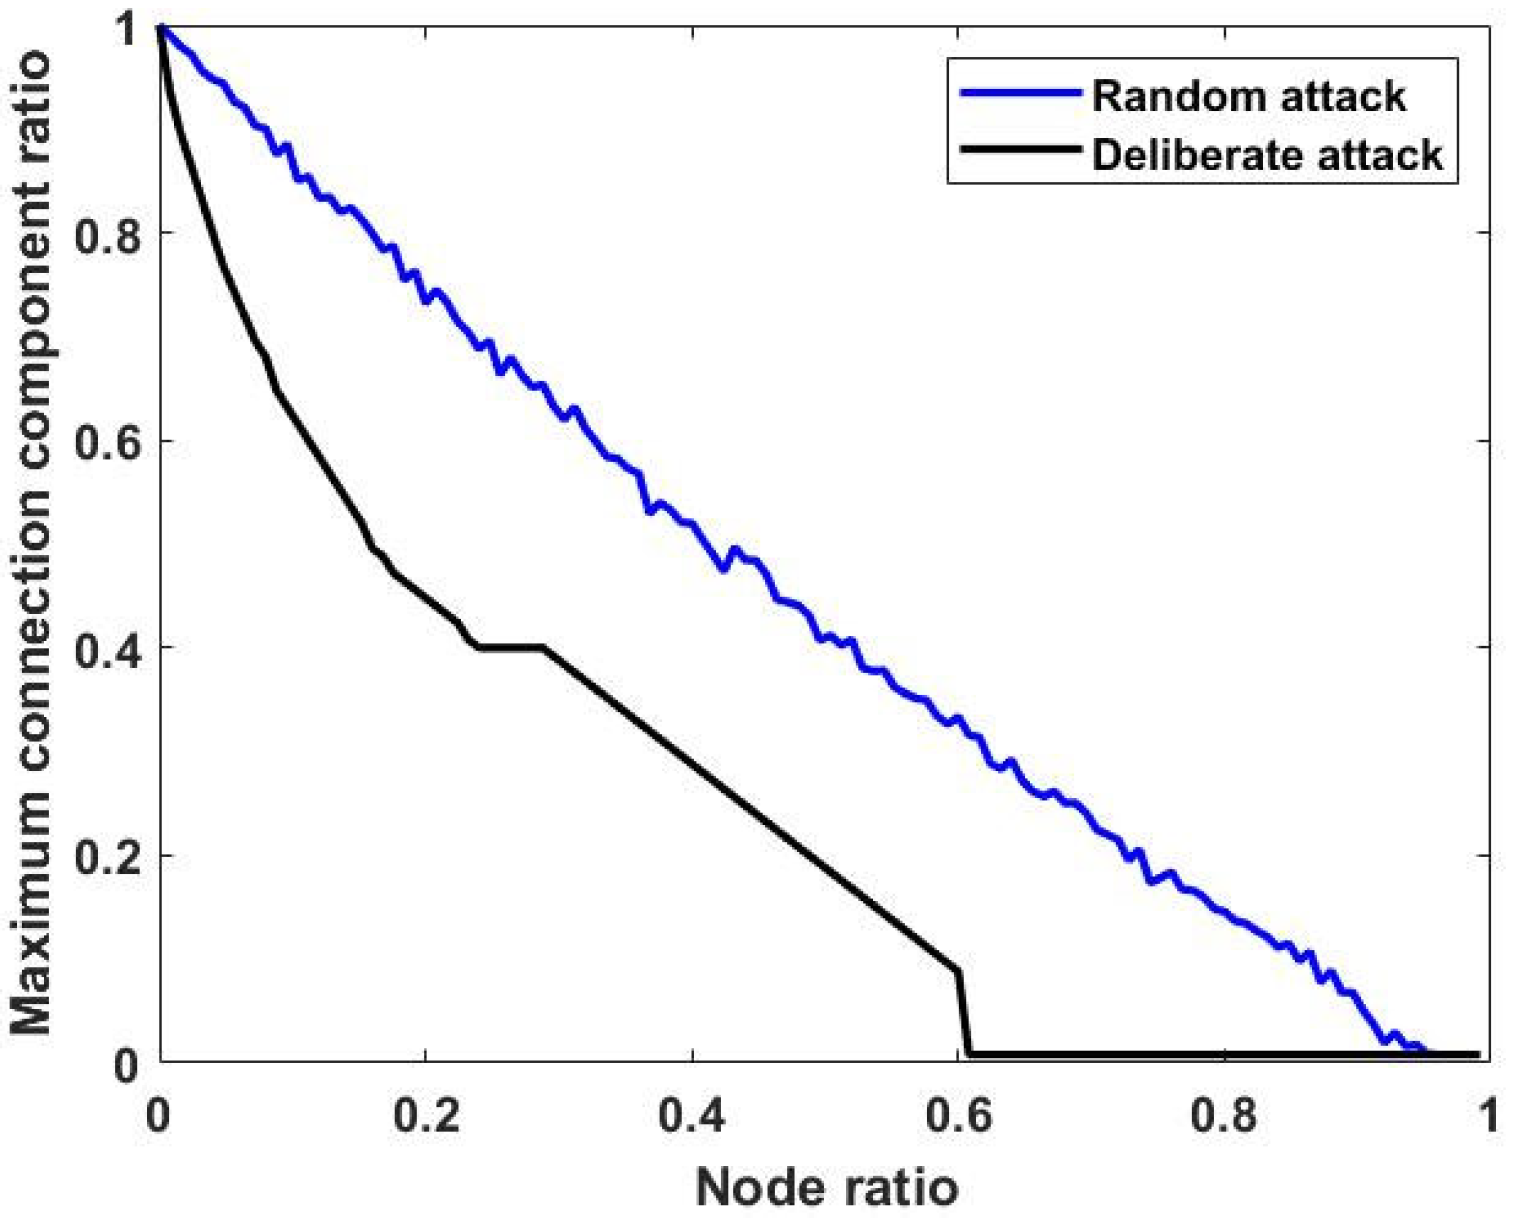
3.1. Comparing Different Attack Strategies

The automotive supply chain network can produce different results under different attacks. If we want to ensure the security and reliability of the automotive supply chain network, we must first clearly understand the results of the automotive supply chain network under different attacks. Therefore, this paper refers to Yang’s [21] attack strategy, in order to understand the disruption resistance of the automotive supply chain network. This paper simulates the attack on Tesla’s automotive supply chain network in two ways: random attack and deliberate attack, where random attack is the node failure with random probability, and deliberate attack is the removal of nodes according to the order of importance, and by the scale of the collapse of Tesla’s automotive supply chain network after cascading failures occurring under the proportion of the same nodes removed, to determine the impact of random disruptions and deliberate attacks on the Tesla Motors’ supply chain network. In the comparison process, the search identification is carried out using the destruction resistance as a measure, and the results obtained are shown in Figure 2. It can be seen that under the influence of random attacks and deliberate attacks, there is a big difference in the destruction resistance of the Tesla automotive supply chain network. The deliberate attack removes 60.8% of the node proportion of the Tesla automotive supply chain network, the maximum connectivity component size is close to 0, the Tesla automotive supply chain network faces paralysis, and the speed of decrease in its destruction resistance is significantly faster than that of the random attack, and the results show that the Tesla automotive supply chain network has a certain degree of destruction resistance in the face of random attacks, but presents a strong vulnerability in the destruction resistance of the Tesla automotive supply chain network. The results show that the Tesla automotive supply chain network has a certain level of resistance to destruction in the face of random attacks, but has a strong vulnerability in the face of deliberate attacks. The failure of key nodes has a devastating effect on the Tesla automotive supply chain network; if the key node fails, then the upstream and downstream enterprises of the Tesla automotive supply chain network will be affected one by one, leading to a large-scale collapse of the network.

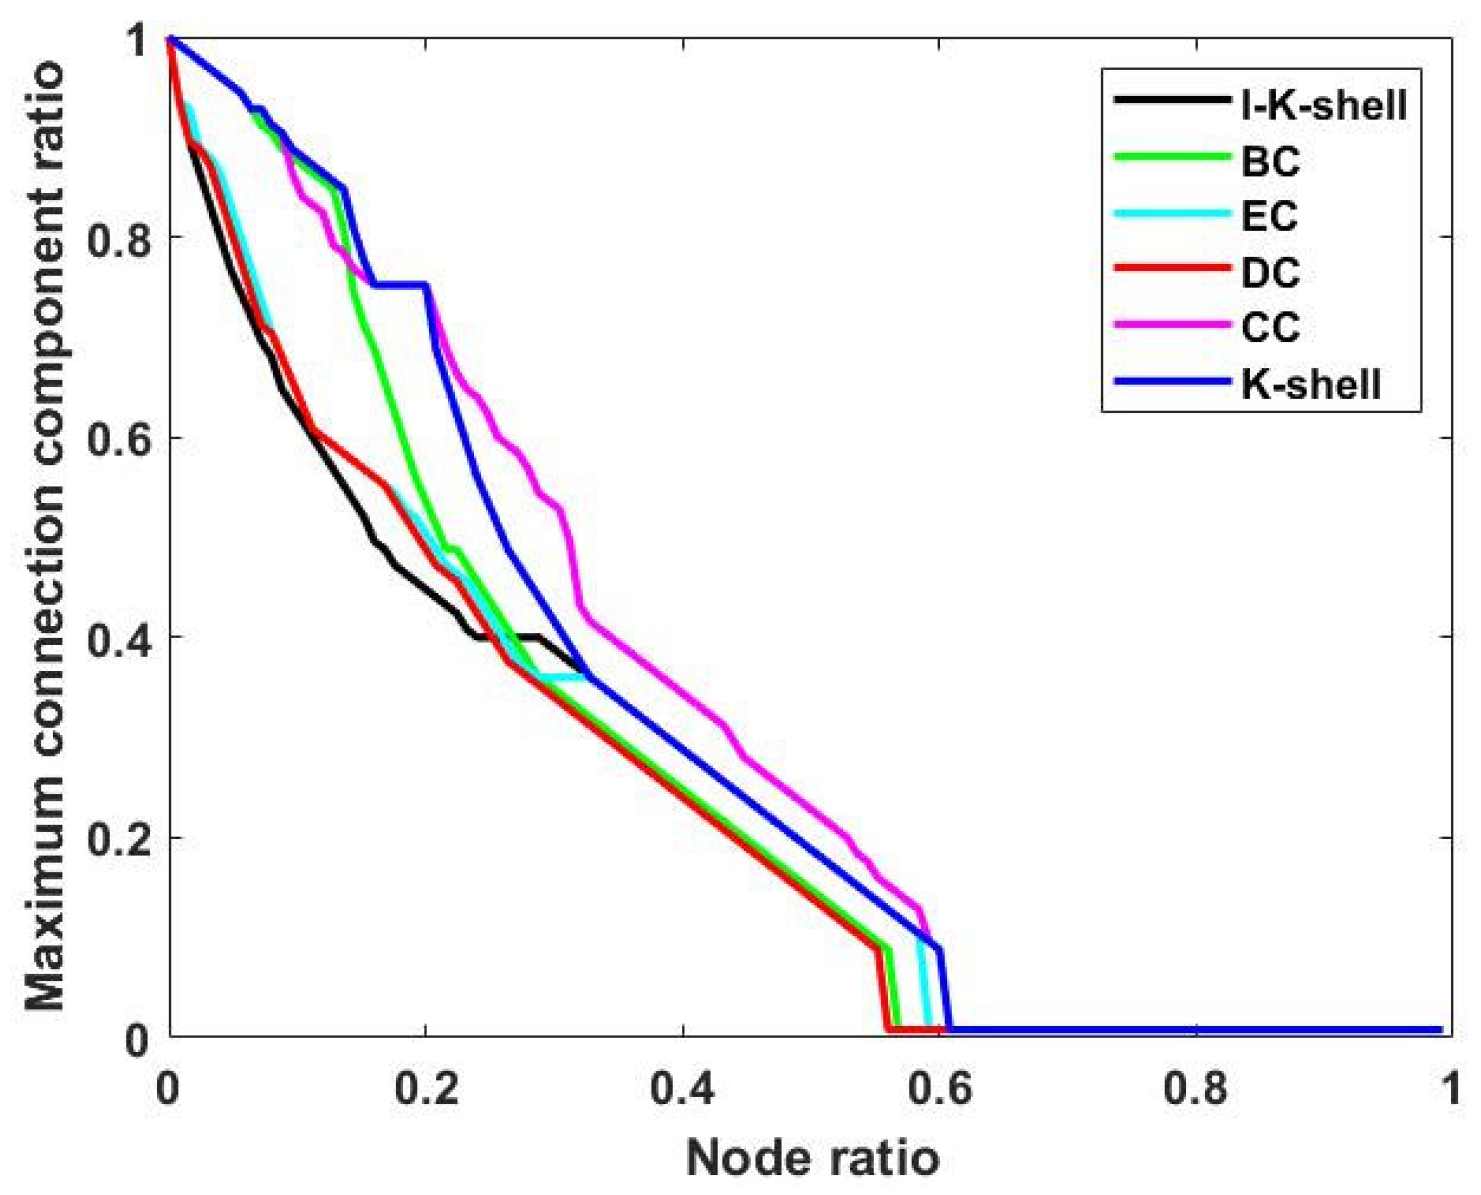
3.2. Performance Comparison of Different Methods for Identifying Nodes in Automotive Supply Chain Networks

The degree centrality method, eigenvector centrality method, median centrality method, proximity centrality method, K-shell method, and the improved K-shell algorithm of this paper are compared analytically. The superiority of the improved key node identification method of this paper is verified by the larger error size with the same percentage of removed nodes. The comparison results are shown in Figure 3. The improved K-shell algorithm of this paper makes the network performance degradation slightly better than the degree centrality method and the eigenvector centrality method, while the traditional K-shell method, the median centrality method, and the proximity centrality method degradation speed is slow, and the accuracy of node identification is poor. In this paper, the global and local structures of the supply chain network are comprehensively considered. Both the position of the node in the network and the degree value of the node, and the importance degree of the node adjacent to it are taken into account, and the superiority of the improved strategy is verified in the comparison results.

3.3. Adjustment of Cascade Failure Model Parameters for Comparison

There are three adjustable parameters in the established cascade failure model, which are α to control the initial load size, β to control the node capacity, and γ to control the load redistribution ratio. To explore the effect of the key parameters involved in the cascade failure model on the destructive power of the network, the proportion of failed nodes is taken as the vertical coordinate, and different values of the α, β, and γ parameters are set for observation.

3.3.1. Observation of Network Effects for Different Values of α and β

When the load redistribution ratio parameter γ is fixed, the effects of different α and β on the destruction resistance of the Tesla automotive supply chain network are observed, as shown in Figure 4. In terms of the overall destruction resistance of the Tesla automotive supply chain network, as β increases, the node carrying capacity increases, the proportion of network failed nodes decreases, and the size of the cascade failure decreases. While the proportion of network failed nodes decreases as α decreases with a constant capacity factor β, as α increases, the initial load of the node increases and the load it transfers increases, triggering an increase in the size of the cascade failure and a larger proportion of failed nodes. Observing the influence of α and β on each other, it can be seen that if we want to reduce the size of the cascade failure of the network, as β decreases, α must also decrease. This proves that in the Tesla Motors’ supply chain network, as the capacity of the nodes decreases, and the initial load of the nodes must also decrease to reduce the size of the cascade failure.

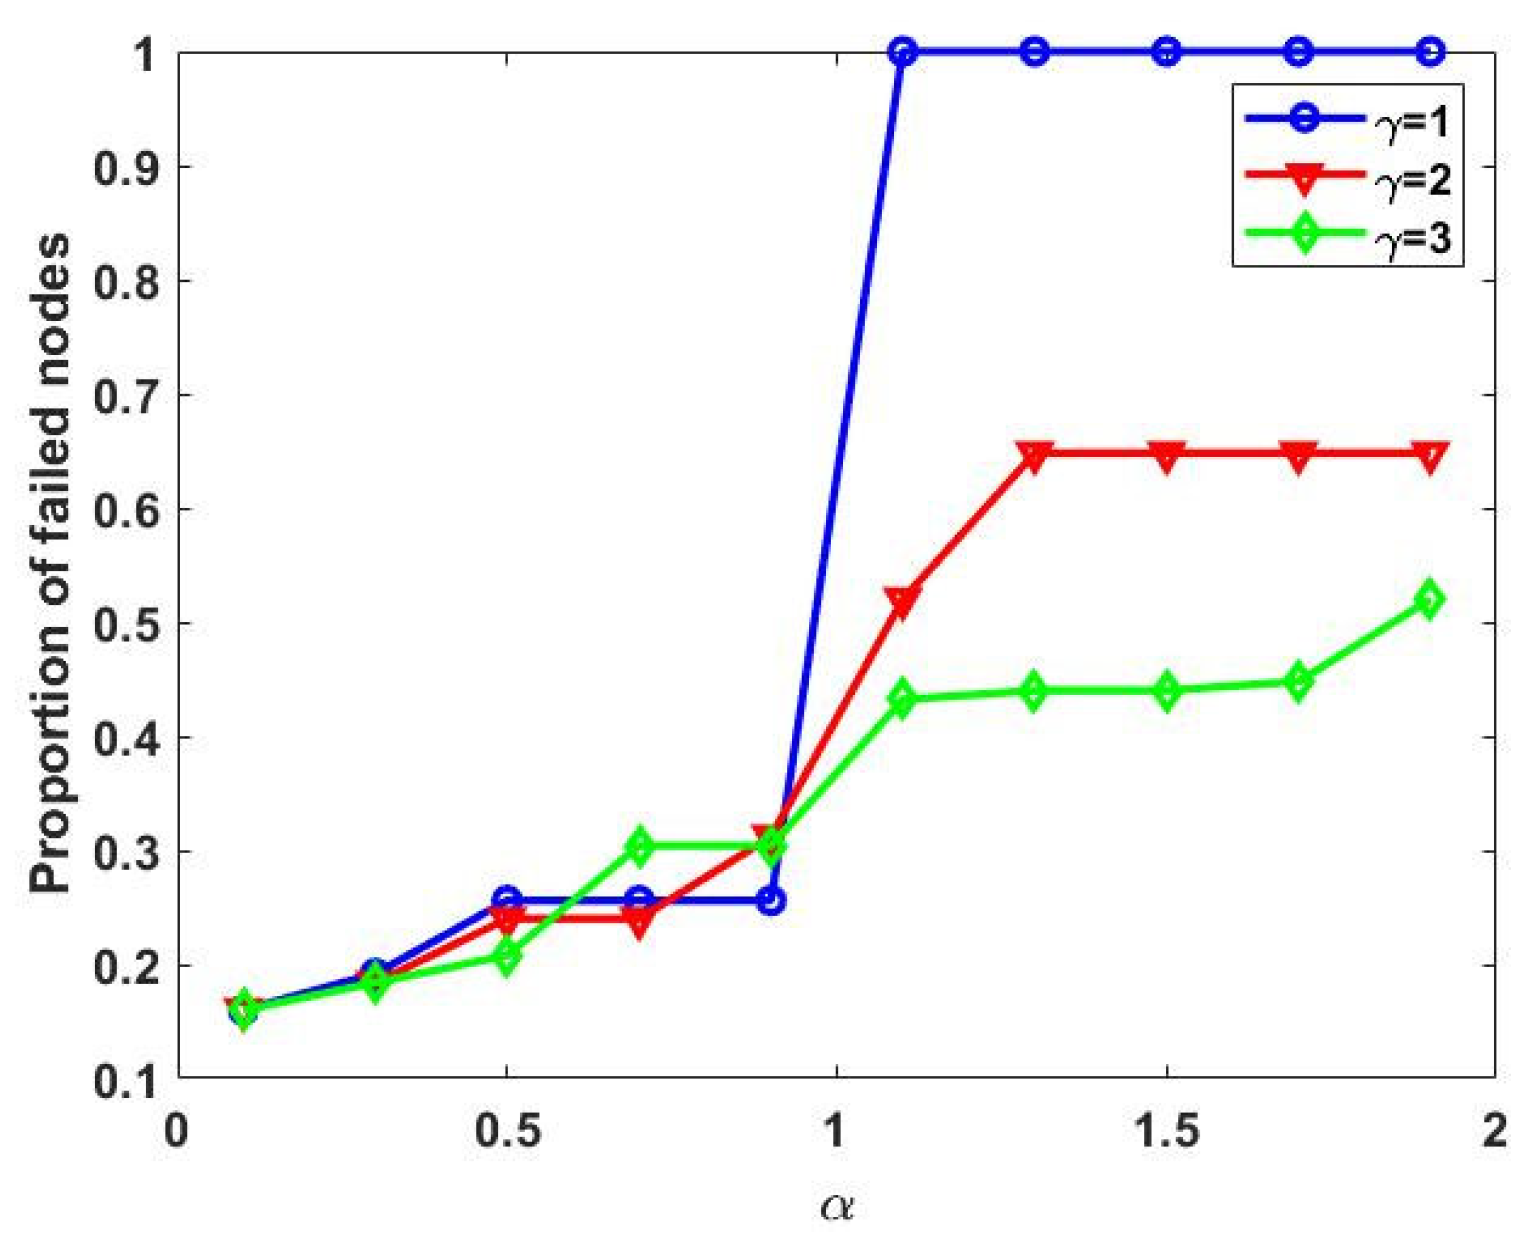
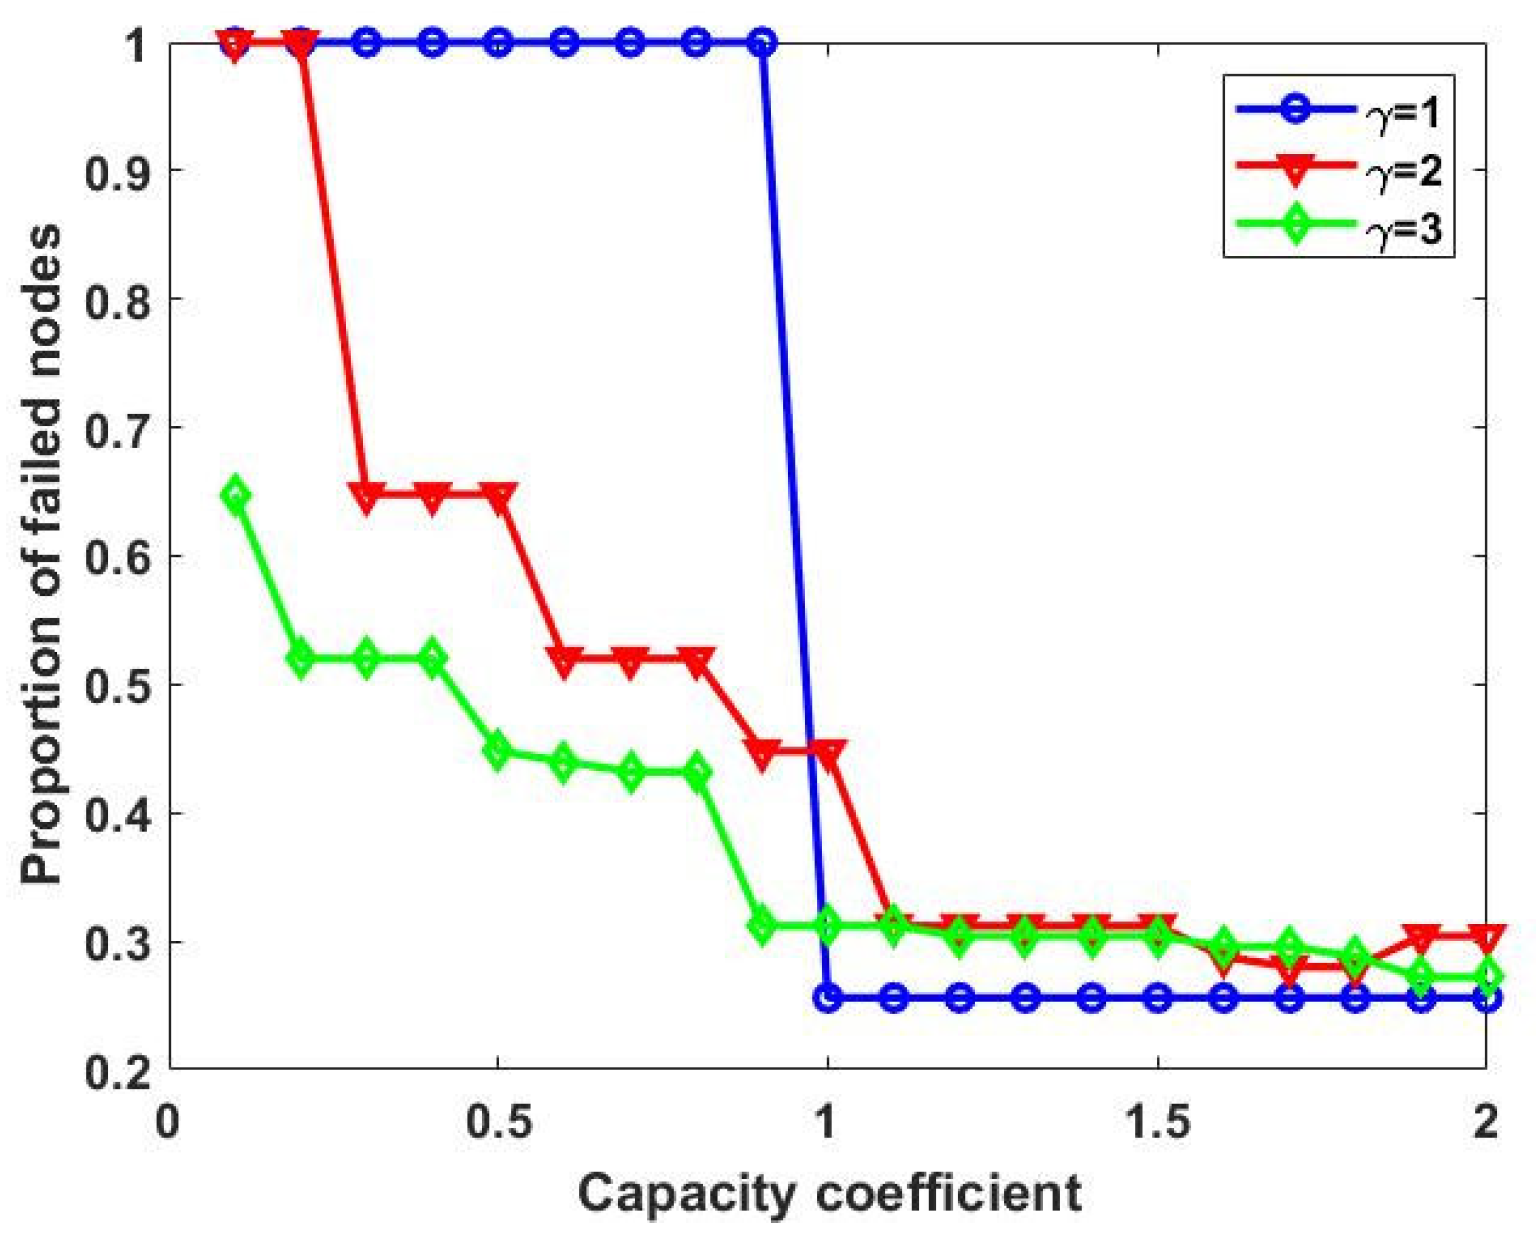
3.3.2. Observation of Network Effects for Different Values of α and γ

When the capacity factor β is fixed, the effects of different α and γ on the network destruction resistance of the Tesla automotive supply chain are observed, as shown in Figure 5. It can be seen that when α is less than 0.9, the value of γ does not have much effect on the failure scale of the Tesla automotive supply chain; when α is greater than 0.9, the larger the γ, and the lower the proportion of network failed nodes; when the initial load is small, the load redistribution ratio has almost no effect on the network failure scale; however, as the initial load increases, it is also necessary to increase the load redistribution ratio in order to reduce the scale of network cascade failures.

3.3.3. Observation of Network Effects for Different Values of β and γ

When the initial load control parameter α is fixed, the effect of different β and γ on the network failure scale of the Tesla automotive supply chain is observed, as shown in Figure 6. It can be seen that when β is greater than 1, the value of γ does not have much effect on the failure scale of the Tesla automotive supply chain; when β is less than 1, the larger the γ, and the lower the proportion of failed nodes in the network. If the node capacity is large, the load redistribution ratio has almost no effect on the network failure scale, but with the reduction of node capacity, the node can carry less load and also needs to increase the load redistribution ratio to reduce the network cascade failure scale.

4. Conclusions

This paper establishes an automotive supply chain network with public data, analyzes its network characteristics, and identifies key nodes in the network through the improved K-shell algorithm. This paper categorizes and lists the conclusions in the following three areas:
(1) Tesla automobile supply chain network model. Through the constructed Tesla automobile supply chain network, it was found that the degree value between its nodes has a seriously uneven distribution, and if the degree of risk is more than the node enterprise’s ability to withstand, the possibility of network collapse is extremely high.
(2) Node identification results based on improved K-shell algorithm. The experimental analysis results showed that the identification effect of the proposed method is more effective and superior compared with the traditional key node identification method. The key nodes identified by the algorithm are mostly charging piles, motors, and electronic control manufacturers, which is more in line with the perception of new energy vehicle core parts manufacturers than the traditional degree centrality method identified by the center control screen manufacturers. Through the proposed K-shell identification method, the potential hidden key risk control nodes in the automotive supply chain network can be well identified, which has good practical application value.
(3) Destruction resistance analysis of automotive supply chain. Analysis of the impact of node failure on automotive supply chain network destructiveness under different conventional attack methods, by deliberately attacking the key node sequence identified using the above algorithm, found that the scale of network cascade failure is higher after striking the key nodes, which provides a very good idea to find the key nodes for early protection. Comparison and analysis of the proportion of network failure nodes under different model parameters found that the initial load parameters and node capacity coefficients affect each other, and the two needed to reach a certain balance to reduce the scale of network cascade failure. Additionally, the load redistribution ratio parameter affected the proportion of network failure nodes within a certain range.
The results obtained by applying the model in this paper enrich the previous understanding of the important nodes of risk propagation in the supply chain network of new energy vehicles, which is of great significance for the risk prevention of the new energy vehicle supply chain network. But there are still some deficiencies in this study. In the simulation of the random attack of the cascade failure model, it is assumed that a single node fails immediately, but in reality, if the node randomly occurs failure, the nodes in a certain region attacked at the same time may be more reasonable, and the case of a multi-node attack should also be studied in the attack mode under research.

Author Contributions

Conceptualization, C.O. and F.P.; methodology, C.O. and S.L.; software, C.O.; validation, C.O., F.P. and S.L.; formal analysis, C.O.; investigation, C.O.; resources, C.O.; data curation, C.O.; writing—original draft preparation, C.O.; writing—review and editing, C.O. and S.L.; visualization, C.O.; supervision, F.P.; project administration, F.P.; funding acquisition, S.L. All authors have read and agreed to the published version of the manuscript.

Funding

The study is supported by the Major Project of Fujian Social Science Research Base (No. FJ2023JDZ019), the Education Research Project (Social Science) for Young and Middle-aged Teachers of Fujian Province (No. JAS22089), the Social Science Research Project of Xiamen University of Technology (No. YSK22023R).

Institutional Review Board Statement

Not applicable.

Informed Consent Statement

Not applicable.

Data Availability Statement

Find the data to support the reporting results in the following links: http://www.chinawuliu.com.cn/xsyj/202301/13/597476.shtml (accessed on 20 May 2024).

Conflicts of Interest

The authors declare no conflict of interest.

References

  1. Huang, K.; Wang, J.; Zhang, J. Automotive Supply Chain Disruption Risk Management: A Visualization Analysis Based on Bibliometric. Processes 2023, 11, 710. [Google Scholar] [CrossRef]
  2. Belhadi, A.; Kamble, S.; Jabbour, C.J.C.; Gunasekaran, A.; Ndubisi, N.O.; Venkatesh, M. Manufacturing and service supply chain resilience to the COVID-19. Technol. Forecast. Soc. Chang. 2020, 163, 120447–120495. [Google Scholar] [CrossRef] [PubMed]
  3. Santos, L.P.; Proença, J.F. Developing Return Supply Chain: A Research on the Automotive Supply Chain. Sustainability 2022, 14, 6587. [Google Scholar] [CrossRef]
  4. Tang, L.; Jing, K.; He, J.; Stanley, H.E. Robustness of assembly supply chain networks by considering risk propagation and cascading failure. Phys. A Stat. Mech. Appl. 2016, 4520169, 129–139. [Google Scholar] [CrossRef]
  5. Colon, C.; Hochrainer-Stigler, S. Systemic risks in supply chains: A need for system-level governance. Supply Chain Manag. Int. J. 2023, 28, 682–694. [Google Scholar] [CrossRef]
  6. Zafar, S.; Hassan, S.F.U.; Mohammad, A.; Al-Ahmadi, A.A.; Ullah, N. Implementation of a Distributed Framework for Permissioned Blockchain-Based Secure Automotive Supply Chain Management. Sensors 2022, 22, 7367. [Google Scholar] [CrossRef] [PubMed]
  7. Sathyan, R.; Parthiban, P.; Dhanalakshmi, R.; Sachin, M.S. An integrated Fuzzy MCDM approach for modelling and prioritising the enablers of responsiveness in automotive supply chain using Fuzzy DEMATEL, Fuzzy AHP and Fuzzy TOPSIS. Soft Comput. 2023, 27, 257–277. [Google Scholar] [CrossRef]
  8. Li, Y.; Zobel, C.W. Network Characteristics and Supply Chain Resilience under Conditions of Risk. Int. J. Prod. Econ. 2020, 223, 107529–107577. [Google Scholar] [CrossRef]
  9. Li, Y.; Zobel, C.W. Exploring supply chain network resilience in the presence of the ripple effect. Int. J. Prod. Econ. 2020, 228, 107693–107706. [Google Scholar] [CrossRef]
  10. Li, F.; Wu, C.-H.; Zhou, L.; Xu, G.; Liu, Y.; Tsai, S.-B. A model integrating environmental concerns and supply risks for dynamic sustainable supplier selection and order allocation. Soft Comput. 2021, 25, 535–549. [Google Scholar] [CrossRef]
  11. Sheng, J.; Dai, J.; Wang, B.; Duan, G.; Long, J.; Zhang, J.; Guan, K.; Hu, S.; Chen, L.; Guan, W. Identifying influential nodes in complex networks based on global and local structure. Phys. A Stat. Mech. Appl. 2020, 541, 123262–123275. [Google Scholar] [CrossRef]
  12. Berberler, M.E. Global and local structure-based influential nodes identification in wheel-type networks. Numer. Methods Partial. Differ. Equ. 2020, 40, e22709. [Google Scholar] [CrossRef]
  13. Wang, B.; Zhang, J.; Dai, J.; Sheng, J. Influential nodes identification using network local structural properties. Sci. Rep. 2022, 12, 1833–1846. [Google Scholar] [CrossRef] [PubMed]
  14. Maji, G.; Namtirtha, A.; Dutta, A.; Malta, M.C. Influential spreaders identification in complex networks with improved k-shell hybrid method. Expert Syst. Appl. 2019, 144, 113092–113105. [Google Scholar] [CrossRef]
  15. Wang, S.; Du, Y.; Deng, Y. A new measure of identifying influential nodes Efficiency centrality. Commun. Nonlinear Sci. Numer. Simul. 2017, 47, 151–163. [Google Scholar] [CrossRef]
  16. Ahajjam, S.; Badir, H. Identification of influential spreaders in complex networks using HybridRank algorithm. Sci. Rep. 2018, 8, 11932–11942. [Google Scholar] [CrossRef] [PubMed]
  17. Xiao, L.; Wang, S.; Mei, G. Efficient parallel algorithm for detecting influential nodes in large biological networks on the Graphics Processing Unit. Future Gener. Comput. Syst. 2020, 106, 1–13. [Google Scholar] [CrossRef]
  18. Nabaei, A.; Hamian, M.; Parsaei, M.R.; Safdari, R.; Samad-Soltani, T.; Zarrabi, H.; Ghassemi, A. Topologies and performance of intelligent algorithms: A comprehensive review. Artif. Intell. Rev. 2018, 49, 79–103. [Google Scholar] [CrossRef]
  19. Fu, X.; Yang, Y.; Postolache, O. Invulnerability of Clustering Wireless Sensor Networks Against Cascading Failures. IEEE Syst. J. 2019, 13, 1431–1442. [Google Scholar] [CrossRef]
  20. Sun, J.Y.; Tang, J.M.; Fu, W.P.; Wu, B.Y. Hybrid modeling and empirical analysis of automobile supply chain network. Phys. A Stat. Mech. Appl. 2017, 473, 377–389. [Google Scholar] [CrossRef]
  21. Yang, G.; Qi, X.; Liu, L. Research on network robustness based on different deliberate attack methods. Phys. A Stat. Mech. Appl. 2020, 545, 123588–123598. [Google Scholar] [CrossRef]
Figure 1. Tesla Motors’ supply chain network diagram.
Sustainability 16 05514 g001
Figure 2. Comparing the resilience of Tesla Motors’ supply chain network to disruption with different ratios of removed nodes.
Sustainability 16 05514 g002
Figure 3. Tesla Motors’ supply chain network diagram.
Sustainability 16 05514 g003
Figure 4. The influence of parameters α and β on the model.
Sustainability 16 05514 g004
Figure 5. The influence of parameters α and γ on the model.
Sustainability 16 05514 g005
Figure 6. The influence of parameters β and γ on the model.
Sustainability 16 05514 g006
Table 1. Automotive supply chain network characteristics table.
MetricsNodesEdgeAverage DegreeAverage Shortest PathClusteringCoefficient Graph Density
Numeric1251462.3362.6730.1990.019
Table 2. Results of different node identification methods in Tesla’s automotive supply chain network.
Nodal EnterpriseBCECDCCCK-ShellI-K-Shell
Tesla (unit)7476.50.091743790.00591738.13
Panasonic3660.01037640.00349711.524741
Sumitomo Chemical243.50.01191750.00350922.612001
Sugo Corporation00.01130520.00347222.577348
Nissin Chemical3660.01037640.00349711.524741
Mitsubishi Chemical2450.01024930.00347211.517586
Changying Precision1230.01012620.00344811.510604
Kodaly00.01000510.00342511.503787
Sunrise1230.01012620.00344811.510604
STMicroelectronics2450.01024930.00347211.517586
Yazaki00.01000510.00342511.503787
Tradelink00.01000510.00342511.503787
Tyco Electronics1230.01012620.00344811.510604
Gao Hua2450.01024930.00347211.517586
Huden603.50.01104470.00357122.562555
Dongshan Precision117.50.01051830.00347222.532817
Junsheng Electronics00.01000510.00342511.503787
Anjie Technology00.0112620.00344822.574816
Dana00.01000510.00342511.503787
SANHUA Intelligent Control00.0112620.00344822.574816
Table 3. Tesla Motors’ supply chain network: Top 10 ranking of the importance of different approach nodes.
RankBCECDCCCK-ShellI-K-Shell
111111, 42, 49, 53, 54, 55, 56, 57, 58, 1201
2234223, 42233, 4, 15, 16, 18, 20, 21, 36, 59, 64, 70, 85, 86, 103, 104, 11742
31549, 53, 54, 55, 56, 57, 5815120152, 5, 6, 7, 8, 9, 10, 11, 12, 13, 14, 17, 19, 22, 23, 24, 25, 26, 27, 28, 29, 30, 31, 32, 33, 34, 35, 37, 38, 39, 40, 41, 43, 44, 45, 46, 47, 48, 50, 51, 52, 60, 61, 62, 63, 65, 66, 67, 68, 69, 71, 72, 73, 74, 75, 76, 77, 78, 79, 80, 81, 82, 83, 84, 87, 88, 89, 90, 91, 92, 93, 94, 95, 96, 97, 98, 99, 100, 101, 102, 105, 106, 107, 108, 109, 110, 111, 112, 113, 114, 115, 116, 118, 119, 121, 122, 123, 124, 12549, 53, 54, 55, 56, 57, 58
42, 5, 22, 683342 120
56, 10, 1436, 592, 5, 21, 22, 683 3
6346, 10, 14, 16, 36, 49, 53, 54, 55, 56, 57, 58, 592, 5, 21, 22, 68 36, 59
72118, 204, 7, 9, 13, 18, 20, 24, 39, 40, 60, 62, 64, 70, 85, 86, 103, 104, 1174, 6, 10, 14, 16 4
87, 9, 13, 24, 39, 40, 60, 6264, 708, 11, 12, 17, 19, 25, 26, 27, 28, 29, 30, 31, 32, 33, 34, 35, 37, 38, 41, 43, 44, 45, 46, 47, 48, 50, 51, 52, 61, 63, 65, 66, 67, 69, 71, 72, 73, 74, 75, 76, 77, 78, 79, 80, 81, 82, 83, 84, 87, 88, 89, 90, 91, 92, 93, 94, 95, 96, 97, 98, 99, 100, 101, 102, 105, 106, 107, 108, 109, 110, 111, 112, 113, 114, 115, 116, 118, 119, 121, 122, 123, 124, 12536, 49, 53, 54, 55, 56, 57, 58, 59 18, 20
91615 7, 9, 13, 18, 20, 24, 39, 40, 60, 62 64, 70
1036, 5923 64, 70 15
Disclaimer/Publisher’s Note: The statements, opinions and data contained in all publications are solely those of the individual author(s) and contributor(s) and not of MDPI and/or the editor(s). MDPI and/or the editor(s) disclaim responsibility for any injury to people or property resulting from any ideas, methods, instructions or products referred to in the content.

