Abstract
Studying the implementation benefits of low-carbon city pilot policies in fostering green, high-quality development is critical for China’s carbon peaking and neutrality targets. This research examines the effect of urban low-carbon governance on green, high-quality development using a multi-temporal DID model and panel data from 281 prefecture-level cities in China from 2007 to 2020. The findings are as follows: (1) low-carbon city pilot policy can considerably enhance green high-quality development in pilot cities; (2) mechanism tests reveal that fintech and urban innovation moderate the role of power support and wisdom empowerment in the successful promotion of low-carbon cities to achieve green high-quality development in pilot areas; (3) the policy effect becomes more significant as fintech and urban innovation cross the threshold value; (4) heterogeneity analysis shows that low-carbon city pilot policy is more conducive to green high-quality development in eastern regions, financially developed cities, and non-resource-based cities. The conclusions drawn from this paper offer valuable guidance for China’s adoption of appropriate environmental policy designs aimed at attaining high-quality green development.
1. Introduction
With the acceleration of global urbanization, cities have become a major source of energy consumption and pollution, putting immense strain on sustainable development and human well-being. In light of the severe challenges posed by climate change to all humanity, high-quality green city development has not only become an important strategy for environmental protection and resource utilization but also a critical initiative to promote global sustainable development and improve human life quality. As the world’s greatest energy consumer and carbon emitter, China is under intense pressure to achieve energy conservation, emission reduction, and sustainable development. According to the International Energy Agency’s (IEA) Carbon Emissions Report 2023, worldwide energy-related carbon dioxide emissions increased by 1.1% in 2023, adding 410 million tons to a new high of 37.4 billion metric tons. Among them, China’s carbon dioxide emissions increased by 4.7%, for a total of 565 million tons, the world’s greatest increase, and the continued economic growth of China’s high carbon emissions following the pandemic. China’s carbon emissions account for one-third of the global total, and its per capita emissions are currently 15% greater than those in industrialized nations. China’s solution to the carbon emissions problem is imminent, and it cannot be postponed.
In order to actively respond to climate change and promote high-quality green development around the world, China explicitly proposed in 2020 the goal of carbon peaking by 2030 and carbon neutrality by 2060, as well as incorporating low-carbon development into the national medium- and long-term development plans. Since 2010, the low-carbon city pilot strategy has been implemented in three batches of 81 cities as an innovative approach to facilitate China’s low-carbon transition and green development [1]. The low-carbon city pilot policy is critical for promoting low-carbon transformation and green, high-quality development in cities to achieve the dual-carbon goal. It encourages cities with varying levels of development, resource endowments, and industrial structures to explore low-carbon development paths based on their local conditions [2]. Assessing the policy benefits of pilot low-carbon city policies on green, high-quality development in cities is critical for developing countries seeking to explore sustainable development pathways.
With the progressive development and implementation of the low-carbon city pilot policy, numerous studies have conducted in-depth research on the policy’s implementation consequences in three areas: environmental effects, economic effects, and social effects. In terms of environmental effects, the low-carbon city pilot policy, as an environmental regulatory policy, can significantly reduce carbon dioxide emissions [3,4,5,6,7] and improve carbon emission efficiency by strengthening environmental control and establishing a regulatory mechanism for carbon emissions [8,9,10]. Li et al. (2022) [11] demonstrated that the pilot low-carbon city policy can significantly improve the quality of the atmospheric environment by measuring the provincial atmospheric environmental performance. The remaining studies demonstrate that low-carbon city pilot policies can reduce air pollutant emissions [12] and combat haze [13]. Low-carbon city pilot policy can also encourage firms to innovate and upgrade green technologies by lowering carbon emissions [14,15,16], as well as promoting industrial structural upgrading [17] and energy efficiency [18].
In terms of economic effects, low-carbon city pilot policies can help pilot cities develop economies of scale, thereby increasing overall green output, green total factor productivity, and urban green innovation [19]. Low-carbon city pilot policy also eases the financing constraints of enterprises, improves the efficiency of resource allocation, reduces the negative impact of capital mismatch on the output of enterprises, and increases the total factor productivity of enterprises [20,21]. Energy-saving and emission reduction initiatives and institutional arrangements promoted by pilot city construction can also improve the reallocation efficiency and scale efficiency of urban factors of production, promoting urban green economic growth [22,23] and high-quality development [24]. In addition, the pilot policy’s requirement for green technological innovation stimulates enterprises’ demand for skilled personnel and increases social employment [25].
In terms of social effects, the implementation of a low-carbon city pilot policy can improve the urban ecological infrastructure system, provide urban residents with green public products, and significantly improve the urban green living standard [26,27]. The low-carbon transition of pilot cities will also trigger new green consumption demand, promote the emergence and development of low-carbon industries, and accelerate the energy transition [28].
Existing research has undertaken important studies and produced numerous results on low-carbon city pilot plans from a variety of angles, but there are still certain gaps and challenges. As the digital economy grows, financial technology and urban innovation will play an increasingly vital role in fostering sustainable and high-quality urban growth. The existing literature primarily examines the impact of low-carbon city pilot policies on economic variables such as environmental pollution control, industrial structure upgrading, and green technology innovation, with insufficient research on how financial technology and urban innovation influence the relationship between low-carbon city pilot policies and green high-quality development.
Based on panel data from 281 prefecture-level cities in China from 2007 to 2020, this study uses a multi-temporal DID model to assess the implementation effect of low-carbon city pilot policies. The empirical findings demonstrate that low-carbon city pilot policies can considerably enhance green, high-quality development in pilot cities. Mechanism tests show that fintech and urban innovation play a moderating role of power support and wisdom empowerment in the process of successfully promoting low-carbon cities to realize green, high-quality development in pilot areas, and the policy effect becomes more significant as fintech and urban innovation exceed the threshold value. Heterogeneity analysis shows that low-carbon city pilot policies are more conducive to green, high-quality development in eastern regions, financially developed cities, and non-resource-based cities.
The marginal contributions of this paper mainly include the following two aspects: First, this study analyzes in depth the impacts and transmission paths of low-carbon city pilot policy on regional green high-quality development, with the goal of providing references for further expanding the pilot’s scope and strengthening the theoretical framework of low-carbon city pilot construction. This study broadens the boundaries of existing research on low-carbon city pilot policy by introducing two key variables, fintech and urban innovation, and provides new ideas for countries around the world to begin assessing the effectiveness of low-carbon city pilot policy implementation and promoting high-quality development transformation. Second, this study examines the non-linear impact of low-carbon city pilot policies on regional green, high-quality development. Using fintech and urban innovation as threshold variables, this work expands our understanding of the nonlinear aspects of policy effects and offers new views and methodologies for future policy evaluation and research into the complicated interaction between policy and development.
The remainder of the study is organized as follows: Section 2 provides the policy background and research hypothesis for this report. Section 3 describes the paper’s research design, which includes model setting, variable definitions, and data sources. Section 4 presents empirical findings on low-carbon city pilot policies and high-quality green development. Section 5 includes further analysis of the study, such as the moderating effect test, the threshold effect test, and the heterogeneity analysis. Section 6 includes research conclusions and policy recommendations.
2. Policy Background and Research Hypothesis
2.1. Policy Background
To address the serious challenges posed by global climate change in China, the State Council proposed China’s 2020 action target for reducing greenhouse gas emissions in November 2009, and various regions have responded positively and taken actions to implement the central government’s decision-making and deployment. The National Development and Reform Commission decided in 2010 that the first batch of pilot projects would take place in five provinces (Guangdong, Liaoning, Hubei, Shaanxi, and Yunnan), as well as eight cities (Tianjin, Chongqing, Shenzhen, Xiamen, Hangzhou, Nanchang, Guiyang, and Baoding). The second and third batches of pilot work were completed in 2012 and 2017, respectively, to gradually broaden the scope of the pilot program. The selection of pilot cities includes cities at various stages of development, with varying resource endowments and industrial structures, and includes both municipalities directly under the central government and county-level administrative districts, with the goal of exploring green and low-carbon city development paths appropriate for China’s national conditions as well as carrying out low-carbon city construction in accordance with local conditions.
Since the implementation of low-carbon city pilot policies, pilot cities have successively introduced relevant policies and regulations, focusing on four aspects of pilot work: promoting the development of low-carbon industries and green technologies; establishing a greenhouse gas emissions management system and a target accountability system; promoting green and low-carbon lifestyles and consumption patterns; and strengthening green tech research. These initiatives have had a positive impact on optimizing urban resource allocation, improving energy efficiency, reducing carbon emissions, promoting green technological innovation, and upgrading industrial structures. They have also become an important force in promoting decarbonization and green economic growth in the pilot areas to achieve high-quality green development. Although low-carbon pilots have been conducted for many years and studied by a large number of scholars, with the implementation of the “dual-carbon” strategy in 2020, carbon peaking and carbon neutrality have become systematic, strategic, and global endeavors, and the pilots’ objectives and pathways have changed from those of the past. As a result, from a fresh perspective, research on the relationship between low-carbon city pilot policies and green, high-quality development remains highly practical.
2.2. Research Hypothesis
Pilot cities have developed low-carbon development models, pathways, and policy frameworks that are more in line with practical operations and local characteristics, based on their own industrial structure and economic development level, resulting in green, high-quality development in the pilot areas. To begin, a low-carbon city pilot policy, as a comprehensive environmental regulatory policy, can promote a win-win situation for the environment and the economy through the initial cost effect and the subsequent compensation effect, as well as promote technological innovation and improve industrial efficiency to some extent. Environmental regulations also raise the burden of environmental costs in enterprise production [29], forcing incumbent enterprises to improve their production and operation methods, increasing the efficiency of enterprise innovation, and improving environmental quality in the region [30]. Secondly, low-carbon city pilot policy promotes the development of green industries by adjusting the structure of energy production and consumption, enhancing the innovation capacity of green technologies [31], expanding the market demand for green products and services, fostering new points of economic growth, and enhancing the competitiveness of the city’s economy so as to attract talents, capital, and technologies and promote the upgrading and transformation of the economic structure [32]. Furthermore, the implementation of a low-carbon city pilot policy will increase public awareness and participation in low-carbon and green concepts, as well as generate new green consumption demand, incentivizing businesses to develop in a green direction and promoting the emergence and development of low-carbon industries [33]. Based on the analysis presented above, this paper presents the following hypothesis:
H1:
Low-carbon city pilot policy can promote green, high-quality development of cities.
The merging of the financial industry with new technologies such as big data, artificial intelligence, blockchain, and cloud computing has created a new type of fintech [34] that is transforming financial services [35]. Fintech emerged as a result of the confluence of multiple technologies, which were fueled by technical advancements [36,37,38]. Fintech applications have enormous prospects for the banking sector [39]. Fintech can contribute to low-carbon development by facilitating green financial services such as investment and loans [40,41,42]. According to Xu & Xu (2022) [43], higher loan interest rates generate lower carbon emissions, whereas increased credit availability generates higher carbon emissions. Furthermore, fintech increases eco-efficiency by making the transition to renewable energy consumption easier [44], which helps to realize energy transition and green growth [45,46].
With the rapid expansion of fintech in China, it is critical to achieving low-carbon emission reductions and high-quality development [47,48]. First, capital financing is more efficient in cities with advanced fintech. Pilot towns can use fintech tools like big data analysis and artificial intelligence to assess the risks and rewards of low-carbon projects faster and more correctly, as well as provide firms with more convenient financial support [49]. Efficient finance not only speeds the execution of low-carbon projects, but it also lowers the cost of financing for businesses [50], promoting the high-quality green growth of cities through low-carbon city pilot programs. Second, cities with advanced fintech can improve information efficiency and reduce data barriers. The adoption of advanced technologies, such as big data, in the financial sector by pilot cities can reduce the information asymmetry between financial institutions and economic entities [51]. This helps city managers to more accurately grasp the direction and focus of low-carbon development and optimize resource allocation [52], thus promoting green, high-quality development in cities. Furthermore, cities with advanced fintech are better suited to promote innovation. Driven by the low-carbon city pilot strategy, cities with advanced fintech can attract more innovative resources and drive company innovation. These innovations can stimulate the research, development, and use of green technology [53], giving new momentum for high-quality green urban development. Based on the study presented above, this paper presents the following hypotheses:
H2:
Fintech reinforces the positive relationship between low-carbon city pilot policies and green, high-quality development.
Innovation is viewed as the primary driving force for low-carbon development. Cities, as the spatial carriers of the innovation system, have now become the hubs for information, knowledge, technology, and other innovation resources [54]. Innovation has the potential to transform new energy production and consumption technologies, create new sectors, business forms, and operating modes [55], and enhance energy efficiency [56]. Innovation can raise worker skill levels, reduce production energy, and accelerate the spread of energy-saving technical breakthroughs and transaction costs [57]. Innovation will also fuel the development and implementation of green technology, thereby promoting green and low-carbon development [58]. Second, innovation is the most powerful force for fostering improvement in industrial structures. Innovation promotes the continuous elimination of high-energy-consuming industries, accelerates the development of low-carbon modern service industries, high-tech industries, and advanced manufacturing industries, and encourages the development of industries with high value-added, low energy consumption, and environmental friendliness [59,60]. Furthermore, innovation promotes the change of energy structure from fossil to green energy [61], as well as achieving the aim of decarbonization [62].
A vast number of studies have revealed that innovation is a source of power for urban development as well as a key driving force for lowering pollution and achieving high-quality green development [63,64,65]. Cities with stronger innovation capacities have better research capabilities and more adequate funding. With the help of low-carbon city pilot policies, these cities can develop and implement green technologies more quickly, reduce carbon emissions [66,67], effectively promote urban green development and industrial upgrading, and achieve a win-win situation for economic growth and environmental protection. Furthermore, cities with stronger innovation capacities typically have greater knowledge spillover effects [68] and talent pooling capabilities. These cities are capable of attracting and cultivating a significant number of inventive talents and research institutes, increasing talent concentration [69], and establishing innovation ecosystems and networks. Driven by low-carbon city pilot regulations, these talents and institutions may provide intellectual support for green city development while also encouraging the quick promotion and application of creative achievements. Based on the study presented above, this paper presents the following hypotheses:
H3:
Urban innovation reinforces the positive relationship between low-carbon city pilot policies and green, high-quality development.
3. Research Design and Data
3.1. Econometric Model
The DID model treats pilot policy implementation as an independent variable, limiting the interaction between the independent and dependent variables while also avoiding the endogenous problems common in panel regressions. Because the sample grouping of pilot cities is independent of individual heterogeneity, the DID model may account for the influence of unobservable individual heterogeneity on the dependent variable, yielding the real policy effect of the pilot policy. Regressing the city panel data makes it easier to establish whether the policy had a statistically significant impact.
Given that China’s low-carbon city pilot policy was implemented in three batches, this article employs a multi-temporal DID model to better assess the disparities in green, high-quality development between pilot and non-pilot cities before and after the policies were implemented. The multi-temporal DID model is an extended version of the differential treatment and control group approach, which is commonly used to examine the effects of policies or interventions on treatment groups when they are implemented at different points in time for different groups or regions. The model uses regression analysis to evaluate the effects of policy elements based on changes in the differential treatment and control populations. The fundamental notion is to assume that the difference between the treatment and control groups is constant prior to the policy intervention, that is, that the treatment group is not considerably changed. The multi-temporal DID paradigm offers greater flexibility than the classic DID model. It enables policy to be implemented gradually at different times in time and in diverse groups, allowing the multi-temporal DID model to better reflect the complexity of the real world. The multi-temporal DID model is also commonly employed in a variety of research areas, particularly policy evaluation, social science research, and economic analysis. The measuring model is shown as follows:
In Formula (1), subscript i and t are used to represent city and year, respectively. is the explained variable, is the core explanatory variable, and is the coefficient that this paper focuses on. If the coefficient is significantly greater than 0, it indicates that the pilot policy of low-carbon cities can promote green, high-quality development of cities. is the selected series of control variables, is the city fixed effect, is the time fixed effect, and is the random disturbance term.
Furthermore, to investigate whether fintech and urban innovation may play a moderating role in the effective promotion of low-carbon cities to achieve green, high-quality development in pilot areas, Formula (1) is expanded as follows:
In Formula (2), is the moderating variable, which is fintech and urbon innovation (lninnovation), respectively, is the interaction term, and is the coefficient that is the focus of the moderating effect test. If it is significantly greater than 0, it indicates that fintech and urban innovation can play a moderating role.
3.2. Variable Definition
3.2.1. Explained Variable
Urban green total factor productivity (gtfp). Green total factor productivity (TFP) is considered an inaccurate index to measure the combination of economic performance and ecological environment, so this paper uses green total factor productivity (TFP) to measure the level of high-quality green development in cities. In this paper, the SBM-GML index was used to measure GTFP [70]. The capital stock, total labor force, built-up area, and energy consumption of each prefecture-level city are used as input variables, while Gross Regional Product (GRP) is the desired output, and SO2 emissions, wastewater emissions, and soot emissions are the non-desired outputs.
3.2.2. Explanatory Variable
Low Carbon City Pilot (did). According to the relevant policy documents issued by the National Development and Reform Commission, when a city is a low-carbon pilot city and has implemented a low-carbon pilot policy in that year, the did is 1, otherwise it is 0.
3.2.3. Moderating Variable
Financial technology (fintech) and urban innovation (lninnovation). In this paper, we match 48 keywords of “financial technology” with cities at prefecture level and above, construct search terms such as “Beijing + blockchain”, crawl Baidu News advanced search results, and then construct a prefecture-level city financial technology index [71]. In this paper, we valued the invention-authorized patents from the State Intellectual Property Office (SIPO) and then summed up the value of each patent at the city level to get the city innovation index of prefecture-level cities.
3.2.4. Control Variable
(1) Urbanization level (urb) is measured by the proportion of total non-agricultural population in total urban population at the end of the year. (2) Industrial structure (ind) is measured by the ratio of the city’s secondary industry to the gross regional product. (3) Government intervention (gov) is measured by the proportion of general government expenditure to GDP. (4) The degree of openness to the outside world (open) is measured by the proportion of total import and export trade to the gross regional product. (5) Economic level (lnpgdp) is measured as the logarithm of gross regional product per capita. (6) Foreign direct investment (lnfdi) is measured as the logarithm of the amount of foreign investment actually used by each city.
3.3. Samples and Data
Because the low-carbon pilot region spans three levels: province, prefecture-level city, and county-level city, there is some overlap between the various batches. The majority of current studies have identified all cities in the province as pilot cities and set the policy implementation timing for the earliest batch. However, due to significant differences in economic development levels and resource endowment among different cities within the pilot provinces, the implementation time and effectiveness of low-carbon policies vary by prefecture, and statistical data for some pilot cities is missing. This study only covers pilot cities at the prefecture level or higher in the pilot list, does not include all cities within the pilot provinces in the scope of pilot cities, and eliminates cities with significant missing data difficulties. Finally, this paper selects 281 cities at the prefecture level or higher in China as research objects, 68 low-carbon pilot cities in three batches as the experimental group, and the remaining 213 cities as the control group, and uses statistical data from 2007 to 2020 for the study.
The statistics in this study are mostly derived from the China Statistical Yearbook, the China Urban Statistical Yearbook, the China Energy Statistical Yearbook, statistical yearbooks for provinces and prefectural-level cities, and statistical bulletins on national economic and social development. Table 1 displays descriptive statistics for the variables in this paper.

Table 1.
Descriptive statistics.
4. Analysis of Empirical Results
4.1. Empirical Results of Baseline Regression
Given that the administrative division of cities may have a greater impact on the implementation of low-carbon city pilot policies, this paper divides the sample into two parts: a full sample and a sample with municipalities excluded for regression. Table 2 displays the benchmark regression results for low-carbon city pilot policies promoting green, high-quality development. Columns (1) and (2) show the regression findings for the entire sample, whereas columns (3) and (4) show the regression results for the sample that excludes municipalities.
Table 2.
Empirical results of baseline regression.
According to the regression results, the coefficient of low-carbon city pilot (did) is significantly positive in both the full sample and the sample excluding municipalities, indicating that low-carbon city pilot policies can significantly promote green, high-quality development in the city and that the policies’ expected effects are effectively realized. The regression coefficient of low-carbon city pilot (did) in column (2) is 0.0082, and it is significantly positive at the 1% significance level, implying that low-carbon city pilot policy can promote green high-quality development in the city by promoting energy savings and emission reduction, green technological innovation and industrial structure upgrading, and improving social participation and awareness. In terms of administrative regions, the regression coefficient is significantly positive at the 5% significance level when the sample of municipalities directly under the central government is excluded, indicating that the promotion effect of low-carbon city pilot policy is extensive, which is conducive to promoting the green high-quality development of ordinary prefecture-level cities and, to a certain extent, can narrow the green economy gap between regions and promote the synergistic development of the green economy, which can in turn promote China’s urban low-carbon transformation and high-quality development. H1 is verified.
4.2. Robust Test
4.2.1. Parallel Trend Test
The DID model must pass the parallel trend test before it can be used for research. The change trends of the green, high-quality development level of low-carbon pilot cities and non-pilot cities before policy implementation should be parallel. This paper establishes the model as follows:
Figure 1 depicts the results of the parallel trend test; this paper uses the year of implementation of low-carbon city pilot policies as the base period (current). The figure shows that the coefficient estimates of the periods preceding the implementation of low-carbon city pilot policies are not statistically significant, indicating that the research sample passes the parallel trend test. Furthermore, after implementing the rules, the coefficient values are positive and more significant in the 2nd, 4th, 5th, and 6th periods, indicating that the low-carbon city pilot policy has a major beneficial impact on the city’s green, high-quality development.
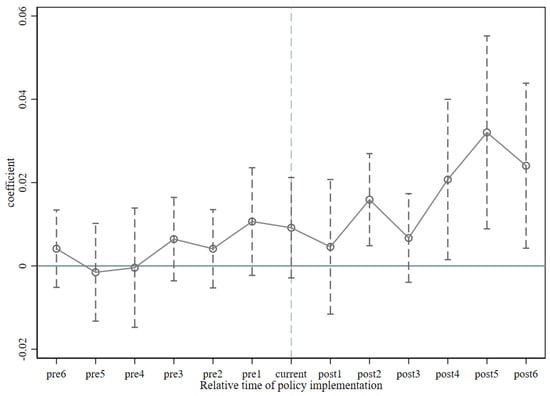
Figure 1.
Results of parallel trend test.
4.2.2. Placebo Test
To rule out the impact of endogeneity and urban heterogeneity of policy shocks on the study’s conclusions, this publication conducts placebo tests 500 and 1000 times. Figure 2 depicts the results of the placebo test, with the dashed line on the right side representing the coefficient estimates of the policy implementation variables in the baseline regression (Table 2), the horizontal and vertical coordinates of the dots representing the coefficients of the policy dummy variables in the case of a randomized combination, and the curve representing the kernel density distribution. As shown in Figure 2, the p-values of the random samples are generally greater than 0.1, and the coefficient estimates obtained using the random samples are generally smaller than the coefficient estimates obtained in the benchmark regressions, indicating that the conclusions drawn in this paper are robust.
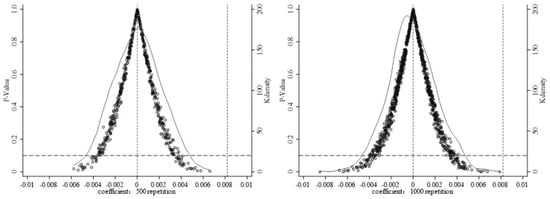
Figure 2.
Placebo test.
4.2.3. Endogenous Processing
A number of endogenous issues arise when investigating the influence of low-carbon city pilot policies on green, high-quality development, which may impede an accurate assessment of policy effects. The first is the conflation of policy impacts with time effects. The impact of low-carbon city pilot policies on the green, high-quality development of pilot cities may be due to the “policy effect” generated by the policy itself as well as the “time effect” caused by other factors in the city’s economic development process or development inertia. The distinction between the two is often difficult to describe accurately, which can lead to an incorrect assessment of policy outcomes. Second, the selection of low-carbon city pilots is not arbitrary. Whether or not the region implements a low-carbon pilot policy is determined more by characteristics such as geographic location, economic development, and industrial structure, with some sample selectivity and self-selection bias. Third, consider the potential impact of regional culture and environmental themes. Regional culture, green concepts, traditional values, and other unobservable variables in each pilot city may have an impact on the pilot cities’ values and behavioral orientations when implementing low-carbon pilot policies, affecting the cities’ level of green, high-quality development. Fourth, there are disparities in how policy is implemented and realized. Even within the same policy framework, there may be differences in the process of policy implementation and realization in different cities, such as a lack of constraints and scientificity in policy objectives, a mismatch of powers and responsibilities among the main bodies of policy implementation, overly broad policy content, and a lack of specific financial guarantees. These variances may result in discrepancies in policy effects between cities, reducing the accuracy of policy impact assessments.
To address the endogeneity concerns raised above, this article employs the period-by-period PSM-DID technique to more properly estimate the impact of pilot low-carbon city policies on high-quality green development. The period-by-period PSM-DID applies the PSM-DID methodology to multi-period panel data, allowing the policy to be implemented for different cities at different moments in time. For each period of policy implementation, PSM matching and DID analysis are carried out individually. The DID estimates for each period are then integrated to produce a full assessment of the policy’s effects throughout time. The balanced test results are obtained using caliper nearest-neighbor matching (1:2), as reported in Table 3 and Table 4, and the kernel density plot of the propensity score values is displayed in Figure 3.
Table 3.
Year-by-year balance test results—before matching.
Table 4.
Year-by-year balance test results—match.
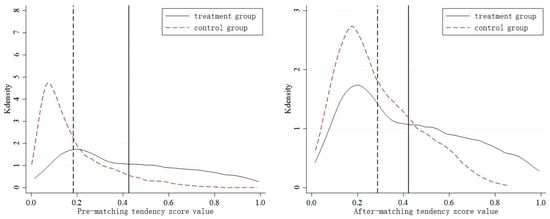
Figure 3.
Kernel density plot of propensity score values.
When the results of the logit balance test in different years before and after matching are compared, it can be seen that the coefficient values of the majority of covariates in each year after matching decrease and become insignificant, while the pseudo R2 of all regressions decreases significantly, indicating to some extent that there is no systematic bias in the matching variables of the two groups in different years and that the balance test is satisfied. When the kernel density plots before and after matching are compared, it is discovered that the deviation of the kernel density curves of the processing and control groups before matching is relatively large, whereas the kernel density curves of the two groups after matching are relatively close to each other, indicating that the matching effect is effective. As a result, the PSM balance test results presented in this study are consistent with the double difference model’s common trend assumption premise and can be verified using DID.
This research conducts a PSM-DID model test using the calliper closest neighbor matching, kernel matching, and radius matching methods to ensure the robustness of its conclusions, and the results are provided in Table 5. According to the results, it can be seen that the coefficients of the three matching methods are all significant at the 5% significance level when using samples that satisfy the common support assumption, and the magnitude of the regression coefficient values is not much different from the coefficient value of the benchmark regression, indicating that the regression results are relatively robust, further affirming the conclusion that low-carbon city pilot policy can significantly contribute to the city’s green, high-quality development.
Table 5.
Regression results of PSM-DID model.
4.2.4. Robustness Test
The research also performs a number of other robustness tests to support its central conclusion that low-carbon city pilot policies can foster high-quality green growth in cities. First, additional policy disruptions are ruled out. It is important to note that the Environmental Protection Tax Law, which was passed at the 25th meeting of the Standing Committee of the National People’s Congress in December 2016 and formally implemented in 2018, is a tax on environmental protection rather than an environmental tax. To avoid the interference caused by the implementation of this policy in this paper’s measurement of the relationship between low-carbon city pilot policy and green high-quality development, this paper excludes sample data after 2018, and the regression results are shown in column (1) of Table 6. Second, update the low-carbon city pilot policy. Given that the initial batch of pilots contains more provinces and the chosen cities have greater economic levels, the representation is not strong. As a result, this paper eliminates the samples of eight cities from the first batch and retains only the pilot cities from the second and third batches to reset the low-carbon city pilot policy. The regression findings are displayed in column (2) of Table 6. Third, the impact of the 2008 financial crisis is disregarded. Because the 2008 financial crisis had complicated and variable effects on China’s economy, this research excludes the 2008 sample data, and the regression results are reported in column (3) of Table 6. Fourth, the interference of the 2020 epidemic is omitted; the 2020 pandemic had a substantial impact on China’s economic and social development, so this paper eliminates the sample data from 2020, and the regression results are displayed in column (4) of Table 6.
Table 6.
Robustness test regression results.
According to the regression results, the regression coefficients for low-carbon city pilot policy (DID) under all four models are considerably positive at the 5% significance level, which leads to a very solid main conclusion of this paper.
5. Results of Further Analysis
5.1. Moderating Effects Test
To test whether fintech and urban innovation play a moderating role in the process of low-carbon city pilot policies to promote green, high-quality development, this paper first centered on fintech and urban innovation and then constructed the interaction term (did × M) by multiplying them with low-carbon city pilots (did), respectively. This technique helps to alleviate the multicollinearity problem while also making the interaction term more economically significant. Table 7 displays the findings of the moderating effect test, with columns (1) and (2) representing the regression results when the moderating variable M is fintech and columns (3) and (4) representing the regression results when the moderating variable M is urban innovation (lninnovation). The moderating effect is seen in Figure 4, where the horizontal axis represents the low-carbon city pilot and the vertical axis represents green high-quality development (gtfp).
Table 7.
Moderating effect test regression results.
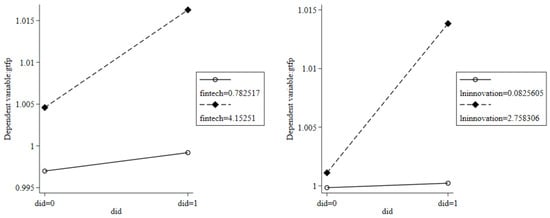
Figure 4.
The moderating effect of fintech and urban innovation.
The moderating effect regression (column (2)) shows a significant positive coefficient for the interaction term between low-carbon city pilots and fintech (did × M). This suggests that fintech has a positive moderating effect on low-carbon city pilot policies to promote high-quality and green city development. As shown in Figure 4, the slope of the low-carbon city pilot policy on green high-quality development is significantly greater in high-fintech cities than in low-fintech cities. Cities with advanced fintech can not only improve the efficiency of financing low-carbon projects but also reduce the information asymmetry between financial institutions and economic entities, allowing city managers to better understand the direction of low-carbon development, reduce carbon emissions [72,73], and optimize resource allocation. Furthermore, cities with advanced fintech are more innovative [74], driving green technological advances [75] and sustainable development [76], resulting in low-carbon cities where policies are more likely to promote high-quality green urban development. H2 is verified.
The moderating effect regression results in column (4) show that the coefficient of the interaction term between low-carbon city pilot and urban innovation (did × M) is significantly positive, which indicates that urban innovation can play a significant positive moderating effect in the process of low-carbon city pilot policy to promote green, high-quality development in cities. Figure 4 shows that the slope of the low-carbon city pilot policy on green high-quality development is significantly greater in high urban innovation cities than in low urban innovation cities. Cities with stronger innovation capacity tend to have stronger research strengths and a higher concentration of talent [77,78]. With the support of low-carbon city pilot policies, it is more likely to promote the green, high-quality development of cities. H3 is verified.
5.2. Threshold Effect Test
Due to technological, financial, and social cognitive limitations, the impact of low-carbon city pilot policies on supporting high-quality green development may be limited from the outset. It may even temporarily stifle green development due to hefty transition costs. As technology advances and cash accumulates, the impacts of the policy gradually become apparent, and the function of promotion grows. However, as the transition progresses, the remaining challenges and costs may steadily increase, reducing the marginal effect of the policy. Furthermore, different bottlenecks may arise during the transformation process, such as technological and institutional barriers, limiting the realization of policy impacts. As a result, the relationship between low-carbon city pilot policies and green, high-quality development is a dynamic process with nonlinear properties. The moderating effect test reveals that fintech and urban innovation have an impact on the promotion of low-carbon city pilot policies for high-quality urban green development. We use fintech and urban innovation as threshold variables to investigate the potential nonlinear relationship between low-carbon city pilot policies and green, high-quality development.
In this paper, we use Hansen’s bootstrap method to test the single, double, and triple thresholds for fintech and urban innovation, respectively, and sample 300 times to obtain the statistic F-value and the corresponding p-value. The results of the threshold effect test are presented in Table 8. According to the test results, the Fstatistics of fintech and innovation are significant only at the level of 10%, so it can be concluded that there is only a single threshold effect in both of them. Figure 5 shows the LR plots of the relevant threshold estimations with 95% confidence intervals. The LR statistic’s lowest point corresponds to the genuine threshold value, while the dashed line shows the critical value of 7.35. The figure shows that the threshold values of fintech and urban innovation are significantly lower than the critical value, indicating that the threshold values are true and valid. We obtain the threshold value of fintech as 5.2095 and the threshold value of urban innovation as 4.0970.
Table 8.
Threshold effect test results.
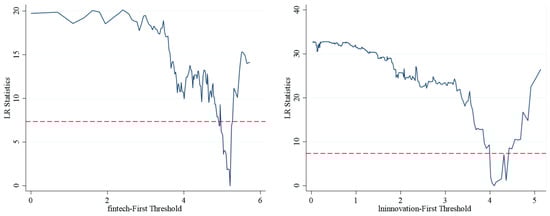
Figure 5.
Single threshold estimate LR diagram.
According to the above threshold test results, there is only a single threshold for both fintech and urban innovation, which leads to the design of a single panel threshold model as follows:
In Formula (4), is the indicative function, is the threshold variable, namely fintech and lninnovation, is the threshold value, is the city fixed effect, is the time fixed effect, is the random disturbance term, indicates that when the threshold variable is lower than the threshold value, the regression coefficient of low-carbon city pilot policy on green high-quality development, is the regression coefficient when the threshold variable is higher than the threshold value. The results of threshold regression are shown in Table 9.
Table 9.
Threshold regression result.
When fintech is the threshold variable, it can be seen that low-carbon city pilot policies have different effects on green, high-quality development when fintech is at different levels. When fintech is low (fintech ≤ 5.2095), the regression coefficient is modest and insignificant, showing that low-carbon city pilot policy is weak or ineffective in promoting green high-quality development. When fintech exceeds the threshold (fintech > 5.2095), the regression coefficient is significantly larger than the coefficient at the lower level and significantly positive at the 1% level, indicating that fintech must surpass the higher threshold in order to significantly promote green high-quality development. Only when fintech reaches a certain threshold can the pilot cities make use of the support provided by fintech in terms of financing channels, data analysis, financial innovation, and risk management to raise funds for green projects, improve green identification capabilities, more efficiently assess and manage the environmental and climate risks of green projects, achieve energy conservation and emission reductions [79] and economic growth, and promote high-quality green development.
When urban innovation is the threshold variable, before it crosses the threshold (lninnovation ≤ 4.0970), the regression coefficient at this time is negative and insignificant, indicating that low-carbon city pilot policy at this time is difficult to promote green, high-quality development or even there may be inhibition. When urban innovation crosses the threshold (lninnovation > 4.0970), the regression coefficient is significantly positive at the 1% level, indicating that urban innovation needs to cross a higher threshold to significantly promote green high-quality development. The reason for this is that stronger urban innovation capacity means that local governments place a higher value on and support green innovation [69] and are better able to provide advanced technologies to pilot areas, which can reduce natural resource constraints in the production process and reduce reliance on human resources through technological innovations, promoting green development [80,81].
5.3. Heterogeneity Analysis
5.3.1. Heterogeneity Analysis: Geographic Position
Because there are significant differences in economic strength, demographic structure, and industrial structure across the city, this paper is divided into three sub-samples based on geographical location in the eastern, central, and western regions to conduct the heterogeneity test. The results are presented in Table 10, columns (1), (2), and (3). The low-carbon city pilot policy fosters green, high-quality development, notably in the eastern region and not in the center or western regions.
Table 10.
Heterogeneity test regression results.
The main reasons behind this are as follows: First, the eastern area is more economically developed than the central and western regions, with greater technological and financial resources [82], making it simpler to adopt low-carbon policies and support the growth of green technology and enterprises. Second, the eastern region is densely populated and industrialized, resulting in increased environmental pressures and concern for environmental issues [83], as well as a larger need to enact low-carbon policies to improve environmental quality. In contrast, the central and western regions are less densely inhabited and under less environmental strain, making the need for low-carbon measures less pressing than in the eastern regions. Third, the eastern region’s industrial structure is more diverse, with stronger development of service and high-tech industries, making it easier to implement pilot low-carbon city policies and fostering green technology innovation and demonstration effects. On the other hand, the majority of the central and western regions are dominated by highly polluting heavy and traditional industries, with a high proportion of secondary industries, making industrial structure adjustment and upgrading difficult and expensive [84], resulting in a less significant role for low-carbon city pilot policy.
5.3.2. Heterogeneity Analysis: Financial Development
The implementation effect of low-carbon city pilot policies may also be affected by differences in the level of official development. This document relates to the “2021 Financial Competitiveness Ranking of Provinces and Cities in Mainland China,” which was produced and published by the Securities Times and New Fortune and measures the level of financial development based on city financial competitiveness. Cities in the sample that rank among the top 50 in terms of financial competitiveness in Mainland China are designated as financially developed cities, while the remaining 231 cities are classified as financially undeveloped cities. The results of the regression are as shown in columns (3) and (4) of Table 10. The implementation of a low-carbon city pilot policy greatly improves green, high-quality development in financially developed cities but has no substantial influence on financially undeveloped cities.
One probable explanation is that financially developed cities have more complete financial markets and institutions, allowing them to provide effective financial services for low-carbon transition [85]. These areas can better direct the flow of funds to green and low-carbon projects, reduce financing costs and difficulties for high-pollution and high-energy-consumption industries, and thus promote industrial structure optimization and upgrading, as well as green, high-quality development in the pilot areas.
5.3.3. Heterogeneity Analysis: Native Endowment
This paper also investigates how disparities in urban resource endowments affect urban development and policy implementation effectiveness. Based on the State Council’s National Sustainable Development Plan for Resource-based Cities (2013–2020), this report separates the 281 cities into 111 resource-based cities and 170 non-resource-based cities. The results, as shown in Table 10, columns (5) and (6), reveal that low-carbon city pilot policy plays an important role in fostering high-quality green growth in non-resource cities but has no meaningful influence on resource cities.
The reason for this is that, in comparison to resource-based cities, non-resource-based city growth is more focused on optimizing industrial structure, strengthening technical innovation [86], and improving energy efficiency. As a result, with the backing of a low-carbon city pilot policy, the green, high-quality development of non-resource cities is more significant. In contrast, resource-based cities frequently rely on regional resource endowments to develop resource-based industries [87], have relatively low levels of technology, and are prone to path dependence [88], making it more difficult for resource-based cities to implement a low-carbon city pilot policy and significantly promote green, high-quality development in the city.
6. Research Conclusions and Recommendations
Understanding the policy impact of low-carbon city pilot policies on green high-quality development is critical for determining how to use appropriate environmental policy design to promote low-carbon transition and green economic development, as well as achieve green high-quality development when China is starting from scratch. This research treats low-carbon city pilot policy as a quasi-natural experiment, and using panel data from 281 Chinese cities from 2007 to 2020, we utilize a multi-temporal DID model to investigate the influence of low-carbon city pilot policy on green, high-quality development.
The study discovered that, first, low-carbon city pilot policies can considerably boost high-quality green growth in cities. This conclusion is consistent after the parallel trend test, placebo test, endogeneity test, and a variety of other robustness tests, confirming the stability and reproducibility of this finding. Second, fintech and urban innovation play a moderating role in promoting green, high-quality development through low-carbon city pilot policies. There is a single threshold, and low-carbon city pilot policies can only significantly promote green, high-quality development if FinTech and urban innovation cross it. Third, low-carbon city pilot policies make varying contributions to green, high-quality development. In terms of city location heterogeneity, the eastern region’s cities have had a greater increase in green, high-quality development than the middle and western areas. Sub-economic strength variation is evident, with financially developed cities experiencing far more green, high-quality development than financially undeveloped cities. Non-resource-based cities play a larger role in fostering green, high-quality development through low-carbon policies than resource-based cities because of sub-resource-endowment variability.
This paper proposes the following policy proposals to further support the construction of low-carbon cities and achieve high-quality green development: First, encourage fintech growth to digitally facilitate greening. Research has shown that the relevance of low-carbon city pilot policies in fostering green, high-quality development grows as fintech advances. To that end, the government should increase its investment in fintech R&D funds, support the development and innovation of cutting-edge technologies, encourage fintech enterprises to innovate in green technology, promote the deep integration of digital technology and green industries, and develop green financial projects. Second, encourage the close convergence of urban innovation with low-carbon governance. According to research, low-carbon city pilot policies can only significantly contribute to high-quality green development in places with stronger innovation capacity. The government should boost the innovative vitality of businesses and individuals by establishing innovation policies and providing financial assistance for innovation. Simultaneously, it should improve science and technology education, attract top personnel, and foster a conducive innovation ecosystem to encourage urban innovation. Third, the development of low-carbon cities should be encouraged in accordance with local circumstances. Governments should develop realistic low-carbon urban planning and policy measures based on the features of local economies, resources, and environments and promote initiatives such as green travel, energy savings and emission reduction, and the use of renewable energy. Simultaneously, monitoring and evaluation systems should be improved to encourage the successful implementation and continual development of low-carbon city pilot policies.
Although the research in this work has thoroughly investigated the influence of low-carbon city pilot policies on green, high-quality development, there are some limitations. For starters, the indicators’ explanatory ability is insufficient. This paper only uses the green total factor productivity of prefecture-level cities to measure the level of green high-quality development, failing to construct an indicator system to comprehensively measure the level of green high-quality development in cities, resulting in insufficient explanatory capacity for the study’s findings. Second, there are data restrictions. The study is based on panel data from 281 Chinese cities from 2007 to 2020, which is not sufficiently recent and may not include all variables related to low-carbon and green growth, resulting in the model’s limited explanatory ability. Thirdly, there are geographical variances. Although the analysis considers the variability of city location, economic strength, and resource endowment, China is a vast territory with considerable variances in policy execution and impacts that this work may not fully reflect.
Given the constraints of this paper’s research, future research will focus on the following areas: First, develop a multidimensional green, high-quality development indicator system. This indicator system can encompass economic, environmental, social, and other factors, such as green GDP, carbon emission intensity, energy efficiency, air quality, and other metrics. By combining these metrics, the low-carbon city pilot policy’s influence on green, high-quality development can be evaluated more thoroughly. Second, update and increase data collections. To overcome the issue of data limitations, future studies could seek out fresher and more extensive data to represent the most recent effects of low-carbon city pilot policies. Third, a thorough investigation of geographical variances. To address the issue of regional differences, future studies could delve deeper into the variances in policy implementation and consequences across areas. The applicability and success of policies in different places can be evaluated in terms of economic, social, cultural, and other contextual aspects.
Although this paper’s findings are based on Chinese data and context, they are applicable to other countries. Low-carbon city building and green, high-quality development are global issues, and all countries face comparable difficulties and opportunities. The conclusions of this research can help other countries establish and implement policies relating to low-carbon city building and green development. The paper’s findings on regional disparities and plurality can help other countries better understand the complexity and diversity of low-carbon city building and green growth. Economic growth, resource endowment, social culture, and other factors vary by country and location, resulting in varied paths and modalities of low-carbon city construction and green development. As a result, other countries can take inspiration from them and pursue low-carbon city construction and green development pathways that are appropriate for their own countries.
Author Contributions
Conceptualization by C.Z.; methodology by C.Z.; Data curation by S.J.; Formal analysis S.J.; writing—original draft by S.J.; writing—review and editing by F.Z.; supervision by F.Z. All authors have read and agreed to the published version of the manuscript.
Funding
This research received no external funding.
Institutional Review Board Statement
Not applicable.
Informed Consent Statement
Not applicable.
Data Availability Statement
The data presented in this study are available on request from the corresponding author.
Conflicts of Interest
The authors declare no conflicts of interest.
References
- Zeng, S.; Jin, G.; Tan, K.; Liu, X. Can low-carbon city construction reduce carbon intensity? Empirical evidence from low-carbon city pilot policy in China. J. Environ. Manag. 2023, 332, 117363. [Google Scholar] [CrossRef]
- Song, Q.; Qin, M.; Wang, R.; Qi, Y. How does the nested structure affect policy innovation? Empirical research on China’s low carbon pilot cities. Energy Policy 2020, 144, 111695. [Google Scholar] [CrossRef]
- Liu, W.; Qin, B. Low-carbon city initiatives in China: A review from the policy paradigm perspective. Cities 2016, 51, 131–138. [Google Scholar] [CrossRef]
- Chen, H.; Yang, L.; Chen, W. Modelling national, provincial and city-level low-carbon energy transformation pathways. Energy Policy 2020, 137, 111096. [Google Scholar] [CrossRef]
- Fu, Y.; He, C.; Luo, L. Does the low-carbon city policy make a difference? Empirical evidence of the pilot scheme in China with DEA and PSM-DID. Ecol. Indic. 2021, 122, 107238. [Google Scholar] [CrossRef]
- Sun, X.; Wang, Z. Can Chinese families achieve a low-carbon lifestyle? An empirical test of China’s low-carbon pilot policy. Front. Energy Res. 2021, 9, 655733. [Google Scholar] [CrossRef]
- He, C.; Zhou, C.; Wen, H. Improving the consumer welfare of rural residents through public support policies: A study on old revolutionary areas in China. Socio-Econ. Plan. Sci. 2024, 91, 101767. [Google Scholar] [CrossRef]
- Yu, Y.; Zhang, N. Low-carbon city pilot and carbon emission efficiency: Quasi-experimental evidence from China. Energy Econ. 2021, 96, 105125. [Google Scholar] [CrossRef]
- Wen, S.; Jia, Z.; Chen, X. Can low-carbon city pilot policies significantly improve carbon emission efficiency? Empirical evidence from China. J. Clean. Prod. 2022, 346, 131131. [Google Scholar] [CrossRef]
- Zhang, H.; Feng, C.; Zhou, X. Going carbon-neutral in China: Does the low-carbon city pilot policy improve carbon emission efficiency? Sustain. Prod. Consum. 2022, 33, 312–329. [Google Scholar] [CrossRef]
- Li, J.; Fang, L.; Chen, S.; Mao, H. Can low-carbon pilot policy improve atmospheric environmental performance in China? A quasi-natural experiment approach. Environ. Impact Assess. Rev. 2022, 96, 106807. [Google Scholar] [CrossRef]
- He, Y.; Lai, Z.; Liao, N. Evaluating the effect of low-carbon city pilot policy on urban PM2. 5: Evidence from a quasi-natural experiment in China. Environ. Dev. Sustain. 2024, 26, 4725–4751. [Google Scholar] [CrossRef]
- Li, Z.; Bai, T.; Tang, C. How does the low-carbon city pilot policy affect the synergistic governance efficiency of carbon and smog? Quasi-experimental evidence from China. J. Clean. Prod. 2022, 373, 133809. [Google Scholar] [CrossRef]
- Shen, W.; Wang, Y.; Luo, W. Does the Porter hypothesis hold in China? Evidence from the low-carbon city pilot policy. J. Appl. Econ. 2021, 24, 246–269. [Google Scholar] [CrossRef]
- Huo, W.; Qi, J.; Yang, T.; Liu, J.; Liu, M.; Zhou, Z. Effects of China’s pilot low-carbon city policy on carbon emission reduction: A quasi-natural experiment based on satellite data. Technol. Forecast. Soc. Chang. 2022, 175, 121422. [Google Scholar] [CrossRef]
- Wen, H.; Hu, K.; Nghiem, X.H.; Acheampong, A.O. Urban climate adaptability and green total-factor productivity: Evidence from double dual machine learning and differences-in-differences techniques. J. Environ. Manag. 2024, 350, 119588. [Google Scholar] [CrossRef] [PubMed]
- Zheng, J.; Shao, X.; Liu, W.; Kong, J.; Zuo, G. The impact of the pilot program on industrial structure upgrading in low-carbon cities. J. Clean. Prod. 2021, 290, 125868. [Google Scholar] [CrossRef]
- Niu, H.; Vatsa, P.; Ma, W.; Li, J. Environmental regulation and energy efficiency: Empirical evidence from the low-carbon city pilot program in China. Energy Effic. 2023, 16, 61. [Google Scholar] [CrossRef]
- Qiu, S.; Wang, Z.; Liu, S. The policy outcomes of low-carbon city construction on urban green development: Evidence from a quasi-natural experiment conducted in China. Sustain. Cities Soc. 2021, 66, 102699. [Google Scholar] [CrossRef]
- Chen, H.; Guo, W.; Feng, X.; Wei, W.; Liu, H.; Feng, Y.; Gong, W. The impact of low-carbon city pilot policy on the total factor productivity of listed enterprises in China. Resour. Conserv. Recycl. 2021, 169, 105457. [Google Scholar] [CrossRef]
- Shao, H.; Wang, Y.; Wen, H. Investigating the carbon curse of natural resource dependence: A carbon trading scheme. Econ. Anal. Policy 2024, 82, 769–783. [Google Scholar] [CrossRef]
- Cheng, J.; Yi, J.; Dai, S.; Xiong, Y. Can low-carbon city construction facilitate green growth? Evidence from China’s pilot low-carbon city initiative. J. Clean. Prod. 2019, 231, 1158–1170. [Google Scholar] [CrossRef]
- Su, Y.; Gao, X. Revealing the effectiveness of green technological progress and financial innovation on green economic growth: The role of environmental regulation. Environ. Sci. Pollut. Res. 2022, 29, 72991–73000. [Google Scholar] [CrossRef]
- Yang, X.; Zhang, J.; Ren, S.; Ran, Q. Can the new energy demonstration city policy reduce environmental pollution? Evidence from a quasi-natural experiment in China. J. Clean. Prod. 2021, 287, 125015. [Google Scholar] [CrossRef]
- Wang, C.A.; Liu, X.; Li, H.; Yang, C. Analyzing the impact of low-carbon city pilot policy on enterprises’ labor demand: Evidence from China. Energy Econ. 2023, 124, 106676. [Google Scholar] [CrossRef]
- Yang, S.; Jahanger, A.; Hossain, M.R. How effective has the low-carbon city pilot policy been as an environmental intervention in curbing pollution? Evidence from Chinese industrial enterprises. Energy Econ. 2023, 118, 106523. [Google Scholar] [CrossRef]
- Wen, H.; Wang, R.; Liu, Y. Towards Carbon Neutrality in Agglomeration: Impact of Eco-Industry Development on Urban Carbon Emission Efficiency. Sustainability 2024, 16, 3159. [Google Scholar] [CrossRef]
- Lee, C.C.; Feng, Y.; Peng, D. A green path towards sustainable development: The impact of low-carbon city pilot on energy transition. Energy Econ. 2022, 115, 106343. [Google Scholar] [CrossRef]
- Wang, Y.; Wei, S.; He, X.; Gu, H. Environmental regulation and entrepreneurial activity: Evidence from the low-carbon city pilot policy in China. Sustain. Cities Soc. 2023, 98, 104829. [Google Scholar] [CrossRef]
- Li, S.; Zheng, X.; Liao, J.; Niu, J. Low-carbon city pilot policy and corporate environmental performance: Evidence from a quasi-natural experiment. Int. Rev. Econ. Financ. 2024, 89, 1248–1266. [Google Scholar] [CrossRef]
- Chen, L.; Wang, K. The spatial spillover effect of low-carbon city pilot scheme on green efficiency in China’s cities: Evidence from a quasi-natural experiment. Energy Econ. 2022, 110, 106018. [Google Scholar] [CrossRef]
- Du, K.; Cheng, Y.; Yao, X. Environmental regulation, green technology innovation, and industrial structure upgrading: The road to the green transformation of Chinese cities. Energy Econ. 2021, 98, 105247. [Google Scholar] [CrossRef]
- Zhang, J.; Zheng, T. Can dual pilot policy of innovative city and low carbon city promote green lifestyle transformation of residents? J. Clean. Prod. 2023, 405, 136711. [Google Scholar] [CrossRef]
- Zhao, M.; Zhang, B. Credit corruption, financial constraint and corporate innovation: Evidence on China. Financ. Res. Lett. 2023, 53, 103658. [Google Scholar] [CrossRef]
- Goldstein, I.; Jiang, W.; Karolyi, G.A. To FinTech and beyond. Rev. Financ. Stud. 2019, 32, 1647–1661. [Google Scholar] [CrossRef]
- Croutzet, A.; Dabbous, A. Do FinTech trigger renewable energy use? Evidence from OECD countries. Renew. Energy 2021, 179, 1608–1617. [Google Scholar] [CrossRef]
- Zhu, H.; Goh, H.H.; Zhang, D.; Ahmad, T.; Liu, H.; Wang, S.; Li, S.; Liu, T.; Dai, H.; Wu, T. Key technologies for smart energy systems: Recent developments, challenges, and research opportunities in the context of carbon neutrality. J. Clean. Prod. 2022, 331, 129809. [Google Scholar] [CrossRef]
- Dabbous, A.; Barakat, K.A.; Kraus, S. The impact of digitalization on entrepreneurial activity and sustainable competitiveness: A panel data analysis. Technol. Soc. 2023, 73, 102224. [Google Scholar] [CrossRef]
- Arner, D.W.; Buckley, R.P.; Zetzsche, D.A.; Veidt, R. Sustainability, FinTech and financial inclusion. Eur. Bus. Organ. Law Rev. 2020, 21, 7–35. [Google Scholar] [CrossRef]
- Ahmed, A.D.; Huo, R. Linkages among energy price, exchange rates and stock markets: Evidence from emerging African economies. Appl. Econ. 2020, 52, 1921–1935. [Google Scholar] [CrossRef]
- Cao, Y.; Zhang, Y.; Yang, L.; Li, R.Y.M.; Crabbe, M.J.C. Green credit policy and maturity mismatch risk in polluting and non-polluting companies. Sustainability 2021, 13, 3615. [Google Scholar] [CrossRef]
- Zhou, G.; Zhu, J.; Luo, S. The impact of fintech innovation on green growth in China: Mediating effect of green finance. Ecol. Econ. 2022, 193, 107308. [Google Scholar] [CrossRef]
- Xu, B.; Xu, R. Assessing the role of environmental regulations in improving energy efficiency and reducing CO2 emissions: Evidence from the logistics industry. Environ. Impact Assess. Rev. 2022, 96, 106831. [Google Scholar] [CrossRef]
- Deng, X.; Huang, Z.; Cheng, X. FinTech and sustainable development: Evidence from China based on P2P data. Sustainability 2019, 11, 6434. [Google Scholar] [CrossRef]
- Yang, L.; Ni, M. Is financial development beneficial to improve the efficiency of green development? Evidence from the “Belt and Road” countries. Energy Econ. 2022, 105, 105734. [Google Scholar] [CrossRef]
- Ahmed, M.; Hafeez, M.; Kaium, M.A.; Ullah, S.; Ahmad, H. Do environmental technology and banking sector development matter for green growth? Evidence from top-polluted economies. Environ. Sci. Pollut. Res. 2023, 30, 14760–14769. [Google Scholar] [CrossRef] [PubMed]
- Yang, Y.; Su, X.; Yao, S. Nexus between green finance, fintech, and high-quality economic development: Empirical evidence from China. Resour. Policy 2021, 74, 102445. [Google Scholar] [CrossRef]
- Muhammad, S.; Pan, Y.; Magazzino, C.; Luo, Y.; Waqas, M. The fourth industrial revolution and environmental efficiency: The role of fintech industry. J. Clean. Prod. 2022, 381, 135196. [Google Scholar] [CrossRef]
- Cheng, X.; Yao, D.; Qian, Y.; Wang, B.; Zhang, D. How does fintech influence carbon emissions: Evidence from China’s prefecture-level cities. Int. Rev. Financ. Anal. 2023, 87, 102655. [Google Scholar] [CrossRef]
- Grennan, J.; Michaely, R. Fintechs and the market for financial analysis. J. Financ. Quant. Anal. 2021, 56, 1877–1907. [Google Scholar] [CrossRef]
- Deng, Y.; Dong, K. How does the coal-to-gas policy mitigate carbon emissions? The role of fintech development. Resour. Policy 2024, 89, 104605. [Google Scholar] [CrossRef]
- Tan, Q.; Yasmeen, H.; Ali, S.; Ismail, H.; Zameer, H. Fintech development, renewable energy consumption, government effectiveness and management of natural resources along the belt and road countries. Resour. Policy 2023, 80, 103251. [Google Scholar] [CrossRef]
- Li, B.; Du, J.; Yao, T.; Wang, Q. FinTech and corporate green innovation: An external attention perspective. Financ. Res. Lett. 2023, 58, 104661. [Google Scholar] [CrossRef]
- Tian, Y.; Mao, Q. The effect of regional integration on urban sprawl in urban agglomeration areas: A case study of the Yangtze River Delta, China. Habitat Int. 2022, 130, 102695. [Google Scholar] [CrossRef]
- Ren, X.; Zeng, G.; Gozgor, G. How does digital finance affect industrial structure upgrading? Evidence from Chinese prefecture-level cities. J. Environ. Manag. 2023, 330, 117125. [Google Scholar] [CrossRef]
- Wen, J.; Okolo, C.V.; Ugwuoke, I.C.; Kolani, K. Research on influencing factors of renewable energy, energy efficiency, on technological innovation. Does trade, investment and human capital development matter? Energy Policy 2022, 160, 112718. [Google Scholar] [CrossRef]
- Markard, J. The next phase of the energy transition and its implications for research and policy. Nat. Energy 2018, 3, 628–633. [Google Scholar] [CrossRef]
- Jia, L.; Cheng, P.; Yu, Y.; Chen, S.H.; Wang, C.X.; He, L.; Nie, H.T.; Wang, J.C.; Zhang, J.C.; Fan, B.G.; et al. Regeneration mechanism of a novel high-performance biochar mercury adsorbent directionally modified by multimetal multilayer loading. J. Environ. Manag. 2023, 326, 116790. [Google Scholar] [CrossRef]
- Lee, C.; Lim, C. From technological development to social advance: A review of Industry 4.0 through machine learning. Technol. Forecast. Soc. Chang. 2021, 167, 120653. [Google Scholar] [CrossRef]
- Zhu, M.; Huang, H.; Ma, W. Transformation of natural resource use: Moving towards sustainability through ICT-based improvements in green total factor energy efficiency. Resour. Policy 2023, 80, 103228. [Google Scholar] [CrossRef]
- Su, Y.; Fan, Q.M. Renewable energy technology innovation, industrial structure upgrading and green development from the perspective of China’s provinces. Technol. Forecast. Soc. Chang. 2022, 180, 121727. [Google Scholar] [CrossRef]
- Neves, P.C.; Afonso, O.; Silva, D.; Sochirca, E. The link between intellectual property rights, innovation, and growth: A meta-analysis. Econ. Model. 2021, 97, 196–209. [Google Scholar] [CrossRef]
- Du, K.; Li, P.; Yan, Z. Do green technology innovations contribute to carbon dioxide emission reduction? Empirical evidence from patent data. Technol. Forecast. Soc. Chang. 2019, 146, 297–303. [Google Scholar] [CrossRef]
- Wang, H.J.; Tang, K. Extreme climate, innovative ability and energy efficiency. Energy Econ. 2023, 120, 106586. [Google Scholar] [CrossRef]
- Yan, Z.; Sun, Z.; Shi, R.; Zhao, M. Smart city and green development: Empirical evidence from the perspective of green technological innovation. Technol. Forecast. Soc. Chang. 2023, 191, 122507. [Google Scholar] [CrossRef]
- Lin, B.; Ma, R. Green technology innovations, urban innovation environment and CO2 emission reduction in China: Fresh evidence from a partially linear functional-coefficient panel model. Technol. Forecast. Soc. Chang. 2022, 176, 121434. [Google Scholar] [CrossRef]
- Pan, A.; Zhang, W.; Shi, X.; Dai, L. Climate policy and low-carbon innovation: Evidence from low-carbon city pilots in China. Energy Econ. 2022, 112, 106129. [Google Scholar] [CrossRef]
- Wang, J.; Cai, S. The construction of high-speed railway and urban innovation capacity: Based on the perspective of knowledge Spillover. China Econ. Rev. 2020, 63, 101539. [Google Scholar] [CrossRef]
- Tang, K.; Wang, Y.Y.; Wang, H.J. The impact of innovation capability on green development in China’s urban agglomerations. Technol. Forecast. Soc. Chang. 2024, 200, 123128. [Google Scholar] [CrossRef]
- Ma, D.; Zhu, Q. Innovation in emerging economies: Research on the digital economy driving high-quality green development. J. Bus. Res. 2022, 145, 801–813. [Google Scholar] [CrossRef]
- Yao, Y.; Hu, D.; Yang, C.; Tan, Y. The impact and mechanism of fintech on green total factor productivity. Green Financ. 2021, 3, 198–221. [Google Scholar] [CrossRef]
- Wang, H.; Guo, J. Impacts of digital inclusive finance on CO2 emissions from a spatial perspective: Evidence from 272 cities in China. J. Clean. Prod. 2022, 355, 131618. [Google Scholar] [CrossRef]
- Tang, S.; Chen, Z.; Chen, J.; Quan, L.; Guan, K. Does FinTech promote corporate competitiveness? Evidence from China. Financ. Res. Lett. 2023, 58, 104660. [Google Scholar] [CrossRef]
- Liu, J.; Zhang, Y.; Kuang, J. Fintech development and green innovation: Evidence from China. Energy Policy 2023, 183, 113827. [Google Scholar] [CrossRef]
- Cao, S.; Nie, L.; Sun, H.; Sun, W.; Taghizadeh-Hesary, F. Digital finance, green technological innovation and energy-environmental performance: Evidence from China’s regional economies. J. Clean. Prod. 2021, 327, 129458. [Google Scholar] [CrossRef]
- Yu, R.; Li, J. Does fintech influence sustainable development under natural resource constraints: Insights from 270 Chinese cities. Resour. Policy 2024, 91, 104924. [Google Scholar] [CrossRef]
- Esmaeilpoorarabi, N.; Yigitcanlar, T.; Guaralda, M. Place quality in innovation clusters: An empirical analysis of global best practices from Singapore, Helsinki, New York, and Sydney. Cities 2018, 74, 156–168. [Google Scholar] [CrossRef]
- Wang, R.; Cai, W.; Ren, H.; Ma, X. Heterogeneous effects of the talent competition on urban innovation in China: Evidence from prefecture-level cities. Land 2023, 12, 719. [Google Scholar] [CrossRef]
- Li, X.; Jiang, Y.; Xin, X.; Nassani, A.A.; Yang, C. The asymmetric role of natural resources, fintech and green innovations in the Chinese economy. Evidence from QARDL approach. Resour. Policy 2024, 90, 104731. [Google Scholar] [CrossRef]
- Liu, Y.; Dong, F. How technological innovation impacts urban green economy efficiency in emerging economies: A case study of 278 Chinese cities. Resour. Conserv. Recycl. 2021, 169, 105534. [Google Scholar] [CrossRef]
- Suki, N.M.; Suki, N.M.; Afshan, S.; Sharif, A.; Meo, M.S. The paradigms of technological innovation and renewables as a panacea for sustainable development: A pathway of going green. Renew. Energy 2022, 181, 1431–1439. [Google Scholar] [CrossRef]
- Song, Y.; He, Y.; Sahut, J.M.; Shah, S.H. Can low-carbon city pilot policy decrease urban energy poverty? Energy Policy 2024, 186, 113989. [Google Scholar] [CrossRef]
- Liu, X.; Li, Y.; Chen, X.; Liu, J. Evaluation of low carbon city pilot policy effect on carbon abatement in China: An empirical evidence based on time-varying DID model. Cities 2022, 123, 103582. [Google Scholar] [CrossRef]
- Ren, Y.S.; Liu, P.Z.; Klein, T.; Sheenan, L. Does the low-carbon pilot cities policy make a difference to the carbon intensity reduction? J. Econ. Behav. Organ. 2024, 217, 227–239. [Google Scholar] [CrossRef]
- Zhao, S.; Zhang, L.; An, H.; Peng, L.; Zhou, H.; Hu, F. Has China’s low-carbon strategy pushed forward the digital transformation of manufacturing enterprises? Evidence from the low-carbon city pilot policy. Environ. Impact Assess. Rev. 2023, 102, 107184. [Google Scholar] [CrossRef]
- Wang, L.; Shao, J.; Ma, Y. Does China’s low-carbon city pilot policy improve energy efficiency? Energy 2023, 283, 129048. [Google Scholar] [CrossRef]
- Sun, L.; Feng, N. Research on fiscal policies supporting green and low-carbon transition to promote energy conservation and emission reduction in cities: Empirical evidence from China. J. Clean. Prod. 2023, 430, 139688. [Google Scholar] [CrossRef]
- Fu, L.; Zhao, H.; Ma, F.; Chen, J. Estimating heterogeneous effects of China’s low-carbon pilot city policy on urban employment. J. Clean. Prod. 2024, 434, 139882. [Google Scholar] [CrossRef]
Disclaimer/Publisher’s Note: The statements, opinions and data contained in all publications are solely those of the individual author(s) and contributor(s) and not of MDPI and/or the editor(s). MDPI and/or the editor(s) disclaim responsibility for any injury to people or property resulting from any ideas, methods, instructions or products referred to in the content. |
© 2024 by the authors. Licensee MDPI, Basel, Switzerland. This article is an open access article distributed under the terms and conditions of the Creative Commons Attribution (CC BY) license (https://creativecommons.org/licenses/by/4.0/).