Article

Understanding the Synergistic Effects of Walking Accessibility and the Built Environment on Street Vitality in High-Speed Railway Station Areas

1
School of Transportation, Southeast University, Nanjing 211189, China
2
Jiangsu Key Laboratory of Urban ITS, Southeast University, Nanjing 211189, China
3
Jiangsu Collaborative Innovation Center of Modern Urban Traffic Technologies, Southeast University, Nanjing 211189, China
4
Department of Logistics and Maritime Studies, Faculty of Business, The Hong Kong Polytechnic University, Hung Hom, Hong Kong
*
Author to whom correspondence should be addressed.
Sustainability 2024, 16(13), 5524; https://doi.org/10.3390/su16135524
Submission received: 20 May 2024 / Revised: 15 June 2024 / Accepted: 24 June 2024 / Published: 28 June 2024

Abstract

:
The high-speed railway (HSR) has profoundly influenced individuals’ lifestyles and travel behaviors. The development of HSR stations and their surrounding areas plays a critical role in urban growth, enhancing both transport efficiency and urban functionality. This study investigates the development of HSR station areas, with a particular focus on Shanghai Hongqiao station, emphasizing the enhancement of street vitality as essential for integrated urban development. Street vitality in station areas is closely associated with individuals’ activities and travel behaviors, influenced by walking accessibility and the built environment. Understanding these factors is crucial for improving the efficiency and attractiveness of HSR station areas. Although extensive research has examined the separate impacts of the built environment and walking accessibility on street vitality, a significant gap remains in comprehending their synergistic effects. This study employs GPS and point-of-interest (POI) data to analyze the stay time of HSR passengers in station areas. Utilizing machine learning algorithms and geographic information system (GIS) tools, this research models the impact of walking accessibility and the built environment on passengers’ stay time. The results indicate that passengers are more inclined to remain within areas accessible by a 7 min walk from the station. Furthermore, the synergistic effects of walking accessibility and the built environment can inform the spatial planning of various functions. These findings provide valuable insights for urban planners and policymakers aiming to enhance the development and efficiency of HSR station areas.

1. Introduction

China has become the country with the longest mileage of high-speed railway (HSR) operation, the largest number of high-speed trains, the most complete technical system, and the richest experience in high-speed railway transport management in the world [1,2]. Meanwhile, the high-speed railway has gradually become an important transport artery in the country and a popular choice for residents’ travel due to its safety, speed, and comfort, thus influencing people’s lifestyles and travel habits. The construction of high-speed railway stations and the development of their station areas can inject new vitality into urban development [3,4,5]. A beneficial interaction will occur among high-speed railway stations, urban traffic, and urban functions, thereby improving residents’ travel efficiency and quality, and significantly impacting city economic development [3,6,7,8].
The large-scale construction of the high-speed railway drives the development of high-speed railway stations, which play a crucial role in enhancing the transport efficiency of the regional network. The spatial form, land use, and functional structure within the station areas also create a new pattern [9]. The station areas take on more urban public transport and socio-economic service functions, leading to intensified land use and the development of composite functions. The function of the high-speed railway station areas evolves from a single transport distribution function to integrating transport, commerce, service, and ecology. This evolution aims to attract people for purposes other than transportation, leading to the development of a vibrant urban space [10]. Consequently, the study of high-speed railway station areas’ development has become a hot topic in the fields of transport planning and urban planning [11]. Enhancing the street vitality of the high-speed railway station areas is crucial for the integrated development of the station and the city.
The street vitality of station areas is mainly reflected in population flow, agglomeration, and changes in land use structure, which are closely related to people’s activities and travel behavior [12,13]. The attractiveness of activity venues and the rational layout of the built environment, formed by the combination of activity venues, reflect the street vitality of station areas [14]. Analyzing the characteristics and purposes of activity trips, studying the relationship between activity venues and activity trips, and understanding the influence mechanism of the built environment in the station areas on activity trips are essential for enhancing the efficiency of HSR station areas [15,16]. The stay time in the HSR station areas directly reflects the intensity of economic and social activities and is a critical basis for characterizing the development efficiency of the HSR station areas. By analyzing the characteristics and purposes of people’s activity attendance behavior and understanding the influence mechanism of the built environment formed by activity venues and their combinations on activity attendance, city managers and transport planners can accurately discern the pattern of activity attendance in the HSR station areas. This understanding enables them to propose targeted strategies to optimize the built environment and enhance the street vitality of the station areas.
In the context of the information age, the constant innovation and development of Internet technologies provide a wealth of multi-source traffic and land use data [17]. These data can help uncover people’s activity–travel patterns [18]. Traditional activity and travel data are collected from residents’ travel questionnaire surveys [19,20]. However, these surveys are limited in scope due to the high cost, lengthy periods, and low timeliness. In the era of big data, GPS data and point-of-interest (POI) data from web mapping platforms offer advantages such as a large quantity, high timeliness, and high accuracy [21,22,23]. These data sources can accurately and conveniently reflect people’s activity trajectories, analyze the core of the travel service system scientifically, and provide a solid data foundation for the analysis of activity and travel in the high-speed railway station areas. Furthermore, the emergence and popularity of new information analysis technologies, such as machine learning algorithms and geographic information system software like ArcGIS, provide favorable technical conditions for capturing features, identifying the purposes of people’s activity and travel in the high-speed railway station areas, studying the influence mechanism of the built environment on activity and travel, and formulating performance improvement strategies [24,25]. The key issue for the sustainable and healthy development of the high-speed railway (HSR) station areas is how to fully utilize new data and technical conditions to scientifically analyze the activity–travel behavior of the HSR station areas. This research will propose scientifically reasonable strategies for improving efficiency to address the development issues of high-speed railway station areas. It will promote the integration of station and city development and resource allocation in a targeted, rational, and orderly manner, fully leveraging the node function and site function of high-speed railway stations [26,27]. This will drive a positive interaction between high-speed railway stations and urban development, which have important practical value and long-term significance.
In this study, we aim to analyze the activity–travel behavior of the HSR station areas by utilizing passively collected traffic data, geographic information system (GIS) data, and a web mapping API. The data sources include GPS data and POI data. Our objective is to investigate the impact of walking accessibility and built environment characteristics on HSR passengers’ stay time. Specifically, we mainly address the following issues:
  • How do we define and quantify street vitality in the HSR station areas based on GPS data?
  • What factors may influence street vitality in the HSR station areas?
  • Are the impacts of different factors on street vitality independent or synergistic?
Street vitality has been conceptually discussed in urban studies, often measured through pedestrian counts or survey-based methods. Prior research lacks a standardized approach to quantify street vitality in HSR station areas specifically. Our study introduces a more precise and replicable methodology for defining and quantifying street vitality using the stay time of HSR passengers [28,29]. Various factors affecting street vitality, such as land use diversity, accessibility, and environmental quality, have been identified in general urban contexts [30,31,32]. However, existing research has primarily focused on individual factors affecting street vitality, while largely overlooking potential interactions among these factors [33,34,35]. Our study investigates both the independent and synergistic effects of different factors on street vitality, providing a deeper understanding of their combined impact and offering more holistic insights for urban sustainable development strategies.
Our study makes several significant contributions to the field: (1) We propose a systematic measurement of walking accessibility from the HSR stations and determine the HSR station buffer areas within a 20 min walking duration using a web mapping API. (2) We explore the synergistic effects of walking accessibility and built environment characteristics on street vitality in HSR station areas. (3) We explore the synergistic effects of two-variable built environment characteristics on street vitality in HSR station areas.
The paper is organized as follows: Section 2 presents a literature review related to this study, focusing on the space development of HSR areas and the influencing factors of the street vitality around the stations. Section 3 describes the multi-source data used in the study. Section 4 details the research methodology, including the identification of HSR passengers, variables, and the model approach. Section 5 presents the results and analysis. Finally, Section 6 provides concluding remarks and outlines potential future work.

2. Literature Review

2.1. Space Development of High-Speed Railway Station Areas

The high-speed railway station serves as a pivotal point in the city, where the flows of people, information, and materials converge. It exerts influences at multiple levels. At the macro-level, the high-speed railway enhances accessibility to regions and cities along its route, contributing to the spatial pattern of the synergistic development of regional urban clusters [36]. At the meso-level, the station guides the secondary distribution of urban space and industrial resources, accelerating the formation of a multi-hub pattern and indirectly promoting the reorganization of the urban spatial structure [37]. At the micro-level, the station affects the spatial structure stratification of the station areas, driving the development of infrastructure, public service facilities, and the city itself [38]. This study focuses on the interaction between high-speed railway hubs and neighboring urban spaces at the micro-level.
Studies suggest that urban transportation hubs, like high-speed railway hubs, create strong attractions around them, leading to increased economic activity in the surrounding area [39,40]. Some studies incorporate the concept of “interaction value” into the “node–place” model, where the interaction value of the high-speed railway station is evident in the flow of people, goods, and information between the station and its surroundings, cities, and regions. This flow promotes corresponding adjustments in urban form and land use patterns, thus facilitating the spatial development and resource optimization of the entire city [41,42,43].
Nevertheless, the clustering effect of an HSR station typically occurs on one side of the station. During the construction process, the functions surrounding the HSR station are not symmetrically laid out on the axis of the HSR station and the railroad line network, but rather are concentrated on one side of the station. If the HSR station is unidirectional and centralized, the areas at the back and front show different development statuses, or even no development.

2.2. Influencing Factors of the Street Vitality around the Station

The notion of “street vitality” was originally introduced by Jane Jacobs, who emphasized the communal aspects of streets in terms of “the diversity of people’s lives”. Since its inception, street vitality has evolved into a key metric for assessing the allure and viability of urban sustainable growth [44]. The core of street vitality is that people engage in various activities on the street and their activities have interactions that generate a sense of social belonging [45,46]. More scholars believe that urban spatial vitality can be understood as a kind of urban activity based on the urban spatial form. In this paper, street vitality concerns mainly its social vitality and is related to the street spatial characteristics [47]. It can be measured by the intensity and complexity of activities reflected in the type and frequency of activities people perform on the street. Therefore, the stay time of HSR passengers in station areas is used to represent the the street vitality of high-speed railway station areas. The stay time of HSR passengers reflects the behavioral preferences of HSR passengers for different functions, and directly reflects the degree of people gathering in the HSR station.
According to existing studies, built environment characteristics [47,48,49] and walking accessibility [50,51,52] are two key influencing factors of the street vitality of station areas.
Understanding the relationship between the built environment characteristics and street vitality is essential for urban planners and policymakers to design and manage vibrant, pedestrian-friendly streetscapes. In recent years, advances in machine learning and the availability of point-of-interest (POI) data have provided new opportunities to analyze and model the complex interactions between urban form and street vitality [53,54,55]. The built environment encompasses a wide range of physical and spatial attributes, including building density, land use mix, street connectivity, and public space design, which collectively influence the vitality of urban streets. Street vitality, often measured by indicators such as pedestrian footfall, retail activity, and social interactions, reflects the level of vibrancy and activity within a street environment. Numerous studies have highlighted the significance of various built environment characteristics in shaping street vitality. For example, Jan Gehl’s work emphasizes the importance of human-scale urban design elements, such as sidewalk width, building height, and street furniture, in promoting vibrant and inviting pedestrian environments [56]. Point-of-interest (POI) data, which provide information about the location and category of businesses, services, and amenities, have become increasingly available through sources such as web mapping platforms and business directories [57,58,59]. Machine learning techniques, especially regression algorithms, offer powerful tools for analyzing POI data and extracting meaningful insights about urban spaces [60,61,62].
Walking is a fundamental mode of transportation in urban environments, and the accessibility of streets plays a crucial role in promoting walking as a sustainable and healthy means of travel. Studies have shown that streets with high levels of walking accessibility tend to exhibit higher levels of street vitality, as they attract more pedestrians and support a greater diversity of activities [50,51,52]. In recent years, advances in web mapping Application Programming Interfaces (APIs) have provided new opportunities to analyze and visualize walking accessibility and its relationship with street vitality [63,64,65]. Web mapping APIs, such as the Google Maps API, OpenStreetMap, and Mapbox, provide access to geospatial data and mapping services, which can be used to analyze walking accessibility and street vitality. These APIs offer a range of features, including routing algorithms, geocoding services, and spatial data visualization tools, which can be leveraged to study pedestrian movements, analyze street networks, and assess the walkability of urban areas. By integrating web mapping APIs with other data sources, such as demographic data and land use information, researchers can gain valuable insights into the relationship between walking accessibility and street vitality. Several studies have used web mapping APIs to analyze walking accessibility and street vitality [66,67].
While research has extensively studied the individual impacts of the built environment and walking accessibility on street vitality, there remains a significant gap in understanding the synergistic effect between these factors. Despite the recognized importance of both the built environment and walking accessibility in promoting vibrant and pedestrian-friendly streets, few studies have explicitly examined how these factors interact to influence street vitality [24]. Addressing this research gap requires a holistic approach that considers the synergistic effects of the built environment and walking accessibility on street vitality around stations. This could involve the development of integrated models that capture the complex relationships between these factors, as well as the use of advanced analytical techniques, such as machine learning and spatial analysis, to identify patterns and trends in street vitality around stations.

3. Study Area and Data Description
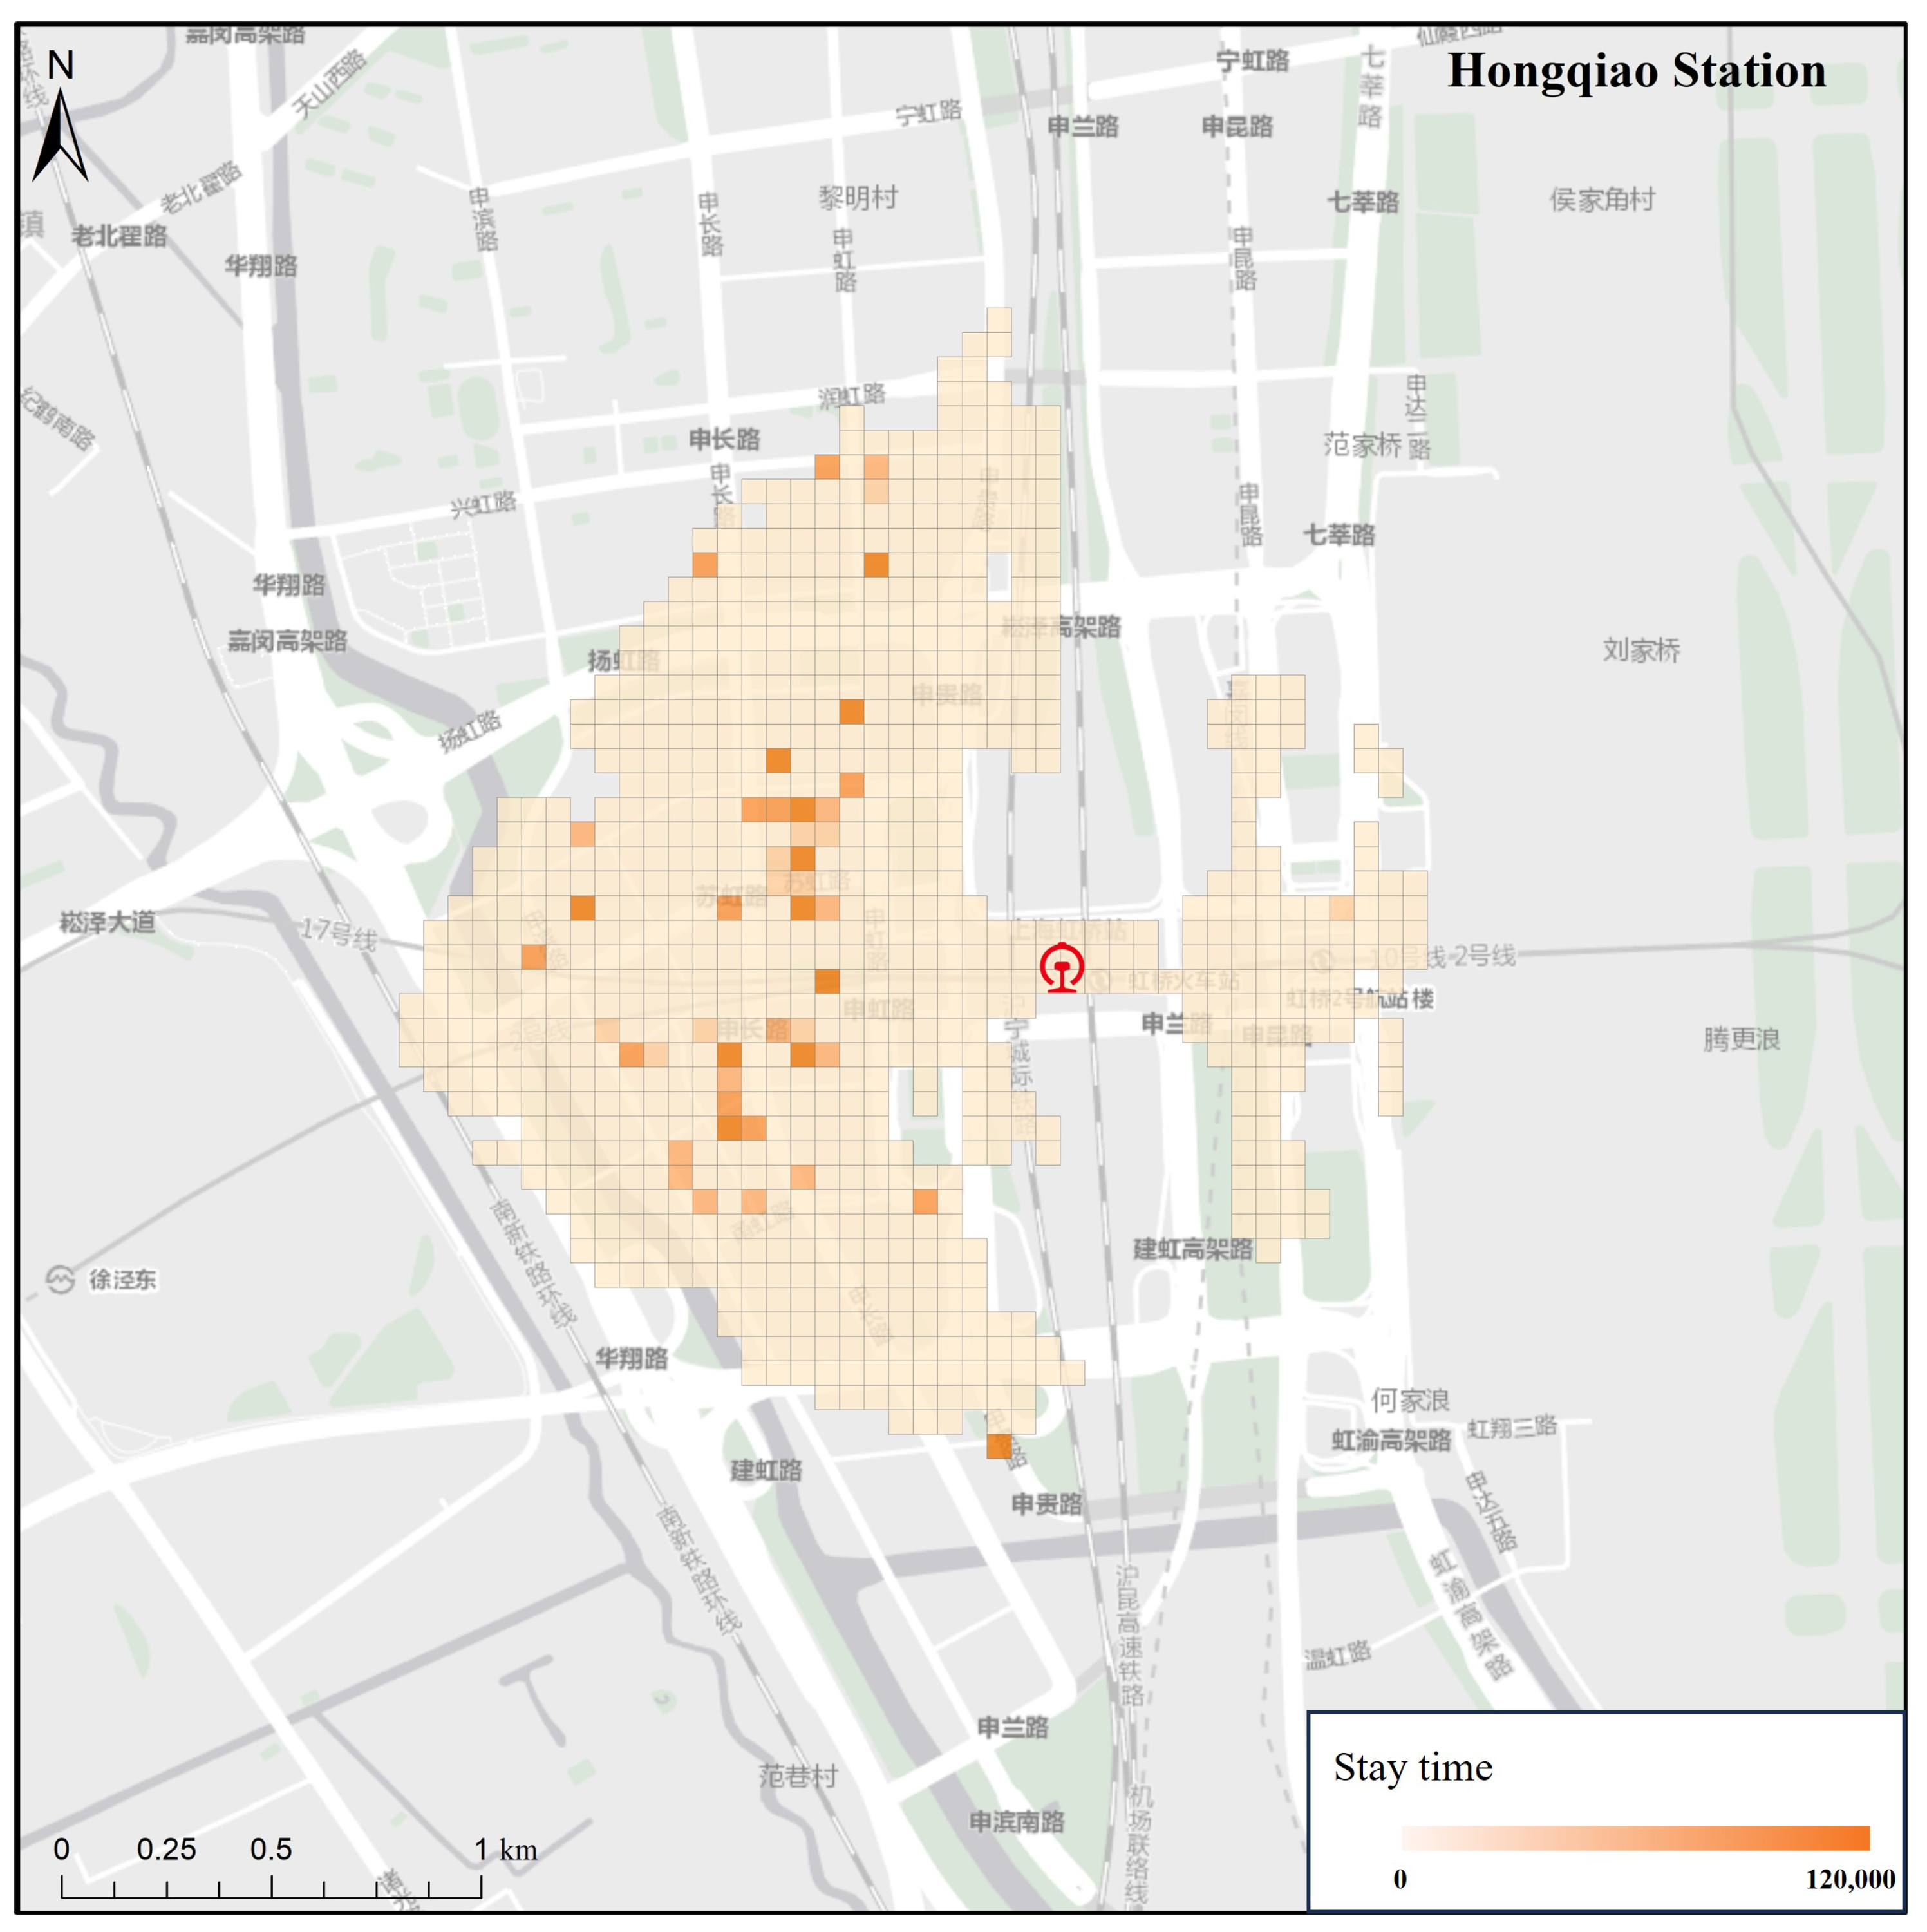
3.1. Study Area

This study focuses on the buffer areas of Shanghai Hongqiao station, which is located in the Minhang District of Shanghai. Hongqiao station is a comprehensive air–railway transport hub. The high-speed railway (HSR) passenger station is located on the west side of the Hongqiao hub, encompassing high-speed railways, express passenger corridors, subways, magnetic levitation, and other railway transit lines.
According to existing studies, the areas within a 20 min walking distance from the HSR station are determined as the HSR station areas. The conventional method is to estimate the walking duration based on the Manhattan distance and walking speed. However, it is inaccurate to estimate walking duration based on the Manhattan distance due to the complex natural terrain, as shown in Figure 1. This study uses route planning for walking of the web mapping API to estimate the walking duration from Hongqiao station based on grid division. The walking duration of each grid from Hongqiao station can be approximated by that of its central point. In this study, grids with a size of 50 m × 50 m are applied for division. The walking accessibility of each grid center point from Hongqiao station will be measured using route planning for walking, and the grids within a 20 min walking distance are determined as the study area, as shown in Figure 2.

3.2. Data Description

In this study, the data consist of GPS data and point-of-interest (POI) data, and the GPS data were collected on 11 October 2022 (Tuesday), 12 October 2022 (Wednesday), and 13 October 2022 (Thursday).

3.2.1. GPS Data

The GPS data were collected by mobile devices, which record users’ trajectories. The GPS data include fields such as the identification number of the user, the coordinates of the stay point, the start time of the stay point, the end time of the stay point, and the duration of the stay point, as shown in Table 1.
In this study, the GPS data were utilized to analyze activity–travel patterns. We recognize that such data have the potential to identify individual passengers, thus raising privacy concerns. To address these issues, we implemented several measures to ensure the ethical use of the data and to protect the privacy of individuals: (1) All personal identifiers were removed from the data before analysis. The GPS data were anonymized and aggregated to prevent the identification of individual passengers. (2) We collected only the data necessary for the purposes of this study. Unnecessary details that could lead to the identification of individuals were not included in our datasets. (3) The original data are stored in secure servers with restricted access.

3.2.2. Point-of-Interest Data

A point-of-interest (POI) is a spatial feature object with geographic identification, containing information such as the name, category, latitude, and longitude. This type of data is fundamental for identifying land use. Each POI on an e-map represents a location, such as a building, a residential district, a park, a school, a hospital, a company, a shopping mall, and more. e-maps contain vast amounts of POI data collected through field surveys by Internet e-map operators. These data are accurate, rich, and updated in a timely manner, reflecting people’s daily lives. The POI data included fields such as the identification number of the POI, the POI name, the category of the POI, the subcategory of the POI, and the coordinates of the POI, as shown in Table 2.

4. Method

This section describes the research methodology, including the identification of the HSR passengers, variables, and model approach. The modeling framework of this study is shown in Figure 3. First, in the data preprocessing stage, the GPS data were utilized to identify high-speed rail (HSR) passengers and calculate their stay time. Point-of-interest (POI) data and route planning data were used to quantify the walking accessibility and built environment characteristics. Second, in the model construction stage, an XGBoost model was built through model training, parameter tuning, and model validation. Finally, at the model interpretation stage, several interpretation methods including relative importance and partial dependence plots (PDPs) were applied to explore the detailed effects of walking accessibility and the built environment on the stay time of HSR passengers.

4.1. Identification of HSR Passengers

Identifying HSR passengers based on GPS data can be achieved through various methods. One approach involves analyzing the movement patterns and speeds of individuals. High-speed trains typically travel between specific stations. Therefore, when passengers move between these stations within a short period, they can be inferred as high-speed railway passengers. Additionally, high-speed trains travel at relatively fast speeds compared to other modes of transportation. This characteristic can further confirm their identity. We followed these steps specifically to conduct the identification of HSR passengers:
  • The GPS data were cleaned and preprocessed, which included removing duplicates, handling missing values, and converting timestamps to a usable format.
  • The GPS tracks were divided into segments based on time and space to analyze the passenger’s journey. Then, the average speed of the passengers was calculated based on the time and distance of each segment. Speeds above a certain threshold will be identified as high-speed railway speeds.
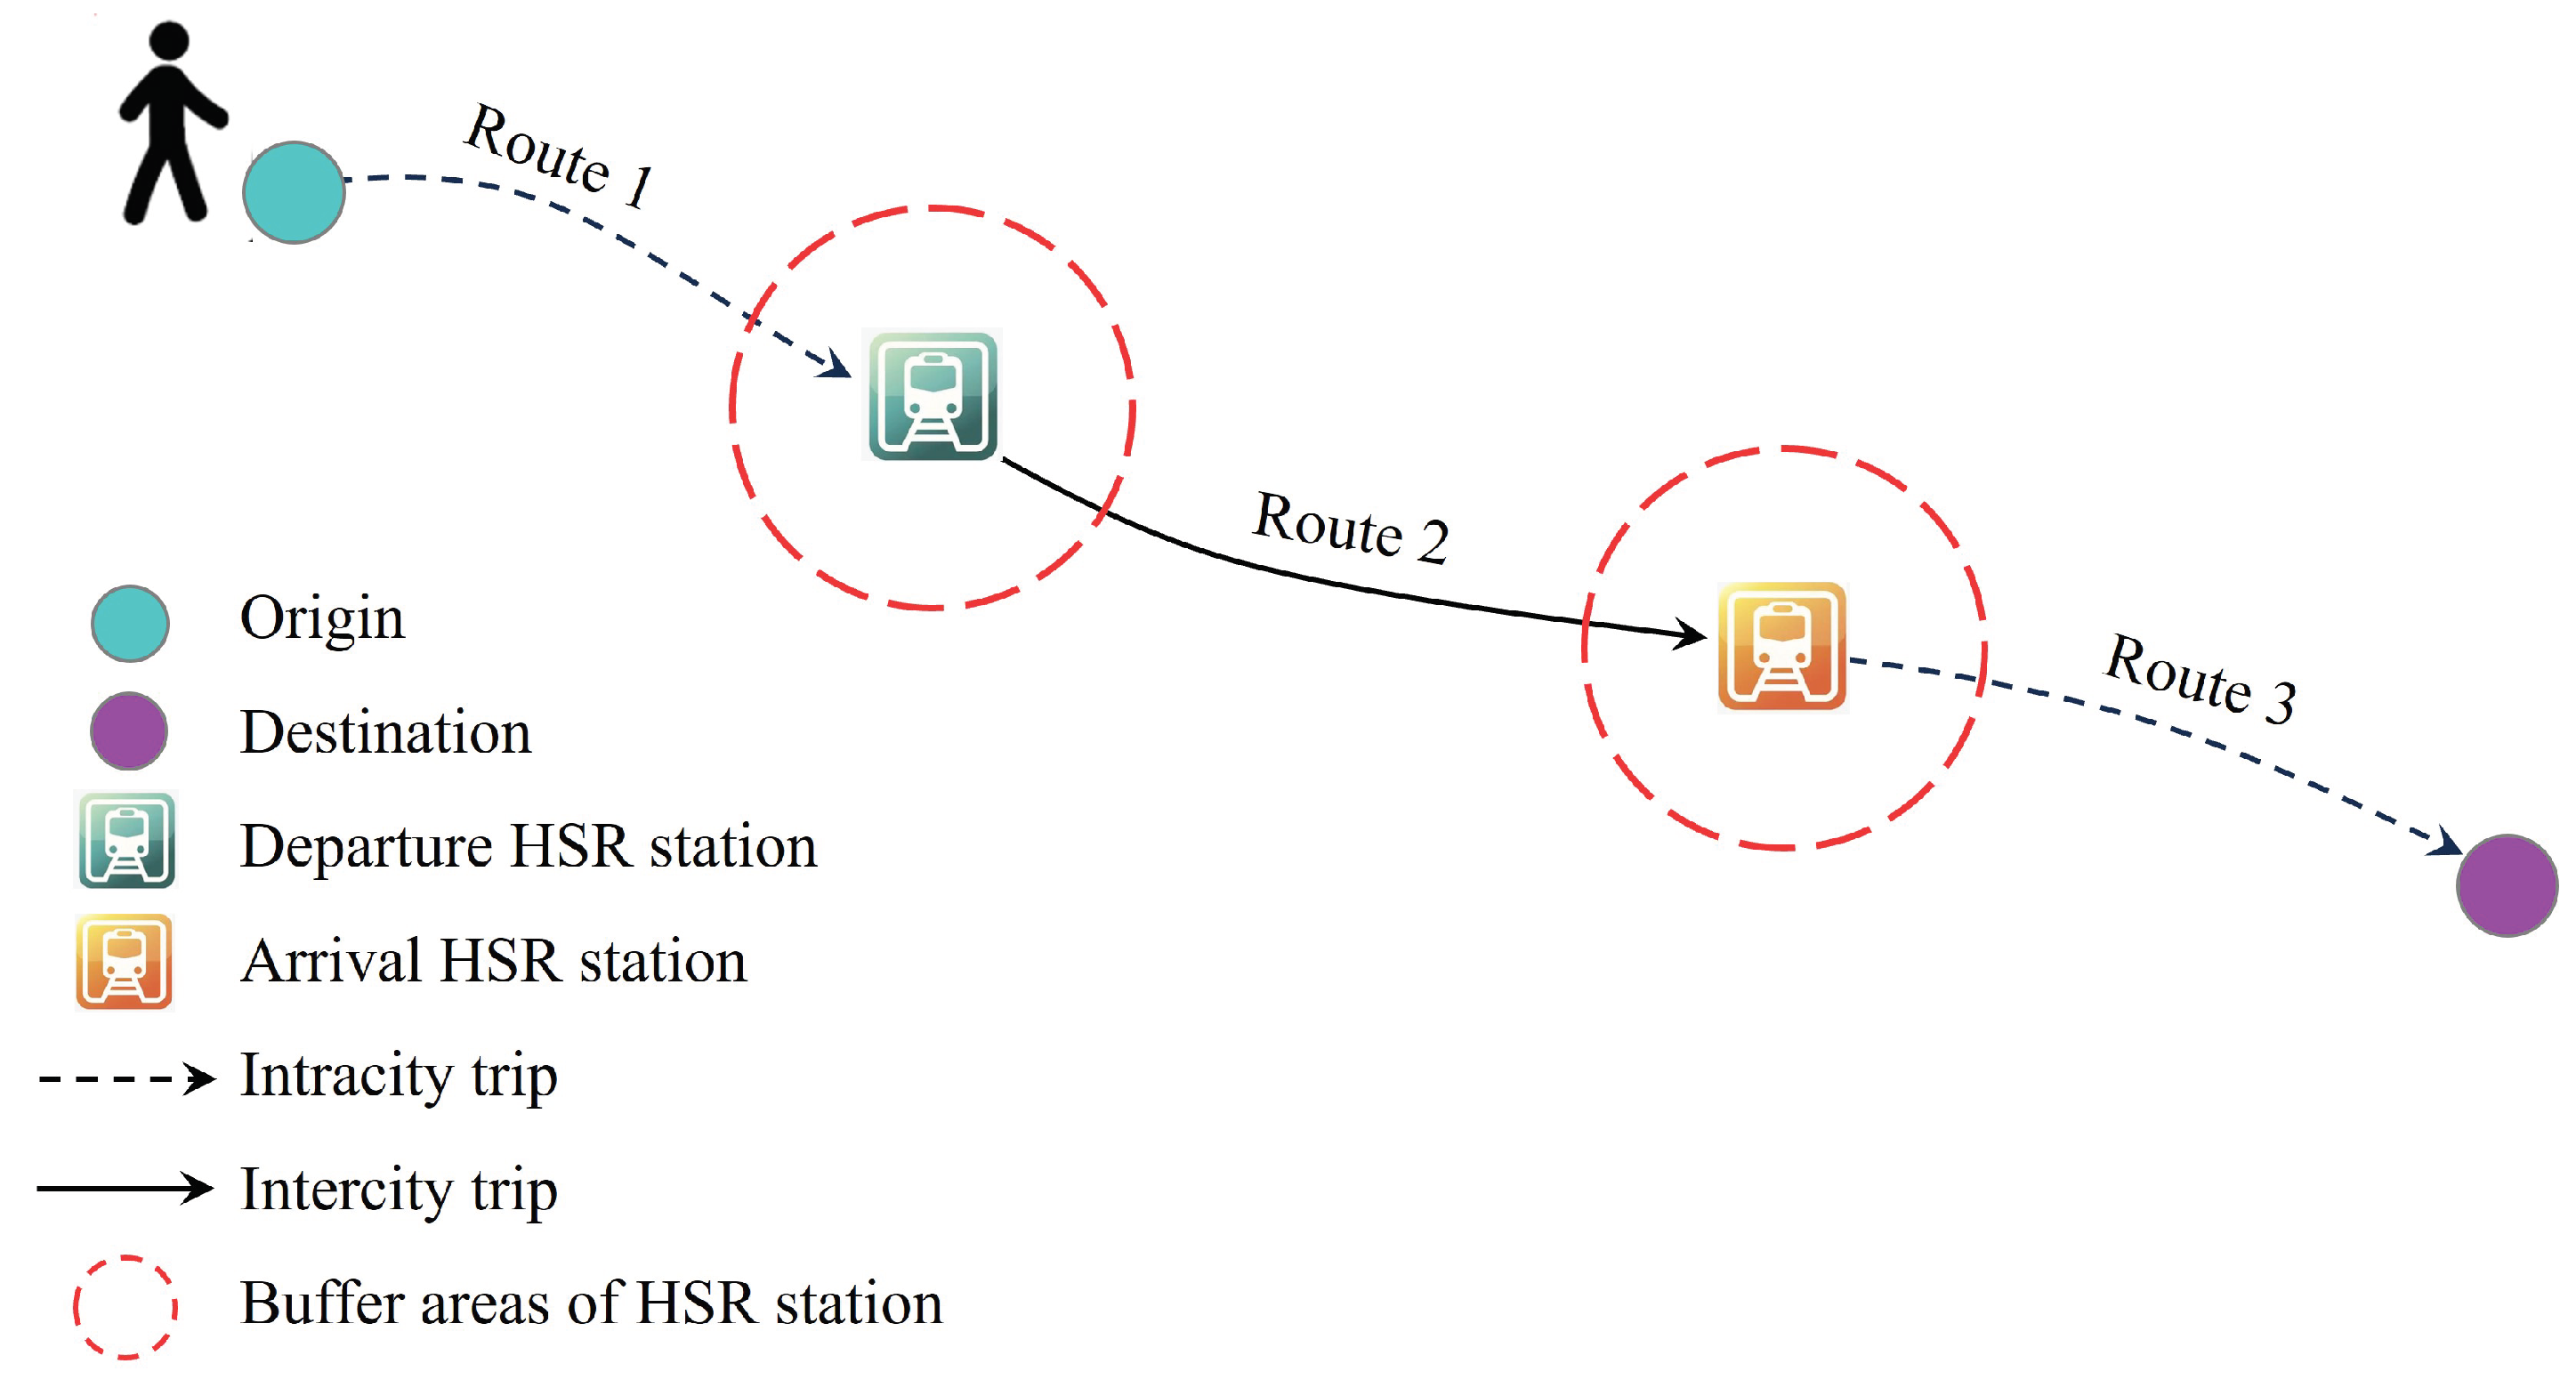
  • Station identification was achieved by comparing the passenger’s passing point with the HSR station. The daily trips of HSR passengers shall include intracity trips from the origin to the departure HSR station, intercity trips from the departure HSR station to the arrival HSR station, and intracity trips from the arrival HSR station to the destination, as shown in Figure 4.
  • Result verification was also required. Additional information, such as the ticket purchase record, will be used to confirm the passenger’s identity.
To uncover the activity pattern of HSR passengers in the station buffer areas, the temporal distribution of the trip volume is presented in Figure 5. It illustrates that the trip volume reaches its peak during the hours of 11 a.m. to 1 p.m. and 3 p.m. to 6 p.m. The temporal distribution of the trip volume in the station buffer areas may be related to the schedule of high-speed railway trains, typical of an HSR station.

4.2. Definition and Quantification of Variables

4.2.1. Definition and Quantification of Street Vitality

Existing studies have concluded that HSR stations have an impact on the development of neighboring areas. Due to the establishment of HSR stations, the efficiency of the HSR station areas is enhanced, gathering various functions such as business, culture, sports, entertainment, and residence. Therefore, the neighboring areas of HSR stations attract a large amount of activity, especially from HSR passengers. The stay time of HSR passengers in the station buffer areas reflects the street vitality of these areas. In this study, we used grid division to calculate the sum of HSR passengers’ stay time, which represents the street vitality. The grid division aligns with that of the walking duration measurement, with a size of 50 m × 50 m .
Figure 6 shows the spatial distribution of HSR passengers’ stay time in the station buffer areas. There is a higher concentration of HSR passengers staying at the Longhutianjie shopping mall, Hongqiaotiandi shopping mall, Libaoleyuan shopping mall, and some office buildings.

4.2.2. Quantification of Built Environment Characteristics

The built environment characteristics were obtained and measured using POI data in ArcGIS 10.7. The POI data provide more comprehensive information for spatial analysis in an urban space compared to land use data, making them a valuable resource for urban geographic analysis. Considering the research topic of this study, we used the following POI categories: commercial facility, financial facility, government agency, medical facility, life service facility, entertainment facility, residence, restaurant, shopping service facility, sports hall, and facility of science, education, and culture. Different categories of the POI may have varying impacts on the stay time. For instance, an office building may have a stronger impact than a convenience shop.
In this study, we assessed the POI density for each category of the study unit by considering the number of POIs in both the grid itself (study unit) and its neighboring grids, as shown in Figure 7. This approach accounts for the spatial influence scope of built environment characteristics on human activities. Table 3 presents the distributions of the variables utilized in the analysis.

4.3. Modeling Approach

In this study, the extreme gradient boosting (XGBoost) regression trees model is applied to investigate the synergistic effects of walking accessibility and the built environment on the vitality of the HSR station buffer areas. By employing the XGBoost model, we aim to achieve high predictive accuracy and uncover significant patterns within our data, thereby contributing valuable insights to the land use and development of high-speed railway station areas.
The advantages of the XGBoost algorithm are as follows [68,69,70,71]: (1) XGBoost has a strong track record of producing high-quality results in various machine learning tasks. (2) XGBoost is designed for efficient and scalable training of machine learning models, making it suitable for large datasets. (3) XGBoost has a wide range of hyperparameters that can be adjusted to optimize performance, making it highly customizable. (4) XGBoost has built-in support for handling missing values, making it easy to work with real-world data, which often have missing values. (5) XGBoost provides relative importance and partial dependence plots (PDPs), allowing for a better understanding [72,73]. PDPs offer an advantage over relative importance indicators by addressing the issue of failing to reflect the positivity and negativity of the association between variables.
The XGBoost model is based on the following objective function, which combines a loss function L and a regularization term Ω .
Obj ( Θ ) = i = 1 n L y i , y ^ i + k = 1 k Ω ( f k )
where y i is the predicted value for the i-th instance, L is the loss function that measures the difference between the predicted and actual values, and Ω ( f k ) is the regularization term for the k-th tree, defined as:
Ω ( f ) = γ T + 1 2 λ j = 1 T w j 2
where T is the number of leaves in the tree, w j is the weight of the j-th leaf, and γ and γ are regularization parameters that control the complexity of the model.
The XGBoost model employs gradient boosting to iteratively add trees to the model. At each iteration t, it adds a new tree f t x i to minimize the following objective function:
Obj t = i = 1 n L y i , y ^ i ( t 1 ) + f t x i + Ω f t
The new tree is constructed to fit the residuals of the previous predictions:
r i ( t ) = L y i y ^ i ( t 1 ) y ^ i ( t 1 )
To optimize the objective function, XGBoost model uses second-order Taylor expansion to approximate the loss function:
Obj t i = 1 n g i f t x i + 1 2 h i f t 2 x i + Ω f t
where g i and h i are the first- and second-order gradients of the loss function with respect to the prediction y ^ i ( t 1 ) :
g i = L y i , y ^ i ( t 1 ) y ^ i ( t 1 )
h i = 2 L y i , y ^ i ( t 1 ) ( y i ( t 1 ) ^ ) 2
The structure of each tree is determined by the splitting criteria, which are based on the gain from a potential split:
Gain = 1 2 G L 2 H L + λ + G R 2 H R + λ G L + G R 2 H L + H R + λ γ
where G L are G R the sums of the first-order gradients for the left and right child nodes, respectively, and H L and H R are the sums of the second-order gradients. The regularization parameters λ and γ control the complexity of the tree and prevent overfitting.

5. Result and Discussion

5.1. Model Validation

In the XGBoost model, there are several parameters that should be considered. To optimize the modeling result, it is necessary to explore the effect of different combinations of parameters on the model’s performance. The parameters that could be optimized include, but are not limited to the following:
  • N_estimators: the number of decision trees.
  • Learning rate: the step size shrinkage used in the update to prevent overfitting.
  • Max_depth: the maximum depth of a tree.
  • Subsample: a parameter that controls the proportion of random samples for each tree.
  • Colsample_bytree: a family of parameters for the subsampling of columns.
The grid search method was selected as the optimization method due to its wide usage and time efficiency in previous studies. The dataset was split into 80% training data and 20% testing data. The XGBoost model was then fit with various parameters, including N_estimators (ranging from 100 to 500), the Learning rate (ranging from 0.01 to 0.05), Max_depth (ranging from 5 to 10), Subsample (ranging from 0.5 to 1), and Colsample_bytree (ranging from 0.5 to 1). The number of stopping rounds was set to 50, which means the iteration stops after 50 rounds without performance improvement. The XGBoost package in Python was used for this study.
The mean absolute error (MAE) was used to evaluate the performance of the model. A smaller MAE value indicates better performance of the XGBoost model. The equation for calculating the MAE is provided below:
MAE = 1 m i = 1 n y i y ^ i ,
where
m = the total number of data.
y i = the actual stay time value in the test dataset of record i.
y ^ i = the predicted stay time value in the test dataset of record i.
Through the experiments, the best parameter combination was determined as follows: N_estimators = 500, Learning rate = 0.04, Max_depth = 5, Subsample = 0.7, Colsample_bytree = 1. The MAE value of the best-performing model was 8939.07, and the testing pseudo- R 2 (the square of the Pearson correlation coefficient between the predicted value and the real value) was 86.36%.

5.2. Relative Importance of Explanatory Variables

Table 4 shows the relative importance of the explanatory variables in predicting the stay time among HSR passengers for the XGBoost model. The relative importance indicates the increase in impurity relative to the average increase in impurity while permuting a given explanatory variable.
The results of the XGBoost model indicated that the density of entertainment facilities (45.11%) and of sports halls (38.50%) are the most significant explanatory variables, collectively accounting for 83.61% of the total explanatory power. It is probable that this is due to the fact that entertainment and sports activities tend to require more time. The partial dependence plots (Figure 8) indicate that the density of entertainment facilities and of sports halls have a positive effect on the stay time of HSR passengers. Furthermore, a threshold effect was observed, whereby the stay time of HSR passengers increased rapidly with the increase in the density of entertainment facilities and sports halls, within the range of 0 to 30 pcs / km 2 for both types. By contrast, the stay time of HSR passengers increased at a slower rate outside of this range.
The results also indicated that the facility density of science, education, and culture accounted for 8.62% of the relative importance. A threshold effect was observed whereby the stay time of HSR passengers increased rapidly with the increase in the facility density of science, education, and culture, within the range of 65 to 250 pcs / km 2 . The stay time of HSR passengers will increase at a gradual rate within the range of 0 to 65 pcs / km 2 for the facility density of science, education, and culture.
Moreover, the density of life service facilities (2.09%), walking accessibility (1.96%), medical facilities (1.94%), and shopping service facilities (1.10%) were also important factors in the model. According to the partial dependence plots, walking accessibility had a positive effect on the stay time of HSR passengers. When the walking duration from the HSR station was within the range of 0 to 7 min, the stay time of HSR passengers would remain high, indicating that the street vitality within a 7 min walking distance was the highest. When the walking duration from the HSR station was within the range of 7 to 10 min, the stay time of HSR passengers would decrease rapidly with the increase in walking duration. When the walking duration from the HSR station was over 10 min, the stay time of HSR passengers would tend to stabilize at a low level, indicating that the street vitality outside of a 10 min walking distance will decline significantly.
With regard to the density of commercial facilities (0.22%), restaurants (0.20%), residences (0.16%), financial facilities (0.08%), and government agencies (0.02%), no obvious relative importance was observed.

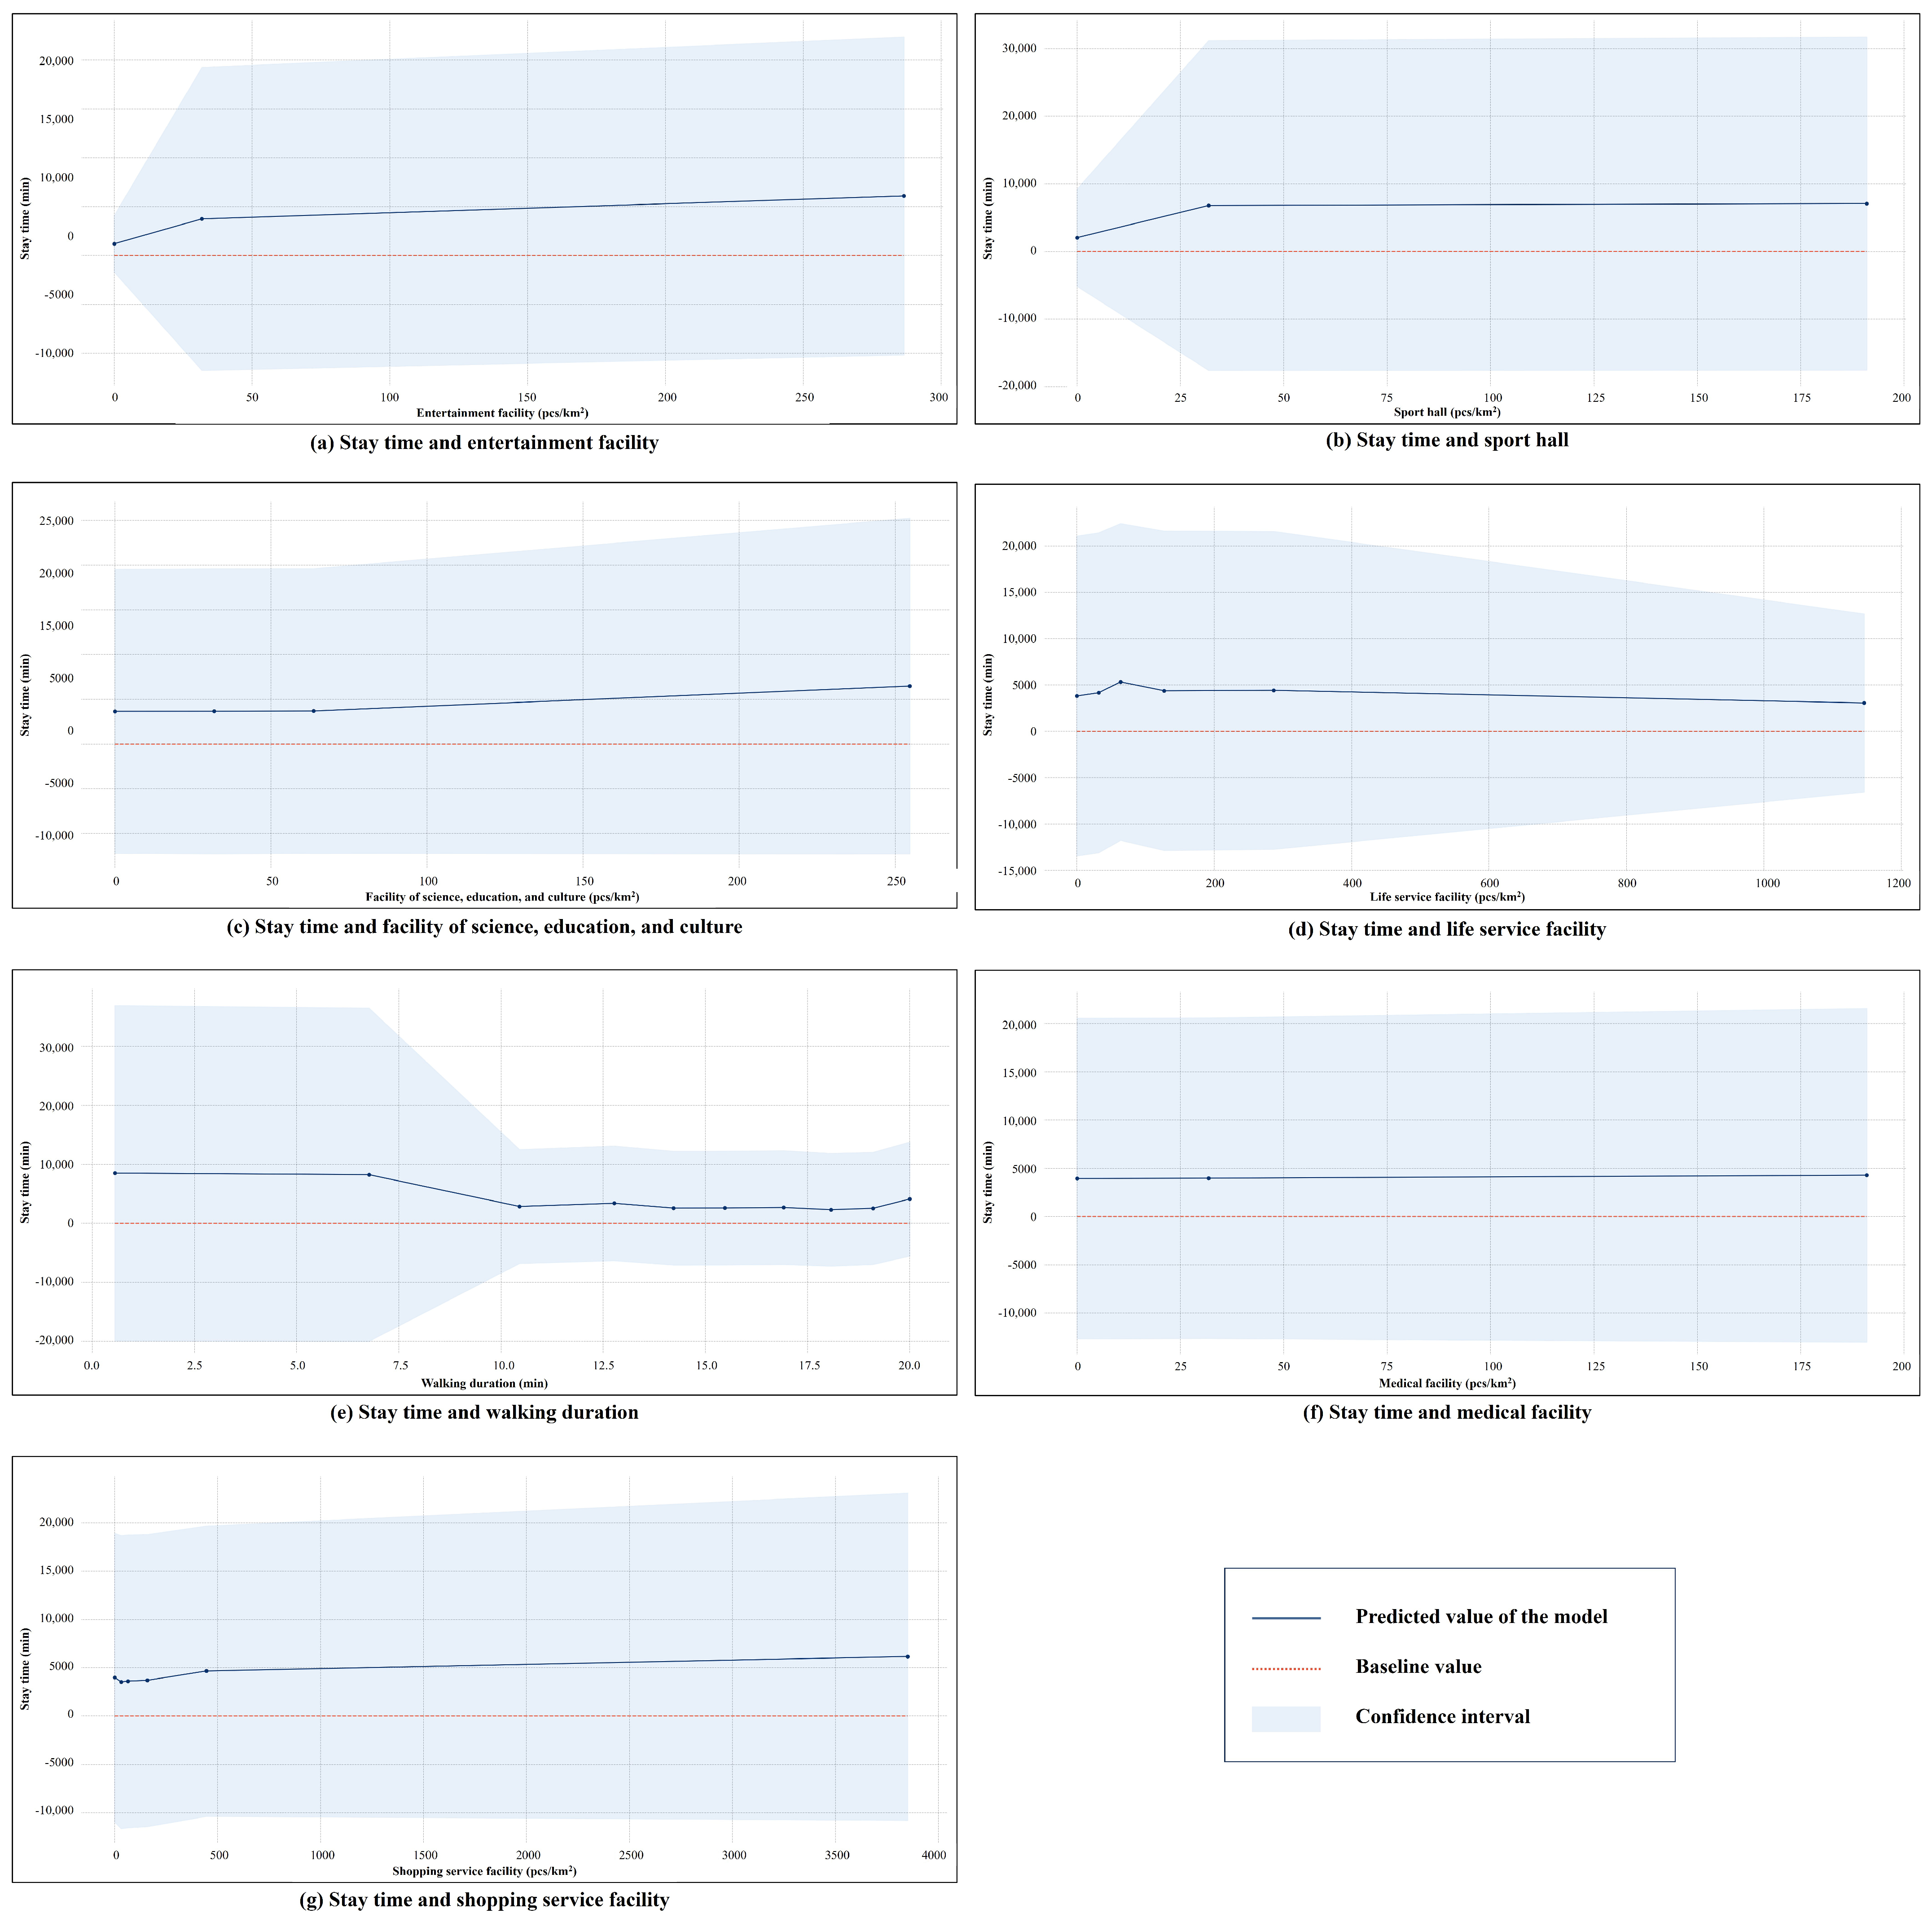
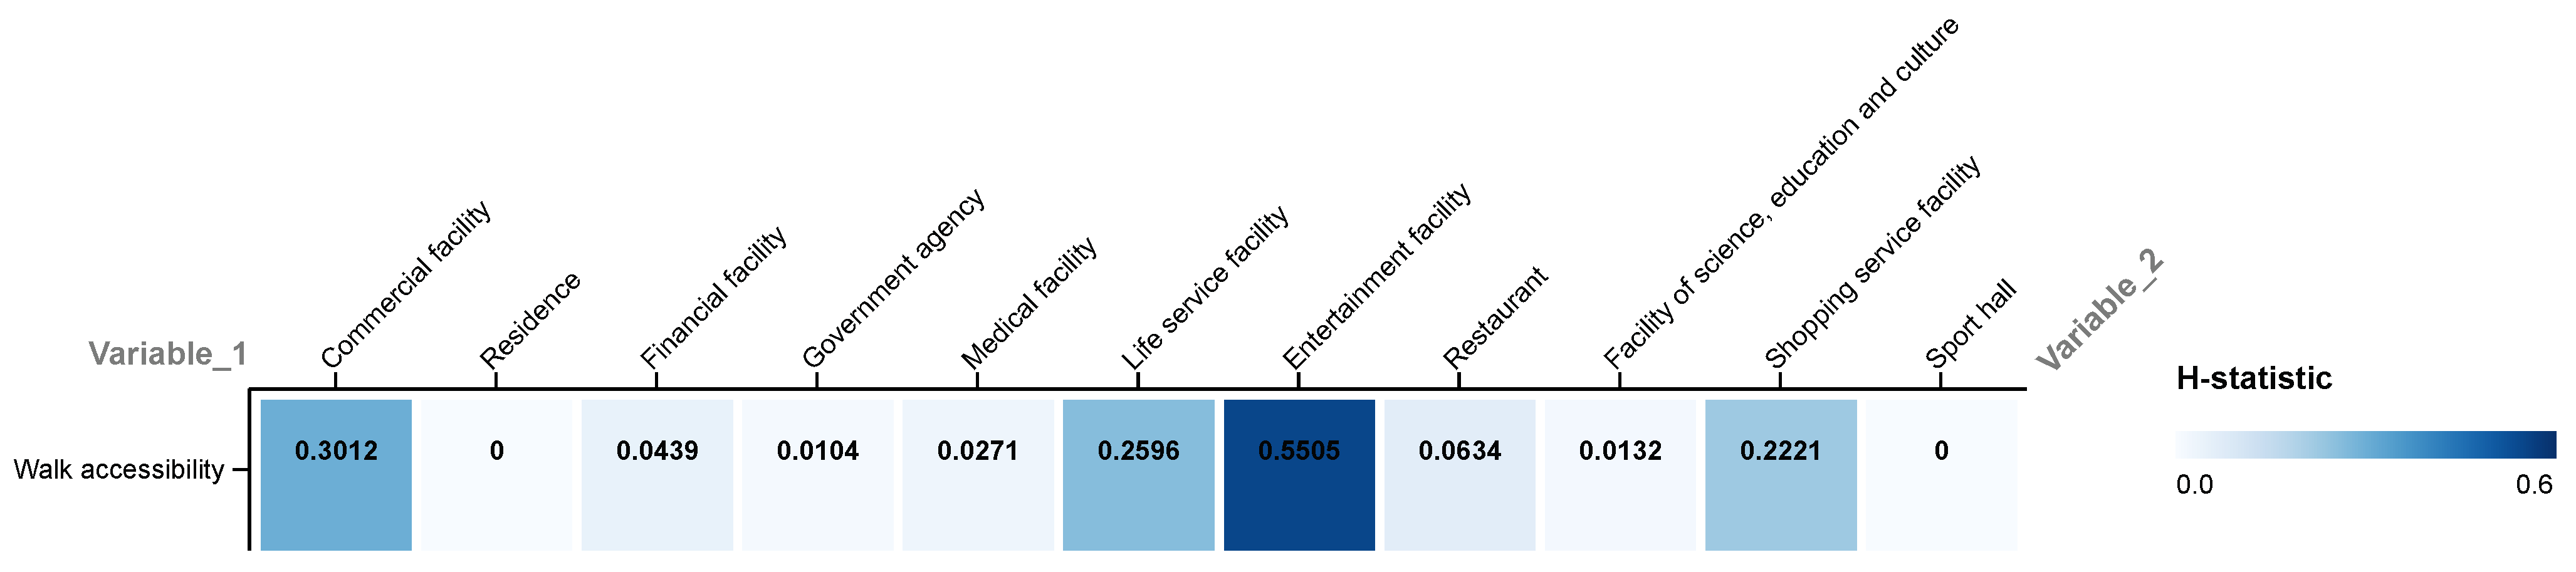
5.3. Synergistic Effects of Explanatory Variables on Street Vitality

In addition to examining the nonlinear associations of the explanatory variables with the stay time of HSR passengers, we further investigated the synergistic effects among the explanatory variables using the strengths of the XGBoost model [60,74]. Specifically, we introduced the H-statistic, a dimensionless measurement ranging from 0 to 1, to estimate the degree of variation in predictions depending on the interactions of different features [75]. Generally, a larger H-statistic indicates a stronger synergy, while an H-statistic of zero suggests no synergistic effects are present. In this study, we measured the two-variable H-statistic to explore the synergistic effects of the explanatory variables on the stay time of HSR passengers.

5.3.1. Walking Accessibility and Built Environment Characteristics

A strong synergistic effect (H-statistic = 0.3012) was observed between walking accessibility and commercial facility density (Figure 9). The partial dependence plot is shown in Figure 10a: when the walking duration ranged from 0 to 10 min, both factors had strong positive effects on the stay time of HSR passengers; when the walking duration ranged from 10 to 20 min, only commercial facility density had a strong positive effect on the stay time of HSR passengers. The results illustrate that the impact of commercial facilities on the stay time of HSR passengers was relatively large with a walking duration of less than 10 min and remained significant with a walking duration over 10 min. This indicates that the intensification of commercial facility density in areas with a walking duration ranging from 10 to 20 min continued to enhance the street vitality of the HSR station areas. Analogously, walking accessibility and shopping service facility density could also generate synergistic effects (H-statistic = 0.2221), as shown in Figure 10d. When the walking duration ranged from 0 to 10 min, only walking accessibility would have strong positive effects on the stay time of HSR passengers; when the walking duration ranged from 10 to 20 min, only shopping service facility density would have a strong positive effect on the stay time of HSR passengers.
By contrast, walking accessibility and life service facility density could also generate synergistic effects (H-statistic = 0.2596), with a positive effect on the stay time of HSR passengers when the walking duration ranged from 0 to 10 min (Figure 10b). The stay time of HSR passengers would not be influenced by life service facility density when it ranged from 0 to 200 pcs / km 2 . This indicates that the intensification of life service facility density will not enhance the street vitality of the HSR station areas. Additionally, there was a very strong synergistic effect (H-statistic = 0.5505) between walking accessibility and entertainment facility density, with the partial dependence plot shown in Figure 10c. When the walking duration ranged from 0 to 10 min, the stay time of HSR passengers would be influenced positively by entertainment facility density, while the stay time of HSR passengers would be influenced indistinctly by entertainment facility density. This indicates that the intensification of commercial facility density in areas with a walking duration of less than 10 min would be more conducive to enhancing the street vitality of the HSR station areas.

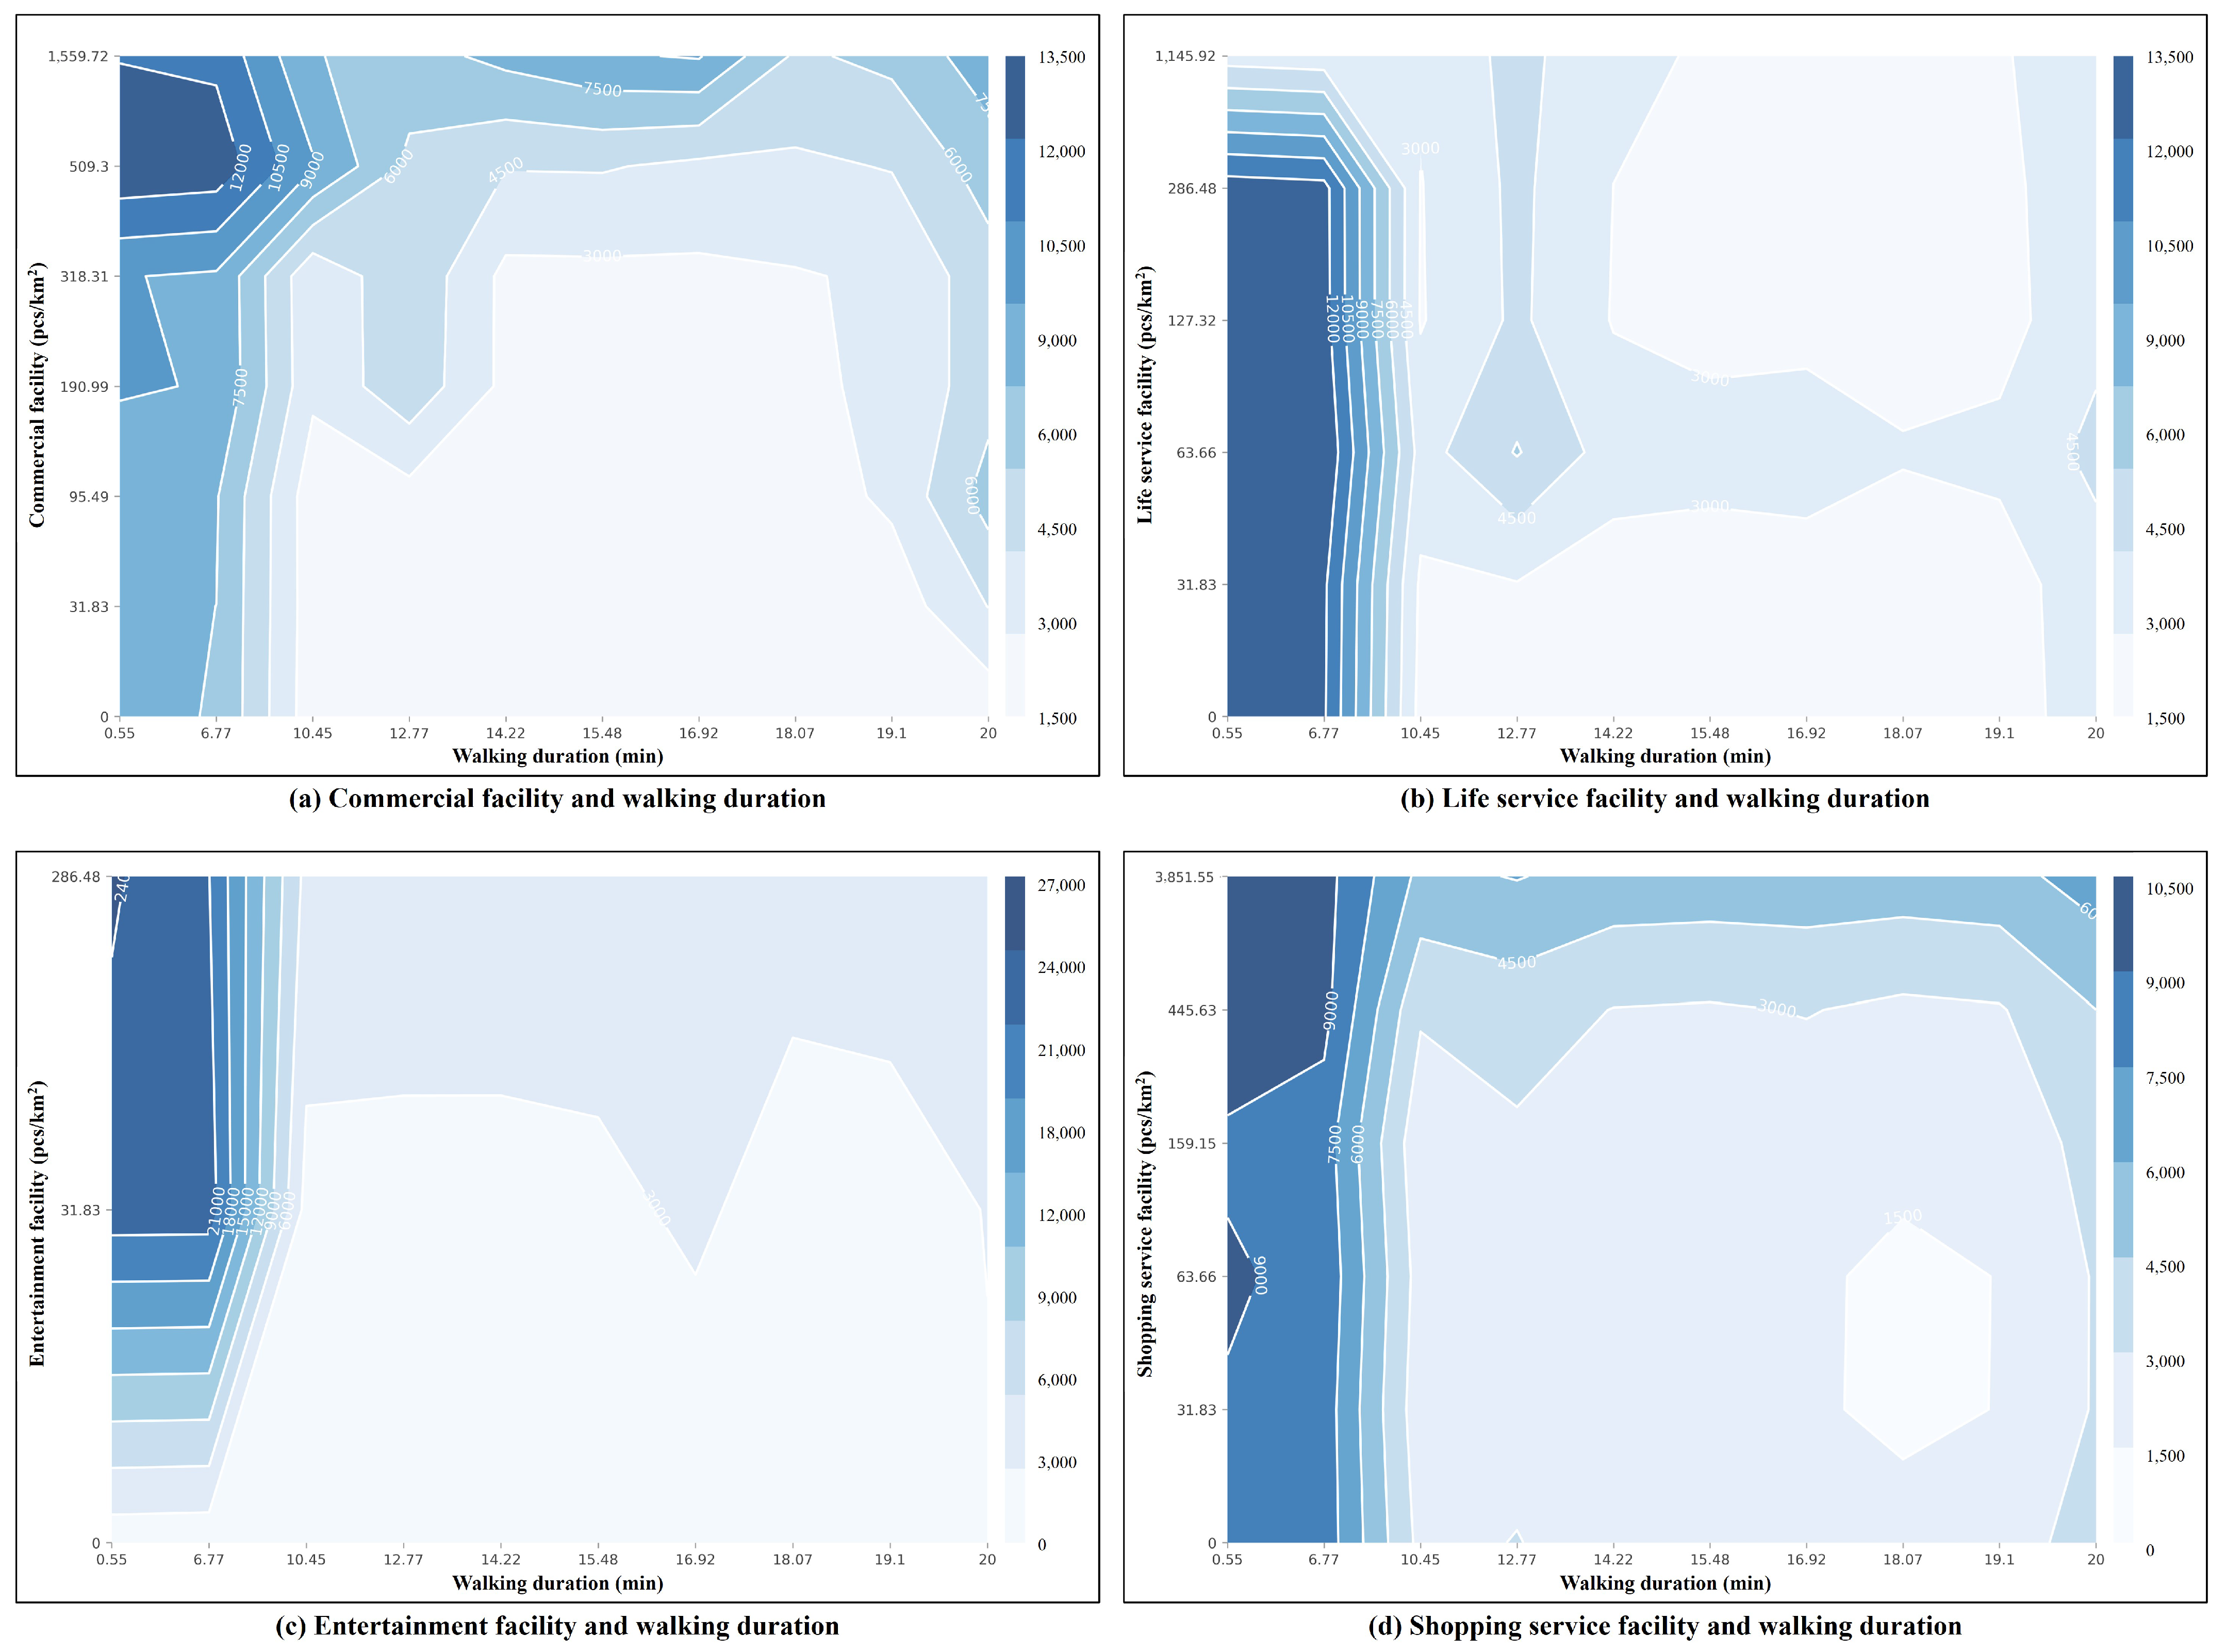
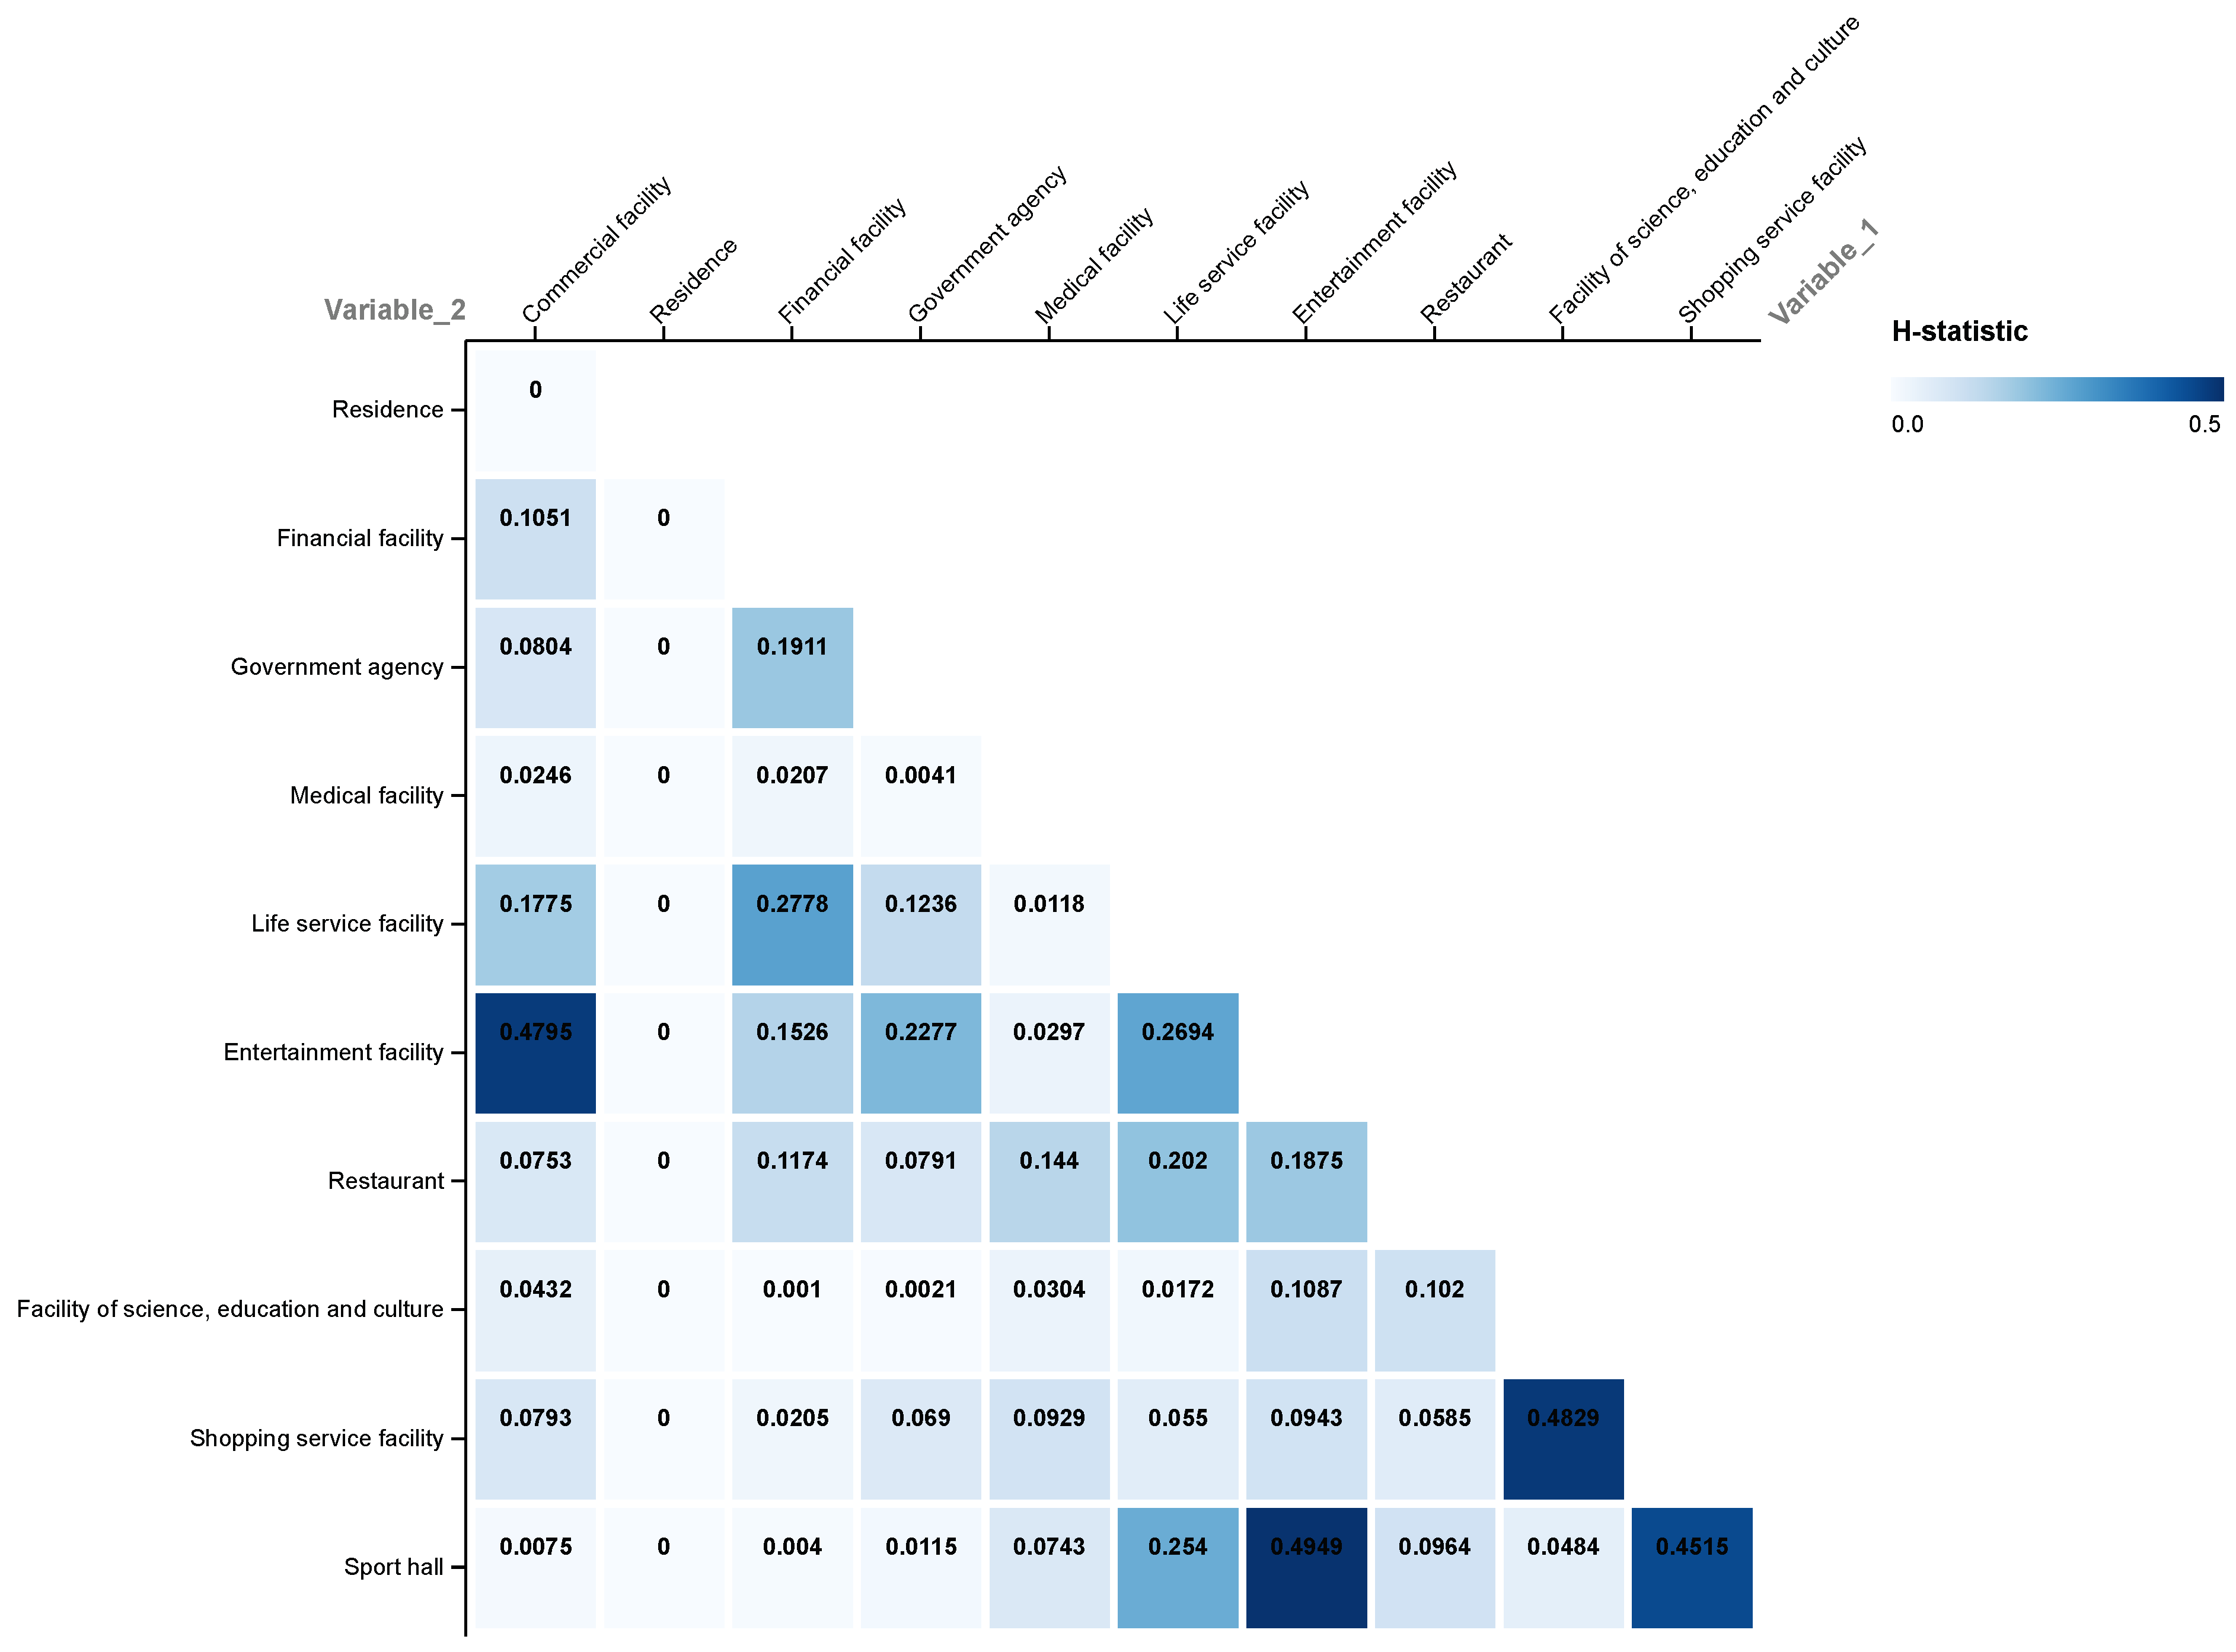
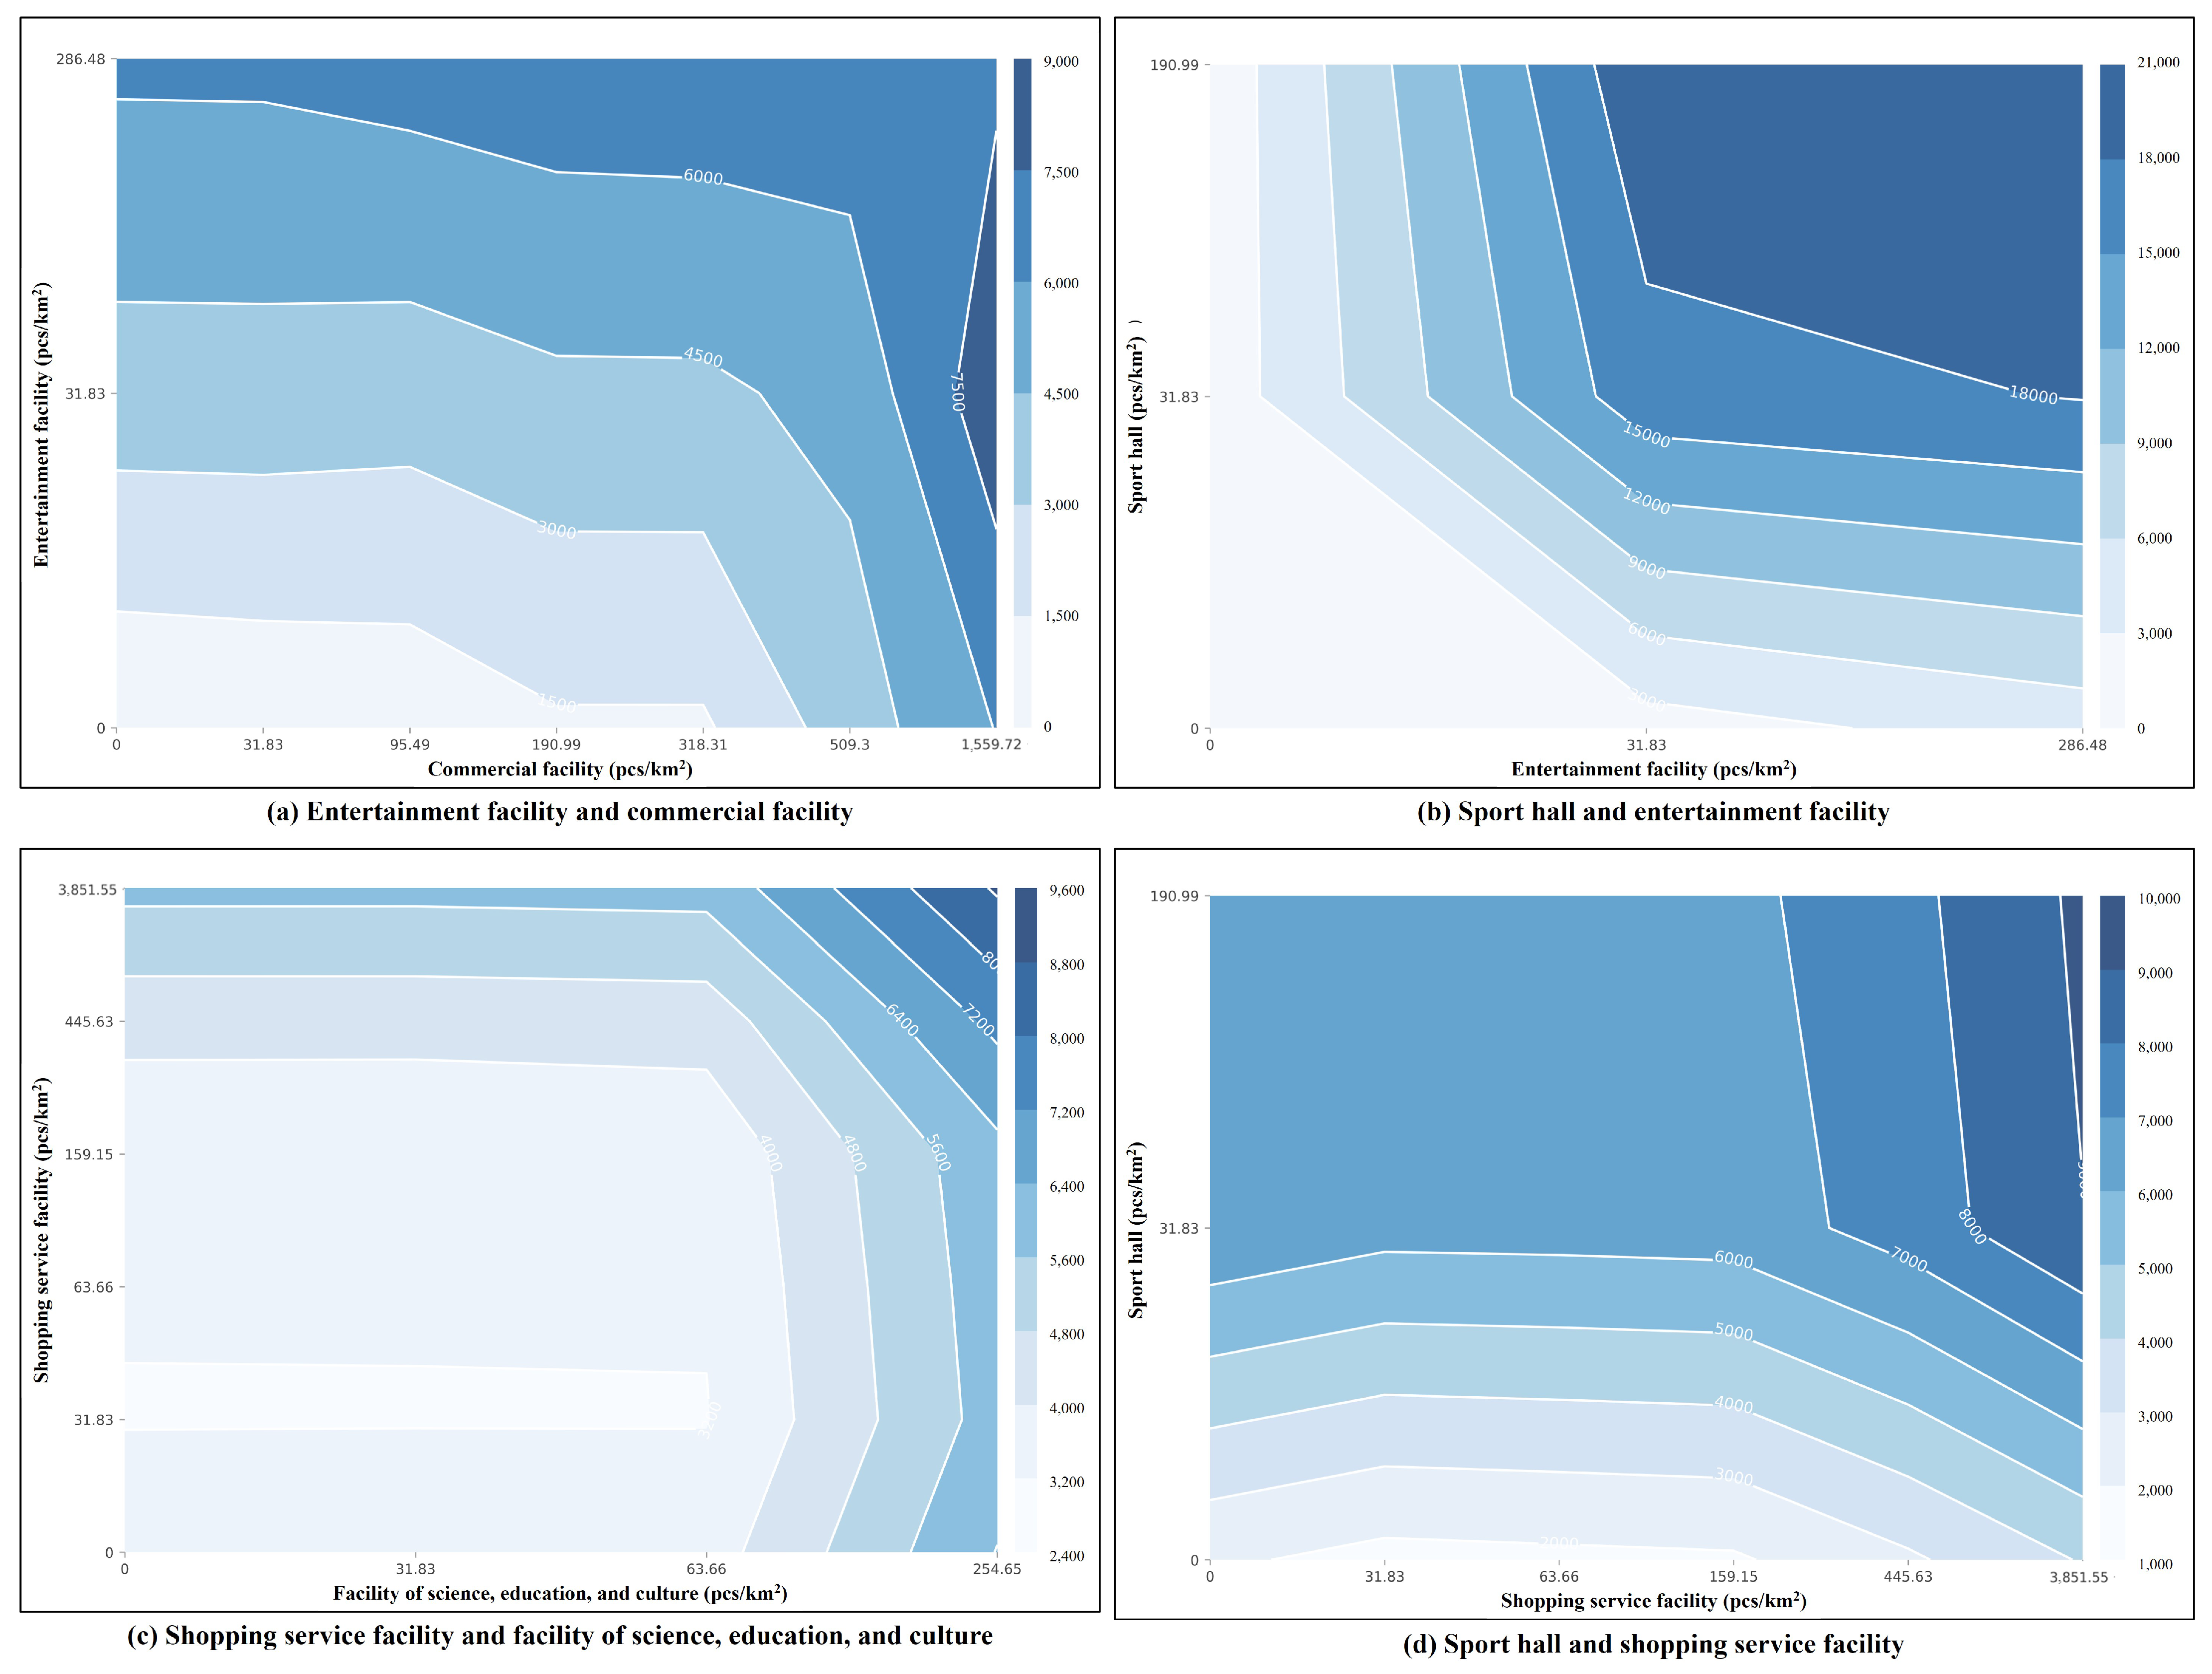
5.3.2. Two-Variable Built Environment Characteristics

The H-statistic for two built environment characteristics is presented in Figure 11. The results indicate a strong synergistic effect (H-statistic = 0.4795) between commercial and entertainment facility densities on the stay time of HSR passengers. Figure 12a shows that the stay time of HSR passengers would be significantly influenced by increasing commercial facility density when the entertainment facility density ranged from 0 to 300 pcs / km 2 , and it would be significantly influenced by increasing entertainment facility density when it ranged over 90 pcs / km 2 . This indicates that the collaborative construction of entertainment and commercial facilities is beneficial for enhancing the street vitality of the HSR station areas, especially when the entertainment facility reaches a sufficient scale.
The results also indicate a strong synergistic effect (H-statistic = 0.4949) between entertainment facility and sports hall densities on the stay time of HSR passengers. Figure 12b shows that entertainment facility and sports hall densities would have a strong synergistic effect on the stay time of HSR passengers. This indicates that the collaborative construction of entertainment facilities and sports halls is beneficial for enhancing the street vitality of the HSR station areas.
Moreover, there was a strong synergistic effect (H-statistic = 0.4829) between the facility density of science, education, and culture and shopping service density on the stay time of HSR passengers. Figure 12c shows that the facility density of science, education, and culture had a positive effect on the stay time of HSR passengers when it ranged over 60 pcs / km 2 , and shopping service density had a positive effect on the stay time of HSR passengers when it ranged over 30 pcs / km 2 . This indicates that the synergistic development of the facility density of science, education, and culture and shopping service density was beneficial for enhancing the street vitality of HSR station areas, especially when both of them reached sufficient scales.
Also, there was a strong synergistic effect (H-statistic = 0.4515) between shopping service facility and sports hall densities on the stay time of HSR passengers. Figure 12d shows that the stay time of HSR passengers was influenced positively by sports hall density when it ranged from 0 to 30 pcs / km 2 , and the stay time of HSR passengers was influenced positively by shopping service facility density when sports hall density ranged over 30 pcs / km 2 . This indicates that the synergistic development of shopping service facilities and sport halls was beneficial for enhancing the street vitality of HSR station areas, especially when shopping service reached a sufficient scale.

6. Conclusions

The study explores the applicability of the extreme gradient boosting (XGBoost) model to characterize the synergistic effect of walking accessibility and the built environment on street vitality in high-speed railway station (HSR) buffer areas. The results showed that the XGBoost model can not only explore the feature importance of the main influencing factors on street vitality, but also characterize the nonlinear synergistic effects of walking accessibility and the built environment on street vitality.
This study first determines the study area based on grid division and the measurement of walking duration, laying an aggregative foundation for quantifying the stay time of HSR passengers and the built environment characteristics. Secondly, HSR passengers were identified based on the movement patterns and speeds of individuals. Moreover, street vitality in the HSR station buffer areas was defined as the stay time of HSR passengers based on grid division, and the built environment characteristics were quantified using the density of points of interest (POIs). Third, the extreme gradient boosting (XGBoost) model was used to address the regression problem. Walking duration and the built environment characteristics were found to have synergistic effects on the stay time of HSR passengers. Among these, entertainment facility density and sports hall density were identified as the most significant contributors, followed by the facility density of science, education, and culture, life service facility density, walking accessibility, medical facility density, and other factors.
Nonlinear associations between walking accessibility and street vitality were revealed through partial dependence plots. The results showed that HSR passengers were more willing to stay in areas within a 7 min walking duration from the HSR station, and the street vitality decreased rapidly with walking duration exceeding 10 min. Also, nonlinear associations between the built environment and street vitality were revealed. For example, entertainment density and sport hall density had threshold effects on the street vitality of HSR station areas. The findings provide optimal empirical values of built environment characteristics for policy-making aimed at promoting street vitality in HSR station areas.
This study also highlights the synergistic effect of walking accessibility and built environment characteristics on street vitality in HSR station areas. The findings suggest implementing a circular layout for the built environment in the HSR station areas. This involves expanding commercial and entertainment facilities in the core area within a 10 min walking distance from the HSR station, while introducing development plans for the outer areas beyond the 10 min walking distance to enhance shopping facilities. Additionally, the synergistic effects of two-variable built environment characteristics on street vitality were examined. The findings suggest that the coherence and consistency in establishing certain functions will further attract HSR passengers.
It should be acknowledged that this study will inevitably involve several limitations. First, this study mainly investigated the influence of walking accessibility and built environment characteristics on street vitality in HSR station areas, without considering socio-economic characteristics [76]. Incorporating such factors into the model may yield more interesting results that deserve further research. Second, this study was conducted solely in Shanghai, China. Generalizing the aforementioned findings requires further empirical case studies in other heterogeneous cities following a similar technical approach. Finally, as a purely data-driven method, the XGBoost model used in this study may produce fluctuating outcomes for specific ranges of independent variables due to potential noise and data sparsity. Therefore, a large volume and high density of empirical evidence would enhance the credibility of our practical findings.

Author Contributions

Conceptualization, J.C. and J.Z.; methodology, J.C.; validation, J.C., L.H., J.Z. and D.L.; formal analysis, J.C.; investigation, J.C. and L.H.; writing—original draft preparation, J.C. and L.H.; writing—review and editing, L.H.; visualization, J.C. and L.H.; supervision, D.L.; project administration, J.C. All authors have read and agreed to the published version of the manuscript.

Funding

This research received no external funding.

Institutional Review Board Statement

Not applicable.

Informed Consent Statement

Informed consent was obtained from all subjects involved in the study.

Data Availability Statement

The web mapping API data were accessed on 24 April 2024 from https://lbs.amap.com/.

Conflicts of Interest

The authors declare no conflicts of interest.

References

  1. Tang, M.; Sun, H. China’s High-Speed Railway Development History. In High-Speed Rail: An Analysis of the Chinese Innovation System; World Scientific: Singapore, 2020; pp. 385–424. [Google Scholar]
  2. Xu, F. The Belt and Road: The Global Strategy of China High-Speed Railway; Springer: Berlin/Heidelberg, Germany, 2018. [Google Scholar]
  3. Diao, M.; Zhu, Y.; Zhu, J. Intra-city access to inter-city transport nodes: The implications of high-speed-rail station locations for the urban development of Chinese cities. Urban Stud. 2017, 54, 2249–2267. [Google Scholar] [CrossRef]
  4. Wu, R.; Li, Y.; Wang, S. Will the construction of high-speed rail accelerate urban land expansion? Evidences from Chinese cities. Land Use Policy 2022, 114, 105920. [Google Scholar] [CrossRef]
  5. Jażdżewska, I.; Kotlicka, J. Application of Cluster Analysis in Urban Morphology Research. The Example of Industrial Plots in Łódź (Poland). Folia Geogr. 2020, 62, 5–21. [Google Scholar]
  6. Wang, F.; Liu, Z.; Xue, P.; Dang, A. High-speed railway development and its impact on urban economy and population: A case study of nine provinces along the Yellow river, China. Sustain. Cities Soc. 2022, 87, 104172. [Google Scholar] [CrossRef]
  7. Yin, M.; Bertolini, L.; Duan, J. The effects of the high-speed railway on urban development: International experience and potential implications for China. Prog. Plan. 2015, 98, 1–52. [Google Scholar] [CrossRef]
  8. Kecskés, T.; Kozma, G. City centre residents’ opinion about inner quarter’s renewal—A central european case study. Folia Geogr. 2020, 62, 95. [Google Scholar]
  9. Kamruzzaman, M.; Baker, D.; Washington, S.; Turrell, G. Advance transit oriented development typology: Case study in Brisbane, Australia. J. Transp. Geogr. 2014, 34, 54–70. [Google Scholar] [CrossRef]
  10. Du, J.; van Wesemael, P.; Druta, O. Place quality in high-speed rail station areas. J. Transp. Land Use 2021, 14, 1165–1186. [Google Scholar] [CrossRef]
  11. Dai, G. Place-Making around High-Speed Railway Stations in China; Universiteit van Amsterdam: Amsterdam, The Netherlands, 2015. [Google Scholar]
  12. Liu, D.; Shi, Y. The influence mechanism of urban spatial structure on urban vitality based on geographic big data: A case study in downtown Shanghai. Buildings 2022, 12, 569. [Google Scholar] [CrossRef]
  13. Yue, W.; Chen, Y.; Zhang, Q.; Liu, Y. Spatial explicit assessment of urban vitality using multi-source data: A case of Shanghai, China. Sustainability 2019, 11, 638. [Google Scholar] [CrossRef]
  14. Wu, W.; Niu, X. Influence of built environment on urban vitality: Case study of Shanghai using mobile phone location data. J. Urban Plan. Dev. 2019, 145, 04019007. [Google Scholar] [CrossRef]
  15. Monzón, A.; Ortega, E.; López, E. Efficiency and spatial equity impacts of high-speed rail extensions in urban areas. Cities 2013, 30, 18–30. [Google Scholar] [CrossRef]
  16. Liang, Y.; Zhou, K.; Li, X.; Zhou, Z.; Sun, W.; Zeng, J. Effectiveness of high-speed railway on regional economic growth for less developed areas. J. Transp. Geogr. 2020, 82, 102621. [Google Scholar] [CrossRef]
  17. Yang, H.; Fu, M.; Wang, L.; Tang, F. Mixed land use evaluation and its impact on housing prices in beijing based on multi-source big data. Land 2021, 10, 1103. [Google Scholar] [CrossRef]
  18. de Dios Ortúzar, J.; Willumsen, L.G. Modelling Transport; John Wiley & Sons: Hoboken, NJ, USA, 2024. [Google Scholar]
  19. Axhausen, K.W.; Zimmermann, A.; Schönfelder, S.; Rindsfüser, G.; Haupt, T. Observing the rhythms of daily life: A six-week travel diary. Transportation 2002, 29, 95–124. [Google Scholar] [CrossRef]
  20. Stopher, P.R.; Greaves, S.P. Household travel surveys: Where are we going? Transp. Res. Part A Policy Pract. 2007, 41, 367–381. [Google Scholar] [CrossRef]
  21. Niu, Q.; Wang, Y.; Xia, Y.; Wu, H.; Tang, X. Detailed assessment of the spatial distribution of urban parks according to day and travel mode based on web mapping API: A case study of main parks in Wuhan. Int. J. Environ. Res. Public Health 2018, 15, 1725. [Google Scholar] [CrossRef]
  22. Sadoun, B.; Al-Bayari, O.; Al-Rawashdeh, S. The development of a web mapping system and its application. In Proceedings of the International Conference on e-Business, Seville, Spain, 18–21 July 2011; IEEE: Piscataway, NJ, USA, 2011; pp. 1–7. [Google Scholar]
  23. Yeow, L.W.; Low, R.; Tan, Y.X.; Cheah, L. Point-of-Interest (POI) data validation methods: An urban case study. ISPRS Int. J. Geo-Inf. 2021, 10, 735. [Google Scholar] [CrossRef]
  24. Peng, J.; Hu, Y.; Liang, C.; Wan, Q.; Dai, Q.; Yang, H. Understanding nonlinear and synergistic effects of the built environment on urban vibrancy in metro station areas. J. Eng. Appl. Sci. 2023, 70, 18. [Google Scholar] [CrossRef]
  25. Yang, J.; Su, P.; Cao, J. On the importance of Shenzhen metro transit to land development and threshold effect. Transp. Policy 2020, 99, 1–11. [Google Scholar] [CrossRef]
  26. Zou, Z.; Tang, Y. Evaluation of Sustainable Development Potential of High-Speed Railway Station Areas Based on “Node-Place-Industry” Model. ISPRS Int. J. Geo-Inf. 2023, 12, 349. [Google Scholar] [CrossRef]
  27. Gui, W.; Zhang, X.; Wang, A. Research on spatial planning evaluation of Beijing Shanghai high speed railway station based on node-place model. J. Intell. Fuzzy Syst. 2021, 40, 733–743. [Google Scholar] [CrossRef]
  28. Gong, L.; Liu, X.; Wu, L.; Liu, Y. Inferring trip purposes and uncovering travel patterns from taxi trajectory data. Cartogr. Geogr. Inf. Sci. 2016, 43, 103–114. [Google Scholar] [CrossRef]
  29. Yuan, J.; Zheng, Y.; Zhang, L.; Xie, X.; Sun, G. Where to find my next passenger. In Proceedings of the 13th International Conference on Ubiquitous Computing, Beijing, China, 17–21 September 2011; pp. 109–118. [Google Scholar]
  30. Montgomery, J. Making a city: Urbanity, vitality and urban design. J. Urban Des. 1998, 3, 93–116. [Google Scholar] [CrossRef]
  31. Ewing, R.H.; Clemente, O.; Neckerman, K.M.; Purciel-Hill, M.; Quinn, J.W.; Rundle, A. Measuring Urban Design: Metrics for Livable Places; Island Press: Washington, DC, USA, 2013; Volume 200. [Google Scholar]
  32. Mocák, P.; Matlovičová, K.; Matlovič, R.; Pénzes, J.; Pachura, P.; Mishra, P.K.; Kostilníková, K.; Demková, M. 15-min city concept as a sustainable urban development alternative: A brief outline of conceptual frameworks and Slovak cities as a case. Folia Geogr. 2022, 64, 69. [Google Scholar]
  33. Lee, S.; Talen, E. Measuring walkability: A note on auditing methods. J. Urban Des. 2014, 19, 368–388. [Google Scholar] [CrossRef]
  34. Ewing, R.; Handy, S. Measuring the unmeasurable: Urban design qualities related to walkability. J. Urban Des. 2009, 14, 65–84. [Google Scholar] [CrossRef]
  35. Wang, Y.; Jin, Y.; Mishra, S.; Wu, B.; Zou, Y. Integrated travel demand and accessibility model to examine the impact of new infrastructures using travel behavior responses. J. Transp. Eng. Part A Syst. 2022, 148, 05021009. [Google Scholar] [CrossRef]
  36. Xiong, Y.; Tang, H.; Xu, T. High-Speed Railway Access Pattern and Spatial Overlap Characteristics of the Yellow River Basin Urban Agglomeration. ISPRS Int. J. Geo-Inf. 2022, 12, 3. [Google Scholar] [CrossRef]
  37. Lorenzen, M.; Mudambi, R.; Schotter, A. International connectedness and local disconnectedness: MNE strategy, city-regions and disruption. J. Int. Bus. Stud. 2020, 51, 1199–1222. [Google Scholar] [CrossRef]
  38. Liu, T.; Luo, F.; He, J. Evolution of Spatial Structure of Tourist Flows for a Domestic Destination: A Case Study of Zhangjiajie, China. Sustainability 2023, 15, 3271. [Google Scholar] [CrossRef]
  39. Ureña, J.M.; Menerault, P.; Garmendia, M. The high-speed rail challenge for big intermediate cities: A national, regional and local perspective. Cities 2009, 26, 266–279. [Google Scholar] [CrossRef]
  40. Bertolini, L. Nodes and places: Complexities of railway station redevelopment. Eur. Plan. Stud. 1996, 4, 331–345. [Google Scholar] [CrossRef]
  41. Li, M.; Lin, X.; Li, H.; Li, D. Research on the mechanism of high-speed railway hub economy: Introducing the “communication value” into the “node-place” model. Adv. Transp. Stud. 2022, 58, 261. [Google Scholar]
  42. Monajem, S.; Nosratian, F.E. The evaluation of the spatial integration of station areas via the node place model; an application to subway station areas in Tehran. Transp. Res. Part D Transp. Environ. 2015, 40, 14–27. [Google Scholar] [CrossRef]
  43. Peek, G.J.; Bertolini, L.; De Jonge, H. Gaining insight in the development potential of station areas: A decade of node-place modelling in The Netherlands. Plan. Pract. Res. 2006, 21, 443–462. [Google Scholar] [CrossRef]
  44. Huang, S.; Wang, C. Street urbanism: Quantitative evaluation on Wuhan street vibrancy and its impact factors. Shanghai Urb. Plan. Rev. 2020, 1, 105–113. [Google Scholar]
  45. Mehta, V. Lively streets: Determining environmental characteristics to support social behavior. J. Plan. Educ. Res. 2007, 27, 165–187. [Google Scholar] [CrossRef]
  46. Liu, M.; Jiang, Y.; He, J. Quantitative evaluation on street vitality: A case study of Zhoujiadu community in Shanghai. Sustainability 2021, 13, 3027. [Google Scholar] [CrossRef]
  47. Li, Y.; Yabuki, N.; Fukuda, T. Exploring the association between street built environment and street vitality using deep learning methods. Sustain. Cities Soc. 2022, 79, 103656. [Google Scholar] [CrossRef]
  48. Li, J.; Lin, S.; Kong, N.; Ke, Y.; Zeng, J.; Chen, J. Nonlinear and Synergistic Effects of Built Environment Indicators on Street Vitality: A Case Study of Humid and Hot Urban Cities. Sustainability 2024, 16, 1731. [Google Scholar] [CrossRef]
  49. Jiang, Y.; Han, Y.; Liu, M.; Ye, Y. Street vitality and built environment features: A data-informed approach from fourteen Chinese cities. Sustain. Cities Soc. 2022, 79, 103724. [Google Scholar] [CrossRef]
  50. Qin, Y.; Zhang, Y.; Yao, M.; Chen, Q. How to Measure the Impact of Walking Accessibility of Suburban Rail Station Catchment Areas on the Commercial Premium Benefits of Joint Development. Sustainability 2023, 15, 4897. [Google Scholar] [CrossRef]
  51. Yuan, M.; Chen, Y. Analysis of Factors Influencing Street Vitality in High-Density Residential Areas Based on Multi-source Data: A Case Study of Shanghai. Int. J. High-Rise Build. 2021, 10, 1–8. [Google Scholar]
  52. Sung, H.; Lee, S. Residential built environment and walking activity: Empirical evidence of Jane Jacobs’ urban vitality. Transp. Res. Part D Transp. Environ. 2015, 41, 318–329. [Google Scholar] [CrossRef]
  53. Li, Q.; Cui, C.; Liu, F.; Wu, Q.; Run, Y.; Han, Z. Multidimensional urban vitality on streets: Spatial patterns and influence factor identification using multisource urban data. ISPRS Int. J. Geo-Inf. 2021, 11, 2. [Google Scholar] [CrossRef]
  54. Wu, C.; Ye, Y.; Gao, F.; Ye, X. Using street view images to examine the association between human perceptions of locale and urban vitality in Shenzhen, China. Sustain. Cities Soc. 2023, 88, 104291. [Google Scholar] [CrossRef]
  55. Huang, X.; Gong, P.; Wang, S.; White, M.; Zhang, B. Machine learning modeling of vitality characteristics in historical preservation zones with multi-source data. Buildings 2022, 12, 1978. [Google Scholar] [CrossRef]
  56. Gehl, J. Cities for People; Island Press: Washington, DC, USA, 2013. [Google Scholar]
  57. Yuan, J.; Zheng, Y.; Xie, X. Discovering regions of different functions in a city using human mobility and POIs. In Proceedings of the 18th ACM SIGKDD International Conference on Knowledge Discovery and Data Mining, Beijing, China, 12–16 August 2012; pp. 186–194. [Google Scholar]
  58. Berke, E.M.; Vernez-Moudon, A. Built environment change: A framework to support health-enhancing behaviour through environmental policy and health research. J. Epidemiol. Community Health 2014, 68, 586–590. [Google Scholar] [CrossRef]
  59. Seidel, A.; Kim, J.T.; Tanaka, I. Architects, urban design, health, and the built environment. J. Archit. Plan. Res. 2012, 29, 241–268. [Google Scholar]
  60. Cheng, L.; De Vos, J.; Zhao, P.; Yang, M.; Witlox, F. Examining non-linear built environment effects on elderly’s walking: A random forest approach. Transp. Res. Part D Transp. Environ. 2020, 88, 102552. [Google Scholar] [CrossRef]
  61. Cheng, L.; Wang, K.; De Vos, J.; Huang, J.; Witlox, F. Exploring non-linear built environment effects on the integration of free-floating bike-share and urban rail transport: A quantile regression approach. Transp. Res. Part A Policy Pract. 2022, 162, 175–187. [Google Scholar] [CrossRef]
  62. Bi, H.; Ye, Z.; Zhu, H. Examining the nonlinear impacts of built environment on ridesourcing usage: Focus on the critical urban sub-regions. J. Clean. Prod. 2022, 350, 131314. [Google Scholar] [CrossRef]
  63. Wang, J.; Su, Y.; Chen, Z.; Tang, L.; Wang, G.; Wang, J. Assessing the Spatial Accessibility of Urban Medical Facilities in Multi-Level and Multi-Period Scales Based on Web Mapping API and an Improved Potential Model. ISPRS Int. J. Geo-Inf. 2022, 11, 545. [Google Scholar] [CrossRef]
  64. Zheng, Z.; Shen, W.; Li, Y.; Qin, Y.; Wang, L. Spatial equity of park green space using KD2SFCA and web map API: A case study of zhengzhou, China. Appl. Geogr. 2020, 123, 102310. [Google Scholar] [CrossRef]
  65. Zhang, J.; Yue, W.; Fan, P.; Gao, J. Measuring the accessibility of public green spaces in urban areas using web map services. Appl. Geogr. 2021, 126, 102381. [Google Scholar] [CrossRef]
  66. Kang, J.; Lee, J.; Eom, D.S. Smartphone-based traveled distance estimation using individual walking patterns for indoor localization. Sensors 2018, 18, 3149. [Google Scholar] [CrossRef]
  67. Gao, J.; Kamphuis, C.B.; Helbich, M.; Ettema, D. What is ‘neighborhood walkability’? How the built environment differently correlates with walking for different purposes and with walking on weekdays and weekends. J. Transp. Geogr. 2020, 88, 102860. [Google Scholar] [CrossRef]
  68. Avanijaa, J.; Sunitha, G.; Madhavi, K.R.; Kora, P.; Vittal, R.H.S. Prediction of house price using xgboost regression algorithm. Turk. J. Comput. Math. Educ. (TURCOMAT) 2021, 12, 2151–2155. [Google Scholar]
  69. Zhang, X.; Yan, C.; Gao, C.; Malin, B.A.; Chen, Y. Predicting missing values in medical data via XGBoost regression. J. Healthc. Inform. Res. 2020, 4, 383–394. [Google Scholar] [CrossRef]
  70. Pesantez-Narvaez, J.; Guillen, M.; Alcañiz, M. Predicting motor insurance claims using telematics data—XGBoost versus logistic regression. Risks 2019, 7, 70. [Google Scholar] [CrossRef]
  71. Chen, Z.; Fan, W. A freeway travel time prediction method based on an XGBoost model. Sustainability 2021, 13, 8577. [Google Scholar] [CrossRef]
  72. Friedman, J.H. Greedy function approximation: A gradient boosting machine. Ann. Stat. 2001, 29, 1189–1232. [Google Scholar] [CrossRef]
  73. Hu, L.; Bi, H.; Wang, C.; Ye, Z.; Cheng, J.; Wu, H. Unraveling nonlinear and interaction effects of various determinants on bus gaseous emissions. Sci. Total Environ. 2022, 812, 151427. [Google Scholar] [CrossRef] [PubMed]
  74. Elith, J.; Leathwick, J.R.; Hastie, T. A working guide to boosted regression trees. J. Anim. Ecol. 2008, 77, 802–813. [Google Scholar] [CrossRef] [PubMed]
  75. Friedman, J.H.; Popescu, B.E. Predictive learning via rule ensembles. Ann. Appl. Stat. 2008, 2, 916–954. [Google Scholar] [CrossRef]
  76. Du, J.; Druta, O.; van den Berg, P.; van Wesemael, P.J. How do socio-demographic characteristics affect users’ perception of place quality at station areas? Evidence from Amsterdam, The Netherlands. Urban Sci. 2021, 5, 80. [Google Scholar] [CrossRef]
Figure 1. Route planning for walking using web mapping API.
Sustainability 16 05524 g001
Figure 2. Buffer areas of Hongqiao station within 20 min walking duration. Note: the “buffer areas” are defined as surrounding areas within a certain walking duration in this study.
Sustainability 16 05524 g002
Figure 3. The proposed modeling framework.
Sustainability 16 05524 g003
Figure 4. The daily trips of HSR passengers.
Sustainability 16 05524 g004
Figure 5. The departure time distribution of HSR passengers.
Sustainability 16 05524 g005
Figure 6. The spatial distribution of HSR passengers’ stay time.
Sustainability 16 05524 g006
Figure 7. The study unit and its neighboring grids.
Sustainability 16 05524 g007
Figure 8. Partial dependence plots of one feature on the stay time of HSR passengers.
Sustainability 16 05524 g008
Figure 9. H-statistic of walking accessibility and built environment characteristics on the stay time of HSR passengers.
Sustainability 16 05524 g009
Figure 10. Partial dependence plots of walking accessibility and built environment characteristics on the stay time of HSR passengers.
Sustainability 16 05524 g010
Figure 11. H-statistic of two-variable built environment characteristics on the stay time of HSR passengers.
Sustainability 16 05524 g011
Figure 12. Partial dependence plots of two-variable built environment characteristics on the stay time of HSR passengers.
Sustainability 16 05524 g012
Table 1. GPS data fields.
Field NameDescriptionSample Data
IDIdentification number of user00005438-****
LatLatitude of stay point121.31556
LngLongitude of stay point31.19592
Start_timeStart time of stay point12 October 2022 13:04:26
End_timeEnd time of stay point12 October 2022 13:04:32
Stay timeDuration of stay point (min)0.1
Note: **** the sample data of ID has been masked.
Table 2. POI data fields.
Field NameDescriptionSample Data
FID_POIIdentification number of POI431,096
NamePOI nameJiushixiaochu
CategoryCategory of POIRestaurant
SubcategorySubcategory of POIChinese food
LatLatitude of POI121.30934
LngLongitude of POI31.180236
Table 3. Descriptive statistics for the independent and dependent variables.
VariableDescriptionMinMaxMeanStd.dev
Stay timeThe sum of HSR passengers’ stay time in each grid (min)0.00126,498.103893.2816,740.50
Walking accessibilityThe walking duration from the HSR station
to each grid (min)
0.5520.0013.864.77
Commercial facilityThe density of commercial facilities in each grid
and its neighboring grids (pcs/km2)
0.001559.72182.494.77
Financial facilityThe density of financial facilities in each grid
and its neighboring grids (pcs/km2)
0.00286.4820.148.35
Government agencyThe density of government agencies in each grid
and its neighboring grids (pcs/km2)
0.00159.1510.131.27
Medical facilityThe density of medical facilities in each grid
and its neighboring grids (pcs/km2)
0.00190.9910.760.81
Life service facilityThe density of life service facilities in each grid
and its neighboring grids (pcs/km2)
0.001145.92109.150.90
Entertainment facilityThe density of entertainment facilities in each grid
and its neighboring grids (pcs/km2)
0.00286.4811.246.21
ResidenceThe density of residences in each grid
and its neighboring grids (pcs/km2)
0.0031.831.301.17
RestaurantThe density of restaurants in each grid
and its neighboring grids (pcs/km2)
0.002864.79199.630.20
Shopping service facilityThe density of shopping service facilities in each grid
and its neighboring grids (pcs/km2)
0.003851.55207.2713.73
Sports hallThe density of sports halls in each grid
and its neighboring grid (pcs/km2)
0.00190.9910.9416.39
Facility of science,
education, and culture
The facility density of science, education, and culture
in each grid and its neighboring grids (pcs/km2)
0.00254.6520.520.87
Note: the abbreviation “pcs” stands for “pieces”, which refers to the POI number of each category in this study.
Table 4. Relative importance of all the variables.
VariableRelative Importance (%)
Entertainment facility45.11
Sports hall38.50
Facility of science, education, and culture8.62
Life service facility2.09
Walking accessibility1.96
Medical facility1.94
Shopping service facility1.10
Commercial facility0.22
Restaurant0.20
Residence0.16
Financial facility0.08
Government agency0.02
Disclaimer/Publisher’s Note: The statements, opinions and data contained in all publications are solely those of the individual author(s) and contributor(s) and not of MDPI and/or the editor(s). MDPI and/or the editor(s) disclaim responsibility for any injury to people or property resulting from any ideas, methods, instructions or products referred to in the content.

