Abstract
Traditional service quality models, which are survey-based methods, have been noted by researchers to contain operational errors in their application. Researchers criticize service quality models such as SERVQUAL and SERVPERF for containing operational errors, high implementation costs, and the issue of response recall. Additionally, these models face difficulties when applied to different sectors, as they were developed for the retail industry. The adaptation of the model, data collection, and processing have become outdated in comparison to current information processing technologies. With the rise in the use of social media, new communication paradigms have emerged. In this new paradigm, direct communication is established between people and institutions through social media. Institutions analyze social media data using text mining and sentiment analysis methods to keep up with this change. There are studies in the literature proposing new methods for measuring service quality by separately using text mining and sentiment analysis techniques. In this study, these two techniques have been combined. It is believed that combining these two techniques will result in a more robust service quality measurement model. Additionally, an application has been developed to demonstrate the functionality of the model. A municipality was specifically chosen as the application area because social media allows for fast, efficient, and inclusive participation between citizens and the municipality. The proposed model will enable the better identification of service quality deficiencies, leading to a more efficient use of municipal resources and fostering a more sustainable understanding of the municipality. With the implementation of the model, 463,886 tweets sent to the @ankarabbld and @mavimasa accounts were analyzed to identify 10 service quality dimensions and 106 keywords representing these dimensions, which would reveal the municipality’s service quality. The sentiment analysis technique was applied to 187,084 tweets containing the identified keywords. Thus, an attempt was made to uncover the municipality’s service quality.
1. Introduction
Service quality studies began within the framework of total quality management in the 1970s [1], but the emergence of pioneering studies took until the 1980s [2,3,4]. From a bibliometric perspective, the most frequently used models in service quality studies are found to be SERVQUAL models. These models are criticized for their structuring according to the retail sector, making their application in different sectors problematic. Additionally, it is argued that the conceptualization and measurement of service quality rely on faulty paradigms [4]. The models developed by researchers in the 1980s typically employed survey techniques. The sample size, response rate, reliability of the response rates, and operational errors during implementation make these models disadvantageous [5], and they are considered unsuitable for contemporary data processing technologies.
There is a need for a more effective method than traditional service quality models to understand people’s desires and evaluate the services provided. Considering the data generated by social media usage and current information processing technologies, it is believed that a new service quality measurement model can be proposed. Service quality studies utilizing a sentiment analysis in the literature began in 2015 [6]. Notable research comprises studies conducted in hotel businesses, airlines, transportation, banking, and healthcare sectors [7,8,9,10,11,12]. These studies have not integrated the extraction of keywords using text mining from user reviews with a sentiment analysis. A new model is proposed where the opinions of service users are considered and evaluated through a sentiment analysis by combining these two techniques. The motivation for this study is based on the belief that a more robust and contemporary information processing, technology-compatible model can be developed by identifying service quality dimensions from data related to the relevant sector using text mining techniques and performing sentiment analysis on the data containing these keywords. The research aims to find an answer to the questions, “How to develop a service quality measurement model with sentiment analysis and text mining?” and “How to Develop a Prototype for Service Quality Measurement”.
The methodology employed to achieve the research objective is illustrated in Figure 1.
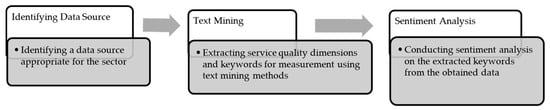
Figure 1.
Proposed service quality model flowchart.
To achieve the objective of the study, a municipality was selected to ensure data volume and demonstrate the accuracy and applicability of the model. Virtual networks created through information processing technologies enable citizens to rapidly form new public spaces and actively participate in decision-making processes within these newly formed public areas [13]. Through virtual networks such as X, citizens quickly create new public spaces. The platform where people in regional communities can interact and share information, experiences, and mutual benefits is called a digital city. A digital city is a social information infrastructure for urban life [14]. In the public sector, social media provides fast, efficient, and inclusive engagement channels for citizens to dialogue with public officials. This is particularly evident at the municipal level, where there is a high degree of proximity between citizens and the government and a high likelihood of citizens participating in public affairs. Engaging citizens through social media offers municipalities low-cost opportunities for better public relations, increased accountability and transparency, and the ability to implement collective problem-solving in policy-making [15]. Social media sites such as X, which facilitate reciprocal communication, act as a quick, effective, and low-cost bridge between digital city citizens and public administrators. The number of people using social media to express opinions about government policies or local administrators is increasing daily. For these reasons, it is believed that a municipality would serve as a good prototype in the proposed new model. In this study, a service quality measurement model is proposed, which involves extracting keywords from social media data and conducting a sentiment analysis on posts containing these keywords, regardless of the sector. A prototype has been developed and applied to a municipality as a case study.
2. Conceptual Background
The theoretical framework of the research consists of the concepts of service quality, social media, sentiment analysis, and text mining. For this reason, these concepts will be introduced first. While explaining these concepts in the research, we will try to reveal the relationship between the images.
2.1. A Brief Overview of Service Quality and Municipal Service Quality
Studies on municipal service quality began approximately 20 years after the initial studies on service quality [16,17,18,19]. Despite using traditional models, such as SERVQUAL and SERVPERF, in these studies, researchers mention different service quality dimensions, different types of services, and different scale questions to present service quality for municipalities. Similarly, in studies conducted in Turkey, it has been observed that the scale questions differ in the adaptation of the SERVQUAL model [20,21,22,23]. A study conducted by examining the literature with municipal employees and experts, considering the municipal law, also identified different quality dimensions [24]. The challenges and costs associated with applying traditional service quality models, along with operational errors, the specification of different service types instead of the five service dimensions in municipal service quality measurement, and the use of different scale questions indicate a lack of consensus among researchers. Additionally, it is believed that the scale questions derived from the adaptation of traditional models do not encompass all types of services provided by the municipality. For these reasons, it is believed that the service quality scales in the literature cannot fully analyze the services provided by municipalities. The types of services provided by municipalities vary depending on the countries they belong to. For example, in the United States, education, healthcare, and police services are managed by municipalities, whereas this may differ in European countries. Therefore, when determining service quality dimensions, it is important to consider citizens’ opinions and identify their expectations.
2.2. Text Mining and Keyword Extraction
Data can be recorded, rearranged, analyzed, and represented by signs such as symbols, letters, and numbers obtained from facts through reason, discussion, or calculations [25]. Text mining is an application area of data mining [26]. Text mining extends data mining to textual data [27]. Text mining is an inherently interdisciplinary process involving collaboration between individuals with various specializations ranging from technical sciences to the humanities [28].
The development of text mining started in the early 2000s and has brought new ideas to existing disciplinary fields. It processes large amounts of natural language textual data in computer files to structure their content and themes and make inferences [29]. Text mining techniques consist of data collection, structuring, and mining processes. This process is described in Table 1.

Table 1.
Text mining process [29].
Keywords are a sequence of one or more words that represent a text’s content. Keywords mean the primary content of a text in a summarized form. Keywords are widely used to define queries within the knowledge extraction method, one of the text mining methods, as they are easy to identify, review, remember, and share [30].
Jones and Paytner [31] developed a system that lists documents related to keywords and hyperlink keyword links between documents, allowing users to access content quickly. Similarly, Gutwin and Paytner [32] developed a system for identifying keywords in a copy. They enriched the presentation results with keywords. Keywords can be extracted with the statistical evaluation of the texts in the document. This is performed by comparing word frequency distributions in a text with distributions in a reference corpus. Selecting statistically distinctive words for an index dictionary has positive results [33]. Some keywords are unlikely to be statistically outstanding in the corpus. Word combinations may need to be considered when statistically corpus building. A syntactic filter should be used to select keywords; words frequently repeated but meaningless should be excluded [34]. Once possible keywords have been identified, keyword associations should be revealed. The relationships of possible keywords can be shown graphically or with matrix tables. Keywords are determined by calculating the frequency of keywords in the document and the degree of association with other possible keywords. Software such as MAXQDA can process textual data, perform qualitative data analyses, and provide a linguistic approach by evaluating metrics for opinion extraction. It can organize and categorize unstructured data, search for information, test theories, and create illustrations [35]. Figure 2 and Figure 3 present the keyword association matrix and the possible keyword study identified by the researchers [30]. The numbers within the matrix indicate how many times the words co-occur. Based on the co-occurrence matrix, the probability of a word being a keyword is determined by dividing the frequencies of the words by the number of different words they co-occur with.
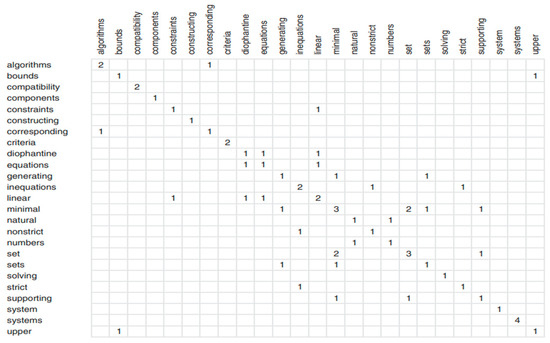
Figure 2.
Keyword co-occurrence matrix [30].
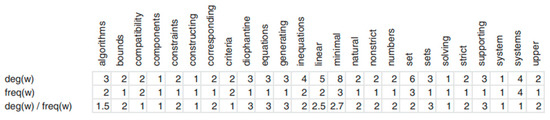
Figure 3.
Possible keywords based on the co-occurrence matrix [30].
MAXQDA software encodes, classifies, maps textual data, and identifies text relationships [36]. Various software, such as CAQDAS, MAXQDA, Quirkos, Transana, etc., are used in computer-aided text analysis. Computer-aided software is preferred in text mining due to its simplicity and the techniques it incorporates [37]. This study selected MAXQDA Analiytic Pro 2022 software while extracting keywords using the same methods.
2.3. Municipalities and Text Mining
When the terms “municipality” and “text mining” are searched in the Web of Science (WOS) database, a study conducted by [38] can be seen, which involves the qualitative analysis of relevant records of Japanese municipalities with certified geoparks using the text mining method. In the Scopus database, there is also a study by Kohsaka and Matsuoka (2015) and a study by [39] that present a framework based on information technology and text mining to reveal satisfaction with Tehran municipal services. Apart from these databases, the following studies are found in the literature.
Researchers indicate that, compared to surveys and traditional research methods, the large amount of social media data with time and location information published by ordinary people and the automated tools available to process these data support urban planning decision-making in a broader spatiotemporal context. For this reason, they analyzed WeChat and X data for the Institute of Urban Planning and Design of Beijing Municipality using the text mining method to help institute managers improve their social perception and expectation abilities and support their decision-making processes [40]. A method based on computer-aided text mining was used to evaluate the climate action plans of 16 municipalities in the regional center of the state of Saxony, Germany. The researchers preferred text mining because it combines qualitative and quantitative approaches. Thus, they claimed that they overcame the time efficiency limit for large case numbers [41]. With the acceleration of urban development and increasing population, the amount of solid waste that the municipality has to handle has also increased significantly. To recycle solid waste more efficiently, a mandatory policy for solid waste segregation has been introduced in China. To examine the attitudes towards this decision taken by the municipality, researchers analyzed the comments of Sina Weibo users. They used the text-mining method to analyze the comments. The researchers argued that public sentiment studies could serve policymakers and practitioners as a political guide in social development [42]. Considering these studies in the literature, it is seen that the text mining method is used for municipal service quality and is also beneficial to citizens and administrators.
The Role of X in Text Mining (X Formerly Known as Twitter)
In many recent studies, X has been used as a resource in various fields, such as predicting political preferences, determining the effectiveness of a service policy, and monitoring infectious diseases and public health crises [43]. In a 2014 study, it was reported that X is the most popular social media application in terms of use by local governments and generates high activity in terms of users liking content or following accounts [44]. In the context of public administrators, X is used to engage stakeholders in dialogue and build relationships. X provides unique features for public administrators [45]. Municipalities must ensure citizens are involved in decision-making processes for practical city management. For this reason, X data should be analyzed and classified for strategic use [46]. Local governments do not systematically evaluate the messages written to them on X. They do not have a strategic method for using X. X has become the focal point of information retrieval and text mining due to the large amount of unstructured textual data it generates [47]. The study’s data source is X in terms of the suitability of its usage characteristics.
X, which allows people to share information anytime and anywhere, has become a platform where users evaluate the service they receive. With mobile applications and internet infrastructure development, X allows for sharing anytime and anywhere. The fact that user content is more prosperous than the data collected with traditional methods based on surveys has made X a valuable source of information [48]. The size of these data and the fact that they are composed of natural language causes various difficulties in analyzing it. Researchers use artificial intelligence techniques, such as sentiment analyses and text mining methods, to overcome these difficulties in processing social media data [49].
2.4. Sentiment Analysis and Its Use in Service Quality
A sentiment analysis analyzes people’s opinions, emotions, evaluations, appraisals, valuations, attitudes, and feelings about products, services, companies, individuals, tasks, events, topics, and their characteristics [50]. Similarly, product managers use sentiment analyses to improve user experiences and satisfaction scores and analyze product and service quality [51]. A sentiment analysis or opinion mining is used to accurately predict whether a tweet is positive, negative, or neutral [52]. Recent years have seen a tremendous increase in sentiment analysis applications. Organizations and companies leverage these opinions to build their customer base or gain insight into their services and products. Thus, sentiment analysis applications have spread to almost every field, from product reviews to health services, stock market forecasts, political strategies, and elections [53].
In a sentiment analysis, it is first necessary to determine whether the sentence is objective or subjective. While no action is taken in objective sentences, the polarity of the sentence as positive, negative, or neutral should be determined in personal sentences. In subjectivity classifications, the process of separating sentences expressing factual information from sentences describing personal opinions and ideas is carried out. For example, the sentence “This is a telephone” is an objective statement. “This phone is perfect” is a subjective statement. There are three levels in a sentiment analysis: document, sentence, and unit and feature levels [54]. At the document level, an inference is made for the whole document. At this level of analysis, the entire document is considered to express an opinion about a single entity. In a sentiment analysis, at the sentence level, each sentence is evaluated as positive, negative, or neutral. At the unit and feature level, sentiments are considered to have a target [55].
Microsoft Azure is one of the leading cloud service providers. It first started to provide services in February 2010. It serves its users as a service platform and infrastructure [56]. Microsoft Azure Machine Learning covers cloud services that enable the creation, deployment, and management of applications by developers through a global data center network for Microsoft [57]. This service provided by Microsoft also supports multiple machine-learning algorithms related to regression, classification, and clustering. It allows for the customization of models using Python and R. In addition, it will enable modules and datasets to be designed using the drag-and-drop method. In this way, users can create their models [58]. Azure Sentiment Analysis is a platform that enables sentiment analyses at the document level, at the sentence level, and for specific features within the document, provided by Microsoft Language Services, which uses machine learning techniques in cloud architecture for sentiment analyses. Azure Sentiment Analysis is used in various applications, such as social media monitoring, customer feedback analyses, and product review analyses. Microsoft reports that Azure Sentiment Analysis has reached 90% accuracy.
Microsoft Azure Language Services was chosen for this study due to its success in sentiment analyses, as noted by researchers.
To identify service quality studies using the sentiment analysis method, the search query ‘TI = (“sentiment analysis”) AND TS = (“service quality”) AND DT = (Article)’ was used in the WOS database. With this query, 23 articles were found. As can be seen in Figure 4, these studies were conducted between 2016 and 2022. Considering the number of studies and the starting year, it is seen that the use of a sentiment analysis in service quality is still very new. Service quality is used in many areas, especially the private sector, and its importance is increasing in a competitive environment. The low number of studies on the use of sentiment analyses gives opportunities to researchers in this field [59].
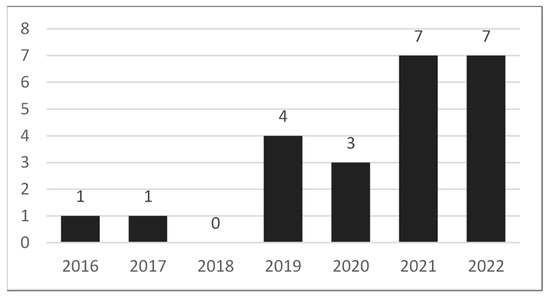
Figure 4.
Year distribution of service quality studies using sentiment analysis.
When the disciplines in which studies using a sentiment analysis in service quality studies are examined, it is seen that the fields of management and business come to the forefront. Figure 5 shows the discipline distribution of the identified studies.
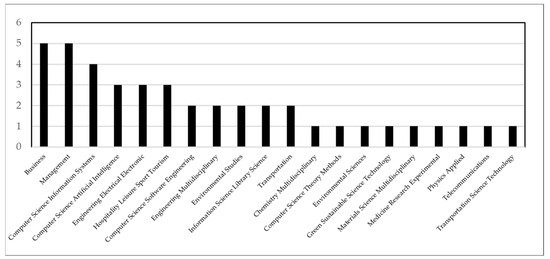
Figure 5.
Discipline Distribution of Service Quality Studies Conducted with Sentiment Analysis.
Table 2 presents 23 studies in which a sentiment analysis measured service quality [59].
Table 2.
The use of a sentiment analysis in service quality studies.
Upon examining the studies presented in Table 2, it is evident that researchers have employed sentiment analysis techniques for measuring service quality across different sectors. They have utilized social media data or user reviews as their data sources. The results of sentiment analyses indicate that high service quality scores have a positive impact on sales. Researchers have highlighted the inadequacies of traditional models in measuring service quality and aimed to overcome these shortcomings. They have suggested that sentiment analysis techniques can provide a more comprehensive and viable alternative to survey-based models.
In the digitalized lifestyle, people express their feelings in writing on social media platforms, websites, blogs, and forums. This situation also affects research in social sciences. The sentiment analysis method was born in computer science and has developed in different disciplines. Efforts to reach service quality by analyzing social media content with a sentiment analysis have been put forward in various sectors. Considering the size of the data analyzed in the studies presented in Table 2, the volume of data to be analyzed in this study will also address a different aspect compared to the existing studies in this field. Additionally, this study proposes a more robust model by utilizing both text mining and sentiment analysis techniques together. Moreover, no model specifically developed for municipalities has been observed in the literature. Therefore, a municipality has been selected as the application area for this study, making the research’s application aspect innovative.
Evaluation of Sentiment Analysis Model Success
The success of the proposed model is related to how accurately the content sent by users is labeled. Therefore, confusion matrices have been used to demonstrate the model’s success. Confusion matrices are the primary tool used in supervised machine learning to evaluate errors in the classification problem. Confusion matrices give the number of misclassified items by comparing the predicted classification results with the previously known results in supervised learning. When the result of a sentiment analysis is labeled as positive when it should be labeled as negative, it is called a type 1 error. When the result is marked as negative when it should be labeled as positive, it is called a type 2 error. A type 1 error is labeled as “false positive, FP”, and a type 2 error is marked as “false negative, FN”. Positive labels predicted without error are represented by “true positive, TP”, and negative brands are represented by “true negative, TN” [76]. According to the labeled data, the accuracy, precision, sensitivity, and F1 value, which shows their harmonic mean, are calculated; these values reveal the model’s success [77].
3. Methodology
The proposed model is presented in Figure 1. According to Figure 1, the proposed model includes the steps of selecting the data source, extracting keywords using text mining, and applying sentiment analysis. In accordance with these steps, X was chosen as the data source. The role of X in service quality measurement is discussed within the conceptual framework. MAXQDA Analiytic Pro 2022 was used for keyword extraction from the obtained data. Microsoft Azure Language Services was utilized for sentiment analysis due to its high-performance results. After identifying the keywords, the service dimensions containing these keywords were determined. By analyzing the number of tweets containing the keywords, the importance of each service dimension was established. A web interface was developed to display the results. These steps are shown in Figure 6.
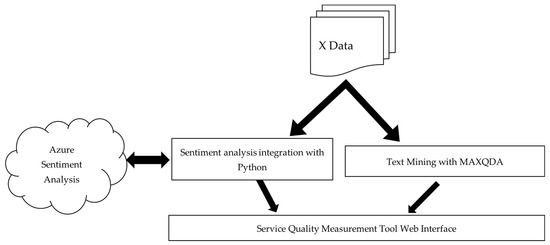
Figure 6.
Service quality measurement model design with sentiment analysis and text mining [78].
In the proposed service quality measurement model, sentiment analysis was performed simultaneously by Azure Sentiment Analysis as the data were obtained, thanks to the developed integration. This feature provided flexibility in the implementation of the model.
After the obtained tweets were sentiment analyzed, the confusion matrix proposed by [77] was created to demonstrate the model’s success.
4. Development of the Prototype
A prototype was developed to test the functionality of the theoretically proposed service quality model. The municipality was chosen as the area to apply the prototype due to the absence of a study combining sentiment analysis and text mining in the literature. X was selected as the data collection platform because it facilitates communication between citizens and municipalities and serves as a suitable source for applying text mining and sentiment analysis. Sentiment analysis was applied to the collected tweets and the extracted keywords, and a web interface was developed to observe the results. This section will describe these steps.
4.1. Data Collection
To create a rich data source in the research, it was considered appropriate to choose a metropolitan municipality. This municipality was preferred because it is the capital of Turkey, and the “City of Mayor” award was given to the Ankara Metropolitan Municipality in 2021 thanks to its service quality. In the research, the data sent to @ankarabbld and @mavimasa X accounts between 1 January 2016 and 30 April 2023 were collected to provide a rich and long-term dataset. Figure 7 shows the data collection process.
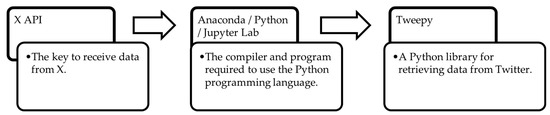
Figure 7.
Data collection.
Tweepy library was used in the program. The X application key was used in the Python programing language. The program that enables the data to be obtained is given in Table 3.
Table 3.
Data collection program.
4.2. Data Processing
Cognitive Service resource, Azure Language Service, and Language Storage Service should be created to process the obtained tweets with Azure Sentiment Analysis. After the Cognitive Service resource is created, the Language Storage service must be designed to save the data from X in the cloud storage. Microsoft Azure Language Services perform tagging, as shown in Table 4, when analyzing sentiment. If there is more than one sentence in a tweet, it scores each sentence separately according to its sentiment and labels it according to the final overall average. Scoring is measured between 0 and 1 according to how strongly the feeling expresses that label.
Table 4.
Sentiment analysis approach.
Table 5 shows the sentiment analysis example labeling.
Table 5.
Sample sentiment analysis.
4.3. Keyword Extraction
Keywords were determined by text mining from the collected data to determine the service quality dimension. Keywords are determined by calculating the frequency of keywords in the document and the degrees arising from their association with other possible keywords [30]. Keywords were obtained with the MAXQDA Analiytic Pro 2022 program. For the keywords to give better results, link addresses inserted in the text, X tags, words with less than three characters, and 3198 words that have a high frequency but are not related to service quality, which are written to create an agenda on X and to advertise, which will create interference, were excluded. After excluding these words, 1,576,997 words and 12,286 different words were identified.
While determining the keywords, their single frequencies; their double, triple, and quadruple word combinations; their usage in context; and their relations with each other were arranged within the framework of the Metropolitan Municipality Law, T.R. Official Gazette, 25531, Law No. 5216 dated 23 July 2004, which determines the powers and responsibilities, establishment, organs, management, and working procedures and principles of municipalities, and the municipal service dimensions put forward in the studies conducted by [22,23,24] mentioned in the literature.
While identifying keywords, the method described in the study by [30] was taken into consideration. Since Turkish is an agglutinative language, word roots were identified, and their frequencies were combined. Service quality dimensions were established by mapping the relationships between the words, as shown in Figure 8, and providing co-occurrence matrix, as seen in Table 6. Due to the collected data being in Turkish, the keywords in the code maps appear in Turkish. Their English equivalents are given in Table 7. This section only presents the street–road–high street maintenance and repair service. Text mining processes for other service quality dimensions are provided in Appendix A.
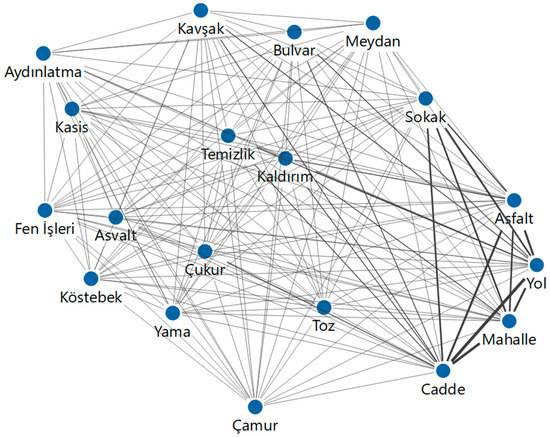
Figure 8.
Street–road–high street maintenance and repair service code map.
Table 6.
Street–road–high street maintenance and repair service co-occurrence matrix.
Table 7.
English Translations of Street–Road–High Street Maintenance and Repair Keywords.
4.4. Designing Web Interface
A web interface was added to the measurement model to observe the service quality dimensions. This way, relevant keywords can be searched in tweets, and the sentiment analysis tags and values received by tweets can be checked. Thus, the measurement model can be quickly adapted for different sectors. It is thought that searching the constituent keywords among the tweets obtained, obtaining sentiment analysis scores, averaging the scores, determining the number of tags, determining user authorization, uploading and deleting tweets, and changing the database when desired will make it easier for the web interface to adapt to different sectors. Therefore, these features were added to the web interface.
4.5. System Infrastructure Architecture
The system architecture was Linux-based. Ubuntu 20.04 operating system was installed on Linux 5.4.0–153 kernel. Apache plugin was used for the operating system to become a web server, MySQL 8.0.34 was used for database management, and PHP 7.4 programing language was used for the scripts in the web pages to execute user requests on the server side.
5. Findings
During the data collection phase, 463,886 tweets were sent to the @ankarabbld and @mavimasa X accounts between 2016 and 2022. When text mining was applied to these tweets, 10 service dimensions and 106 keywords representing these dimensions were identified. There are 187,084 tweets containing 106 keywords. Table 8 shows the service dimension and the keywords. Table 9 shows the municipal service quality dimensions and the number of tweets containing keywords related to these service dimensions.
Table 8.
Municipal service dimension and the related keywords.
Table 9.
Municipal services and related tweets.
Since the keywords representing the service dimension are directly extracted from user-generated content through text mining, they are believed to better represent the service quality dimensions than the keywords identified in studies measuring service quality using a sentiment analysis, such as those presented in [8,11,60,64,72]. Additionally, it has been observed that in service quality measurement studies in the literature, such as [7,8,9,10], the dimensions of the SERVQUAL model have been adapted as service dimensions. One benefit of the keywords generated from text mining is that they allow for the creation of more detailed, sector-specific service quality dimensions. In this regard, these findings are considered to be stronger in measuring service quality. Table 9 provides the service dimensions and the number of tweets containing keywords related to the service dimensions.
The number of tweets subjected to a sentiment analysis for measuring service quality is provided in Table 9. Considering the volume of data analyzed in the studies mentioned in Table 2 such as [6,9,11,64,67], it can be said that the data handled in this study are significantly larger. Analyzing more data helps to reduce the impact of type 1 and type 2 errors on the model’s success in a sentiment analysis.
Table 10 presents the sentiment analysis results related to the service quality dimensions.
Table 10.
Service factors sentiment analysis result.
The factors that reveal the service quality after the keywords are searched in the web interface are given in Table 11.
Table 11.
Service factor sentiment analysis results.
According to the sentiment analysis, 47,152 negative tweets and 34,200 positive tweets were identified. The number of negative tweets is higher across all service dimensions except for fire department services, countryside development services, and water and sewerage services. Considering that citizens usually tweet about services they are dissatisfied with, it can be said that the high number of negative tweets is normal. Although 10 service dimensions have been identified for the municipality, it is observed that significantly more tweets are posted about certain service dimensions. Posting more tweets about a particular service dimension indicates its importance. For example, the number of tweets sent about funeral services is much lower than those about public transportation or social services, as funeral services are not used as frequently in daily life. Another benefit of extracting keywords in determining the service dimension is that it allows for identifying the types of services that are more important to citizens. The service dimension of the municipality is determined by the keywords that constitute it. Under a single service dimension, various types of services can be included. For example, social services not only encompass the maintenance of parks and gardens but also include courses offered by the municipality. This is also applicable to other types of services. In the proposed system, the developed web interface allows for the separate analysis of keywords. This enables detailed analysis within each specific service dimension.
The confusion matrix, which demonstrates the model’s success, was proposed by [77]. The matrix for the developed model is provided in Table 12.
Table 12.
Confusion Matrix.
According to this matrix, the accuracy value calculated is 0.86047, the precision value is 0.95556, the sensitivity value is 0.72881, and the F1 value is 0.82692. According to the data from the confusion matrix, it can be said that the sentiment analysis is quite successful.
6. Discussion, Conclusions, and Future Research
In this study, a new service quality measurement model is proposed using sentiment analysis and text mining techniques. To demonstrate the applicability of the theoretical proposal, a prototype was developed. The municipality was chosen as the area of application due to its suitability for service quality studies and the limited number of studies in this field within the literature. The selected municipality was deemed appropriate for the implementation of the model because it had received a service quality award and was a good data source. The first phase of the proposed new model involves selecting the data source for a sentiment analysis and text mining and obtaining the data. Since the municipality was chosen as the area of application and citizens directly communicate with the municipality via X, X was selected as the data source. A total of 463,886 tweets sent to the municipality’s X accounts between 2016 and 2022 were obtained. The second phase of the proposed model involves applying text mining techniques to the obtained data to extract service quality dimensions and relevant keywords. In this phase, the MAXQDA Analytic Pro 2022 software was used for the analysis. Since the tweets sent by users were not solely related to service quality but also included advertisements, marketing, and propaganda, 3803 words were excluded to avoid interference. When determining the keywords, word frequencies and their combinations in pairs, triplets, and quadruplets, as well as their co-occurrence, were analyzed. During these stages, word association maps and co-occurrence matrices were created. As a result of this process, 10 service quality dimensions and 106 keywords constituting these dimensions were identified. In the final phase, a sentiment analysis was conducted on tweets containing the identified keywords to determine the service quality of the municipality.
The SERVQUAL model, based on surveys, includes five service quality dimensions. This model was developed with 200 participants who received services from four sectors in the retail industry. In addition to the operational errors and adaptation challenges mentioned in the literature, the data collection and processing method also lags behind current technological advancements. For these reasons, researchers have proposed new service quality measurement models summarized in Table 2. These studies have discussed the usability of text mining and sentiment analysis techniques as recommendations. By using sentiment analysis to measure service quality in various sectors, researchers have compared it with traditional models. They have concluded that a sentiment analysis is an innovative and applicable method. In this study, the two techniques used in service quality measurement models in the literature have been combined to create a more robust approach. Additionally, with the developed prototype, desired keywords can be searched through the web interface, and relevant tweets can be observed. This allows for the independent evaluation of service quality dimensions and service types. More detailed results are obtained in identifying shortcomings related to service quality.
Researchers who measured airport service quality using a sentiment analysis and text mining [8] have indicated that this method is innovative and applicable. These researchers extracted keywords from data obtained from X based on an existing scale. In this study, however, keywords were extracted directly by analyzing the content submitted by users. Additionally, this study collected a larger dataset over a longer period.
The service quality dimensions identified through the application of the proposed model to the municipality have both similarities and differences with the dimensions presented in the literature on service quality studies. For instance, in the study conducted by [22], funeral services and fire services were not mentioned, while road and street maintenance and repair services and zoning services were combined. Similarly, in the study by [21], it was observed that road and street maintenance and repair service, funeral service, fire service, rural area service, and inspection service dimensions were not examined, whereas social services, physical characteristics, and zoning services were investigated. In the studies conducted by [17,18], only the five dimensions of the SERVQUAL and SERVPERF models were considered as service quality dimensions. The study by [19] showed that many service dimensions were combined under the dimension of city service management.
A web interface was designed to observe the analyzed data in the development of the service quality measurement model prototype. The web interface utilizes a Linux operating system infrastructure and a MySQL database. Within the web interface, the specified keywords can be searched both together and separately. This feature adds flexibility to the service quality measurement model, allowing for a detailed analysis related to the specific service dimension. This prototype can also be quickly adapted to different sectors. Once the data source for the sector in which service quality is to be measured is determined and the relevant keywords are extracted from the data, the desired analyses can be performed through the web interface.
By applying the proposed model to the municipality, key terms that are typically difficult to predict and not present in the literature have been identified. Some of these terms include words resulting from incorrect spelling, such as “otobus” (bus), “numarali” (numbered), “asvalt” (asphalt), and “harfiyat” (excavation). Additionally, there are colloquial terms used in spoken language, such as “köstebek” (mole), “çukur” (pit), “çamur” (mud), “yama” (patch), and “toz” (dust). Furthermore, terms related to the quality of service in geographical conditions, such as “tuz” (salt) and “küreme” (plowing), were also identified. It is believed that the method implemented will provide a new perspective to the literature in this regard. For a municipality located in a different geographical area where it does not snow during the winter season, citizens would not use the terms “salt” and “plowing”. Despite geographical differences or changes in legal responsibilities, the proposed model will overcome this situation through the steps to be implemented. Key terms derived from users’ posts and the dimensions of service quality will adapt accordingly.
With the implementation of the prototype, it has been observed that citizens tweet more about service quality dimensions that concern them the most. For instance, despite being a legally mandated service of the municipality, fire services are only utilized by citizens when they encounter a fire incident. Consequently, tweets about this service dimension are not as numerous as those concerning other service dimensions. From the perspective of municipal administrators, this result suggests that the prototype indicates a need for the municipality to prioritize more critical service quality dimensions. When considering this result for different sectors, it will enable managers to understand which units are more critical for the institution and which units have better or worse service quality. From the perspective of the applied prototype model, it can be stated that citizens are most concerned with street, road, and alley maintenance and repair services. Following these, social services, public transportation services, and water and sewerage services are of significant importance. Municipal authorities can take these results into account and plan the necessary actions to improve service quality.
In this study, the proposed model has been applied to a municipality, and it has been observed that certain service quality dimensions show similarities to other studies in the literature when considering service quality dimensions. However, service quality dimensions and key terms not encountered in other studies have also been identified. Researchers can apply the proposed model to municipalities in different geographical regions and compare the results. Similarly, researchers can apply the steps of the proposed model to different sectors to verify that the results are suitable for different sectors, as stated in this study, or to bring new suggestions for improvement.
Considering that citizens generally tweet to complain about service quality dimensions with which they are dissatisfied, it is naturally observed that the majority of the resulting posts are negative.
7. Limitations
The developed model proposes the use of social media tools as a data collection method, and the results of the developed prototype have been applied to the Ankara Metropolitan Municipality, the capital of Turkey. On social media, people might criticize municipal services for political reasons, even if they do not have genuine complaints, or conversely, they might express satisfaction without using the services. Although the developed prototype relies on the X platform as its data source, considering its high usage rates, it only takes into account those who express their satisfaction or complaints on this platform. While it is stated to have advantages over traditional models, it does not reflect the opinions of everyone who uses the service dimensions.
The predominance of dissatisfaction in the analyzed tweets may lead to an overrepresentation of negative sentiments, which can result in a misinterpretation of the findings.
Although the removal of certain words, such as advertisements, marketing, and propaganda, in text mining is thought to provide a more accurate representation of service quality dimensions, it may inadvertently exclude words relevant to service quality.
The use of MAXQDA Analytic Pro 2022 software in text mining and the keywords generated through this program are limited to the accuracy of the results provided by this software.
The implementation of the prototype and the interpretation of the results are limited by the data collection period (2016–2022) and the trends of social media data. Due to the nature of the language used on social media, which often does not adhere to grammatical rules, the accuracy of the sentiment analysis remains limited.
Author Contributions
Methodology, E.S.; Software, E.S.; Data curation, E.S.; Writing—original draft, E.S.; Writing—review & editing, H.Ç. All authors have read and agreed to the published version of the manuscript.
Funding
TÜBİTAK supported this study with project number 223K905.
Institutional Review Board Statement
Not applicable.
Informed Consent Statement
Not applicable.
Data Availability Statement
The raw data supporting the conclusions of this article will be made available by the authors on request.
Conflicts of Interest
The authors declare no conflict of interest.
Appendix A. Code Map and Co-Occurrence Matrix
Appendix A.1. Reconstruction Services

Figure A1.
Reconstruction services.
Table A1.
Reconstruction services.
Table A1.
Reconstruction services.
| Plan Sheet | Parcel | Zoning | |
|---|---|---|---|
| Plan Sheet (ada) | 0 | 714 | 21 |
| Parcel (parsel) | 714 | 0 | 38 |
| Zoning (imar) | 21 | 38 | 714 |
Appendix A.2. Earthmoving Services

Figure A2.
Earthmoving Services.
Table A2.
Earthmoving Services.
Table A2.
Earthmoving Services.
| Construction (Inşaat) | Earthmoving (Hafriyat) | Earthmoving (Harfiyat Misspelling) | Demolition Rubble (Moloz) | |
|---|---|---|---|---|
| Construction (inşaat) | 0 | 22 | 74 | 7 |
| Earthmoving (hafriyat) | 22 | 0 | 2 | 2 |
| Earthmoving (harfiyat misspelling) | 74 | 2 | 0 | 0 |
| Demolition rubble (moloz) | 7 | 2 | 0 | 0 |
Appendix A.3. Audit Services

Figure A3.
Audit Services.
Table A3.
Audit Services.
Table A3.
Audit Services.
| Licence | Audit | 153 | Penalty | Municipal Auditor | |
|---|---|---|---|---|---|
| Licence (ruhsat) | 0 | 29 | 42 | 52 | 32 |
| Audit (denetim) | 29 | 0 | 36 | 130 | 121 |
| 153 (municipal auditing team phone number) | 42 | 36 | 0 | 97 | 59 |
| Penalty (ceza) | 52 | 130 | 97 | 0 | 165 |
| Municipal Auditor (zabıta) | 32 | 121 | 59 | 165 | 0 |
Appendix A.4. Countryside Development Services

Figure A4.
Countryside Development Services.
Table A4.
Countryside Development Services.
Table A4.
Countryside Development Services.
| Farmer (Çiftçi) | Countryside (Kırsal) | Fertilizer (Gübre) | Agriculture (Tarım) | |
|---|---|---|---|---|
| Farmer (çiftçi) | 0 | 56 | 46 | 71 |
| Countryside (kırsal) | 56 | 0 | 8 | 68 |
| Fertilizer (gübre) | 46 | 8 | 0 | 13 |
| Agriculture (tarım) | 71 | 68 | 13 | 0 |
Appendix A.5. Water and Sewerage Services

Figure A5.
Water and Sewerage Services.
Table A5.
Countryside Development Services.
Table A5.
Countryside Development Services.
| Flood | Counter | Conter (Misspelling) | Rain | Irrigation | Water | Infrastructure | Sewerage | Sewage | Maintenance Hole | Waterless | Aski | |
|---|---|---|---|---|---|---|---|---|---|---|---|---|
| Flood (sel) | 0 | 6 | 0 | 325 | 86 | 147 | 106 | 50 | 8 | 10 | 17 | 381 |
| Counter | 6 | 0 | 63 | 18 | 30 | 60 | 6 | 6 | 2 | 4 | 50 | 172 |
| Counter (sayac misspelling sayaç) | 0 | 63 | 0 | 7 | 11 | 36 | 2 | 5 | 0 | 0 | 27 | 110 |
| Rain | 325 | 18 | 7 | 0 | 194 | 613 | 165 | 118 | 26 | 55 | 58 | 762 |
| Irrigation | 86 | 30 | 11 | 194 | 0 | 518 | 76 | 53 | 17 | 6 | 142 | 1019 |
| Water (su) | 147 | 60 | 36 | 613 | 518 | 0 | 187 | 158 | 40 | 39 | 139 | 1975 |
| Infrastructure | 106 | 6 | 2 | 165 | 76 | 187 | 0 | 53 | 5 | 15 | 26 | 362 |
| Sewerage (kanalizasyon) | 50 | 6 | 5 | 118 | 53 | 158 | 53 | 0 | 15 | 16 | 17 | 325 |
| Sewage (lağım) | 8 | 2 | 0 | 26 | 17 | 40 | 5 | 15 | 0 | 5 | 4 | 53 |
| Maintenance Hole (rögar) | 10 | 4 | 0 | 55 | 6 | 39 | 15 | 16 | 5 | 0 | 12 | 97 |
| Waterless (susuz) | 17 | 50 | 27 | 58 | 142 | 139 | 26 | 17 | 4 | 12 | 0 | 367 |
| Aski (name of the municipal water and sewerage services unit) | 381 | 172 | 110 | 762 | 1019 | 1975 | 362 | 325 | 53 | 97 | 367 | 0 |
Appendix A.6. Social Services

Figure A6.
Social Services.
Table A6.
Social Services.
Table A6.
Social Services.
| Social Facility | Veterinary | Castration | Animal | Cat | Dog | Local | Belmek | Bread | Museum | Woman | Fomget | Flower | Sport | Child | Family | Elderly | Disabled | Concert | Art | Tree | Park | Tree | |
|---|---|---|---|---|---|---|---|---|---|---|---|---|---|---|---|---|---|---|---|---|---|---|---|
| Social Facility (Tesis) | 0 | 4 | 14 | 68 | 2 | 70 | 0 | 2 | 22 | 4 | 15 | 2 | 3 | 46 | 43 | 39 | 15 | 38 | 13 | 7 | 4 | 124 | 37 |
| Veterinary (Veteriner) | 4 | 0 | 41 | 319 | 56 | 145 | 0 | 0 | 20 | 0 | 15 | 4 | 2 | 7 | 39 | 14 | 19 | 49 | 18 | 7 | 0 | 94 | 15 |
| Castration (kısırlaştırma) | 14 | 41 | 0 | 472 | 72 | 585 | 2 | 0 | 26 | 10 | 67 | 10 | 2 | 45 | 90 | 61 | 43 | 57 | 39 | 18 | 0 | 194 | 33 |
| Animal (hayvan) | 68 | 319 | 472 | 0 | 540 | 2463 | 7 | 3 | 237 | 34 | 336 | 50 | 76 | 236 | 635 | 287 | 209 | 313 | 172 | 102 | 32 | 1498 | 295 |
| Cat (kedi) | 2 | 56 | 72 | 540 | 0 | 695 | 0 | 5 | 47 | 7 | 87 | 9 | 10 | 88 | 149 | 49 | 51 | 69 | 36 | 24 | 14 | 228 | 46 |
| Dog (köpek) | 70 | 145 | 585 | 2463 | 695 | 0 | 7 | 14 | 274 | 23 | 551 | 61 | 94 | 389 | 1041 | 379 | 244 | 344 | 308 | 118 | 29 | 1853 | 336 |
| Local (local) | 0 | 0 | 2 | 7 | 0 | 7 | 0 | 0 | 0 | 0 | 21 | 0 | 10 | 20 | 23 | 2 | 11 | 5 | 9 | 0 | 0 | 26 | 6 |
| Belmek (municipality occupational course) | 2 | 0 | 0 | 3 | 5 | 14 | 0 | 0 | 6 | 0 | 19 | 0 | 3 | 2 | 10 | 0 | 2 | 4 | 2 | 9 | 2 | 20 | 4 |
| Bread (ekmek) | 22 | 20 | 26 | 237 | 47 | 274 | 0 | 6 | 0 | 6 | 163 | 12 | 31 | 96 | 135 | 138 | 103 | 149 | 73 | 55 | 16 | 378 | 97 |
| Museum (müze) | 4 | 0 | 10 | 34 | 7 | 23 | 0 | 0 | 6 | 0 | 7 | 0 | 0 | 5 | 20 | 11 | 4 | 19 | 9 | 14 | 2 | 88 | 16 |
| Woman (kadın) | 15 | 15 | 67 | 336 | 87 | 551 | 21 | 19 | 163 | 7 | 0 | 35 | 19 | 146 | 228 | 166 | 102 | 110 | 72 | 54 | 8 | 312 | 75 |
| Fomget (folklore Music Youth Community) | 2 | 4 | 10 | 50 | 9 | 61 | 0 | 0 | 12 | 0 | 35 | 0 | 7 | 68 | 17 | 8 | 4 | 14 | 12 | 2 | 0 | 32 | 4 |
| Flower (çiçek) | 3 | 2 | 2 | 76 | 10 | 94 | 10 | 3 | 31 | 0 | 19 | 7 | 0 | 18 | 42 | 21 | 26 | 11 | 13 | 13 | 7 | 182 | 145 |
| Sport (spor) | 46 | 7 | 45 | 236 | 88 | 389 | 20 | 2 | 96 | 5 | 146 | 68 | 18 | 0 | 212 | 119 | 73 | 145 | 130 | 79 | 26 | 548 | 123 |
| Child (çocuk) | 43 | 39 | 90 | 635 | 149 | 1041 | 23 | 10 | 135 | 20 | 228 | 17 | 42 | 212 | 0 | 304 | 178 | 259 | 104 | 83 | 16 | 1132 | 180 |
| Family (aile) | 39 | 14 | 61 | 287 | 49 | 379 | 2 | 0 | 138 | 11 | 166 | 8 | 21 | 119 | 304 | 0 | 86 | 204 | 44 | 49 | 14 | 475 | 124 |
| Elderly (yaşlı) | 15 | 19 | 43 | 209 | 51 | 244 | 11 | 2 | 103 | 4 | 102 | 4 | 26 | 73 | 178 | 86 | 0 | 277 | 30 | 18 | 12 | 340 | 98 |
| Disabled (engelli) | 38 | 49 | 57 | 313 | 69 | 344 | 5 | 4 | 149 | 19 | 110 | 14 | 11 | 145 | 259 | 204 | 277 | 0 | 95 | 46 | 23 | 593 | 144 |
| Concert (konser) | 13 | 18 | 39 | 172 | 36 | 308 | 9 | 2 | 73 | 9 | 72 | 12 | 13 | 130 | 104 | 44 | 30 | 95 | 0 | 165 | 7 | 340 | 76 |
| Art (sanat) | 7 | 7 | 18 | 102 | 24 | 118 | 0 | 9 | 55 | 14 | 54 | 2 | 13 | 79 | 83 | 49 | 18 | 46 | 165 | 0 | 7 | 189 | 70 |
| Tree (ağac misspelling) | 4 | 0 | 0 | 32 | 14 | 29 | 0 | 2 | 16 | 2 | 8 | 0 | 7 | 26 | 16 | 14 | 12 | 23 | 7 | 7 | 0 | 115 | 121 |
| Park (park) | 124 | 94 | 194 | 1498 | 228 | 1853 | 26 | 20 | 378 | 88 | 312 | 32 | 182 | 548 | 1132 | 475 | 340 | 593 | 340 | 189 | 115 | 0 | 1027 |
| Tree (ağaç) | 37 | 15 | 33 | 295 | 46 | 336 | 6 | 4 | 97 | 16 | 75 | 4 | 145 | 123 | 180 | 124 | 98 | 144 | 76 | 70 | 121 | 1027 | 0 |
Appendix A.7. Public Transport Services

Figure A7.
Public Transport Services.
Table A7.
Public Transport Services.
Table A7.
Public Transport Services.
| Traffic | Crossing | Ice | Passenger | Car Park | Route | Aşti | Taxi | Minibus | Minibus | Ticket | Ring | Walking Escalator | Salt | Snow Ploughing | Bus Service | Pedestrian | Traffic | Ego | Public Transport | Cycling | Transport | Line | Ankaray | Metro | Numbered | Numbered | Stop | Stop | Bus | Bus | |
|---|---|---|---|---|---|---|---|---|---|---|---|---|---|---|---|---|---|---|---|---|---|---|---|---|---|---|---|---|---|---|---|
| Traffic (trafiğ-misspelling trafik) | 0 | 71 | 24 | 137 | 87 | 59 | 62 | 72 | 18 | 122 | 25 | 42 | 38 | 26 | 6 | 154 | 288 | 549 | 357 | 111 | 126 | 156 | 338 | 23 | 396 | 15 | 90 | 157 | 243 | 50 | 679 |
| Crossing (geçit) | 71 | 0 | 21 | 45 | 11 | 28 | 20 | 23 | 2 | 43 | 13 | 10 | 59 | 19 | 10 | 26 | 218 | 156 | 129 | 20 | 19 | 42 | 90 | 4 | 156 | 2 | 28 | 79 | 85 | 10 | 247 |
| Ice (buz) | 24 | 21 | 0 | 42 | 9 | 34 | 47 | 20 | 4 | 29 | 4 | 10 | 20 | 395 | 100 | 64 | 62 | 108 | 140 | 15 | 3 | 48 | 97 | 16 | 140 | 8 | 31 | 50 | 109 | 32 | 301 |
| Passenger (yolcu) | 137 | 45 | 42 | 0 | 143 | 175 | 244 | 146 | 47 | 274 | 75 | 63 | 112 | 38 | 6 | 504 | 261 | 359 | 1569 | 313 | 72 | 356 | 1064 | 74 | 793 | 56 | 372 | 484 | 993 | 212 | 2561 |
| Car park(otopark) | 87 | 11 | 9 | 143 | 0 | 39 | 105 | 37 | 4 | 78 | 14 | 25 | 34 | 11 | 8 | 109 | 166 | 206 | 299 | 57 | 52 | 109 | 206 | 13 | 361 | 7 | 88 | 162 | 197 | 44 | 487 |
| Route (güzergah) | 59 | 28 | 34 | 175 | 39 | 0 | 72 | 39 | 13 | 146 | 21 | 37 | 55 | 35 | 12 | 159 | 71 | 150 | 509 | 55 | 49 | 127 | 406 | 18 | 278 | 9 | 158 | 163 | 260 | 34 | 817 |
| Aşti (Ankara bus station) | 62 | 20 | 47 | 244 | 105 | 72 | 0 | 66 | 4 | 77 | 48 | 18 | 48 | 21 | 5 | 110 | 76 | 146 | 278 | 62 | 29 | 136 | 199 | 64 | 277 | 6 | 58 | 118 | 149 | 42 | 601 |
| Taxi (taksi) | 72 | 23 | 20 | 146 | 37 | 39 | 66 | 0 | 36 | 135 | 20 | 22 | 22 | 17 | 11 | 116 | 119 | 164 | 279 | 65 | 32 | 100 | 184 | 13 | 196 | 6 | 62 | 290 | 276 | 40 | 512 |
| Minibus (minibüs) | 18 | 2 | 4 | 47 | 4 | 13 | 4 | 36 | 0 | 28 | 4 | 6 | 6 | 2 | 0 | 31 | 8 | 17 | 54 | 30 | 4 | 32 | 58 | 2 | 49 | 2 | 8 | 26 | 48 | 8 | 136 |
| Minibus (dolmuş-other name minibüs) | 122 | 43 | 29 | 274 | 78 | 146 | 77 | 135 | 28 | 0 | 38 | 50 | 33 | 46 | 23 | 270 | 156 | 247 | 592 | 176 | 64 | 276 | 418 | 25 | 402 | 10 | 96 | 203 | 275 | 49 | 1209 |
| Ticket (bilet) | 25 | 13 | 4 | 75 | 14 | 21 | 48 | 20 | 4 | 38 | 0 | 9 | 17 | 4 | 2 | 43 | 25 | 48 | 180 | 37 | 21 | 86 | 95 | 8 | 142 | 4 | 18 | 37 | 78 | 30 | 396 |
| Ring (ring) | 42 | 10 | 10 | 63 | 25 | 37 | 18 | 22 | 6 | 50 | 9 | 0 | 14 | 8 | 6 | 160 | 55 | 75 | 311 | 63 | 8 | 152 | 247 | 16 | 380 | 10 | 50 | 122 | 173 | 43 | 549 |
| Walking escalator (yürüyen) | 38 | 59 | 20 | 112 | 34 | 55 | 48 | 22 | 6 | 33 | 17 | 14 | 0 | 16 | 2 | 102 | 126 | 141 | 363 | 53 | 15 | 68 | 167 | 72 | 650 | 4 | 76 | 196 | 194 | 39 | 513 |
| Salt (tuz) | 26 | 19 | 395 | 38 | 11 | 35 | 21 | 17 | 2 | 46 | 4 | 8 | 16 | 0 | 296 | 71 | 81 | 118 | 151 | 14 | 4 | 66 | 86 | 7 | 97 | 8 | 29 | 57 | 94 | 35 | 314 |
| Snow ploughing (küreme) | 6 | 10 | 100 | 6 | 8 | 12 | 5 | 11 | 0 | 23 | 2 | 6 | 2 | 296 | 0 | 39 | 15 | 52 | 47 | 10 | 2 | 27 | 41 | 0 | 21 | 0 | 12 | 9 | 20 | 5 | 141 |
| Bus service (sefer) | 154 | 26 | 64 | 504 | 109 | 159 | 110 | 116 | 31 | 270 | 43 | 160 | 102 | 71 | 39 | 0 | 273 | 365 | 1384 | 237 | 74 | 425 | 1119 | 48 | 1018 | 31 | 405 | 416 | 702 | 202 | 2719 |
| Pedestrian (yaya) | 288 | 218 | 62 | 261 | 166 | 71 | 76 | 119 | 8 | 156 | 25 | 55 | 126 | 81 | 15 | 273 | 0 | 711 | 718 | 110 | 125 | 438 | 464 | 39 | 583 | 27 | 227 | 389 | 507 | 99 | 1162 |
| Traffic (trafik) | 549 | 156 | 108 | 359 | 206 | 150 | 146 | 164 | 17 | 247 | 48 | 75 | 141 | 118 | 52 | 365 | 711 | 0 | 1037 | 203 | 212 | 374 | 725 | 55 | 850 | 40 | 319 | 481 | 646 | 127 | 1821 |
| Ego (municipal bus transport company) | 357 | 129 | 140 | 1569 | 299 | 509 | 278 | 279 | 54 | 592 | 180 | 311 | 363 | 151 | 47 | 1384 | 718 | 1037 | 0 | 810 | 289 | 1390 | 2919 | 227 | 2359 | 86 | 948 | 1234 | 2135 | 464 | 7388 |
| Public transport (toplu) | 111 | 20 | 15 | 313 | 57 | 55 | 62 | 65 | 30 | 176 | 37 | 63 | 53 | 14 | 10 | 237 | 110 | 203 | 810 | 0 | 78 | 514 | 384 | 74 | 505 | 21 | 82 | 111 | 261 | 57 | 1139 |
| Cycling (bisiklet) | 126 | 19 | 3 | 72 | 52 | 49 | 29 | 32 | 4 | 64 | 21 | 8 | 15 | 4 | 2 | 74 | 125 | 212 | 289 | 78 | 0 | 215 | 173 | 22 | 281 | 0 | 30 | 77 | 105 | 25 | 405 |
| Transport (ulaşım) | 156 | 42 | 48 | 356 | 109 | 127 | 136 | 100 | 32 | 276 | 86 | 152 | 68 | 66 | 27 | 425 | 438 | 374 | 1390 | 514 | 215 | 0 | 712 | 81 | 854 | 8 | 152 | 194 | 382 | 74 | 1841 |
| Line (hat) | 338 | 90 | 97 | 1064 | 206 | 406 | 199 | 184 | 58 | 418 | 95 | 247 | 167 | 86 | 41 | 1119 | 464 | 725 | 2919 | 384 | 173 | 712 | 0 | 126 | 1777 | 83 | 910 | 841 | 1537 | 304 | 4655 |
| Ankaray (municipal metro organization) | 23 | 4 | 16 | 74 | 13 | 18 | 64 | 13 | 2 | 25 | 8 | 16 | 72 | 7 | 0 | 48 | 39 | 55 | 227 | 74 | 22 | 81 | 126 | 0 | 281 | 4 | 30 | 99 | 94 | 30 | 311 |
| Metro (metro) | 396 | 156 | 140 | 793 | 361 | 278 | 277 | 196 | 49 | 402 | 142 | 380 | 650 | 97 | 21 | 1018 | 583 | 850 | 2359 | 505 | 281 | 854 | 1777 | 281 | 0 | 60 | 475 | 1194 | 1337 | 274 | 3798 |
| Numbered (numaralı-misspelling) | 15 | 2 | 8 | 56 | 7 | 9 | 6 | 6 | 2 | 10 | 4 | 10 | 4 | 8 | 0 | 31 | 27 | 40 | 86 | 21 | 0 | 8 | 83 | 4 | 60 | 0 | 25 | 30 | 70 | 48 | 171 |
| Numbered (numaralı) | 90 | 28 | 31 | 372 | 88 | 158 | 58 | 62 | 8 | 96 | 18 | 50 | 76 | 29 | 12 | 405 | 227 | 319 | 948 | 82 | 30 | 152 | 910 | 30 | 475 | 25 | 0 | 490 | 767 | 84 | 1831 |
| Stop (durağ-misspelling) | 157 | 79 | 50 | 484 | 162 | 163 | 118 | 290 | 26 | 203 | 37 | 122 | 196 | 57 | 9 | 416 | 389 | 481 | 1234 | 111 | 77 | 194 | 841 | 99 | 1194 | 30 | 490 | 0 | 1129 | 137 | 2514 |
| Stop (durak) | 243 | 85 | 109 | 993 | 197 | 260 | 149 | 276 | 48 | 275 | 78 | 173 | 194 | 94 | 20 | 702 | 507 | 646 | 2135 | 261 | 105 | 382 | 1537 | 94 | 1337 | 70 | 767 | 1129 | 0 | 355 | 4046 |
| Bus (otobus-msspelling) | 50 | 10 | 32 | 212 | 44 | 34 | 42 | 40 | 8 | 49 | 30 | 43 | 39 | 35 | 5 | 202 | 99 | 127 | 464 | 57 | 25 | 74 | 304 | 30 | 274 | 48 | 84 | 137 | 355 | 0 | 711 |
| Bus (otobüs) | 679 | 247 | 301 | 2561 | 487 | 817 | 601 | 512 | 136 | 1209 | 396 | 549 | 513 | 314 | 141 | 2719 | 1162 | 1821 | 7388 | 1139 | 405 | 1841 | 4655 | 311 | 3798 | 171 | 1831 | 2514 | 4046 | 711 | 0 |
References
- Philip, G.; Hazlett, S.-A. The measurement of service quality: A new P-C-P attributes model. Int. J. Qual. Reliab. Manag. 1997, 14, 260–286. [Google Scholar] [CrossRef]
- Grönroos, C. A Service Quality Model and its Marketing Implications. Eur. J. Mark. 1984, 18, 36–44. [Google Scholar] [CrossRef]
- Parasuraman, A.; Zelthami, V.A.; Berry, L.L. A Conceptual Model of Service Quality and Its Implications for Future Research. J. Mark. 1985, 49, 41–50. [Google Scholar] [CrossRef]
- Cronin, J.J.; Taylor, S.A. Measuring Service Quality: A Reexamination and Extension. J. Mark. 1992, 56, 55. [Google Scholar] [CrossRef]
- Carman, J.M. Consumer perceptions of service quality: An Assesment of the SERVQUAL Dimensions. J. Retail. 1990, 66, 33–41. [Google Scholar]
- Liang, T.P.; Li, X.; Yang, C.T.; Wang, M. What in Consumer Reviews Affects the Sales of Mobile Apps: A Multifacet Sentiment Analysis Approach. Int. J. Electron. Commer. 2015, 20, 236–260. [Google Scholar] [CrossRef]
- Yu, C.E.; Zhang, X. The embedded feelings in local gastronomy: A sentiment analysis of online reviews. J. Hosp. Tour. Technol. 2020, 11, 461–478. [Google Scholar] [CrossRef]
- Martin-Domingo, L.; Martín, J.C.; Mandsberg, G. Social media as a resource for sentiment analysis of Airport Service Quality (ASQ). J. Air Transp. Manag. 2019, 78, 106–115. [Google Scholar] [CrossRef]
- Ahmed, A.Z.; Rodriguez-Diaz, M. Significant Labels in Sentiment Analysis of Online Customer Reviews of Airlines. Sustainability 2020, 12, 8683. [Google Scholar] [CrossRef]
- Anitsal, M.M.; Anitsal, I.; Anitsal, S. Is your business sustainable? A sentiment analysis of air passengers of top 10 US-based airlines. J. Glob. Sch. Mark. Sci. 2019, 29, 25–41. [Google Scholar] [CrossRef]
- Chalupa, S.; Petricek, M.; Chadt, K. Improving Service Quality Using Text Mining and Sentiment Analysis of Online Reviews. Qual. Access Success 2021, 22, 46–49. [Google Scholar]
- Chen, W.; Zheng, X.; Zhou, H.; Li, Z. Evaluation of Logistics Service Quality: Sentiment Analysis of Comment Text Based on Multi-Level Graph Neural Network. Trait. Du Signal 2021, 38, 1853–1860. [Google Scholar] [CrossRef]
- Braga, S.S. Podem as novas tecnologias de informação e comunicação auxiliar na consolidação das democracias? Opiniao Publica 2007, 13, 1–50. [Google Scholar] [CrossRef]
- Dameri, R.P. Defining an evaluation framework for digital cities implementation. In Proceedings of the International Conference on Information Society (i-Society 2012), London, UK, 25–28 June 2012. [Google Scholar]
- Stone, J.A.; Can, S.H. Investigating Factors of Twitter Use among Municipal Governments. J. Comput. Inf. Syst. 2021, 61, 267–274. [Google Scholar] [CrossRef]
- Shahin, A.; Attafar, A.; Samea, M. An integrated approach for service quality and effectiveness improvement with a case study in the recycling pavilion service process of Isfahan municipality. Meas. Bus. Excell. 2012, 16, 84–99. [Google Scholar] [CrossRef]
- Saez, A. Critical Factors for Measuring the Quality of Urban Sanitary Services in the Maracaibo Municipality. Telos-Rev. De Estud. Interdiscip. Cienc. Soc. 2011, 13, 329–354. [Google Scholar]
- Seng, V. Service Quality in One Window Service Office (OWSO): Reflection from Takhmao Municipality, Cambodia. In Public Administration in the Time Of Regional Change (ICMP 2013); Patchanee Taraseina; Atlantis Press: Pattaya, Thailand, 2013. [Google Scholar]
- Alizadeh, A.; Kianfar, F. Developing a model for citizens’ satisfaction with public sector services based on rough sets theory: A case study of Tehran municipality. Tech. Gaz. 2013, 20, 795–802. [Google Scholar]
- İnce, M.; Şahin, K. Belediye Hizmetlerinde Vatandaş Memnuniyeti Ölçümü: Selçuklu Belediyesi Örneği. Sos. Ekon. Araştırmalar Derg. 2011, 11, 1–22. [Google Scholar]
- Usta, R.; Memiş, L. Belediye Hizmetlerinde Kalite: Giresun Belediyesi Örneği. Süleyman Demirel Üniversitesi İktisadi İdari Bilim. Fakültesi Derg. 2010, 15, 333–355. [Google Scholar]
- Ardıç, K.; Yüksel, F.; Çevik, O. Belediyelerde Hizmet Kalitesinin (Vatandaş Tatmininin) Ölçülmesi (Tokat Belediyesinde Bir Uygulama). Çağdaş Yerel Yönetimler 2004, 13, 63–81. [Google Scholar]
- Gümüş, M.; Köleoğlu, N. Factor analysis on service attributes of Canakkale municipality. TQM Mag. 2002, 14, 373–375. [Google Scholar] [CrossRef]
- Bostancı, B.; Erdem, N. Investigating the satisfaction of citizens in municipality services using fuzzy modelling. Socio-Econ. Plan. Sci. 2020, 69, 100754. [Google Scholar] [CrossRef]
- Işıklı, Ş. Büyük Veri, Epistemoloji ve Etik Tartışmalar. Online Acad. J. Inf. Technol. 2014, 5, 89–122. [Google Scholar]
- He, W.; Zha, S.; Li, L. Social media competitive analysis and text mining: A case study in the pizza industry. Int. J. Inf. Manag. 2013, 33, 464–472. [Google Scholar] [CrossRef]
- Liu, B.; Cao, S.G.; He, W. Distributed data mining for e-business. Inf. Technol. Manag. 2011, 12, 67–79. [Google Scholar] [CrossRef]
- Tonkin, E.L. Working with Text. In Working with Text: Tools, Techniques and Approaches for Text Mining; Elsevier: Amsterdam, The Netherlands, 2016; pp. 1–21. [Google Scholar] [CrossRef]
- Tuffery, S. Data Mining and Statistics for Decision Making; John Wiley and Sons Ltd.: Oxford, UK, 2011. [Google Scholar]
- Rose, S.; Engel, D.; Cramer, N.; Cowley, W. Automatic Keyword Extraction from Individual Documents. In Text Mining; Berry, M., Kogan, J., Eds.; Wiley: West Sussex, UK, 2010; pp. 1–20. [Google Scholar] [CrossRef]
- Jones, S.; Paynter, G.W. Automatic extraction of document keyphrases for use in digital libraries: Evaluation and applications. J. Am. Soc. Inf. Sci. Technol. 2002, 53, 653–677. [Google Scholar] [CrossRef]
- Gutwin, C.; Paynter, G.; Witten, I.; Nevill-Manning, C.; Frank, E. Improving browsing in digital libraries with keyphrase indexes. Decis. Support. Syst. 1999, 27, 81–104. [Google Scholar] [CrossRef]
- Andrade, M.A.; Valencia, A. Automatic extraction of keywords from scientific text: Application to the knowledge domain of protein families. Bioinformatics 1998, 14, 600–607. [Google Scholar] [CrossRef] [PubMed]
- Mihalcea, R.; Tarau, P. TextRank: Bringing Order into Texts. In Proceedings of the 2004 Conference on Empirical Methods in Natural Language Processing, Barcelona, Spain, 25–26 July 2004; pp. 404–411. [Google Scholar]
- Babčanová, D.; Šujanová, J.; Cagáňová, D.; Horňáková, N.; Chovanová, H.H. Qualitative and quantitative analysis of social network data intended for brand management. Wirel. Netw. 2021, 27, 1693–1700. [Google Scholar] [CrossRef]
- Sánchez, P.R.P.; Folgado-Fernández, J.A.; Sánchez, M.A.R. Virtual Reality Technology: Analysis based on text and opinion mining. Math. Biosci. Eng. 2022, 19, 7856–7885. [Google Scholar] [CrossRef]
- Zamawe, F.C. The implication of using NVivo software in qualitative data analysis: Evidence-based reflections. Malawi Med. J. 2015, 27, 13–15. [Google Scholar] [CrossRef]
- Kohsaka, R.; Matsuoka, H. Analysis of Japanese Municipalities with Geopark, MAB, and GIAHS Certification: Quantitative Approach to Official Records with Text-Mining Methods. Sage Open 2015, 5, 13–15. [Google Scholar] [CrossRef]
- Abedpour, H.; Eshlaghy, A.T. Provide a Framework for Text Mining in Systems Management Utilities to Run on the 137 System Tehran Municipality. Adv. Environ. Biol. 2014, 8, 571–575. [Google Scholar]
- Gao, X.; Yu, W.; Rong, Y.; Zhang, S. Ontology-Based Social Media Analysis for Urban Planning. In Proceedings of the International Computer Software and Applications Conference, Torino, Italy, 4–8 July 2017; IEEE Computer Society: Washington, DC, USA, 2017; pp. 888–896. [Google Scholar] [CrossRef]
- Bickel, M.W. A new approach to semantic sustainability assessment: Text mining via network analysis revealing transition patterns in German municipal climate action plans. Energy Sustain. Soc. 2017, 7, 22. [Google Scholar] [CrossRef]
- Wu, Z.; Zhang, Y.; Chen, Q.; Wang, H. Attitude of Chinese public towards municipal solid waste sorting policy: A text mining study. Sci. Total Environ. 2021, 756, 142674. [Google Scholar] [CrossRef]
- Tang, J.; Chang, Y.; Liu, H. Mining social media with social theories. ACM Sigkdd Explor. Newsl. 2014, 15, 20–29. [Google Scholar] [CrossRef]
- Mainka, A.; Hartmann, S.; Stock, W.G.; Peters, I. Government and social media: A case study of 31 informational world cities. In Proceedings of the Annual Hawaii International Conference on System Sciences, Waikoloa, HI, USA, 6–9 January 2014; IEEE Computer Society: Washington, DC, USA, 2014; pp. 1715–1724. [Google Scholar] [CrossRef]
- Wigand, F.D.L. Twitter in government: Building relationships one tweet at a time. In Proceedings of the ITNG2010—7th International Conference on Information Technology: New Generations, Las Vegas, NV, USA, 12–14 April 2010; pp. 563–567. [Google Scholar] [CrossRef]
- Flores, C.C.; Rezende, D.A. Twitter information for contributing to the strategic digital city: Towards citizens as co-managers. Telemat. Inform. 2018, 35, 1082–1096. [Google Scholar] [CrossRef]
- Song, M.; Kim, M.C.; Jeong, Y.K. Analyzing the Political Landscape of 2012 Korean Presidential Election in Twitter. IEEE Intell. Syst. 2014, 29, 18–26. [Google Scholar] [CrossRef]
- Tian, X. Effectiveness of Social Media Analytics on Detecting Service Quality Metrics in the U.S. Airline Industry. Ph.D. Thesis, Information Technology & Decision Sciences, Old Dominion University, Norfolk, VA, USA, 2018. [Google Scholar] [CrossRef]
- Ürgün, G.K.; Ük, Z.Ç. Hizmet Kalitesi İyileştirilmesinde Servqual ve Kano Modellerinin KFY ile Bütünleştirilmesi: Havayolu Sektöründe Bir Uygulama. Güncel Tur. Araştırmaları Derg. 2022, 6, 554–580. [Google Scholar] [CrossRef]
- Alnawas, A.; Arıcı, N. The Corpus Based Approach to Sentiment Analysis in Modern Standard Arabic and Arabic Dialects: A Literature Review. J. Polytech. 2018, 6, 554–580. [Google Scholar] [CrossRef]
- Fang, X.; Zhan, J. Sentiment analysis using product review data. J. Big Data 2015, 2, 5. [Google Scholar] [CrossRef]
- Wintijen, M. Practical Data Analysis Using Jupyter Notebook: Learn How to Speak the Language of Data by Extracting Useful and Actionable Insights Using Python; Packt Publishing: Birmingham, UK, 2020; Chapter 11; p. 247. [Google Scholar]
- Liu, B. Sentiment Analysis: Mining Opinions, Sentiments, and Emotions. In Sentiment Analysis: Mining Opinions, Sentiments, and Emotions, the Pitt Building, Trumpington St, Cambridge CB2 1RP, CAMBS; Cambridge University Press: Cambridge, UK, 2015; pp. 1–367. [Google Scholar] [CrossRef]
- Pozzi, F.A.; Fersini, E.; Messina, E.; Liu, B. Challenges of Sentiment Analysis in Social Networks. In Sentiment Analysis in Social Networks; Elsevier: Amsterdam, The Netherlands, 2017; pp. 1–11. [Google Scholar] [CrossRef]
- Biagioni, R. The SenticNet Sentiment Lexicon: Exploring Semantic Richness in Multi-Word Concepts. In Springer Briefs in Cognitive Computation; Springer International Publishing: Cham, Switzerland, 2016; Volume 4. [Google Scholar] [CrossRef]
- Qaisi, L.M.; Aljarah, I. A Twitter sentiment analysis for cloud providers: A case study of Azure vs. AWS. In Proceedings of the CSIT 2016: 2016 7th International Conference on Computer Science and Information Technology, Amman, Jordan, 13–14 July 2016; Institute of Electrical and Electronics Engineers Inc.: Piscataway, NJ, USA, 2016. [Google Scholar] [CrossRef]
- Harfoushi, O.; Hasan, D.; Obiedat, R. Sentiment Analysis Algorithms through Azure Machine Learning: Analysis and Comparison. Mod. Appl. Sci. 2018, 12, 49. [Google Scholar] [CrossRef]
- Qasem, M.; Thulasiram, R.; Thulasiram, P. Twitter sentiment classification using machine learning techniques for stock markets. In Proceedings of the 2015 International Conference on Advances in Computing, Communications and Informatics (ICACCI), Kochi, India, 10–13 August 2015; pp. 834–840. [Google Scholar] [CrossRef]
- Sur, E.; Çakır, H. Bibliometric Analysıs of The Use of Sentiment Analysis in The Context of Service Quality. Yalvaç Akad. Derg. 2023, 8, 81–104. [Google Scholar] [CrossRef]
- Gitto, S.; Mancuso, P. Improving airport services using sentiment analysis of the websites. Tour. Manag. Perspect. 2017, 22, 132–136. [Google Scholar] [CrossRef]
- Jain, P.K.; Quamer, W.; Pamula, R.; Saravanan, V. SpSAN: Sparse self-attentive network-based aspect-aware model for sentiment analysis. J. Ambient. Intell. Humaniz. Comput. 2021, 14, 3091–3108. [Google Scholar] [CrossRef]
- Rasool, G.; Pathania, A. Reading between the lines: Untwining online user-generated content using sentiment analysis. J. Res. Interact. Mark. 2021, 15, 401–418. [Google Scholar] [CrossRef]
- Tokarchuk, O.; Barr, J.C.; Cozzio, C. How much is too much? Estimating tourism carrying capacity in urban context using sentiment analysis. Tour. Manag. 2022, 91, 401–418. [Google Scholar] [CrossRef]
- Gang, Z.; Chenglin, L. Dynamic Measurement and Evaluation of Hotel Customer Satisfaction Through Sentiment Analysis on Online Reviews. J. Organ. End User Comput. 2021, 33, 27. [Google Scholar] [CrossRef]
- Wang, Z.; Wang, L.; Ji, Y.; Zuo, L.; Qu, S. A novel data-driven weighted sentiment analysis based on information entropy for perceived satisfaction. J. Retail. Consum. Serv. 2022, 68, 103038. [Google Scholar] [CrossRef]
- Agarwal, S. Deep Learning-based Sentiment Analysis: Establishing Customer Dimension as the Lifeblood of Business Management. Glob. Bus. Rev. 2022, 23, 119–136. [Google Scholar] [CrossRef]
- Ho, S.Y.; Choi, K.W.S.; Yang, F.F. Harnessing Aspect-Based Sentiment Analysis: How Are Tweets Associated with Forecast Accuracy? J. Assoc. Inf. Syst. 2019, 20, 1174–1209. [Google Scholar] [CrossRef]
- Chen, Y.; Zhong, Y.; Yu, S.; Xiao, Y.; Chen, S. Exploring Bidirectional Performance of Hotel Attributes through Online Reviews Based on Sentiment Analysis and Kano-IPA Model. Appl. Sci. 2022, 12, 692. [Google Scholar] [CrossRef]
- Shah, A.; Yan, X.; Tariq, S.; Shah, S. Tracking patient’s healthcare experiences during the COVID-19 outbreak: Topic modelling and sentiment analysis of doctor reviews. J. Eng. Res. 2021, 9, 219–239. [Google Scholar] [CrossRef]
- Saputro, B.; Hidayanto, A.N.; Abidin, Z.; Paoprasert, N. Measuring service quality in the telecommunications industry from customer reviews using sentiment analysis: A case study in PT XL Axiata. Int. J. Innov. Learn. 2021, 30, 188–200. [Google Scholar] [CrossRef]
- Zheng, X.; Chen, W.; Zhou, H.; Li, Z.; Zhang, T.; Yuan, Q. Emoji-Integrated Polyseme Probabilistic Analysis Model: Sentiment Analysis of Short Review Texts on Library Service Quality. Trait. Du Signal 2022, 39, 313–322. [Google Scholar] [CrossRef]
- Ceyhan, M.; Orhan, Z.; Karras, D. Sentiment Analysis of Hospital Service Satisfaction. J. Res. Med. Dent. Sci. 2020, 8, 6–10. [Google Scholar]
- Li, L.; Mao, Y.; Wang, Y.; Ma, Z. How has airport service quality changed in the context of COVID-19: A data-driven crowdsourcing approach based on sentiment analysis. J. Air Transp. Manag. 2022, 105, 102298. [Google Scholar] [CrossRef] [PubMed]
- Mishra, D.N.; Panda, R.K. Decoding customer experiences in rail transport service: Application of hybrid sentiment analysis. Public Transp. 2022, 15, 31–60. [Google Scholar] [CrossRef]
- Ghosal, S.; Jain, A. Weighted aspect-based sentiment analysis using extended OWA operators and Word2Vec for tourism. Multimed. Tools Appl. 2023, 82, 18353–18380. [Google Scholar] [CrossRef]
- Navin, M.J.R.; Pankaja, R. Performance Analysis of Text Classification Algorithms using Confusion Matrix. Int. J. Eng. Technol. Res. (IJETR) 2016, 6, 75–78. [Google Scholar]
- Prabowo, R.; Thelwall, M. Sentiment analysis: A combined approach. J. Informetr. 2009, 3, 143–157. [Google Scholar] [CrossRef]
- Sur, E.; Çakır, H. A Proposed Service Quality Measurement Model Using Sentiment Analysis and Text Mining: The Case of Water and Sewerage Services. OPUS J. Soc. Res. 2023, 20, 473–487. [Google Scholar] [CrossRef]
Disclaimer/Publisher’s Note: The statements, opinions and data contained in all publications are solely those of the individual author(s) and contributor(s) and not of MDPI and/or the editor(s). MDPI and/or the editor(s) disclaim responsibility for any injury to people or property resulting from any ideas, methods, instructions or products referred to in the content. |
© 2024 by the authors. Licensee MDPI, Basel, Switzerland. This article is an open access article distributed under the terms and conditions of the Creative Commons Attribution (CC BY) license (https://creativecommons.org/licenses/by/4.0/).