Essay

Sustainability Assessment and Source Apportionment of Soil Heavy Metals in a Mineral Aggregation Area of Datian County, South China

1
School of Earth Sciences and Resources, China University of Geosciences (Beijing), Beijing 100083, China
2
Technical Centre for Soil, Agriculture and Rural Ecology and Environment, Ministry of Ecology and Environment, Beijing 100012, China
3
Chinese Research Academy of Environmental Sciences, Beijing 100012, China
*
Author to whom correspondence should be addressed.
Sustainability 2024, 16(13), 5553; https://doi.org/10.3390/su16135553 (registering DOI)
Submission received: 26 April 2024 / Revised: 7 June 2024 / Accepted: 25 June 2024 / Published: 28 June 2024

Abstract

:
Heavy metal pollution in soils, especially in mineral aggregation areas, presents significant sustainability challenges affecting ecosystem health and human well-being. This study conducted source apportionment and risk analysis of soil heavy metals in Datian County, South China, to promote sustainable land use and pollution mitigation. We collected 103 surface soil samples (0–20 cm) from a typical mineral aggregation area and analyzed the concentration distributions of heavy metals using geostatistical methods. The geoaccumulation index (Igeo) and potential ecological risk index (RI) were employed to evaluate pollution levels and ecological risks. Our findings reveal that heavy metal concentrations substantially exceeded Fujian Province’s background values, with Cd exhibiting severe pollution levels. Cd, Pb, and Cu pose moderate to high ecological risks. Major pollution sources include metal smelting enterprises, soil parent materials, mixed sources of mineral extraction and traffic pollution, atmospheric deposition, and agricultural pollution. Their contribution rates were found to be 15.66%, 17.72%, 38.32%, 8.25%, and 20.05%, respectively. Utilizing principal component analysis (PCA) and positive matrix factorization (PMF) models integrated with geostatistical methods, this study provides robust source identification and highlights sustainable practices for soil management. The results offer a scientific basis for developing strategies to mitigate heavy metal pollution and enhance environmental sustainability in the region.

1. Introduction

Soil is an integral and crucial component of the Earth’s ecosystem and plays a vital role in the existence and development of life [1]. With China’s rapid development, a large amount of mineral resources have been extracted, and metallurgical enterprises have proliferated. Intensive production activities and long-term improper fertilization practices have exacerbated soil heavy metal pollution, severely damaging ecosystem services and posing a significant threat to human health [2,3]. Moreover, heavy metals that enter the soil are not easily degradable, accumulate unnoticed, and originate from complex sources. This results in ecological damage to the soil, leading to the accumulation of heavy metals in crops and their subsequent enrichment in the higher tiers of the food chain [4]. The pivotal role of soils lies in their provision of a multitude of ecosystem services, given the intricate reliance of both the continuum of biodiversity and the trajectories of human development upon their diverse functions [3]. However, heavy metals, encompassing not only lead, arsenic, mercury, and cadmium but also various others, are classified as enduring environmental contaminants. These metals tend to accumulate in the food chain, thereby presenting substantial hazards to both wildlife and human well-being [5].
The accumulation of heavy metals in soil is influenced by natural factors, agricultural production, and human activities such as industrial and mining processes [6,7]. Different influencing factors contribute to various categories of heavy metal pollution [8]. The 2016 Action Plan for the Prevention and Control of Soil Pollution (Ten Measures for Soil) issued by China emphasizes “strengthening pollution source regulation” and “clarifying governance and restoration entities”. On 4 June 2021, the Food and Agriculture Organization of the United Nations (FAO) and the United Nations Environment Programme (UNEP) jointly released a report identifying the main sources of soil pollution, including industrial and mining activities, poorly managed urban and industrial waste, extraction and processing of fossil fuels, unsustainable agricultural practices, and transportation [9]. Therefore, understanding the spatial distribution characteristics of heavy metals in soil, assessing pollution-related health risks, and accurately identifying the sources of heavy metals are crucial for preventing and controlling soil pollution.
Source apportionment techniques have been widely applied in the qualitative identification and quantitative analysis of soil heavy metal pollution sources. Multivariate statistical and geostatistical analyses are commonly used qualitative methods for studying heavy metal sources and spatial variations in soil. These methods, including correlation analysis, the enrichment factor method, and factor analysis [10], can identify the number and categories of contributing factors but may lack quantitative precision in determining the contribution rates of each factor and the distribution of contributions among various heavy metals. Currently, quantitative source apportionment has become mainstream in soil heavy metal research, with common methods including the positive matrix factorization (PMF) model, UNMIX model, and isotopic ratio method [11,12]. PMF is an analytical method based on statistics and matrix decomposition. Its goal is to decompose the observed complex data matrix into source contribution and source profile matrices, thereby identifying and quantifying the components from different sources and their contributions. The basic idea is to represent the observed data as a linear combination of several potential sources. Relevant studies indicate that metal smelting enterprises are the main sources of heavy metals such as Cd and Zn [13,14]. Soil parent material sources have significant impacts on the distribution and accumulation of Cr and Ni in soil [15,16]. The mixed sources of mineral extraction and traffic pollution significantly increase the concentration of heavy metals such as Pb and Zn in soil, which has important implications for environmental and health risks [17,18,19]. Heavy metals such as Hg released through activities such as coal combustion, industrial emissions, and waste incineration by atmospheric deposition sources significantly impact the levels of heavy metal pollution in these regions by depositing into soil and other environmental media through atmospheric deposition [20,21,22,23]. Agricultural pollution sources, such as the use of fertilizers and pesticides, as well as the application of livestock and poultry manure, can lead to changes in the concentrations of heavy metals such as Cu and As in soil, increasing the risk of soil heavy metal pollution. Shao et al. [24] found that emissions from smelting and electroplating enterprises are the primary sources of cadmium in soil, followed by transportation and agricultural inputs; the PMF model was effectively applied for source apportionment of pollution in China. Zhou et al. [25] used the PMF model to identify four distinct pollution sources: the smelting industry, transportation emissions, a combination of agricultural and natural factors, and mining activities, providing valuable insights for effective soil management in the study area. Studies have shown that the accumulation of soil heavy metals is more pronounced in areas with long-term mining activities than in areas not subjected to mining [26]. Currently, there is relatively little research on the assessment of heavy metal pollution risks and the analysis of pollution sources in agricultural land surrounding mineral aggregation areas. Particularly in the southern metal mineral aggregation areas of China, where the soil environment is predominantly acidic, it is especially worthwhile to conduct in-depth research on the distribution characteristics and sources analysis of heavy metals in the soil.
Based on the above discussion, the main purpose of this study was to (1) elucidate the spatial distribution of Cd, Hg, As, Pb, Cr, Ni, Cu, and Zn in the soil using geostatistical methods; (2) assess the current status and risk levels of soil heavy metal pollution using the Geoaccumulation index (Igeo), potential ecological risk factor (Er), and potential ecological risk index (RI); and (3) integrate PCA, PMF modelling, and geostatistical methods to quantitatively analyze the sources of heavy metals in soil from a typical mineral aggregation area in Datian County, Sanming City. By delving into the pathways of heavy metal entry into farmland and exploring the spatial distribution characteristics and pollution status of heavy metals in the study area soil, this research contributes to the formulation of targeted soil pollution control measures. It also provides scientific evidence and references for decision-makers, thereby promoting the realization of regional environmental protection and sustainable development.

2. Materials and Methods
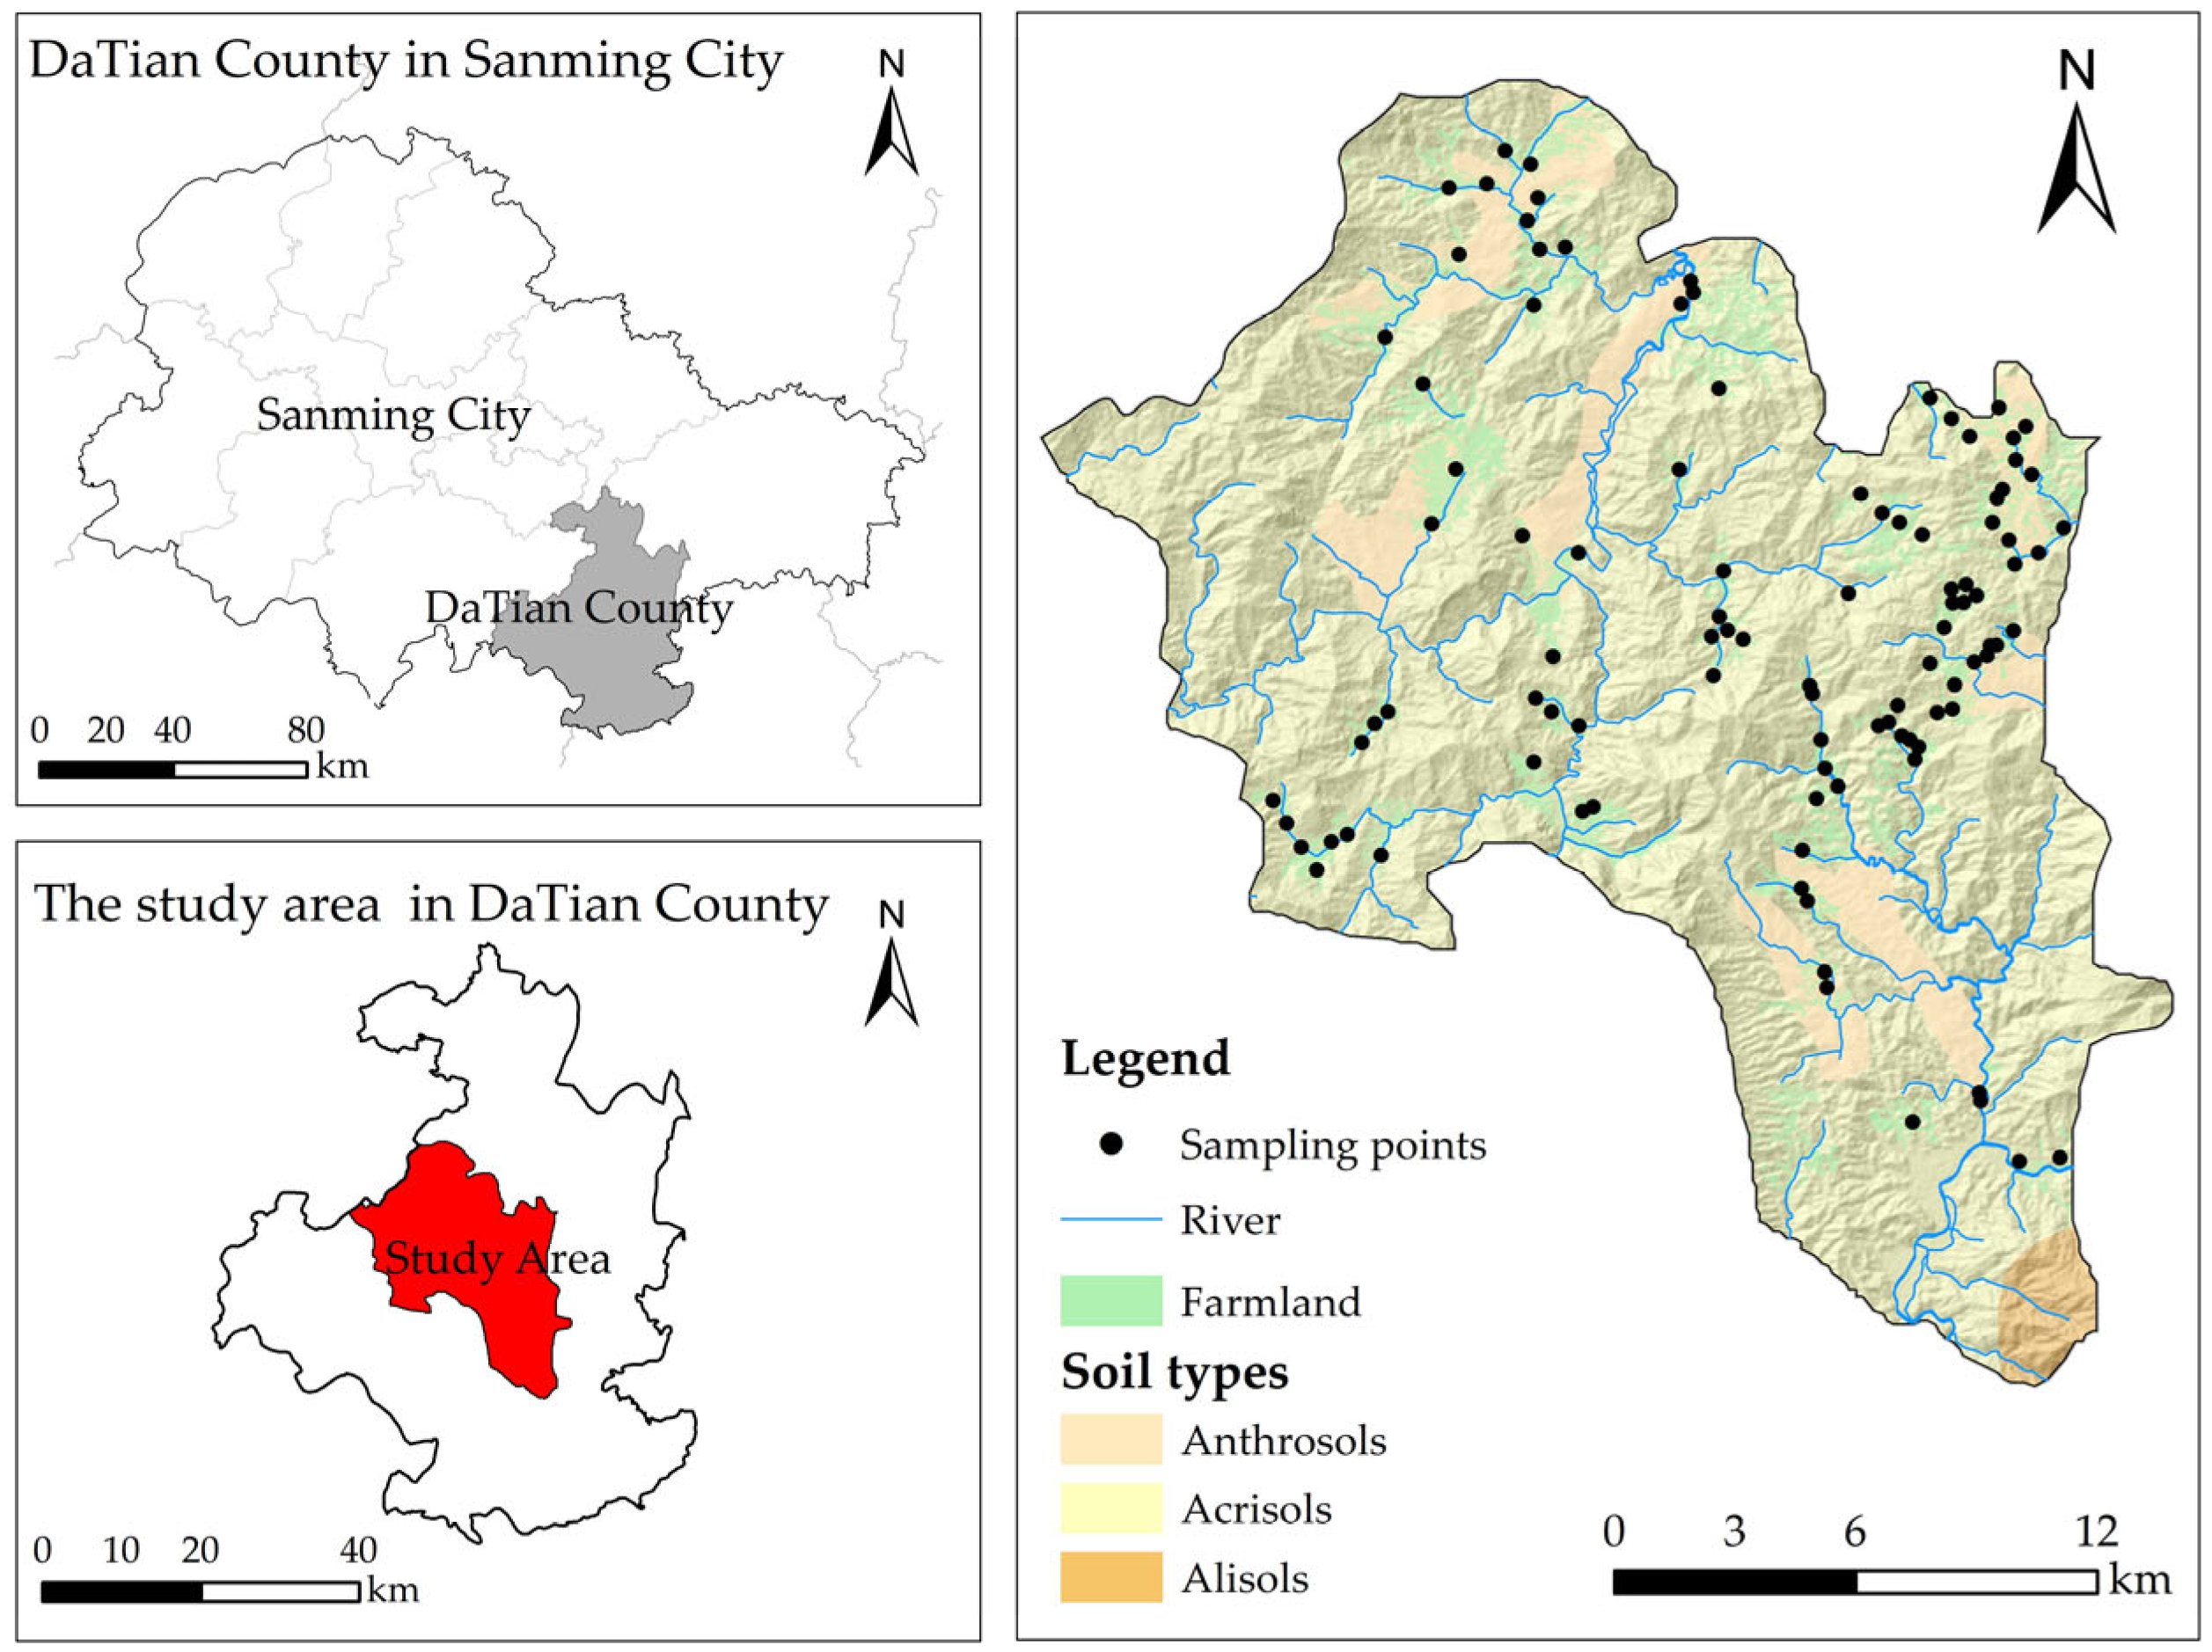
2.1. Study Area

Sanming City, Datian County, is one of the main mining areas in Fujian Province and is also one of China’s top 100 key coal-producing counties. This county is designated in Fujian Province as a primary raw material base for the Sanming Iron and Steel Plant, having abundant mineral resources and earning the title of a Treasure Trove in Central Fujian. The study area (117°38′–117°53′ E, 25°38′–25°56′ N) is located in the central region of Datian County, Sanming City, Fujian Province, with an area of 406 km2. The area has a subtropical monsoon climate and is located in Central Asia. The annual average temperature ranges from 15.3 to 19.6 °C, and the annual precipitation ranges from 1491 to 1809 mm [27]. The overall topography of the study area is undulating, with higher elevations in the western and central regions. The soil types in the study area are classified according to the World Reference Base for Soil Resources (WRB) international soil classification system, primarily as Acrisols and Anthrosols, followed by Alisols. Most mountain soils are residual parent material, while ridge fields and terraced fields mainly consist of slope deposition parent material. Fields along riversides and coastal areas are composed of slope deposition and alluvial parent material. Most of the lead–zinc mining and smelting areas are located in the central part of the study area. In the southern part of the study area, tributaries flow from north to south into the Junxi River, while in the northwestern part, Zhangdi Creek, Dongpu Creek, and Tangquan Creek flow from south to north. The main economic crops in the study area include rice, corn, and wheat. Additionally, livestock farming is widespread, primarily involving the breeding of pigs, rabbits, sheep, and poultry.

2.2. Sampling Point Arrangement and Sample Collection

In August 2023, local information on the distribution of active enterprises, the location of mineral deposits, the distribution of cultivated land, and river systems were utilized to establish sampling points. Based on on-site investigations, the mineral-rich areas in the study region are primarily concentrated in the central and eastern regions, with a greater density of enterprises. In contrast, there are fewer enterprises in the northwest and southern regions. Therefore, the sampling locations in this study were primarily concentrated in mining areas and regions with significant enterprises. The precision of the sampling points was controlled within a 1 km × 1 km grid. In the southern region, where tributaries flow south into Junxi, considering mining activities and industrial waste discharge into the river, soil sampling was conducted at a density of 1.5 km × 1.5 km along both sides of the river. For areas in the northwest of the study region with fewer enterprises and mining sites, the sampling density was reduced, with the grid spacing was controlled at 3 km × 3 km. The final number of sampling points was 103, and specific information on the distribution of sampling points is shown in Figure 1. The sampling followed The Technical Specification for Soil Environmental Monitoring (HJ/T 166-2004) [28], collecting topsoil samples (0–20 cm) using the five-point double diagonal method, with retained composite soil samples not less than 2 kg. GPS was used to collect the actual central coordinates of the sampling points, and field records were maintained.

2.3. Soil Sample Processing and Analysis

During the collection of soil samples, impurities such as gravel and residues from plants and animals were removed. The mixed soil samples were then packaged in polyethylene sample bags and sent to the laboratory. After thorough air-drying, the samples were ground until they passed through a sieve with a pore size of 0.15 mm (100 mesh) and stored for future use. The pH of soil samples was determined using a potentiometric method. Soil samples, dried and sieved, were mixed with distilled water at a ratio of 1:2.5, stirred evenly, and allowed to stand for 30 min, and the pH of the solution was measured using a calibrated pH meter. The soil sample digestion process employed the aqua regia digestion method. Under heating conditions at 110 °C, 0.5 g of soil sample was added to 10 mL of aqua regia and digested for 3 h. The digested sample solution was used for measurements by inductively coupled plasma mass spectrometry (ICP-MS) and atomic fluorescence spectroscopy (AFS). Approximately 5 mL of soil sample solution was used for each measurement, and the concentrations of Cd, Pb, Cr, Ni, Cu, and Zn in the soil were determined using ICP-MS. The concentrations of As and Hg were determined using AFS. To ensure the reliability of the analytical results, the measurements were validated through method blanks, duplicates, and analysis of a standard reference material (Chinese National Standard Soil GBW07423). Two blank samples were used for every 50 samples, and the metal recovery rates ranged from 96.4% to 102.6%. The detection limits for Cd, Hg, As, Pb, Cr, Ni, Cu, and Zn in the soil were 0.1, 0.002, 0.01, 1.4, 0.5, 0.4, 0.4, and 1.2 mg·kg−1, respectively.

2.4. Research Methods

2.4.1. Geoaccumulation Index

The geoaccumulation index (Igeo), proposed by the German scientist Muller, is a quantitative indicator for studying the degree of heavy metal pollution [29]. This index is widely used both domestically and internationally to assess the level of soil heavy metal pollution and is calculated as follows:
I g e o = l o g 2 ( C n K B n )
where Igeo is the geoaccumulation index; Cn is the measured content of heavy metal elements in the soil in the study area; Bn is the geochemical background value of soil heavy metals, and in this study, Bn is replaced by the soil background value of Fujian Province; and K is a correction factor for the possible influence of diagenesis and human activities on the background value, and the correction factor K is set to 1.5. The geoaccumulation index can be classified into 7 levels [30]. The specific level division is shown in Table 1.

2.4.2. Ecological Risk Assessment

The ecological risk assessment of heavy metals is crucial for soil planning and risk control [33]. The RI method [31] not only considers the content of heavy metals in samples but also considers the biological toxicity of heavy metals. This method reflects the potential impact of various heavy metal pollutants on the ecological environment and is widely used in studies on heavy metal risk assessment [34].
The formula for calculating the potential ecological risk factor (Er) of individual metals is
E r i = T r i × C i C r i
where  E r i  is the potential ecological risk factor of heavy metal i in the soil;  C i   is the measured content of heavy metal i, mg·kg−1 C r i  is the reference value for heavy metal i, selected as the screening value under pH < 5.5 conditions in the Soil Environmental Quality Agricultural Land Soil Pollution Risk Control Standard (Trial) (GB 15618-2018) [35], mg·kg−1; and  T r i  is the toxicity coefficient for the corresponding heavy metal, reflecting the toxicity level of heavy metals and the sensitivity of the soil to heavy metals. In this study, the toxicity coefficients for the heavy metals Cd, Hg, As, Pb, Cr, Ni, Cu, and Zn were 30, 40, 10, 5, 2, 5, 5, and 1, respectively.
The RI for heavy metals is the sum of the individual risk factors for each heavy metal, and the calculation formula is as follows:
R I = i = 1 m E r i
The classification criteria for the two heavy metal pollution assessment methods mentioned above are shown in Table 1.

2.4.3. PMF Model

The PMF model was initially proposed by Paatero and Tapper and is recommended by the United States Environmental Protection Agency (EPA) for source apportionment. This method is an effective factor analysis model [36,37]. The formula can be written as
E n m = X n m k = 1 p G n p F p m
where Xnm is the m chemical components in n soil samples, p is the number of resolved sources, Gnp is the source contribution matrix, and Fpm is the source component spectral matrix. The elements in the matrices Gnp and Fpm are all positive, adhering to nonnegativity constraints. Throughout the calculation process, all the parameters are dimensionless.
PMF defines an objective function Q and minimizes this function’s value:
Q ( E ) = i = 1 m j = 1 n E i j / σ i j 2
where Eij is the residual of the i-th chemical component in the j-th sample and σij is the uncertainty associated with the i-th chemical component in the j-th sample. Throughout the calculation process, all the parameters are dimensionless.
The uncertainty calculation method is as follows:
When the concentration is less than or equal to the corresponding method detection limit (MDL):
U = 5 / 6 × M D L
When the concentration exceeds the corresponding MDL:
U = s × c 2 + 0.5 × M D L 2
where U is the uncertainty, s is the percentage error, c is the measured concentration of heavy metal elements (mg·kg−1), and MDL represents the concentration detection limit (mg·kg−1).

2.5. Data Processing and Analysis

The Igeo and RI were used for the assessment of heavy metal pollution and ecological risk, and the statistical analysis, correlation analysis, and PCA of the content data for the eight heavy metals were performed using IBM SPSS Statistics 27.0. The PMF model was constructed using PMF 5.0 from the U.S. EPA. Using the Inverse Distance Weighting (IDW) method in ArcGIS 10.8 software, we analyzed the heavy metal content at each sampling point and the contribution values from the PMF model. During the IDW processing, we reduced the weight of outliers to better reflect the overall trends of heavy metals and pollution source contributions in the study area’s soil. Box plots were generated via Origin 2022. Data recording was performed via Excel 2016.

3. Results and Discussion

3.1. Descriptive Statistics of the Soil Heavy Metal Content

The statistical characteristics of heavy metal content parameters in surface soil samples from the study area are shown in Table 2. The average contents of Cd, Hg, As, Pb, Cr, Ni, Cu, and Zn were 1.40 ± 2.67, 0.09 ± 0.04, 7.53 ± 8.24, 265.17 ± 750.35, 51.67 ± 37.27, 18.14 ± 11.81, 101.51 ± 252.58, and 198.37 ± 244.94 mg·kg−1, respectively, which are 25.89, 1.12, 1.30, 7.60, 1.25, 1.34, 4.70, and 2.40 times greater, respectively, than the background values of Fujian Province [38]. The proportion of points exceeding the background value was in the order of Cd (100.00%) > Pb (91.26%) > Cu (71.84%) > Zn (69.90%) > Ni (58.25%) > Cr (55.34%) > Hg (53.40%) > As (43.69%). This shows that the enrichment levels of heavy metals vary within the study area, with Cd, Pb, Ni, Cu, and Zn having higher degrees of enrichment. The coefficient of variation (CV) of soil heavy metals can reflect the extent to which soil heavy metals are influenced by external factors [39]. According to CV, all heavy metals belong to the highly variable category (CV > 45%), among which Pb, Cu, Cd, Zn, and As have variation degrees greater than 100%. Content analysis revealed that Cd, Pb, Cu, and Zn had high CVs and were significantly influenced by external activities [40]. The average pH of the soil in the study area was found to be 5.42 ± 0.59. According to the Soil Environmental Quality Agricultural Land Soil Pollution Risk Control Standard (Trial) (GB 15618-2018), under the condition of pH ≤ 5.5, the risk screening values for Cd, As, Pb, Cr, Cu, Ni, and Zn were all exceeded. Among these, the proportion of points where Cd, Pb, Cu, and Zn exceeded the screening values was over 25%, while Hg did not exceed the screening value.

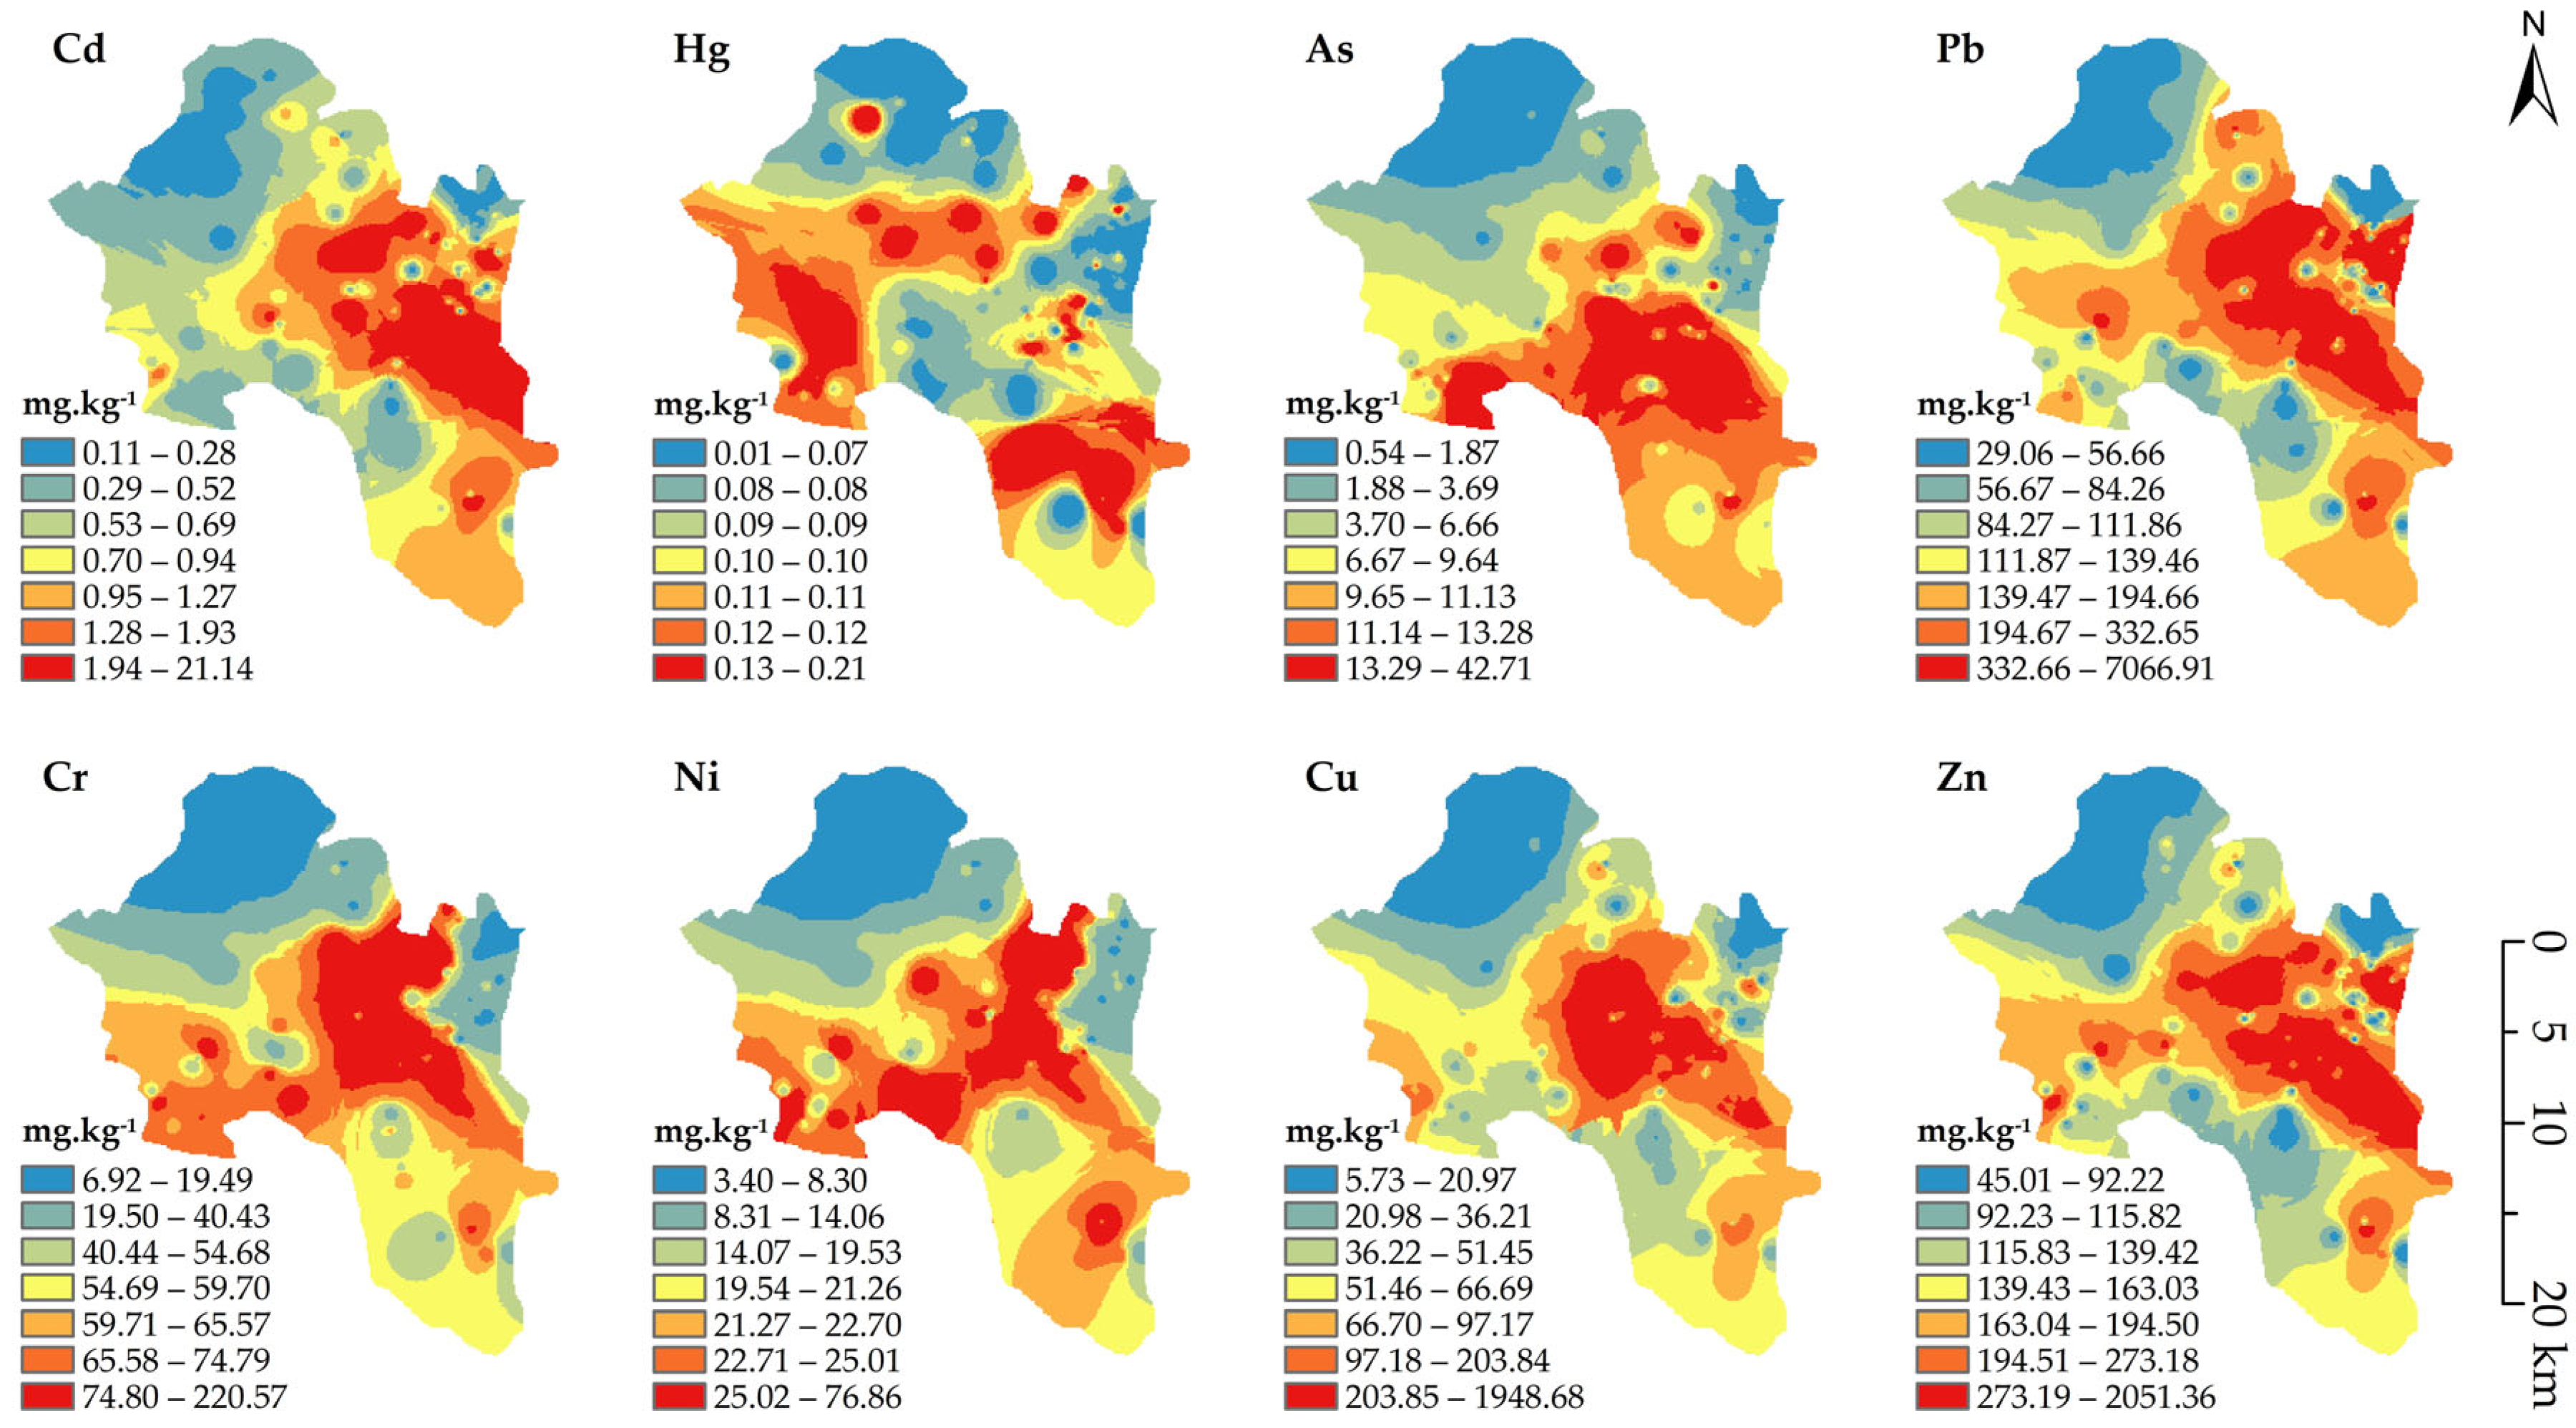
3.2. Distribution of Heavy Metal Pollution

Based on inverse distance weighted interpolation, the content of each heavy metal in the soil in the study area is plotted in Figure 2. The spatial distributions of Cd, Pb, and Zn in the soil were generally similar, with common high-value areas in the eastern, central, and southeastern regions of the study area. Ni and Cr exhibited similar spatial distribution characteristics, with relatively low coefficients of variation (Table 2), indicating minimal anthropogenic influence and suggesting that their distribution is primarily influenced by natural factors such as soil parent material. As and Cu showed similar overall spatial distributions, but As was found to be relatively uniformly distributed across the study area, with both elements having coefficients of variation exceeding 100% (Table 2), indicating significant anthropogenic influence. The high-value areas of Hg content differed from the other seven elements, appearing as low-value areas in the central region. High-value points were evenly distributed throughout the study area, and in the central-western region, they overlapped with high-value areas of Pb and Zn, suggesting that Hg may be influenced by multiple factors. The spatial distribution characteristics of soil heavy metals in the study area preliminarily reflect the potential situation of pollution sources, providing guidance for the subsequent accurate analysis of pollution sources.

3.3. Pollution and Risk Assessment

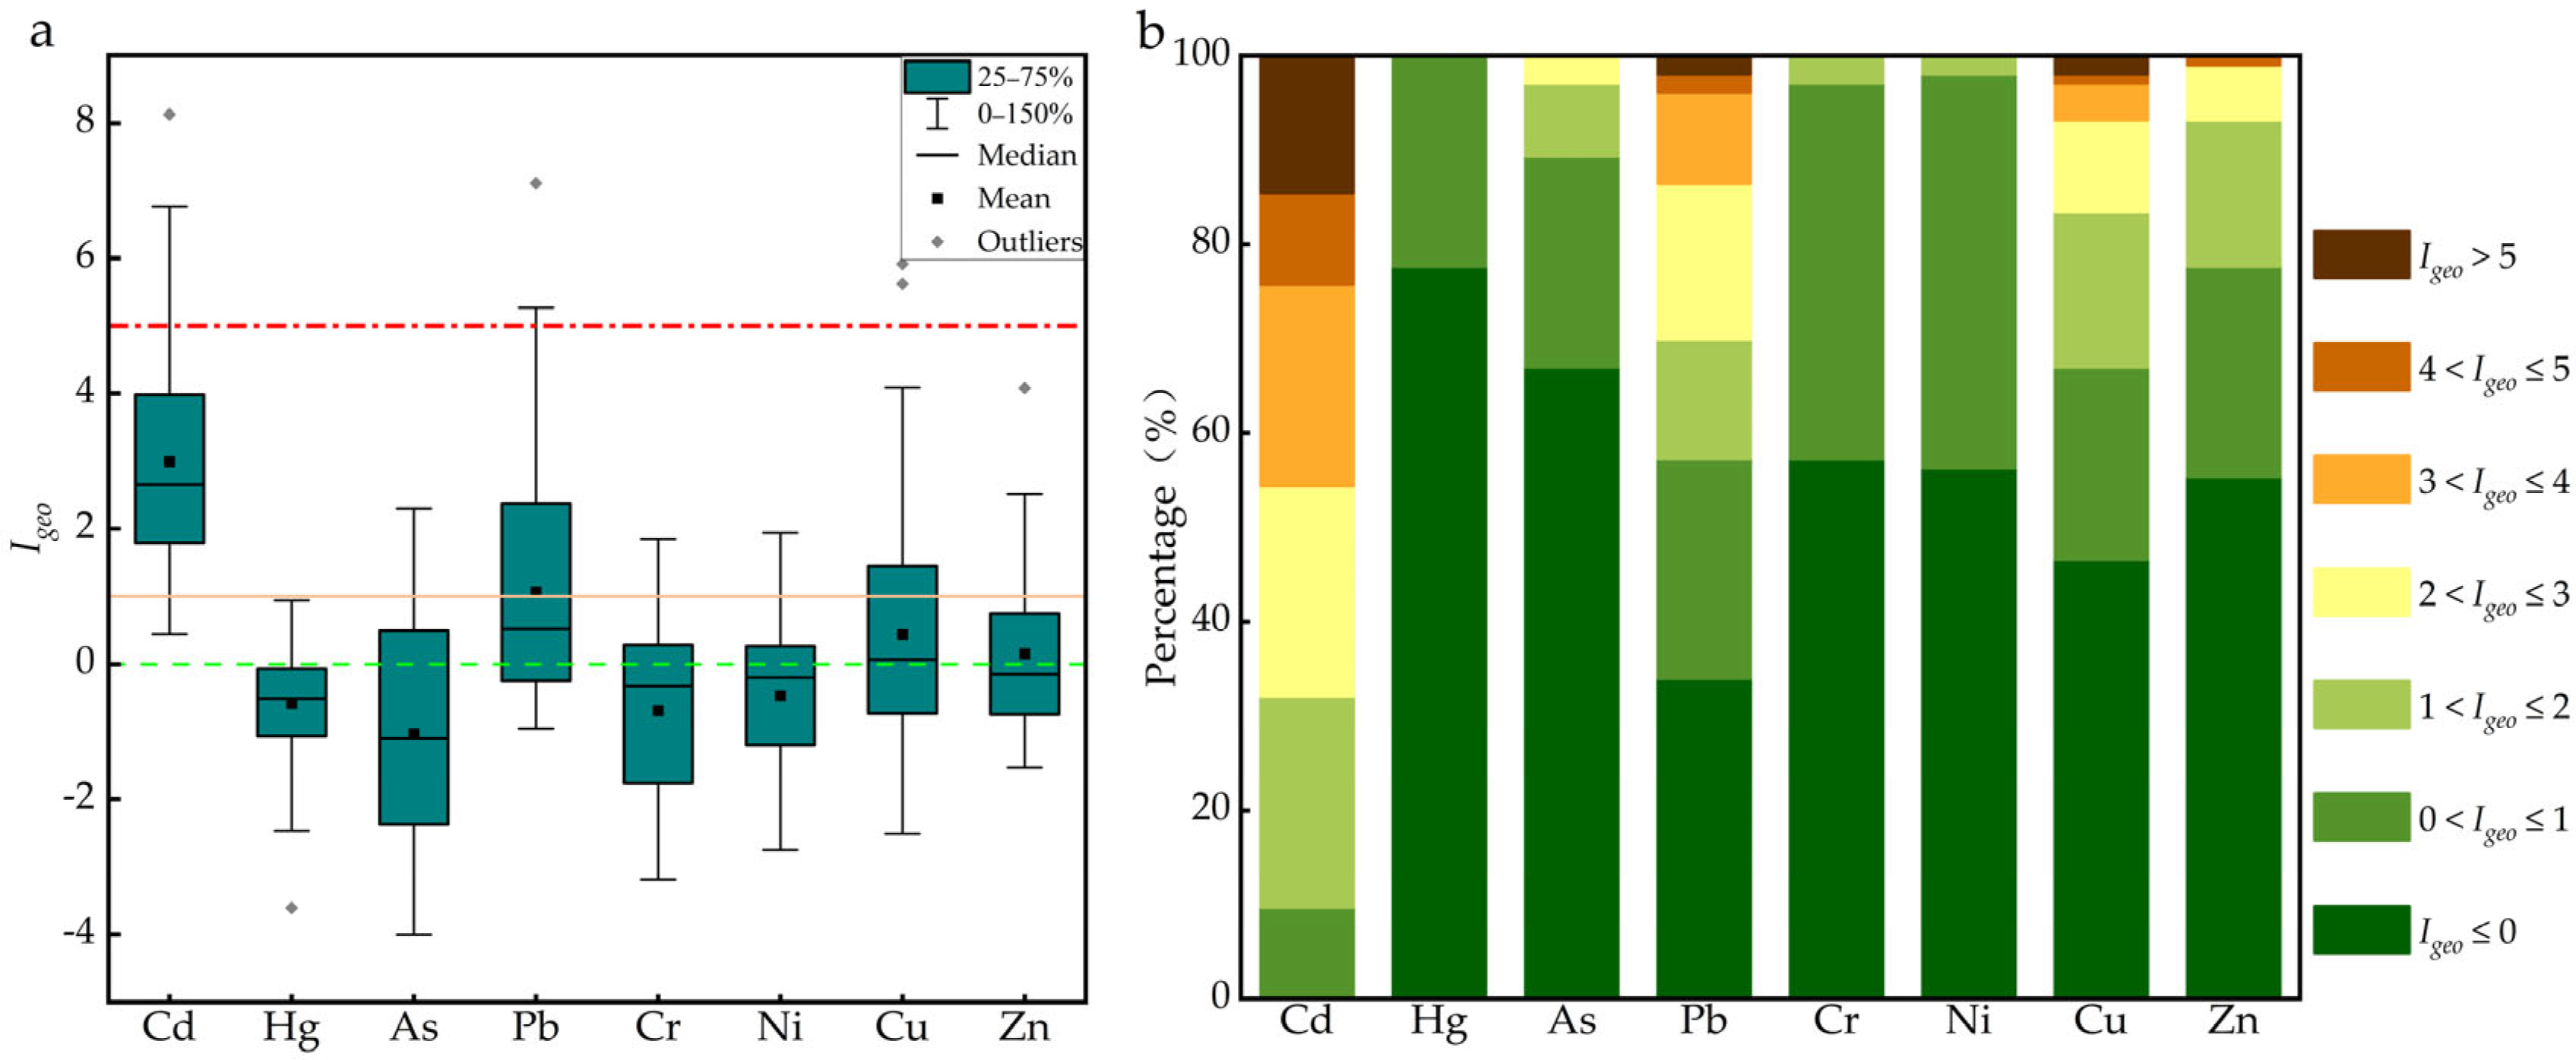
3.3.1. Geoaccumulation Index Values of the Heavy Metals

From the Igeo box plot results in Figure 3a, it is evident that among the 8 elements, Cd had the highest Igeo value with an average of 2.99. The average Igeo of Cd fell within the range of “moderately to heavily contaminated” (2 < Igeo ≤ 3), indicating a significant influence from anthropogenic factors. The average Igeo value for Pb in the study area was 1.06, categorizing it as “moderately contaminated” (1 < Igeo ≤ 2). The average values for Cu and Zn were 0.44 and 0.15, respectively, which fell within the “uncontaminated to moderately contaminated” range (0 < Igeo ≤ 1). The Igeo values for Hg, As, Cr, and Ni were relatively low, with average values all below 0. However, there were some high outliers, indicating that certain regions within the study area have been affected by anthropogenic factors.
From Figure 3b, it can be seen that the pollution levels of the eight elements can be classified into three groups. The first group includes Cd, which had the highest pollution level, with 90.30% of sites being moderately contaminated or higher (Igeo > 1) and 67.96% of sites being moderately to heavily contaminated or higher (Igeo > 2). The second group consisted of As, Pb, Cu, and Zn, where more than 10% of sites were moderately contaminated (Igeo > 1). The third group included Hg, Cr, and Ni, with over 97% of sites falling within the uncontaminated to moderately contaminated and uncontaminated categories (Igeo ≤ 1), indicating relatively low pollution levels.

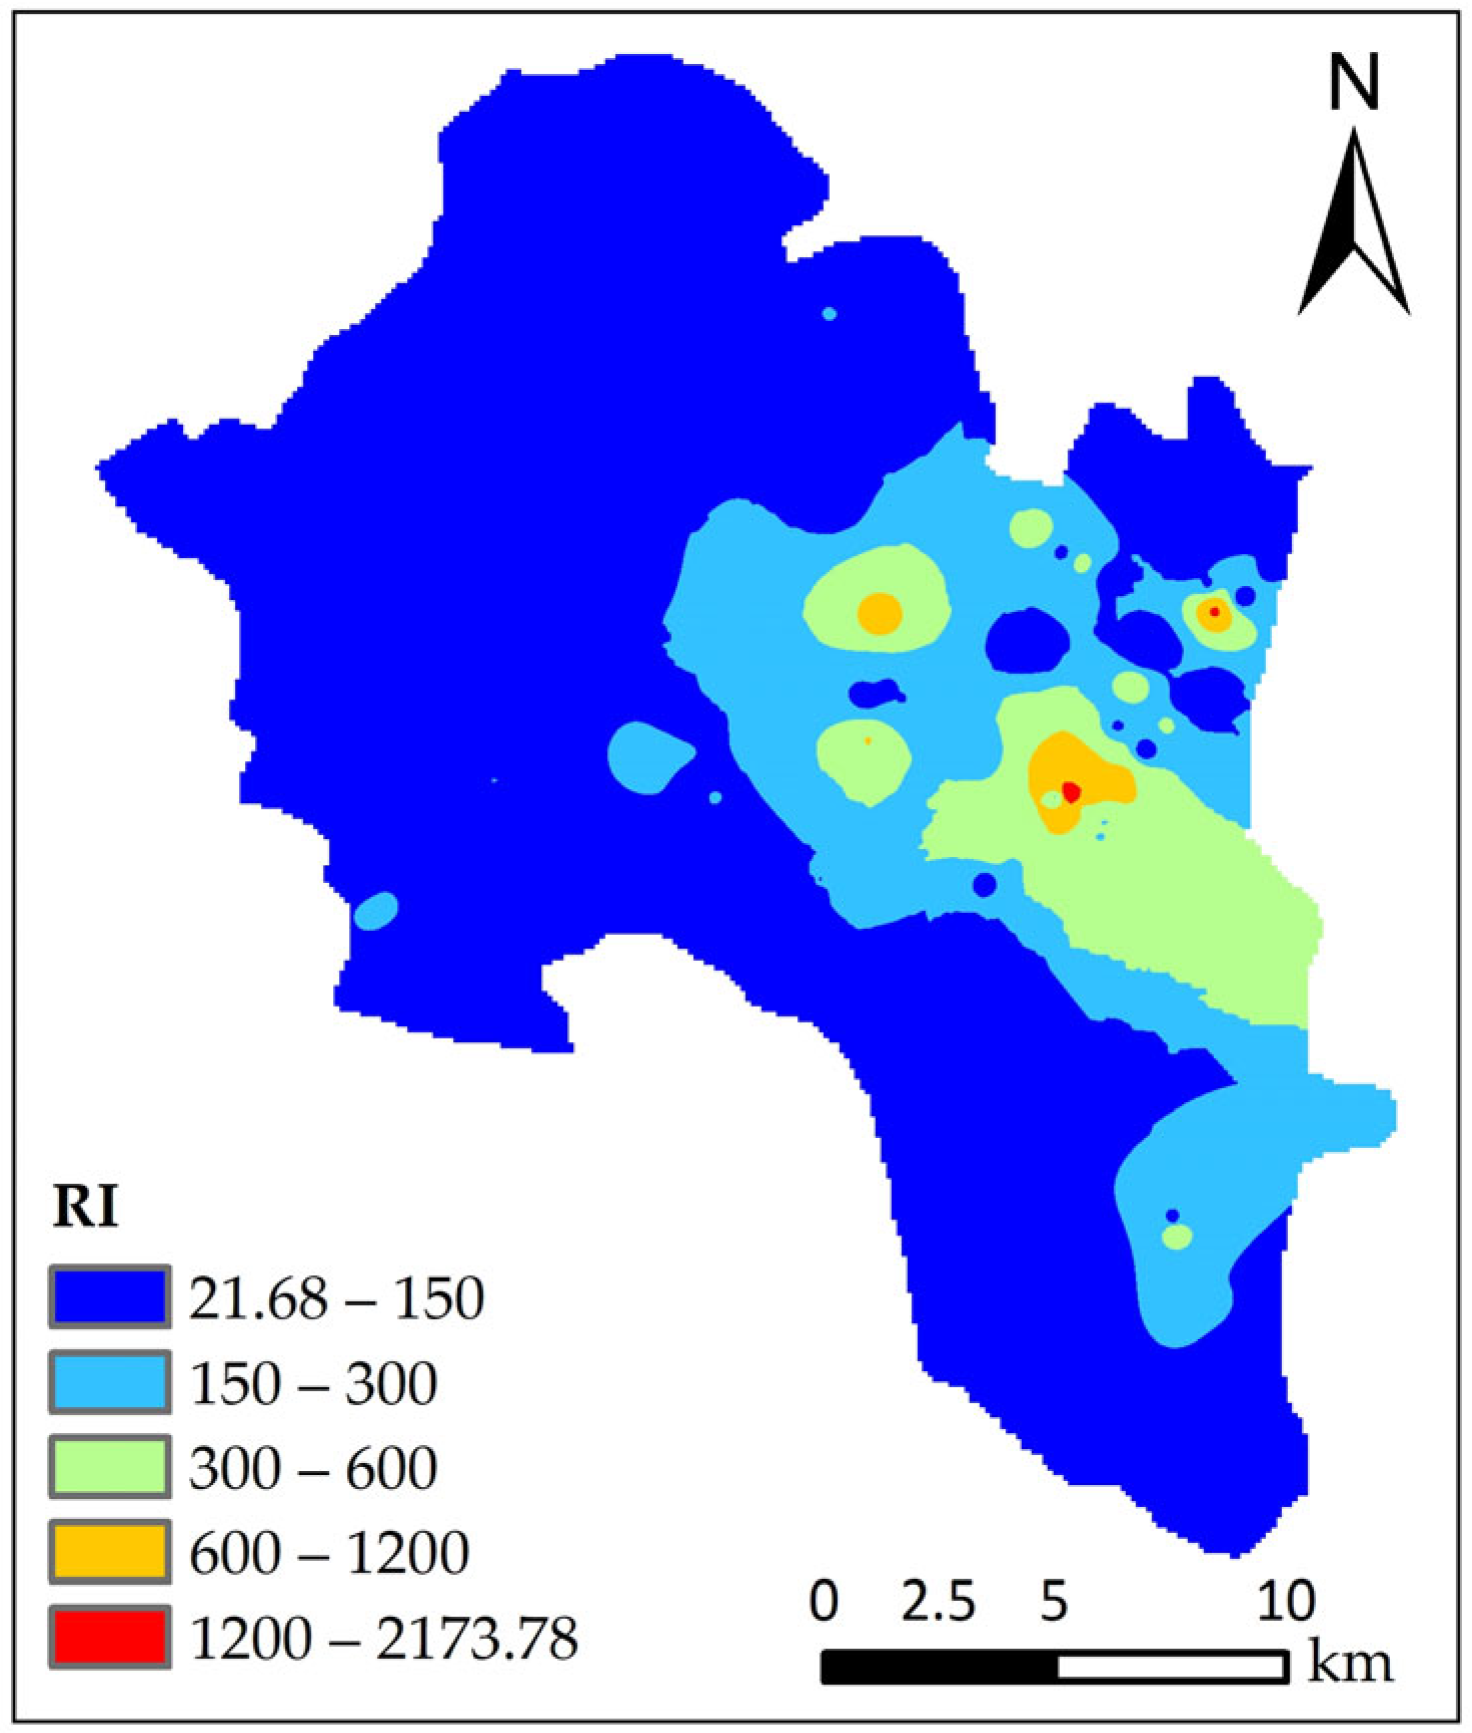
3.3.2. Ecological Risk Assessment of the Heavy Metals

The statistical results of the potential ecological risk of heavy metals in the soil samples are shown in Table 3. The table shows that Cd, Pb, and Cu had 62, 9, and 3 sampling points, respectively, with potential ecological risks reaching moderate or higher levels (Er ≥ 40), accounting for 60.19%, 8.74%, and 2.91%, respectively, of the total sampling points. The risk levels of the eight elements, in descending order, are Cd > Pb > Cu > Hg > As > Ni > Zn > Cr. There were 30 sampling points where the potential ecological risk level reached a moderate or higher risk level (RI ≥ 150), accounting for 29.13% of the total sampling points. From Figure 4, it can be observed that areas with an RI of 150 or higher were mainly distributed in the central-eastern and southern parts of the study area, while other areas exhibited relatively lower risk levels. These results indicate that the central-eastern and southern parts of the study area are at relatively higher ecological risk levels, necessitating targeted management measures for agricultural soils in these key regions to prevent ecological degradation and harm to the ecosystem.

3.4. Analysis of Soil Heavy Metal Pollution Sources

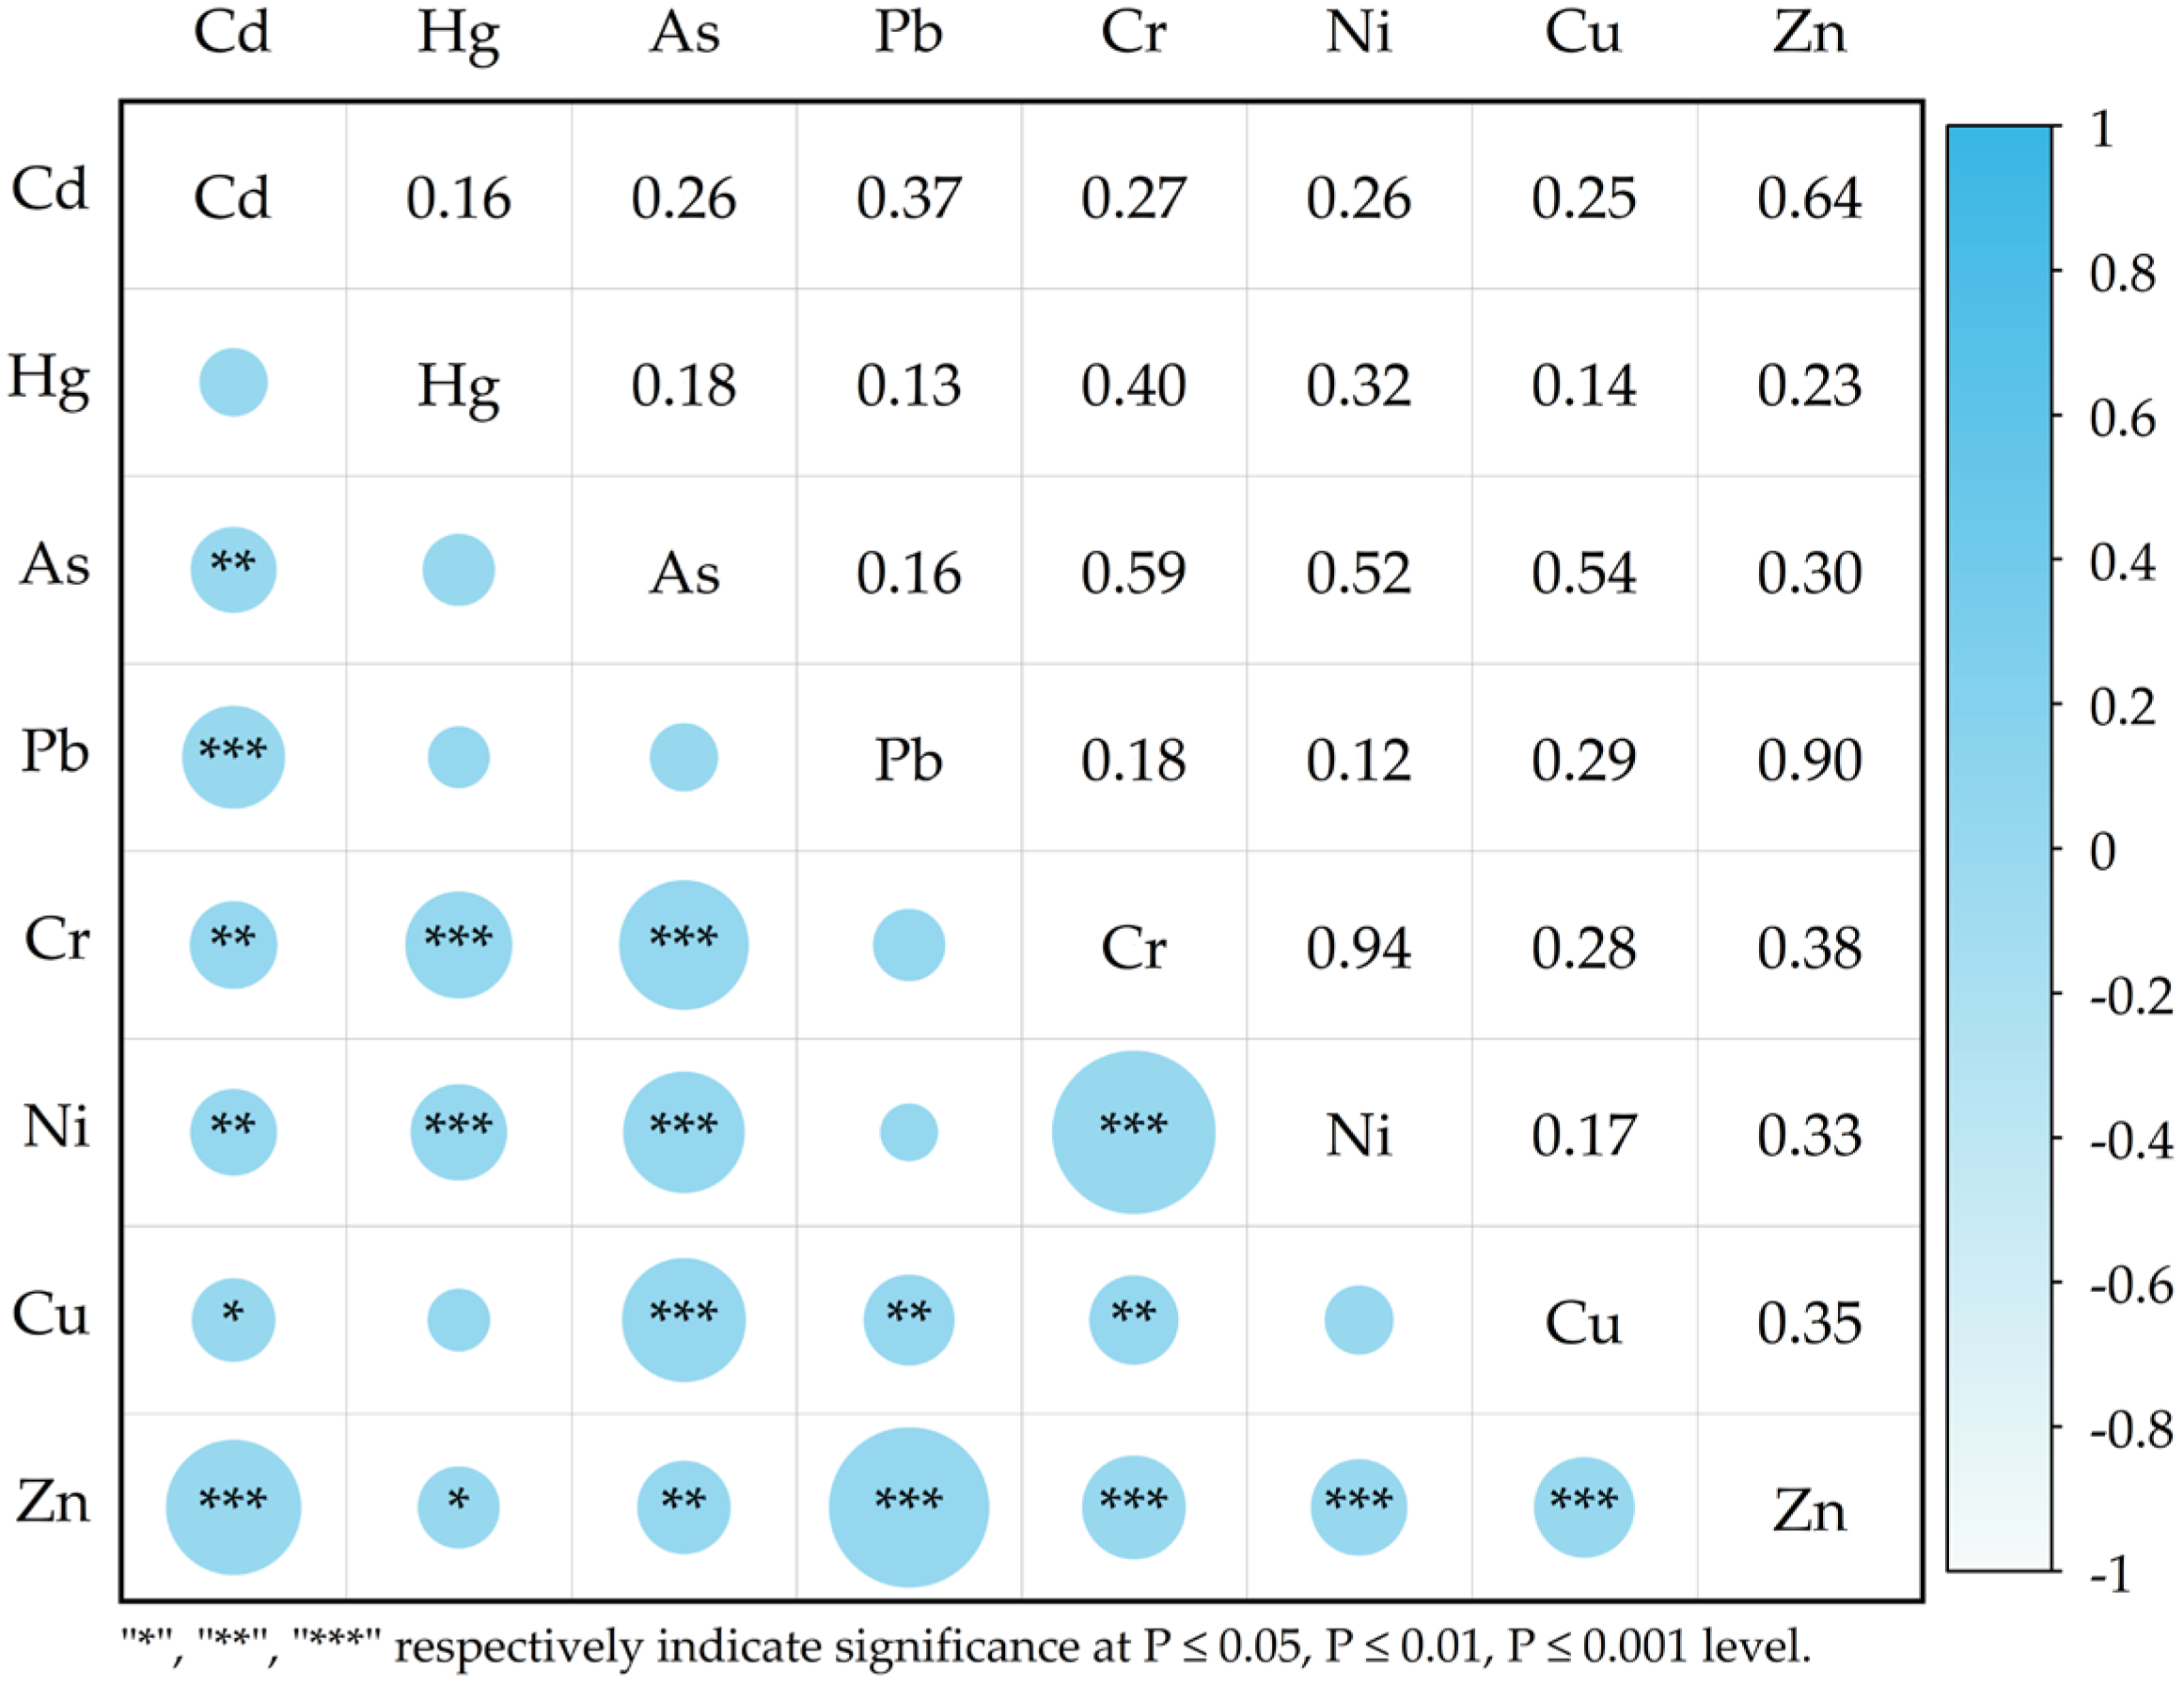
3.4.1. Correlation Analysis

Correlation analysis is a common method for identifying potential sources of soil heavy metal pollution in a region [41]. Correlation analysis can initially infer whether the sources of heavy metals are the same, laying the foundation for subsequent pollution source resolution [42]. If there is a significant correlation between multiple elements, they may have the same or similar sources. Correlation analysis of heavy metals in the study area, as shown in Figure 5, revealed a significant positive correlation between Pb and Zn (p < 0.001), with a correlation coefficient of 0.897, indicating the possible co-origin of Pb and Zn heavy metals. The correlation coefficients between As, Cr, and Ni were all greater than 0.5, indicating a significant positive correlation (p < 0.001) and suggesting that these three heavy metals may share the same or similar sources. Cd and Pb each showed weaker correlations with elements other than Zn but exhibited a significant positive correlation with Zn (p < 0.001), indicating that the sources of Cd and Pb differ from those of other elements excluding Zn or may involve antagonistic effects [43]. Additionally, Cu showed weaker correlations with elements other than As, indicating that the input of Cu in the study area is consistent with or co-originates with As. From the correlation analysis, it can be concluded that the sources of heavy metals in the study area are complex, and accurate source determination cannot be achieved solely through correlation. Thus, a model for resolution should be established.

3.4.2. Preliminary Analysis of Pollution Sources Based on PCA

Data processing was conducted using IBM SPSS Statistics 27.0 for the KMO and Bartlett tests. Table 4 shows that five principal components (PCs) were extracted when the cumulative variance contribution rate exceeded 90%. After verification, the KMO value was 0.588 (>0.5), and the Bartlett test had a significance level of p < 0.01, indicating good model fit. The results revealed that PC1 explained 43.78% of the variance, with As, Cr, and Ni exhibiting factor loadings greater than 0.5. Considering the high-value regions in the distribution map of heavy metal content (Figure 2), As, Cr, and Ni shared common hotspots and were predominantly located in the southeastern region of the study area. The overall cumulative indices of As, Cr, and Ni in the study area were all less than 0, with a relatively small proportion exceeding the background values. This suggests that these elements are primarily influenced by natural factors.
PC2 explained 20.43% of the total variance, with Pb and Zn exhibiting factor loadings greater than 0.5. Figure 2 shows that the two regions had similar high-value areas, which were mainly located in the central, western, eastern, and southern regions of the study area. This area is characterized by a significant presence of nonferrous metal and nonmetallic mineral zones, with lead–zinc mines being predominant. Additionally, there is a distribution of transportation networks. Production activities in mining areas and transportation activities generate waste residue, wastewater, and exhaust emissions that enter the soil, leading to the accumulation of heavy metals such as Pb and Zn in the soil.
PC3 was mainly loaded with As and Cu, explaining 12.73% of the total variance. Source apportionment studies have shown that As, Cu, and Cd are influenced primarily by domestic and agricultural pollution sources [44,45].
PC4 explained 9.81% of the total variance, with Cd as the primary element during loading, followed by Zn. According to Figure 2, the high-value areas are mainly distributed in the central and southeastern regions. This region is characterized by several chemical and heavy nonferrous metal-ore-processing enterprises. Research indicates that the coal industry and chemical enterprises are the main contributors to the accumulation of the heavy metals Cd and Zn in soil [46,47].
With Hg as the primary element in the loading, PC5 explained 7.92% of the total variance. According to Table 2, the proportion of Hg exceeding background values was relatively low. According to Figure 2, Hg was found to be uniformly distributed throughout the entire study area, with contiguous regions appearing in the western and southern areas, indicating human interference in certain areas. Numerous studies indicate that Hg is primarily influenced by human activities, with its main source being the generation of dust and emissions from coal combustion, which migrate and settle into the soil, affecting the accumulation of heavy metals in the soil [22,48,49].

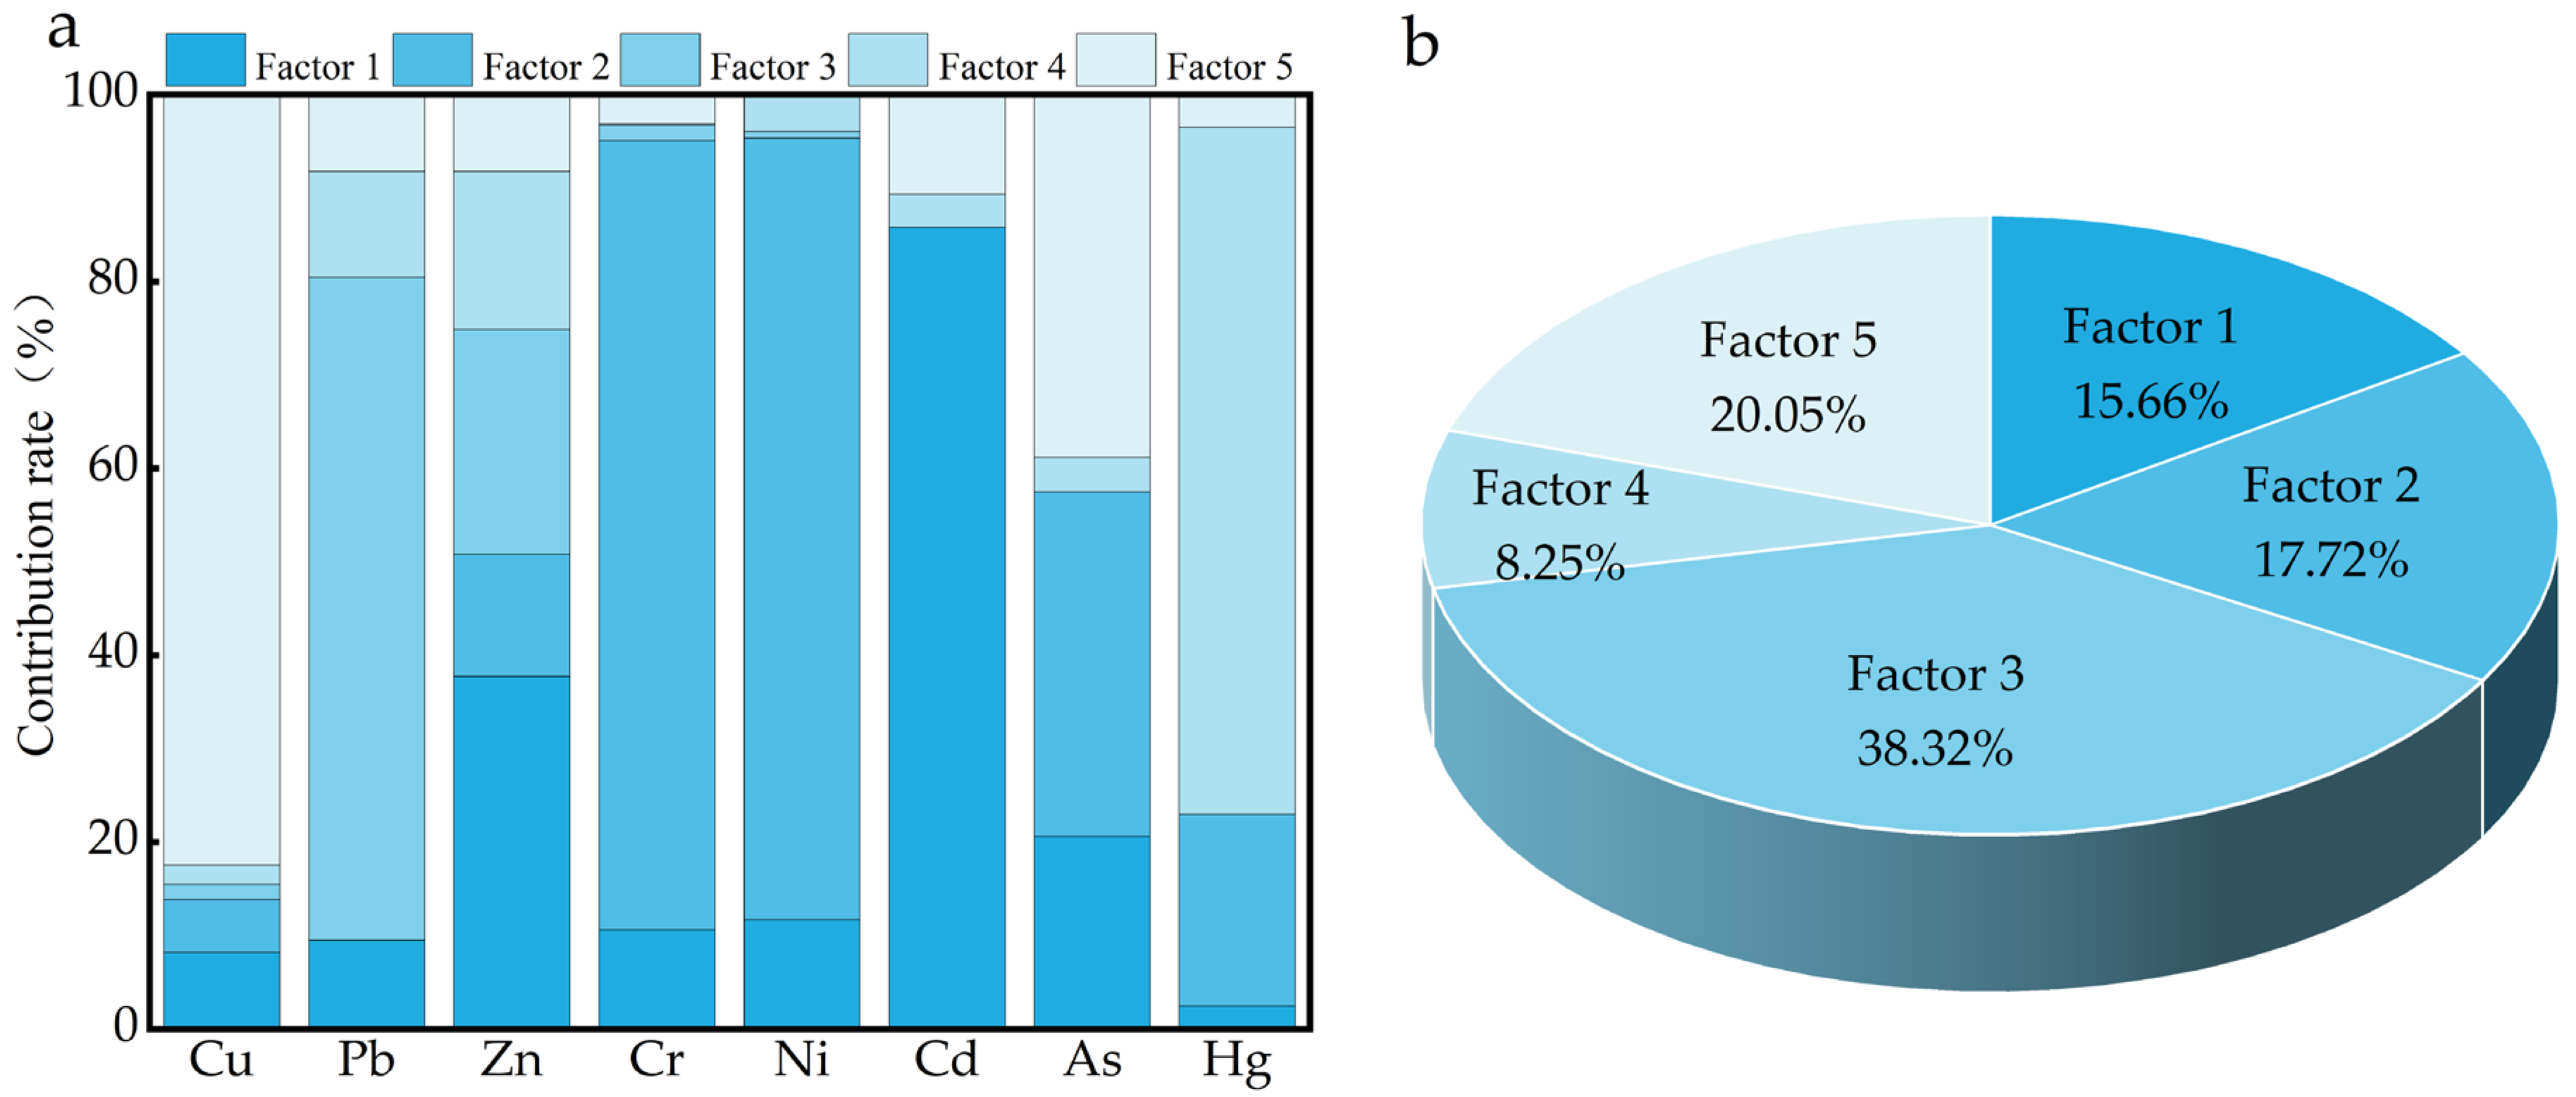
3.4.3. Source Apportionment Based on PMF

Quantitative source apportionment of various heavy metal elements in the research area was conducted using EPA PMF 5.0 software. The factor number was set between 3 and 7, with 20 runs. Through comparison, it was found that when the number of factors was 5, the predicted values best fit the actual values (Qrobust-to-Qtrue ratio above 0.9), with most fitting coefficients above 0.75, resulting in the most stable calculations. This indicates that the model’s analytical results effectively explain the input data [50]. The proportion of heavy metals contributed by each factor to the overall heavy metal content in the soil is illustrated in Figure 6a. The contributions of each factor obtained from the model analysis are shown in Figure 6b. Simultaneously, to identify high contribution areas for different factors, the normalized contribution scores of the factors were subjected to inverse distance weighting interpolation, resulting in spatial distribution maps of high contribution areas for each factor, as depicted in Figure 7.
According to Figure 6b, Factor 1 contributed 15.66% of the total heavy metals. Cd had the highest concentration within Factor 1, accounting for 85.79%, followed by Zn and As, with contribution rates of 37.73% and 20.59%, respectively (Table 5), which is similar to the main contributing elements in the PCA results for PC4. The high contribution area of Factor 1 is located in the central-eastern and southeastern parts of the study area (Figure 7). It is observed from the figure that there was a high overlap with heavy-metal-related enterprises surveyed on-site, and most of these enterprises are involved in the emission of the heavy metal Cd, preliminarily indicating metallurgical enterprises as pollution sources. The accumulation of Cd is usually closely associated with industrial production and is a significant pollutant in industrial processes [51]. Datian County is home to numerous metallurgical enterprises, including dozens of large and small nonferrous metal ore processing enterprises in the study area. These enterprises discharge substantial amounts of wastewater, waste residue, and exhaust gases. Wastewater flows southwards through discharge outlets into the Junxi River, posing a significant pollution risk to surrounding farmlands and downstream of enterprises. Xing et al. [14] analyzed the surface soil near the lead smelting plant in Jiyuan City and found a significant correlation between the distance from the main lead smelting plant facility and the total Cd and total Pb concentrations. A study by Dragović et al. [13] on the spatial distribution of heavy metals in the soil around Serbia’s largest steel production plant showed that Cd, Pb, and Zn have higher hotspot distributions near the steel plant. Xiao et al. [52] reported that Cd and Zn usually coexist around sites of metal smelting and electroplating enterprises. Therefore, Factor 1 is inferred to be a pollution source from metal smelting enterprises.
Factor 2 contributed 17.72% of the total heavy metals, with high concentrations of Cr and Ni contributing 84.48% and 83.63% to Factor 2, respectively, followed by As and Hg, with contribution rates of 36.89% and 20.50%, respectively (Table 5). This finding is consistent with the main contributing elements Cr, Ni, and As in the PCA results for component PC1. According to Table 2, the overall heavy metal pollution in the mining area is quite severe. However, the average values of Cr, Ni, As, and Hg were relatively low at 51.67, 18.14, 7.53, and 0.09 mg·kg−1, respectively, being slightly higher than the soil background values in Fujian Province. Apart from localized points exceeding the screening values for Cr, Ni, and As, the remaining points were below the screening values. Additionally, the areas with higher concentrations were mainly distributed in the central, western, southern, and northern farmland regions of the study area (Figure 7), suggesting that they may have a common origin or source. Some studies have indicated that Cr enters the soil matrix through rock weathering [15]. As and Ni can serve as indicators of natural sources of heavy metals, which are typically found in parent soil materials and play critical roles in soil formation processes [16,53]. This is consistent with the findings of Zhu et al. [30], suggesting that Cr, Ni, and As primarily originate from soil parent materials. Therefore, it is inferred that Factor 2 represents the natural source of soil parent material.
Factor 3 contributed 38.32% of the total heavy metals, with a high concentration of Pb in Factor 3, contributing 70.94%, followed by Zn, with a contribution rate of 24.04% (Table 5). The contributions of Pb and Zn from PC2 and Factor 3 suggest that they share a common source. The areas with high contribution values were primarily located in the western, eastern, southern, and north-central regions of the study area. Some studies suggest that in areas affected by lead–zinc mines, the presence of Pb, Zn, and Cu in the soil is primarily attributed to mining activities [17,19,54], where weathering and leaching of high lead–zinc ores result in the migration of heavy metals to surrounding soils. Furthermore, Pb mainly originates from leaded gasoline combustion, along with a significant increase in atmospheric Pb concentrations due to vehicular emissions [18,55]. In Figure 7 (Factor 3), the high contribution areas match well with mining sites, and the heatmap extrema appear near areas with numerous lead–zinc mines, indicating that Factor 3 is significantly influenced by mining activities. Additionally, the southeastern and northwestern regions of the study area have highways running from south to north, and railways pass through the southern region; these areas also show high contribution levels. In summary, Factor 3 is influenced by a combination of mining activities and traffic pollution sources. Therefore, it is inferred that Factor 3 originates from a mixed source of mineral extraction and traffic pollution.
Factor 4 contributed 8.25% of the total heavy metals, with a high concentration of Hg in Factor 4, contributing 73.50%, which was significantly greater than the contribution rates of the other elements. This finding is similar to the PC5 results but contributed 16.89% of the total Zn (Table 5). Atmospheric transport is a crucial pathway for Hg to enter the soil environment [22]. Studies have shown [20,21,56] that Hg, with its volatile nature and susceptibility to atmospheric transport, can ultimately enter the soil through dry and wet deposition, a characteristic not shared by other heavy metal elements. Human activities such as nonferrous metal smelting and coal combustion can accelerate the accumulation of soil Hg deposition [57]. From Figure 7 (Factor 4), it can be seen that the high-value areas of Factor 4 were mainly distributed in the northwest and south of the study area, with scattered high-value points throughout the region. The prevailing wind direction in the study area is southeast, and the high contribution areas roughly align with the downwind direction of air heavy metal pollution enterprises shown in the figure. In a study by Schneider et al. [23] on a major coal mining area in Australia, it was concluded that the primary source of Hg in the soil is atmospheric emissions of mercury from coal-fired power plants. Therefore, it is inferred that Factor 4 represents atmospheric deposition sources primarily from atmospheric heavy metal emissions.
Factor 5 contributed 20.05% of the total heavy metals, with Cu having higher concentration values in Factor 5, contributing up to 82.46%. Furthermore, the contribution rates of As and Cd were 38.82% and 10.67%, respectively (Table 5), which is similar to the results of PC3. Cu has the highest contribution rate, followed by As. The high contribution area of Factor 5 lies in the central-eastern and southeastern regions of the study area, as well as the central-western region. From Figure 7 (Factor 5), it can be observed that livestock enterprises match well with high-contribution areas. Additionally, most farmers raise poultry such as pigs, rabbits, and sheep, and they apply untreated animal manure to farmland. Zhen et al. [58] reported that 69%, 51%, and 55% of the total input of the heavy metals Cu, Zn, and Cd, respectively, in Chinese agricultural soil comes from livestock manure. The intensive and continuous application of organic fertilizers increases the soil pollution levels of Cu, Zn, Cd, and Cr. Huang et al. [59] studied China’s major vegetable-producing regions and found that 10.3% of commercial chicken manure samples exceeded the cadmium concentration limit, and the average concentrations of Cu and Zn in the samples were 143 mg·kg−1 and 331 mg·kg−1, respectively. Additionally, pesticides and chemical fertilizers are important sources of Cd and As in the soil [60,61,62]. In a study by Varol et al. [63] on the potential sources of agricultural heavy metals in Malatya Province, located in the upper Euphrates Basin in eastern Anatolia, it was concluded that As and Cu primarily originate from anthropogenic sources (fertilizers and pesticides). Therefore, it is inferred that Factor 5 represents agricultural pollution sources primarily from untreated livestock manure and the application of pesticides and fertilizers.
Based on the above analysis, the results from the PMF model corroborate those from PCA. The main sources of heavy metal enrichment in the study area are from five potential sources: metal smelting enterprises sources, soil parent material sources, mixed sources of mineral extraction and traffic pollution, atmospheric deposition sources, and agricultural pollution sources, which contributed 15.66%, 17.72%, 38.32%, 8.25%, and 20.05% of the heavy metals, respectively. Cd is primarily influenced by metal smelting enterprise sources (85.79%); Cr and Ni are mainly affected by soil parent material sources (84.48%, 83.63%); Pb is predominantly impacted by mixed sources of mineral extraction and traffic pollution (70.94%); Hg by atmospheric deposition sources (73.50%); Cu by agricultural pollution sources (82.46%); Zn by a combination of metal smelting enterprises sources (37.73%), mixed sources of mineral extraction and traffic pollution (24.04%), and atmospheric deposition sources (16.89%); and As is influenced by a mixture of metal smelting enterprises sources (20.59%), soil parent material sources (36.89%), and agricultural pollution sources (38.82%). Zhang et al. [64] conducted source apportionment on the main pollutants in the soil of 15 lead–zinc mining areas in 6 provinces of South China and found that Cd and Zn mainly originate from smelting sources; Pb mainly comes from transportation and mining sources; As and Cu mainly originate from flux sources; and Cr, Ni, and Sb mainly originate from natural sources. This is consistent with the results of our research. Hu et al. [65] reported in their study on the quantitative sources of heavy metals in farmland soils in Handan that Cd and Pb in agricultural soils mainly originate from industrial sources; Fe, Cr, V, Cu, Ni, and Mn mainly originate from rock sources; and Co, As, and Zn mainly originate from a mixture of natural background, agricultural sources, and motor vehicle emissions. There are some differences in the results of our research, where Cr and Ni mainly originate from soil parent materials, and agriculture and animal husbandry are the main contributors to Cu. These variations in source apportionment results across different studies highlight the spatial heterogeneity and uncertainty of soil heavy metal levels, emphasizing the importance of precise source apportionment for pollution control.

4. Conclusions

This research concentrates on a mineral aggregation area in Datian County, Sanming City. It employs a comprehensive suite of methodologies, including geostatistics, heavy metal ecological risk assessment methods, PCA, and the PMF model, to investigate the distribution patterns of soil heavy metals, conduct ecological risk assessments, and execute source apportionment. The findings indicate that the mean concentrations of heavy metals follow the sequence of Pb > Zn > Cu > Cr > Ni > As > Cd > Hg, all surpassing the soil background values of Fujian Province. Cd, Pb, and Cu exhibited markedly higher concentrations than the background values, at 25.89, 7.60, and 4.70 times the baseline levels, respectively. Igeo analysis shows the accumulation levels of heavy metals are ranked as follows: Cd > Pb > Cu > Zn > Ni > Hg > Cr > As. Er results indicate that the ecological risks of Cd, Pb, and Cu reaching moderate or higher Risk levels accounted for 60.19%, 8.74%, and 2.91%, respectively. Additionally, 29.13% of soil sampling points had an RI at moderate or higher levels. The main sources of heavy metal enrichment in the study area were found to be metal smelting enterprises sources (15.66%), soil parent material sources (17.72%), mixed sources of mineral extraction and traffic pollution (38.32%), atmospheric deposition sources (8.25%), and agricultural pollution sources (20.05%).
The main purpose of this study was to investigate the impact of pollution sources on farmland. For unsampled areas, the spatial distribution characteristics of soil heavy metals were studied using the IDW method, which may introduce a certain degree of subjectivity and limitations. Additionally, the results of the PMF model require interpretation and analysis, which may involve some degree of subjective judgment and could lead to different conclusions by different researchers. Despite these limitations, under appropriate data conditions, combined with other methods and techniques for comprehensive analysis and interpretation, the PMF model remains an effective method for source apportionment of soil heavy metal pollution. To better protect the environment, future efforts could integrate soil heavy metal research with environmental management and pollution control, exploring effective pollution control measures and providing scientific basis for environmental protection.

Author Contributions

Conceptualization, Z.H. and J.W.; methodology, A.L.; software, X.D.; validation, J.W., X.L. and L.L.; formal analysis, H.S.; investigation, T.Y.; resources, H.S.; data curation, Y.Z.; writing—original draft preparation, J.W.; writing—review and editing, Z.H.; visualization, X.L.; supervision, X.D.; project administration, Z.H.; funding acquisition, Z.H. All authors have read and agreed to the published version of the manuscript.

Funding

This work has received joint funding from the National Key Technology R&D Program of China (2022YFC3704805), the National Natural Science Foundation of China (42377259), and the Joint Research on Yangtze River Ecological Environment Protection and Restoration (Phase II) (2022-LHYJ-02-0404).

Informed Consent Statement

Not applicable.

Data Availability Statement

The datasets used and/or analyzed during the current study are available from the corresponding author upon reasonable request.

Acknowledgments

The authors gratefully acknowledge the staff for their assistance during the sample collection and laboratory work.

Conflicts of Interest

The authors declare that they have no known competing financial interests or personal relationships that could have appeared to influence the work reported in this paper.

References

  1. Wang, Y.; Duan, X.; Wang, L. Spatial distribution and source analysis of heavy metals in soils influenced by industrial enterprise distribution: Case study in Jiangsu Province. Sci. Total Environ. 2020, 710, 134953. [Google Scholar] [CrossRef] [PubMed]
  2. Liao, S.; Jin, G.; Khan, M.A.; Zhu, Y.; Duan, L.; Luo, W.; Jia, J.; Zhong, B.; Ma, J.; Ye, Z.; et al. The quantitative source apportionment of heavy metals in peri-urban agricultural soils with UNMIX and input fluxes analysis. Environ. Technol. Innov. 2021, 21, 101232. [Google Scholar] [CrossRef]
  3. González-Morales, M.; Fernández-Pozo, L.; Rodríguez-González, M.Á. Threats of metal mining on ecosystem services. Conservation proposals. Environ. Res. 2022, 214, 114036. [Google Scholar] [CrossRef] [PubMed]
  4. Deng, Y.; Jiang, L.; Xu, L.; Hao, X.; Zhang, S.; Xu, M.; Zhu, P.; Fu, S.; Liang, Y.; Yin, H.; et al. Spatial distribution and risk assessment of heavy metals in contaminated paddy fields—A case study in Xiangtan City, southern China. Ecotoxicol. Environ. Saf. 2019, 171, 281–289. [Google Scholar] [CrossRef] [PubMed]
  5. Upadhyay, V.; Kumari, A.; Kumar, S. From soil to health hazards: Heavy metals contamination in northern India and health risk assessment. Chemosphere 2024, 354, 141697. [Google Scholar] [CrossRef] [PubMed]
  6. Yang, J.; Sun, Y.; Wang, Z.; Gong, J.; Gao, J.; Tang, S.; Ma, S.; Duan, Z. Heavy metal pollution in agricultural soils of a typical volcanic area: Risk assessment and source appointment. Chemosphere 2022, 304, 135340. [Google Scholar] [CrossRef] [PubMed]
  7. Cheng, S. Heavy metal pollution in China: Origin, pattern and control. Environ. Sci. Pollut. Res. Int. 2003, 10, 192–198. [Google Scholar] [CrossRef] [PubMed]
  8. Pan, H.; Lu, X.; Lei, K. A comprehensive analysis of heavy metals in urban road dust of Xi’an, China: Contamination, source apportionment and spatial distribution. Sci. Total Environ. 2017, 609, 1361–1369. [Google Scholar] [CrossRef]
  9. FAO; UNEP. Global Food Systems and Environmental Impact; FAO: Rome, Italy, 2021. [Google Scholar]
  10. Huang, G.; Wang, X.; Chen, D.; Wang, Y.; Zhu, S.; Zhang, T.; Liao, L.; Tian, Z.; Wei, N. A hybrid data-driven framework for diagnosing contributing factors for soil heavy metal contaminations using machine learning and spatial clustering analysis. J. Hazard. Mater. 2022, 437, 129324. [Google Scholar] [CrossRef]
  11. Li, Y.; Kuang, H.; Hu, C.; Ge, G. Source Apportionment of Heavy Metal Pollution in Agricultural Soils around the Poyang Lake Region Using UNMIX Model. Sustainability 2021, 13, 5272. [Google Scholar] [CrossRef]
  12. Martinková, E.; Kochergina, Y.V.E.; Šebek, O.; Seibert, R.; Chrastný, V.; Novák, M.; Štěpánová, M.; Čuřík, J.; Pacherová, P.; Přechová, E.; et al. Winter-time pollution in Central European cities shifts the 208Pb/207Pb isotope ratio of atmospheric PM2.5 to higher values: Implications for lead source apportionment. Atmos. Environ. 2023, 310, 119941. [Google Scholar] [CrossRef]
  13. Dragović, S.; Smičiklas, I.; Jović, M.; Čupić, A.; Dragović, R.; Gajić, B.; Onjia, A. Spatial distribution and source apportionment of DTPA-extractable metals in soils surrounding the largest Serbian steel production plant. Heliyon 2023, 9, e16307. [Google Scholar] [CrossRef] [PubMed]
  14. Xing, W.; Zheng, Y.; Scheckel, K.G.; Luo, Y.; Li, L. Spatial distribution of smelter emission heavy metals on farmland soil. Environ. Monit. Assess. 2019, 191, 115. [Google Scholar] [CrossRef] [PubMed]
  15. Xiao, J.; Chen, W.; Wang, L.; Zhang, X.; Wen, Y.; Bostick, B.C.; Wen, Y.; He, X.; Zhang, L.; Zhuo, X.-J.; et al. New strategy for exploring the accumulation of heavy metals in soils derived from different parent materials in the karst region of southwestern China. Geoderma 2022, 417, 115806. [Google Scholar] [CrossRef]
  16. Jin, Y.; O’Connor, D.; Ok, Y.S.; Tsang, D.C.W.; Liu, A.; Hou, D. Assessment of sources of heavy metals in soil and dust at children’s playgrounds in Beijing using GIS and multivariate statistical analysis. Environ. Int. 2019, 124, 320–328. [Google Scholar] [CrossRef]
  17. Forghani Tehrani, G.; Rubinos, D.A.; Kelm, U.; Ghadimi, S. Environmental and human health risks of potentially harmful elements in mining-impacted soils: A case study of the Angouran Zn–Pb Mine, Iran. J. Environ. Manag. 2023, 334, 117470. [Google Scholar] [CrossRef]
  18. Fei, X.F.; Lou, Z.H.; Xiao, R.; Ren, Z.Q.; Lv, X.N. Contamination assessment and source apportionment of heavy metals in agricultural soil through the synthesis of PMF and GeogDetector models. Sci. Total Environ. 2020, 747, 141293. [Google Scholar] [CrossRef]
  19. Haghighizadeh, A.; Rajabi, O.; Nezarat, A.; Hajyani, Z.; Haghmohammadi, M.; Hedayatikhah, S.; Asl, S.D.; Aghababai Beni, A. Comprehensive analysis of heavy metal soil contamination in mining Environments: Impacts, monitoring Techniques, and remediation strategies. Arab. J. Chem. 2024, 17, 105777. [Google Scholar] [CrossRef]
  20. Ma, W.; Tai, L.; Qiao, Z.; Zhong, L.; Wang, Z.; Fu, K.; Chen, G. Contamination source apportionment and health risk assessment of heavy metals in soil around municipal solid waste incinerator: A case study in North China. Sci. Total Environ. 2018, 631–632, 348–357. [Google Scholar] [CrossRef]
  21. Li, X.; Zhang, R.; Tripathee, L.; Yu, F.; Guo, J.; Yang, W.; Guo, J.; Kang, S.; Cao, J. Characteristics, sources, and health risk assessment of atmospheric particulate mercury in Guanzhong Basin. Environ. Pollut. 2024, 342, 123071. [Google Scholar] [CrossRef]
  22. Shan, B.; Wang, G.; Cao, F.; Wu, D.; Liang, W.; Sun, R. Mercury emission from underground coal fires in the mining goaf of the Wuda Coalfield, China. Ecotoxicol. Environ. Saf. 2019, 182, 109409. [Google Scholar] [CrossRef] [PubMed]
  23. Schneider, L.; Rose, N.L.; Myllyvirta, L.; Haberle, S.; Lintern, A.; Yuan, J.; Sinclair, D.; Holley, C.; Zawadzki, A.; Sun, R. Mercury atmospheric emission, deposition and isotopic fingerprinting from major coal-fired power plants in Australia: Insights from palaeo-environmental analysis from sediment cores. Environ. Pollut. 2021, 287, 117596. [Google Scholar] [CrossRef] [PubMed]
  24. Shao, F.; Li, K.; Ouyang, D.; Zhou, J.; Luo, Y.; Zhang, H. Sources apportionments of heavy metal(loid)s in the farmland soils close to industrial parks: Integrated application of positive matrix factorization (PMF) and cadmium isotopic fractionation. Sci. Total Environ. 2024, 924, 171598. [Google Scholar] [CrossRef] [PubMed]
  25. Zhou, H.; Yue, X.; Chen, Y.; Liu, Y. Source-specific probabilistic contamination risk and health risk assessment of soil heavy metals in a typical ancient mining area. Sci. Total Environ. 2024, 906, 167772. [Google Scholar] [CrossRef]
  26. Liu, Z.; Fei, Y.; Shi, H.; Mo, L.; Qi, J. Prediction of high-risk areas of soil heavy metal pollution with multiple factors on a large scale in industrial agglomeration areas. Sci. Total Environ. 2022, 808, 151874. [Google Scholar] [CrossRef] [PubMed]
  27. Chen, C.; Fujian Provincial Local Chronicles Compilation Committee. Dadian County Annals; Xiamen University Press: Xiamen, China, 2009. [Google Scholar]
  28. HJ/T 166-2004; The Technical Specification for Soil Environmental Monitoring. Ministry of Ecology and Environment of the People’s Republic of China: Beijing, China, 2004.
  29. Muller, G. Index of Geoaccumulation in Sediments of the Rhine River. GeoJournal 1969, 2, 109–118. [Google Scholar]
  30. Zhu, Y.; An, Y.; Li, X.; Cheng, L.; Lv, S. Geochemical characteristics and health risks of heavy metals in agricultural soils and crops from a coal mining area in Anhui province, China. Environ. Res. 2024, 241, 117670. [Google Scholar] [CrossRef]
  31. Hakanson, L. An ecological risk index for aquatic pollution control. A sedimentological approach. Water Res. 1980, 14, 975–1001. [Google Scholar] [CrossRef]
  32. Yan, F.; Li, N.; Wang, J.; Wu, H. Ecological footprint model of heavy metal pollution in water environment based on the potential ecological risk index. J. Environ. Manag. 2023, 344, 118708. [Google Scholar] [CrossRef]
  33. Ahamad, M.I.; Song, J.X.; Sun, H.T.; Wang, X.X.; Mehmood, M.S.; Sajid, M.; Su, P.; Khan, A.J. Contamination Level, Ecological Risk, and Source Identification of Heavy Metals in the Hyporheic Zone of the Weihe River, China. Int. J. Environ. Res. Public Health 2020, 17, 1070. [Google Scholar] [CrossRef]
  34. Pan, L.B.; Wang, Y.; Ma, J.; Hu, Y.; Su, B.Y.; Fang, G.L.; Wang, L.; Xiang, B. A review of heavy metal pollution levels and health risk assessment of urban soils in Chinese cities. Environ. Sci. Pollut. Res. 2018, 25, 1055–1069. [Google Scholar] [CrossRef] [PubMed]
  35. GB 15618-2018; Soil Environmental Quality Risk Control Standard for Soil Contamination of Agricultural Land. Ministry of Ecology and Environment of the People’s Republic of China: Beijing, China, 2018.
  36. Wu, J.; Li, J.; Teng, Y.; Chen, H.; Wang, Y. A partition computing-based positive matrix factorization (PC-PMF) approach for the source apportionment of agricultural soil heavy metal contents and associated health risks. J. Hazard. Mater. 2020, 388, 121766. [Google Scholar] [CrossRef] [PubMed]
  37. Paatero, P.; Tapper, U. Positive matrix factorization: A non-negative factor model with optimal utilization of error estimates of data values. Environmetrics 1994, 5, 111–126. [Google Scholar] [CrossRef]
  38. Chen, J.; Wei, F.; Zheng, C.; Wu, Y.; Adriano, D.C. Background concentrations of elements in soils of China. Water Air Soil Pollut. 1991, 57–58, 699–712. [Google Scholar] [CrossRef]
  39. Whelen, T.; Siqueira, P. Coefficient of variation for use in crop area classification across multiple climates. Int. J. Appl. Earth Obs. Geoinf. 2018, 67, 114–122. [Google Scholar] [CrossRef]
  40. Islam, M.S.; Hossain, M.B.; Matin, A.; Sarker, M.S.I. Assessment of heavy metal pollution, distribution and source apportionment in the sediment from Feni River estuary, Bangladesh. Chemosphere 2018, 202, 25–32. [Google Scholar] [CrossRef] [PubMed]
  41. Marrugo-Negrete, J.; Pinedo-Hernández, J.; Díez, S. Assessment of heavy metal pollution, spatial distribution and origin in agricultural soils along the Sinú River Basin, Colombia. Environ. Res. 2017, 154, 380–388. [Google Scholar] [CrossRef] [PubMed]
  42. Liang, J.; Liu, Z.; Tian, Y.; Shi, H.; Fei, Y.; Qi, J.; Mo, L. Research on health risk assessment of heavy metals in soil based on multi-factor source apportionment: A case study in Guangdong Province, China. Sci. Total Environ. 2023, 858, 159991. [Google Scholar] [CrossRef]
  43. Liu, B.; Zhao, S.; Qiu, T.; Cui, Q.; Yang, Y.; Li, L.; Chen, J.; Huang, M.; Zhan, A.; Fang, L. Interaction of microplastics with heavy metals in soil: Mechanisms, influencing factors and biological effects. Sci. Total Environ. 2024, 918, 170281. [Google Scholar] [CrossRef]
  44. Peng, Y.; Yu, G.I. Assessment of heavy metal pollution on agricultural land in Chengdu city under different anthropogenic pressures based on APCS-MLR modelling. Ecol. Indic. 2024, 165, 112183. [Google Scholar] [CrossRef]
  45. Jahandari, A.; Abbasnejad, B. Environmental pollution status and health risk assessment of selective heavy metal(oid)s in Iran’s agricultural soils: A review. J. Geochem. Explor. 2024, 256, 107330. [Google Scholar] [CrossRef]
  46. Shi, X.; Liu, S.; Song, L.; Wu, C.; Yang, B.; Lu, H.; Wang, X.; Zakari, S. Contamination and source-specific risk analysis of soil heavy metals in a typical coal industrial city, central China. Sci. Total Environ. 2022, 836, 155694. [Google Scholar] [CrossRef] [PubMed]
  47. Long, Z.; Zhu, H.; Bing, H.; Tian, X.; Wang, Z.; Wang, X.; Wu, Y. Contamination, sources and health risk of heavy metals in soil and dust from different functional areas in an industrial city of Panzhihua City, Southwest China. J. Hazard. Mater. 2021, 420, 126638. [Google Scholar] [CrossRef] [PubMed]
  48. O’Keefe, J.M.K.; Henke, K.R.; Hower, J.C.; Engle, M.A.; Stracher, G.B.; Stucker, J.D.; Drew, J.W.; Staggs, W.D.; Murray, T.M.; Hammond, M.L.; et al. CO2, CO, and Hg emissions from the Truman Shepherd and Ruth Mullins coal fires, eastern Kentucky, USA. Sci. Total Environ. 2010, 408, 1628–1633. [Google Scholar] [CrossRef] [PubMed]
  49. Brusseau, M.L.; Matthias, A.D.; Comrie, A.C.; Musil, S.A. Chapter 17—Atmospheric Pollution. In Environmental and Pollution Science, 3rd ed.; Brusseau, M.L., Pepper, I.L., Gerba, C.P., Eds.; Academic Press: Cambridge, MA, USA, 2019; pp. 293–309. [Google Scholar]
  50. Zhu, H.; Wang, H.; Jing, S.; Wang, Y.; Cheng, T.; Tao, S.; Lou, S.; Qiao, L.; Li, L.; Chen, J. Characteristics and sources of atmospheric volatile organic compounds (VOCs) along the mid-lower Yangtze River in China. Atmos. Environ. 2018, 190, 232–240. [Google Scholar] [CrossRef]
  51. Zhou, X.Y.; Wang, X.R. Impact of industrial activities on heavy metal contamination in soils in three major urban agglomerations of China. J. Clean. Prod. 2019, 230, 1–10. [Google Scholar] [CrossRef]
  52. Xiao, L.; Guan, D.; Chen, Y.; Dai, J.; Ding, W.; Peart, M.R.; Zhang, C. Distribution and availability of heavy metals in soils near electroplating factories. Environ. Sci. Pollut. Res. 2019, 26, 22596–22610. [Google Scholar] [CrossRef]
  53. Huang, J.; Wu, Y.; Sun, J.; Li, X.; Fan, Z. Health risk assessment of heavy metal(loid)s in park soils of the largest megacity in China by using Monte Carlo simulation coupled with Positive matrix factorization model. J. Hazard. Mater. 2021, 415, 125629. [Google Scholar] [CrossRef] [PubMed]
  54. Wang, F.; Li, W.; Wang, H.; Hu, Y.; Cheng, H. The leaching behavior of heavy metal from contaminated mining soil: The effect of rainfall conditions and the impact on surrounding agricultural lands. Sci. Total Environ. 2024, 914, 169877. [Google Scholar] [CrossRef]
  55. Viard, B.; Pihan, F.; Promeyrat, S.; Pihan, J.-C. Integrated assessment of heavy metal (Pb, Zn, Cd) highway pollution: Bioaccumulation in soil, Graminaceae and land snails. Chemosphere 2004, 55, 1349–1359. [Google Scholar] [CrossRef]
  56. Cooke, C.A.; Martínez-Cortizas, A.; Bindler, R.; Sexauer Gustin, M. Environmental archives of atmospheric Hg deposition—A review. Sci. Total Environ. 2020, 709, 134800. [Google Scholar] [CrossRef]
  57. Ao, M.; Qiu, G.; Zhang, C.; Xu, X.; Zhao, L.; Feng, X.; Qin, S.; Meng, B. Atmospheric deposition of antimony in a typical mercury-antimony mining area, Shaanxi Province, Southwest China. Environ. Pollut. 2019, 245, 173–182. [Google Scholar] [CrossRef]
  58. Zhen, H.; Jia, L.; Huang, C.; Qiao, Y.; Li, J.; Li, H.; Chen, Q.; Wan, Y. Long-term effects of intensive application of manure on heavy metal pollution risk in protected-field vegetable production. Environ. Pollut. 2020, 263, 114552. [Google Scholar] [CrossRef]
  59. Huang, Q.; Yu, Y.; Wan, Y.; Wang, Q.; Luo, Z.; Qiao, Y.; Su, D.; Li, H. Effects of continuous fertilization on bioavailability and fractionation of cadmium in soil and its uptake by rice (Oryza sativa L.). J. Environ. Manag. 2018, 215, 13–21. [Google Scholar] [CrossRef]
  60. Dai, X.; Liang, J.; Shi, H.; Yan, T.; He, Z.; Li, L.; Hu, H. Health risk assessment of heavy metals based on source analysis and Monte Carlo in the downstream basin of the Zishui. Environ. Res. 2024, 245, 117975. [Google Scholar] [CrossRef]
  61. Peng, S.; Zhang, H.; Song, D.; Chen, H.; Lin, X.; Wang, Y.; Ji, L. Distribution of antibiotic, heavy metals and antibiotic resistance genes in livestock and poultry feces from different scale of farms in Ningxia, China. J. Hazard. Mater. 2022, 440, 129719. [Google Scholar] [CrossRef] [PubMed]
  62. Lu, X.; Lu, P.; Chen, J.; Zhang, H.; Fu, J. Effect of passivator on Cu form transformation in pig manure aerobic composting and application in soil. Environ. Sci. Pollut. Res. 2015, 22, 14727–14737. [Google Scholar] [CrossRef] [PubMed]
  63. Varol, M.; Gündüz, K.; Sünbül, M.R. Pollution status, potential sources and health risk assessment of arsenic and trace metals in agricultural soils: A case study in Malatya province, Turkey. Environ. Res. 2021, 202, 111806. [Google Scholar] [CrossRef] [PubMed]
  64. Zhang, Y.; Song, B.; Zhou, Z. Pollution assessment and source apportionment of heavy metals in soil from lead—Zinc mining areas of south China. J. Environ. Chem. Eng. 2023, 11, 109320. [Google Scholar] [CrossRef]
  65. Hu, Y.; He, K.; Sun, Z.; Chen, G.; Cheng, H. Quantitative source apportionment of heavy metal(loid)s in the agricultural soils of an industrializing region and associated model uncertainty. J. Hazard. Mater. 2020, 391, 122244. [Google Scholar] [CrossRef]
Figure 1. Schematic distribution of sampling points in the study area.
Sustainability 16 05553 g001
Figure 2. Spatial distribution of the soil heavy metal contents in the study area.
Sustainability 16 05553 g002
Figure 3. Results of the geoaccumulation index. (a) Box plot of the geoaccumulation index, the green, orange, and red lines represent the boundaries for 0, 1, and 5, respectively.; (b) proportion of heavy metals classified.
Sustainability 16 05553 g003
Figure 4. Potential ecological risk level distribution map.
Sustainability 16 05553 g004
Figure 5. Correlation analysis of different elements in soil.
Sustainability 16 05553 g005
Figure 6. Source apportionment results from the PMF model. (a) Distribution of contribution rates of each factor in PMF to heavy metal contents in soil; (b) proportion of heavy metals contributed by each factor in PMF to the overall total.
Sustainability 16 05553 g006
Figure 7. Spatial distribution of normalized contributions from potential sources.
Sustainability 16 05553 g007
Table 1. Classification standards for soil heavy metal pollution assessment methods.
Geoaccumulation Index Method [31]Potential Ecological Risk Index Method [32]
ClassificationIgeoDegree of ContaminationRisk LevelErDegree of Contamination (Single Factor)RIDegree of Contamination
1≤0uncontaminated1<40Slight<150Slight
20–1uncontaminated to moderately contaminated240–80Moderate150–300Moderate
31–2moderately contaminated380–160Strong300–600Strong
42–3moderately to heavily contaminated4160–320Very Strong600–1200Very Strong
53–4heavily contaminated5≥320Extremely Strong≥1200Extremely Strong
64–5heavily to extremely contaminated- a----
7>5extremely contaminated-----
a: “-” indicates no relevant data.
Table 2. Descriptive statistics of heavy metal concentration (mg·kg−1).
IndicatorsCdHgAsPbCrNiCuZnpH
Min0.110.010.54276.835.743.14.16
Max22.70.23342.8723322377.8196020977.75
Median0.510.0854.0475.149.417.6341125.37
Mean1.400.097.53265.1751.6718.14101.51198.375.42
SD2.670.048.24750.3537.2711.81252.58244.940.59
CV1.910.441.092.830.720.65 2.49 1.23 0.11
Screening a0.300.5030.0070.00150.0060.0050.00200.00- b
Screening exceedance rate70.8703.8852.431.940.9738.8325.24-
Background c0.050.085.7834.9041.3013.5021.6082.70-
Background exceedance rate100.0053.4043.6991.2655.3458.2571.8469.90-
a: Using the Soil Environmental Quality Agricultural Land Soil Pollution Risk Control Standard (Trial) (GB 15618-2018), the screening value for soil when pH < 5.5; b: “-” indicates no relevant data; c: Soil background of Fujian province [38].
Table 3. Potential ecological risk indices of soil heavy metals.
CategoryMedianMeanMaxNumber of Points with Moderate or Higher Risk
Er ≥ 40RI ≥ 150
Cd51.00139.832270.0062- a
Hg6.807.2518.640-
As1.352.5114.270-
Pb5.3618.94516.649-
Cr0.660.692.970-
Ni1.471.516.480-
Cu3.4010.15196.003-
Zn0.560.9910.490-
RI75.03181.872326.42-30
a: “-” indicates no relevant data.
Table 4. PCA matrix for soil heavy metals.
Element IndicatorsFactor Loadings of Variables on Each Principal Component
PC1PC2PC3PC4PC5
Cd0.130.280.120.940.06
Hg0.210.080.060.060.97
As0.550.040.700.11−0.02
Pb0.030.980.110.080.04
Cr0.930.130.180.070.20
Ni0.960.080.060.110.12
Cu0.030.200.920.080.08
Zn0.210.870.160.380.09
Eigenvalues3.501.631.020.790.63
Variance contribution Rate (%)43.7820.4312.739.817.92
Cumulative variance contribution rate (%)43.7864.2176.9486.7494.67
Table 5. Contribution rates of soil heavy metal pollution sources (%).
FactorCdHgAsPbCrNiCuZn
185.792.4720.599.5010.5911.698.2037.73
20.0020.5036.890.0084.4883.635.6413.08
30.000.000.0070.941.650.691.6424.04
43.5473.503.7011.340.173.992.0616.89
510.673.5338.828.223.110.0082.468.26
Disclaimer/Publisher’s Note: The statements, opinions and data contained in all publications are solely those of the individual author(s) and contributor(s) and not of MDPI and/or the editor(s). MDPI and/or the editor(s) disclaim responsibility for any injury to people or property resulting from any ideas, methods, instructions or products referred to in the content.

