Article

Constructing Ecological Networks for Mountainous Urban Areas Based on Morphological Spatial Pattern Analysis and Minimum Cumulative Resistance Models: A Case Study of Yongtai County

1
School of Architecture, South China University of Technology, Guangzhou 510641, China
2
State Key Laboratory of Subtropical Building and Urban Science, Department of Landscape Architecture, School of Architecture, South China University of Technology, Guangzhou 510641, China
3
Guangzhou Key Laboratory of Landscape Architecture, South China University of Technology, Guangzhou 510641, China
4
College of Water Conservancy and Civil Engineering, South China Agricultural University, Guangzhou 510641, China
*
Author to whom correspondence should be addressed.
Sustainability 2024, 16(13), 5559; https://doi.org/10.3390/su16135559
Submission received: 26 April 2024 / Revised: 6 June 2024 / Accepted: 21 June 2024 / Published: 28 June 2024
(This article belongs to the Special Issue Spatial Analysis for the Sustainable City)

Abstract

:
In order to alleviate the increased habitat fragmentation caused by the accelerating urbanization and ecological deterioration, constructing ecological networks is an effective way to improve ecological connectivity, facilitate regional energy flow, and promote biodiversity enhancement. In this study, Yongtai County was taken as the research object, and the morphological spatial pattern analysis (MSPA) method was used to analyze the landscape pattern, identify the ecological source sites, classify the ecological source sites according to the importance degree by possible connectivity index (PC) and the Delta values for probability index of connectivity (dPC), and then construct the potential ecological corridors with the help of the minimum cumulative resistance (MCR) model to generate the ecological network, and then put forward the optimization strategy according to the current situation. The results show that (1) the core area of Yongtai County is 1071.06 km2, the largest among all landscape types, with a fragmented distribution, high degree of fragmentation, and poor connectivity, mainly in the east and southwest, and sparser in the middle. (2) The area of highest resistance value is mainly located in the built-up areas of towns and rural settlements in the central and northwestern parts of the country; the lowest value is distributed in the southwest and southeast, and the land use mode is mainly expressed as woodland. (3) The ecological network consists of 13 ecological sources and 78 potential ecological corridors. The ecological sources are mainly located in the east and southwest, with high connectivity; the potential ecological corridors are distributed in the form of a network, with fewer in the center, resulting in the phenomenon of ecological disconnection. (4) Lack of ecological sources and corridors, serious landscape fragmentation, and optimization of ecological network by adding and protecting ecological sources, repairing ecological breakpoints and building stepping stones. This study is of guiding significance for urban green space system planning, biodiversity protection, and ecosystem function enhancement in Yongtai County, and also provides reference for ecological protection and optimization in other mountainous cities.

1. Introduction

In the development of mountainous cities, ensuring ecological safety, fostering harmony between humans and nature, and maintaining the regional ecosystem in a healthy, orderly, and balanced state are critical aspects of urban and rural planning and construction [1,2]. Mountainous cities exhibit complex geographic environments and distinct demographic, social, and economic characteristics. However, continuous economic and societal development coupled with urbanization processes have substantially altered the original ground cover conditions, thereby diminishing the natural landscape substrate’s capacity to provide essential services [3]. This alteration has led to the fragmentation and isolation of habitat patches, profoundly affecting the normal migration and dispersal of living organisms within the region, thus posing a significant obstacle to the sustainable development of mountainous cities [4,5,6]. Within the framework of territorial spatial planning, the establishment of ecological networks has been widely advocated to uphold and restore the connectivity and stability of fragmented habitat patches [7]. These networks comprise dispersed habitat patches and effectively preserve ecosystem integrity, facilitate material and energy exchanges, and promote species migration between patches within the region. Furthermore, they enhance functional linkages between habitats, mitigate the enduring impacts of habitat fragmentation on biodiversity, and bolster the stability of regional landscapes [8,9,10,11]. Scholars found that the construction of ecological networks significantly enhanced the diversity of species such as golden monkeys [12], antelopes [13], crested ibis [14], butterflies [15], etc., and at the same time, with the improvement in habitats, the abundance of plants [16] has been greatly improved, further reflecting that the ecological network can effectively promote the survival and reproduction of organisms.
With the increasingly severe threats to biodiversity, the United Nations 2030 Agenda for Sustainable Development, which was launched in 2016, calls for strengthening the protection of global biodiversity in the face of habitat change, and the ecological security pattern of protecting biodiversity has been emphasized by relevant scholars [17,18,19]. Ecological network construction has gradually become an international research hotspot in the field of ecology, and its construction and optimization methods are still under continuous exploration and development. Some scholars have paid more attention to research on network importance, corridor connectivity, consistency of ecological processes [20,21,22,23], land planning and ecological network functionality [24], multiple stability of ecosystems [25], and biodiversity conservation [26], the consistency of ecological processes in the network is emphasized through construction methods such as graph theory, circuit theory, superposition, and least cumulative resistance models [27]. The key to the rationality of the ecological network depends on the ecological source sites and ecological corridors [28,29]. There are two main methods to identify ecological source sites: the first is the direct method, which directly takes nature reserves [30], urban green areas [31], regional land cover types [32], etc., as ecological source areas; the second is the synthesis method, which determines the ecological source sites of cities and wetlands by studying the ecosystem function supply and demand services [33], with particle size backpropagation, principal component analysis [34], the ecological network study method of landscape pattern analysis [35], and other comprehensive analysis methods. These two ways of identifying ecological source sites directly through habitat characteristics or ecosystem service importance are somewhat subjective, so it is necessary to find a more scientific way of identifying ecological source sites. In recent years, morphological spatial pattern analysis (MSPA) has been widely used to identify ecological source sites in ecological networks [36,37,38], which utilizes the principle of graphics to classify land use types by raster and can accurately distinguish the structure of land and landscape space [39,40], and to quantitatively identify ecological source sites, being more compatible, effective, and scientific in identifying ecological source sites [41,42,43]. Methods of identifying ecological source sites have varied with different research objectives, facilitating the study of mountain ecological networks. Ecological corridors are channels for regional material and energy flows [44,45], and the minimum cumulative resistance (MCR) model occupies an important position in the construction of ecological corridors. It is based on the ecological resistance surface in ArcGIS to calculate the minimum resistance value between source and target to judge the minimum migration path for species migration and dispersal, so as to construct ecological corridors, which helps to generate ecological networks [46,47], which is favored for its better reflection of the coupling relationship between changes in landscape patterns and the evolution of ecological processes. Most scholars construct ecological corridors based on the minimum cumulative resistance (MCR) model from the aspects of ecological security pattern, urban spatial growth, land use, tourism planning, etc., using methods such as the InVEST model and the RUSLE model [48,49,50], which provide a clear direction for ecosystem restoration and ecological network optimization.
As one of the regions with typical characteristics of southern China’s mountains, Yongtai County has a good ecological background with high forest coverage. With the rate of urbanization accelerating, the area’s habitat patches have become fragmented, and ecological corridors are scarce. The construction of ecological networks faces challenges due to resource and environmental constraints. Consequently, biodiversity has declined, impeding the city’s sustainable development. Ecological protection remains a key focus of Yongtai County’s future planning strategy. Therefore, this study takes Yongtai County, a mountainous city, as a case study. It uses the morphological spatial pattern analysis (MSPA) method to identify the significance of ecological source areas, employing landscape indicators like the possible connectivity index and patch importance index. Furthermore, the minimum cumulative resistance (MCR) model is applied to develop Yongtai County’s potential ecological network and pinpoint crucial ecological corridors. On this basis, propose strategies for optimizing the ecological network of Yongtai County. It is expected to provide new ideas for the development of other mountainous cities and towns, the construction of ecological networks, and the improvement of ecological conservation functions. Additionally, it is of great significance to promote the construction of national ecological scenic roads in Fujian Province.

2. Materials and Methods

2.1. Study Area

Yongtai County is situated between 25°39′ to 26°05′ north latitude and 118°23′ to 119°12′ east longitude, positioned centrally within Fujian Province, southwest of Fuzhou City (Figure 1), covering an area of 2229.86 km2. Dominated by middle and low mountains, the county spans approximately 1813.33 km2. The terrain’s elevation is higher in the west and lower in the east, with altitudes ranging mostly from 500 to 1000 m. The southwest mountains are tall and majestic, with continuous peaks, while the northeast mountains are slower, often 600–800 m above sea level, and are distributed in a point-like manner. The mountains are composed of volcanic rocks, different volcanic rock lithology resistance to weathering degree of difference, so that the terrain is mostly sharp peaks and crags, cutting strong, with steep slopes and sharp features. The average annual temperature in Yongtai County is between 14.6 and 20.1 °C, with the average annual temperature in the hilly areas of river valleys above 17 °C, and less than 17 °C in the low and middle mountainous areas. The annual precipitation in Yongtai County is between 1400 and 2000 mm, with the low hills in the valley increasing to the high mountains, and the precipitation in the west is much lower than that in the east. The county is crisscrossed by rivers, forming an intricate network of water systems with 53 large and small tributaries. Rich in water resources, Yongtai County boasts a hydraulic reserve of 888,400 kW. Its predominant natural vegetation comprises evergreen broad-leaved forests, primarily composed of species such as Fagaceae, Lauraceae, Camelliaceae, Magnoliaceae, and Elaeocarpaceae. Pinus massoniana and Cunninghamia lanceolata are the principal tree species, covering over 75% of forested areas, contributing to a forest coverage rate of 76.8%. Designated as one of Fujian Province’s key forestry counties, Yongtai County exhibits an exceptional overall ecological environment and abundant species diversity. It hosts four 4A scenic spots, one national forest park, and one provincial nature reserve, serving as a pivotal region for biodiversity conservation. Notably, it shelters 7 species of nationally first-class protected animals, 41 species of second-class protected animals, 3 species of nationally first-class protected wild plants, 37 species of nationally second-class key protected wild plants, and 62 species of wild orchids. Moreover, Yongtai County serves as a pilot county for national ecological demonstration area construction, water and soil conservation, and ecological restoration initiatives. Recognized as an advanced county for national economic forest construction and ranked among the top 10 key tourism counties in Fujian Province, it has experienced gradual urban and rural expansion encroaching upon ecological lands in recent years. Consequently, the spatial layout of land has become increasingly scattered and disorderly, while Yongtai County lacks a comprehensive global ecological network, leading to deteriorating habitat quality.

2.2. Data Sources

The data used in this study mainly include the digital elevation model (DEM) data provided by the geospatial data cloud platform and the land use data from 2020 provided by the National Geographic Information Resource Catalog Service System, with a resolution of 30 m. Based on ENVI 5.6 software, the data were preprocessed through radiometric calibration, clipping and atmospheric correction, and then the support vector machine method was used to supervise the classification. Six landscape element classes were extracted, including forest land, grassland, water, wetland, cultivated land, construction land and unused land. Finally, the projection of all data was transformed into WGS_1984_UTM_zone_50N.

2.3. Methods

2.3.1. Ecological Source Identification Based on MSPA

MSPA (morphological spatial pattern analysis) serves as a technical method for the quantitative identification of ecological sources. It accomplishes this by segmenting grid images using image processing techniques, thus facilitating the classification of ecological sources and the generation of landscape ecological patches at the pixel level [51]. In accordance with the specific conditions of Yongtai County, land use types are delineated into forest land, grassland, water bodies, cultivated land, construction land, and unused land within ArcGIS 10.2. Initially, the first three types of land are designated as “1”, while the remaining landscape categories are labeled as “2”. Subsequently, utilizing the eight-neighborhood rule in the Guidos Toolbox 3.0 tool, seven distinct landscape types are identified in Yongtai County, including core, bridge, islet, edge, perfection, loop, and branch (Refer to Table 1). These classifications aid in pinpointing ecological sources and constructing an ecological network. Of particular significance is the core area, crucial for maintaining ecosystem integrity, ensuring habitat quality stability, and preserving biodiversity. The extensive core area exhibits heightened connectivity, facilitating the survival and dispersion of species. Consequently, it serves as a pivotal data source for analyzing landscape connectivity indices.

2.3.2. Ecological Source Site Selection for the Study Area Based on Landscape Connectivity

The robustness of landscape connectivity dictates the challenge of energy transmission and biological diffusion among different landscape types within ecological sources. Optimal connectivity plays a pivotal role in preserving and enhancing ecosystem stability. Commonly employed landscape connectivity indices include the Integral Index of Connectivity (IIC), possible connectivity index (PC), and the Delta values for probability index of connectivity (dPC), with dPC particularly highlighting the significance of patches and effectively assessing the connectivity of core patches [52]. Landscape connectivity indices were assessed using Conefor 2.6 software, and the patch importance index was categorized accordingly. Consequently, this study identifies ecological sources with superior ecological conditions through connectivity evaluation. The calculation formula is outlined as follows:
I I C = i = 1 n j = 1 n a i a j 1 + n l i j A L 2
P C = i = 1 n j = 1 n a i a j P i j * A L 2
d P C = P C P C r e m o v e P C
where n represents the total number of patches in the region; Ai is the area of patch i and j; P* is the maximum product of all path probabilities; AL (3) and aj points ij represent the total area of landscape in the study area between patch i and patch j; PC represents the possible connectivity index of a patch in the landscape of the study area. For 0 ≤ PC ≤ 1, the larger the PC value, the higher the patch connectivity; DPC indicates the importance of the plaque, and PCremove indicates the possible connectivity index after removing the plaque.
The larger the core area, the higher the habitat quality, and the stronger the landscape connectivity index, which is suitable for biological survival and diffusion. Therefore, according to the MSPA (morphological spatial pattern analysis) calculation results, the core area is sorted and the top 20 ecological source areas with large area are preliminarily screened. Considering the uncertainty of connectivity between patches, based on Conefor 2.6 software, the connectivity probability is set to 0.5, and the distance threshold is set to 2.5 km. The primary, secondary and tertiary ecological sources are extracted and transferred to ArcGIS 10.2 as ecological sources, laying the foundation for the construction of ecological networks.

2.3.3. Ecological Network Construction Based on MCR Model

The MCR (minimum cumulative resistance ) model refers to the cost [53] of species from the ecological source to the target place when they overcome the landscape resistance. In addition, the MCR (minimum cumulative resistance ) model can quickly, effectively, and accurately calculate the resistance that needs to be overcome when ecological energy flows among ecological sources. The larger the value, the higher the difficulty of circulation. The generation of resistance surface is the premise of constructing ecological corridor. During biological diffusion, it will be interfered with by ecology and humanity. Five resistance factors including elevation, slope, land use, landscape type, and distance from the road are selected to generate a comprehensive resistance surface (Table 2). The calculation formula is as follows:
Minimum cumulative resistance value:
M C R = f m i n j = n i = m D i j R i
where Dij represents the actual distance that ecological source j needs to cross to reach another source i, and Ri represents the resistance value that needs to be overcome to cross source i. Fmin is a positive correlation function reflecting the actual distance and the drag coefficient variable.
Resistance value:
F i = j = 1 n W j A i j
where i represents the grid, j represents the resistance factor, Fi represents the comprehensive resistance value of i grid, n represents the number of resistance factors, Wj represents the proportion of j, and Aij represents the resistance value of j in i grid.
Using the ArcGIS 10.2 software program, this study generated resistance surfaces [54,55] through the weighted superposition of five resistance factors [56,57]. By integrating the minimum cumulative cost distance and cost path, redundant corridors were eliminated, resulting in a total of 78 potential ecological corridors. Subsequently, the gravity model was employed to calculate the interaction matrix between patches within the ecological source area, enabling a scientific assessment of the relative importance of potential corridors.

2.3.4. Gravity Model-Based Identification of Important Ecological Corridors

Gravity modeling was first used in the field of transportation, and with the expansion of related research, it was introduced to urban systems and landscape ecology [33]. Through the gravity model, the mutual ecological gravity between patches can be calculated to identify the importance of potential ecological corridors. The higher the gravity value, the greater the interaction between the patches, and the lower the resistance to biological activities and energy flow. The formula of gravity model is as follows.
G i j = N i N j D i j 2 = [ ln S i P i ] [ 1 P j ln S j ] ( L i j / L m a x ) 2 = L m a x 2 ln S i S j L i j 2 P i P j
where i and j are two different patches, Gij is the ecological gravity value between i and j, Ni and Nj are their weights, Dij is the standard resistance value of the corridor between i and j, Pi, and Pj represent the resistance value, Si and Sj represent the area, Lij is the cumulative resistance value, and Lmax is the maximum resistance value.

3. Results

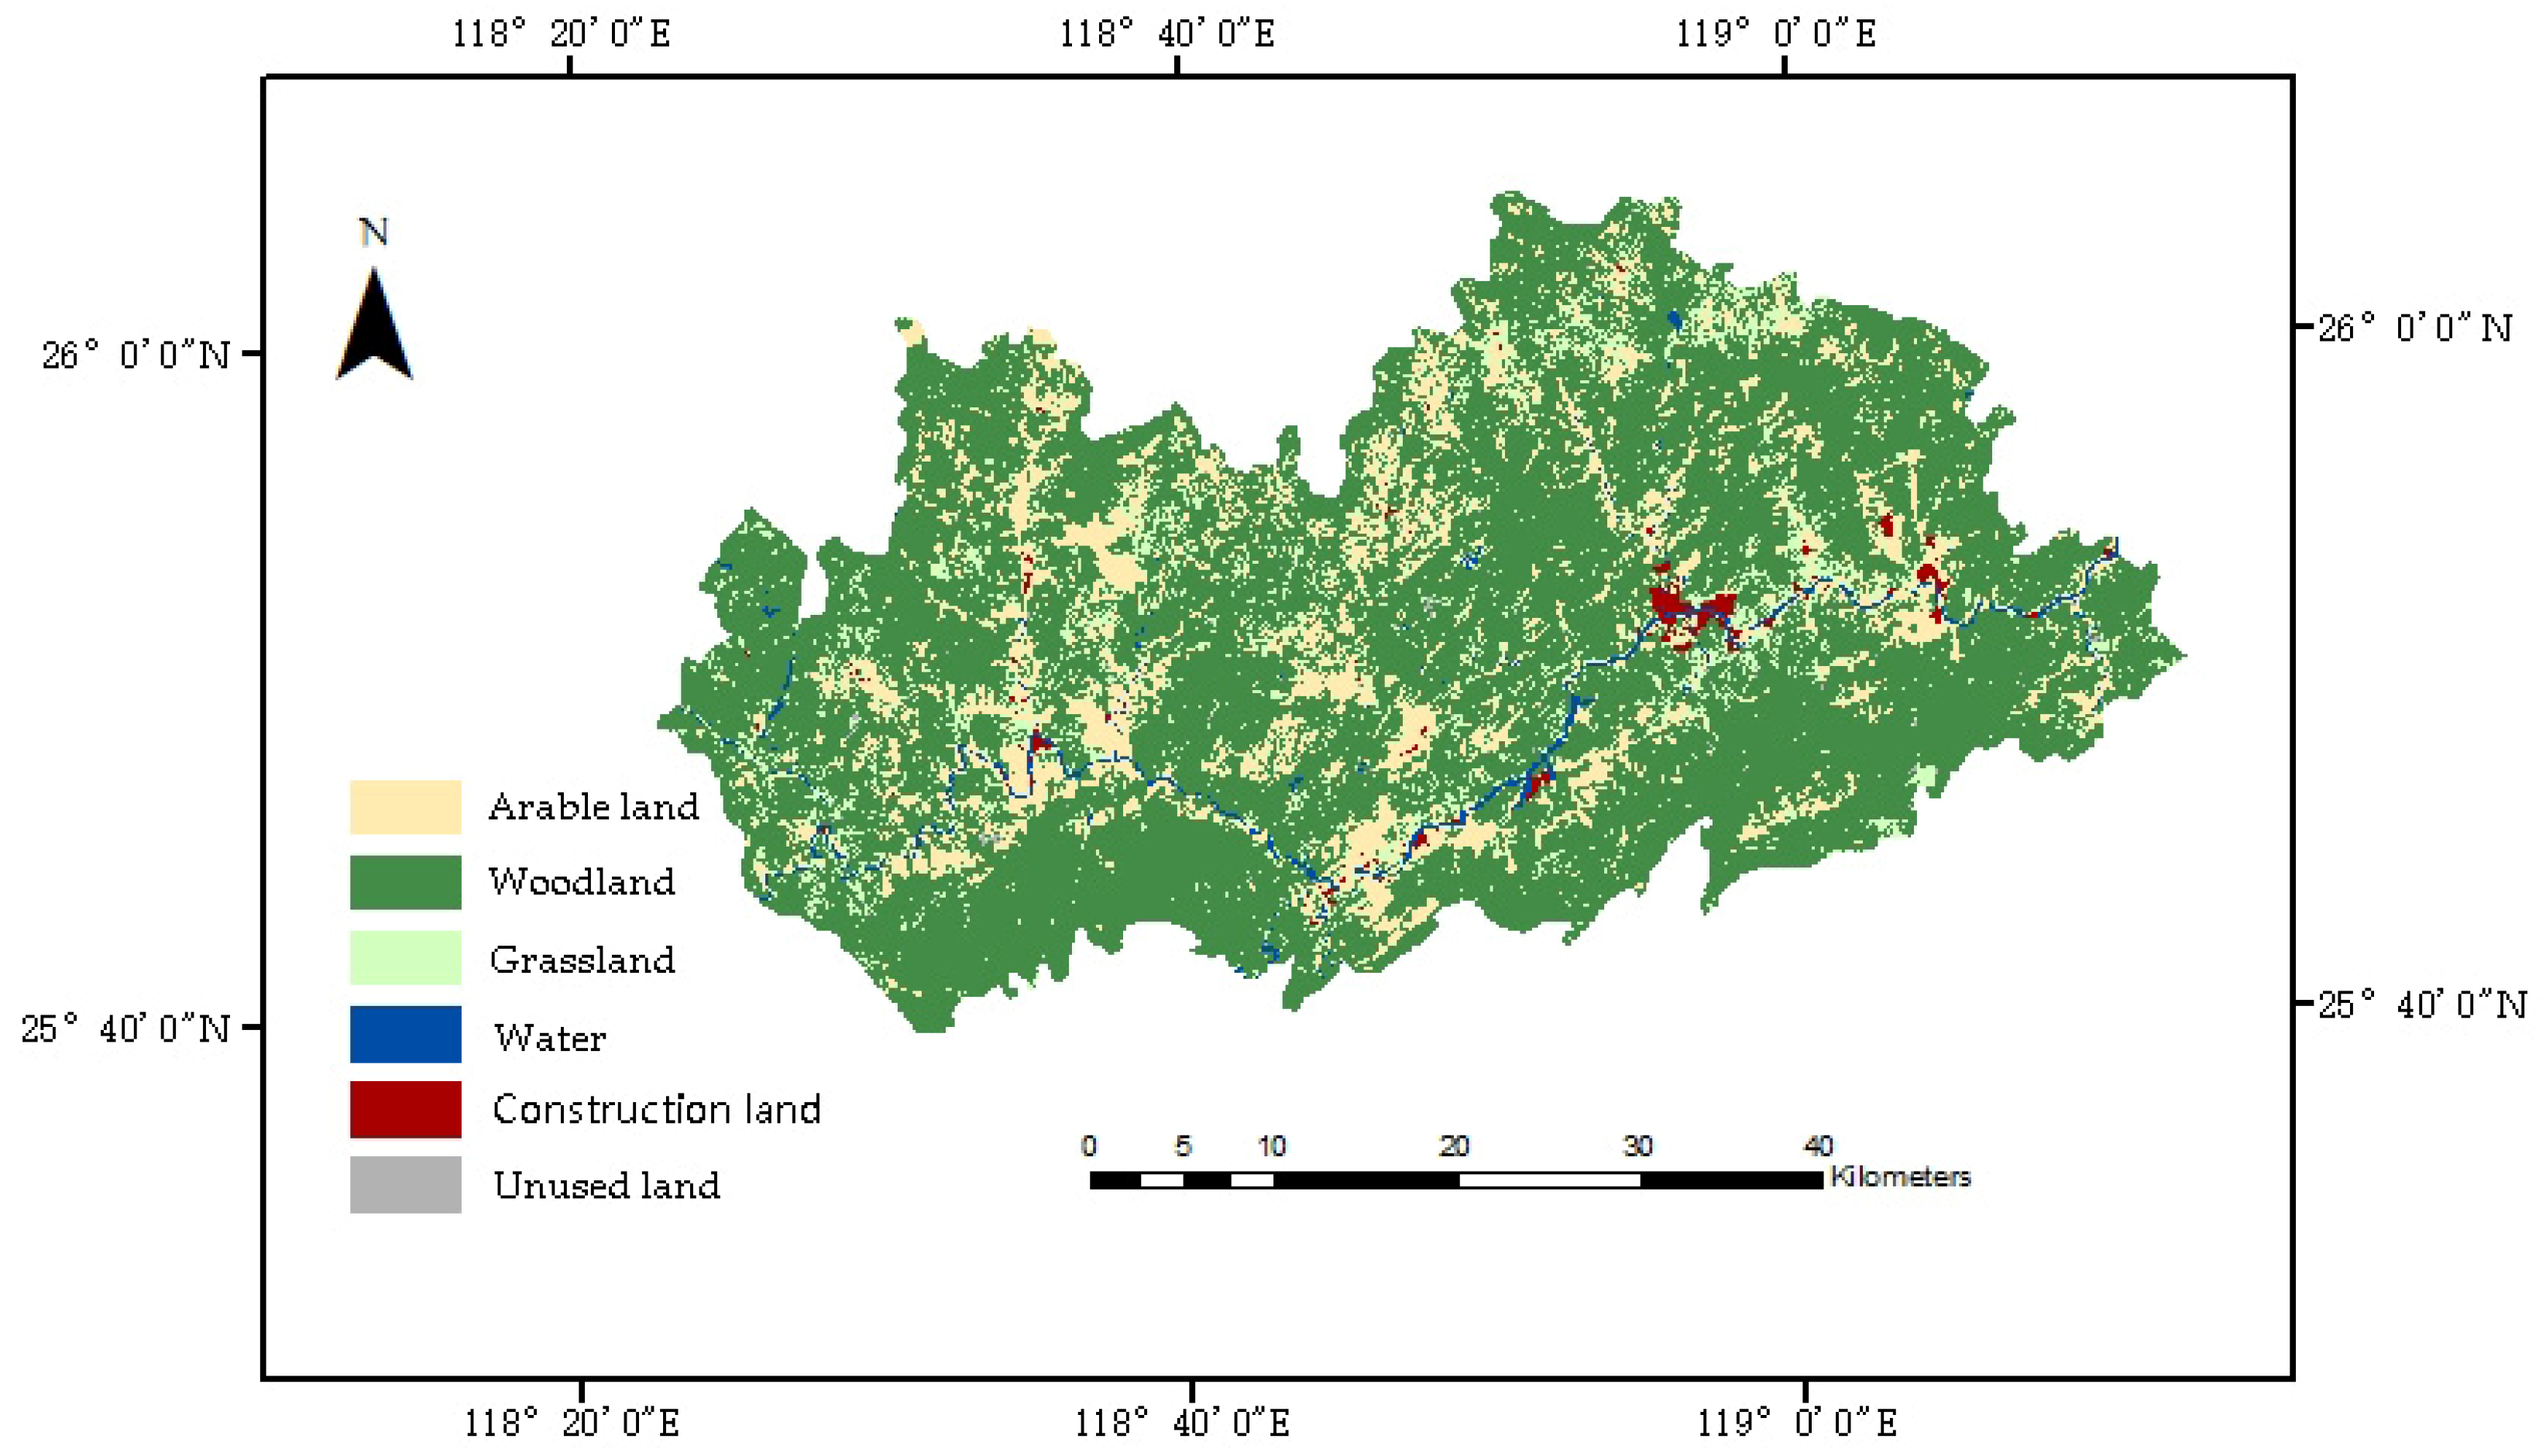
3.1. Analysis of the Land Use Situation in Yongtai County

The land use analysis of Yongtai County reveals six distinct categories, encompassing a total area of 2230.61 km2. Forest land prevails as the predominant type, occupying the largest portion at 1668.18 km2, constituting 74.78% of the total area. Cultivated land follows, covering 329.68 km2, representing 14.78% of the total area, primarily concentrated near the Dazhang River basin. Grassland, water bodies, and construction land collectively comprise a smaller proportion, accounting for 7.82%, 1.30%, and 0.72%, respectively. Additionally, unused land spans an area of 4.29 km2, representing a mere 0.19% of the total area. Notably, Yongtai County exhibits a high degree of land utilization (Figure 2).

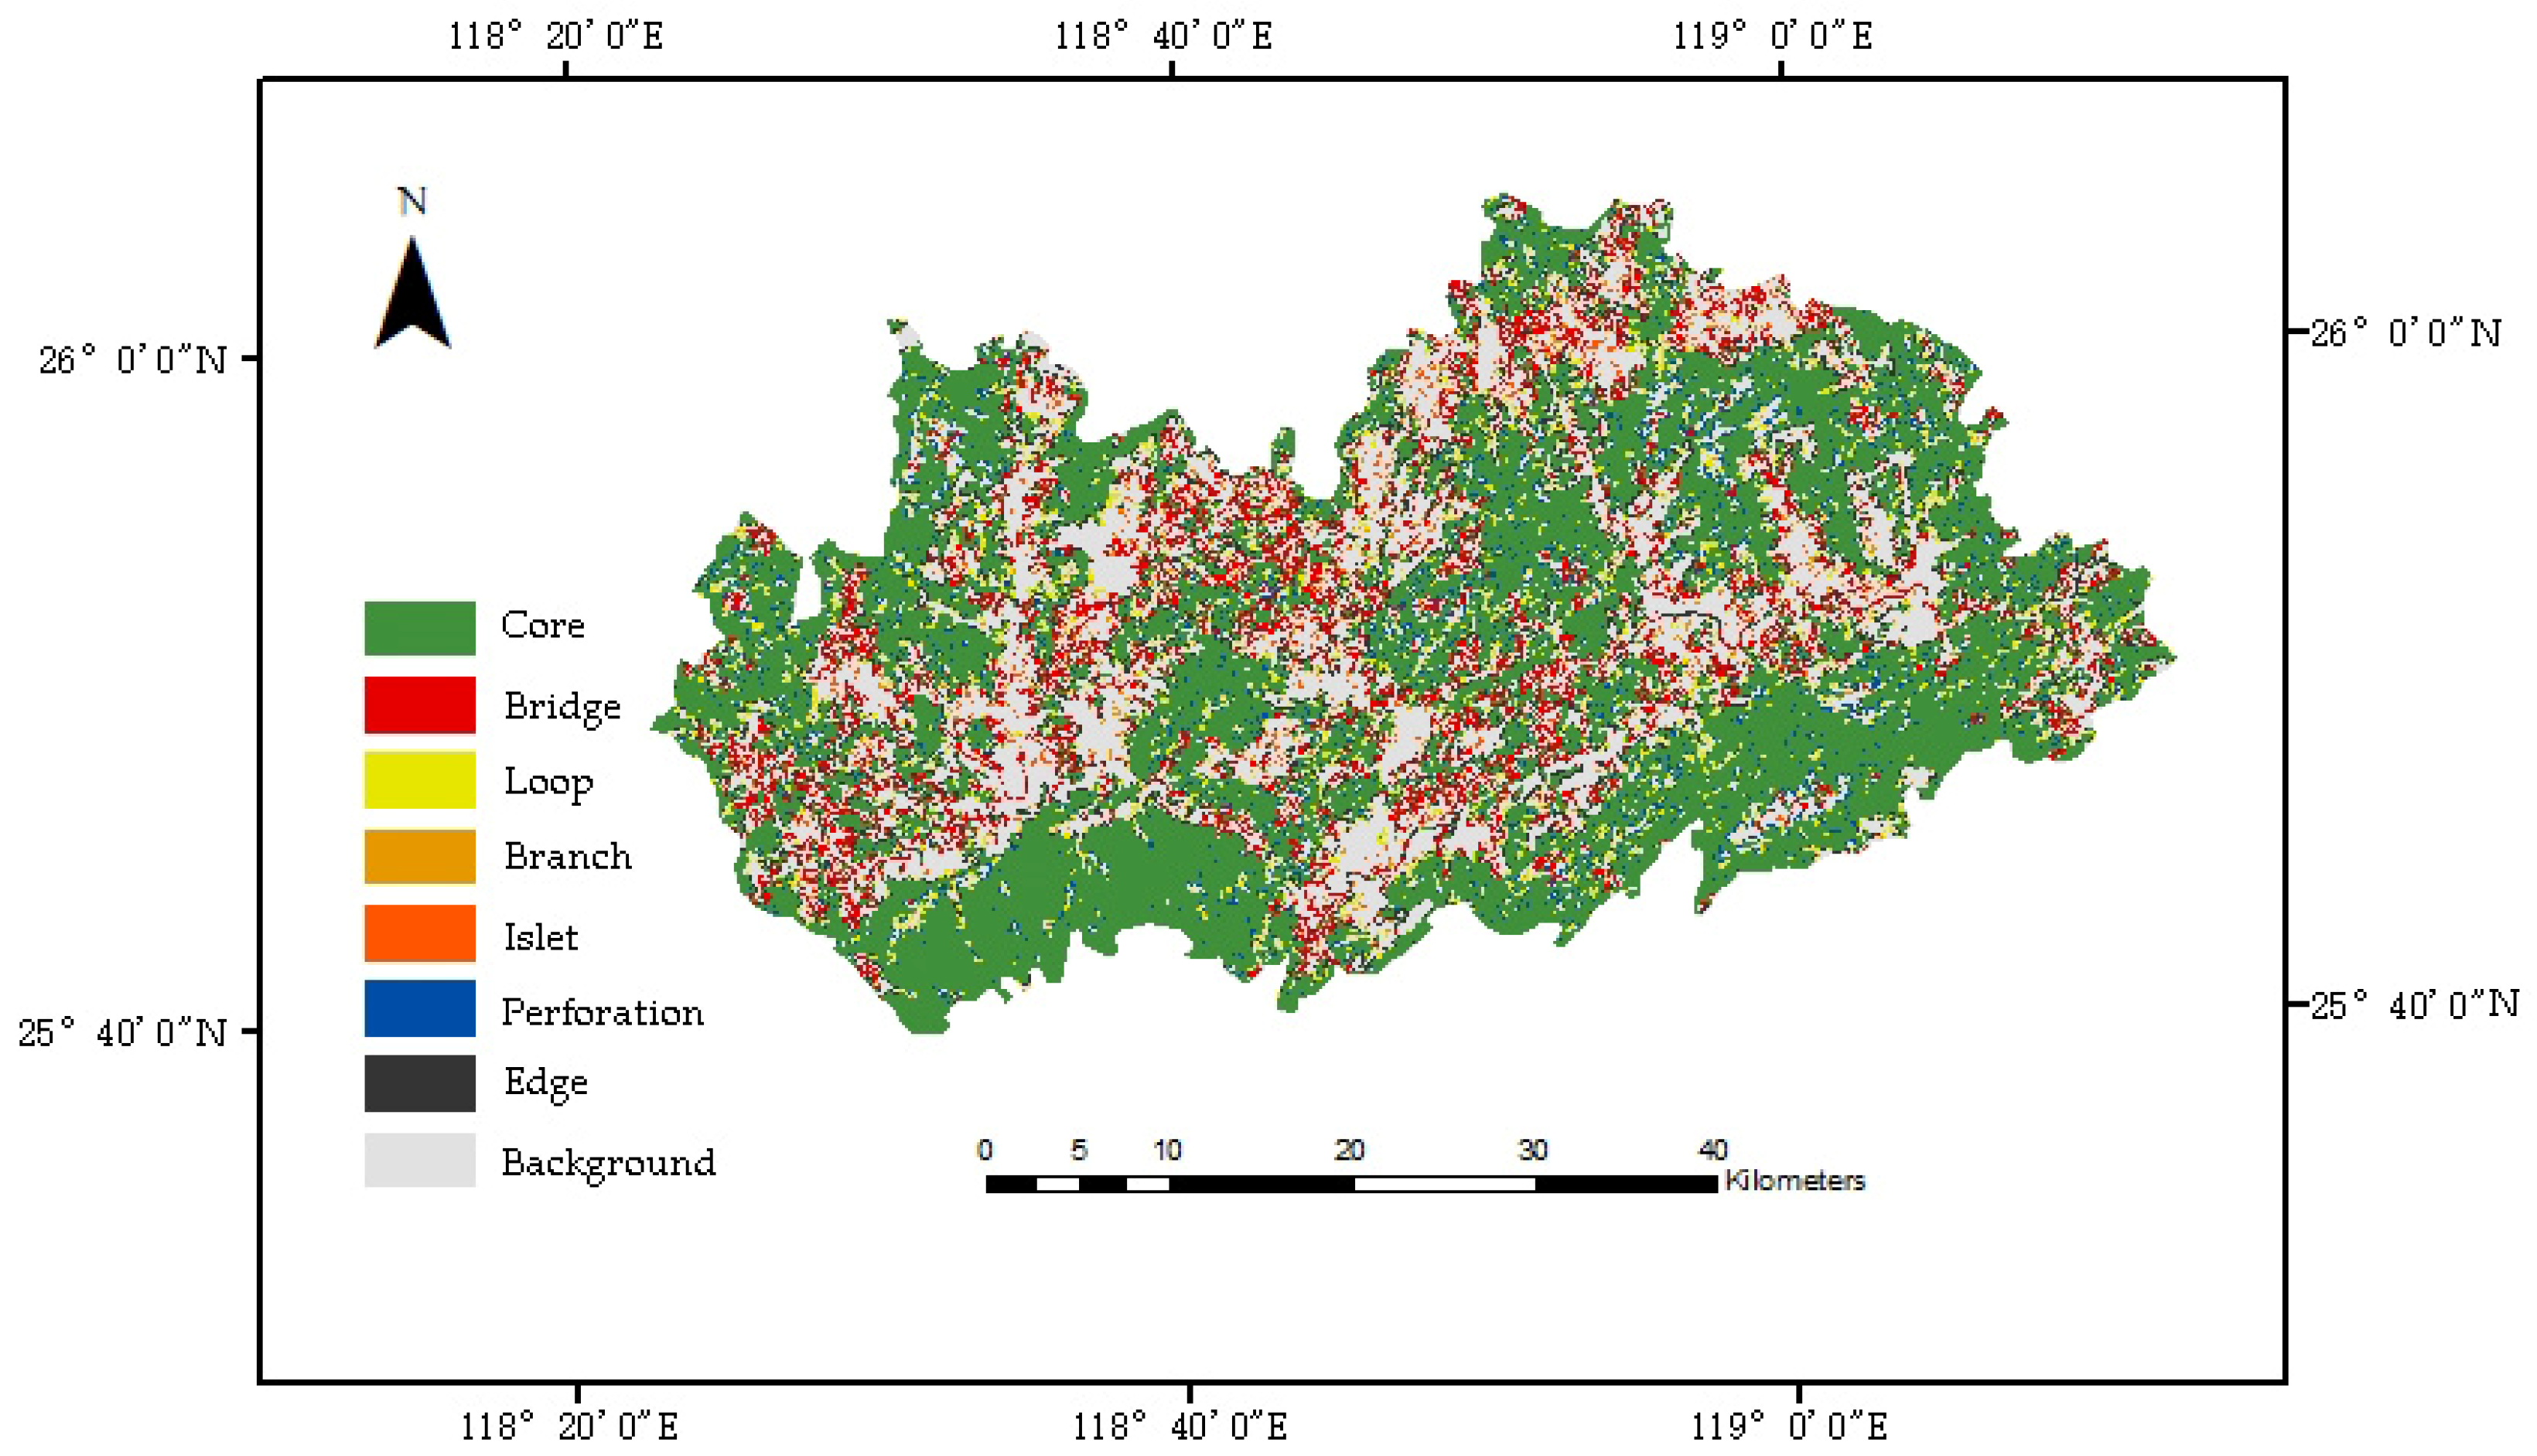
3.2. Landscape Pattern Analysis of Yongtai County Based on MSPA

According to the land use classification in Yongtai County, woodland, grassland, and water were selected as the foreground landscape types, while the remaining types served as the background. The land use data underwent MSPA (morphological spatial pattern analysis) to classify landscape elements (Figure 3), followed by the tabulation of area and proportion of different landscape types (Table 3). The analysis revealed that the total area of landscape types in Yongtai County, based on MSPA (morphological spatial pattern analysis), is 1660.12 km2, constituting 74.42% of the total area of the study area. Notably, the core area spans 1071.06 km2, representing the largest proportion among all landscape types, characterized by higher stability, and accounting for 64.52% of the prospective area. The core area predominantly resides in the Tiantai Mountains in the eastern part and the Shizhu Mountains in the southwestern part of Yongtai County. While the southwestern region exhibits significant aggregation, the eastern and northern areas suffer from sparse patch distribution, heightened fragmentation, and poor connectivity, detracting from the overall landscape quality. The bridging area, serving as a structural corridor in the ecological network, facilitates energy exchange and material flow circulation, thereby enhancing landscape connectivity. Covering 206.82 km2, the bridging area constitutes 12.46% of the prospective area but is relatively small and fragmented, indicating inadequate linkage between patches in the core area and hindrances to organismal circulation. The edge and pore areas, situated at the inner and outer edges of the core area, respectively, play a crucial role in maintaining patch stability. These areas account for 9.29% and 4.71% of the prospective area, respectively, with the edge area dominating, signaling severe fragmentation and instability of patches in Yongtai County and emphasizing the necessity to bolster connectivity for ecological flow. Isolated islands, acting as isolated green space patches, cover 0.84% of the foreground area, scattered throughout the landscape, serving as temporary habitats for ecological elements and organismal migration and providing a foundation for future pedestal planning to enhance patch connectivity. The ring road area, offering corridors within the core area and facilitating species movement within patches, constitutes 2.4% of the foreground area. Lastly, the spur accounts for 0.84% of the foreground area, indicating weak connectivity between foreground and background in Yongtai County.

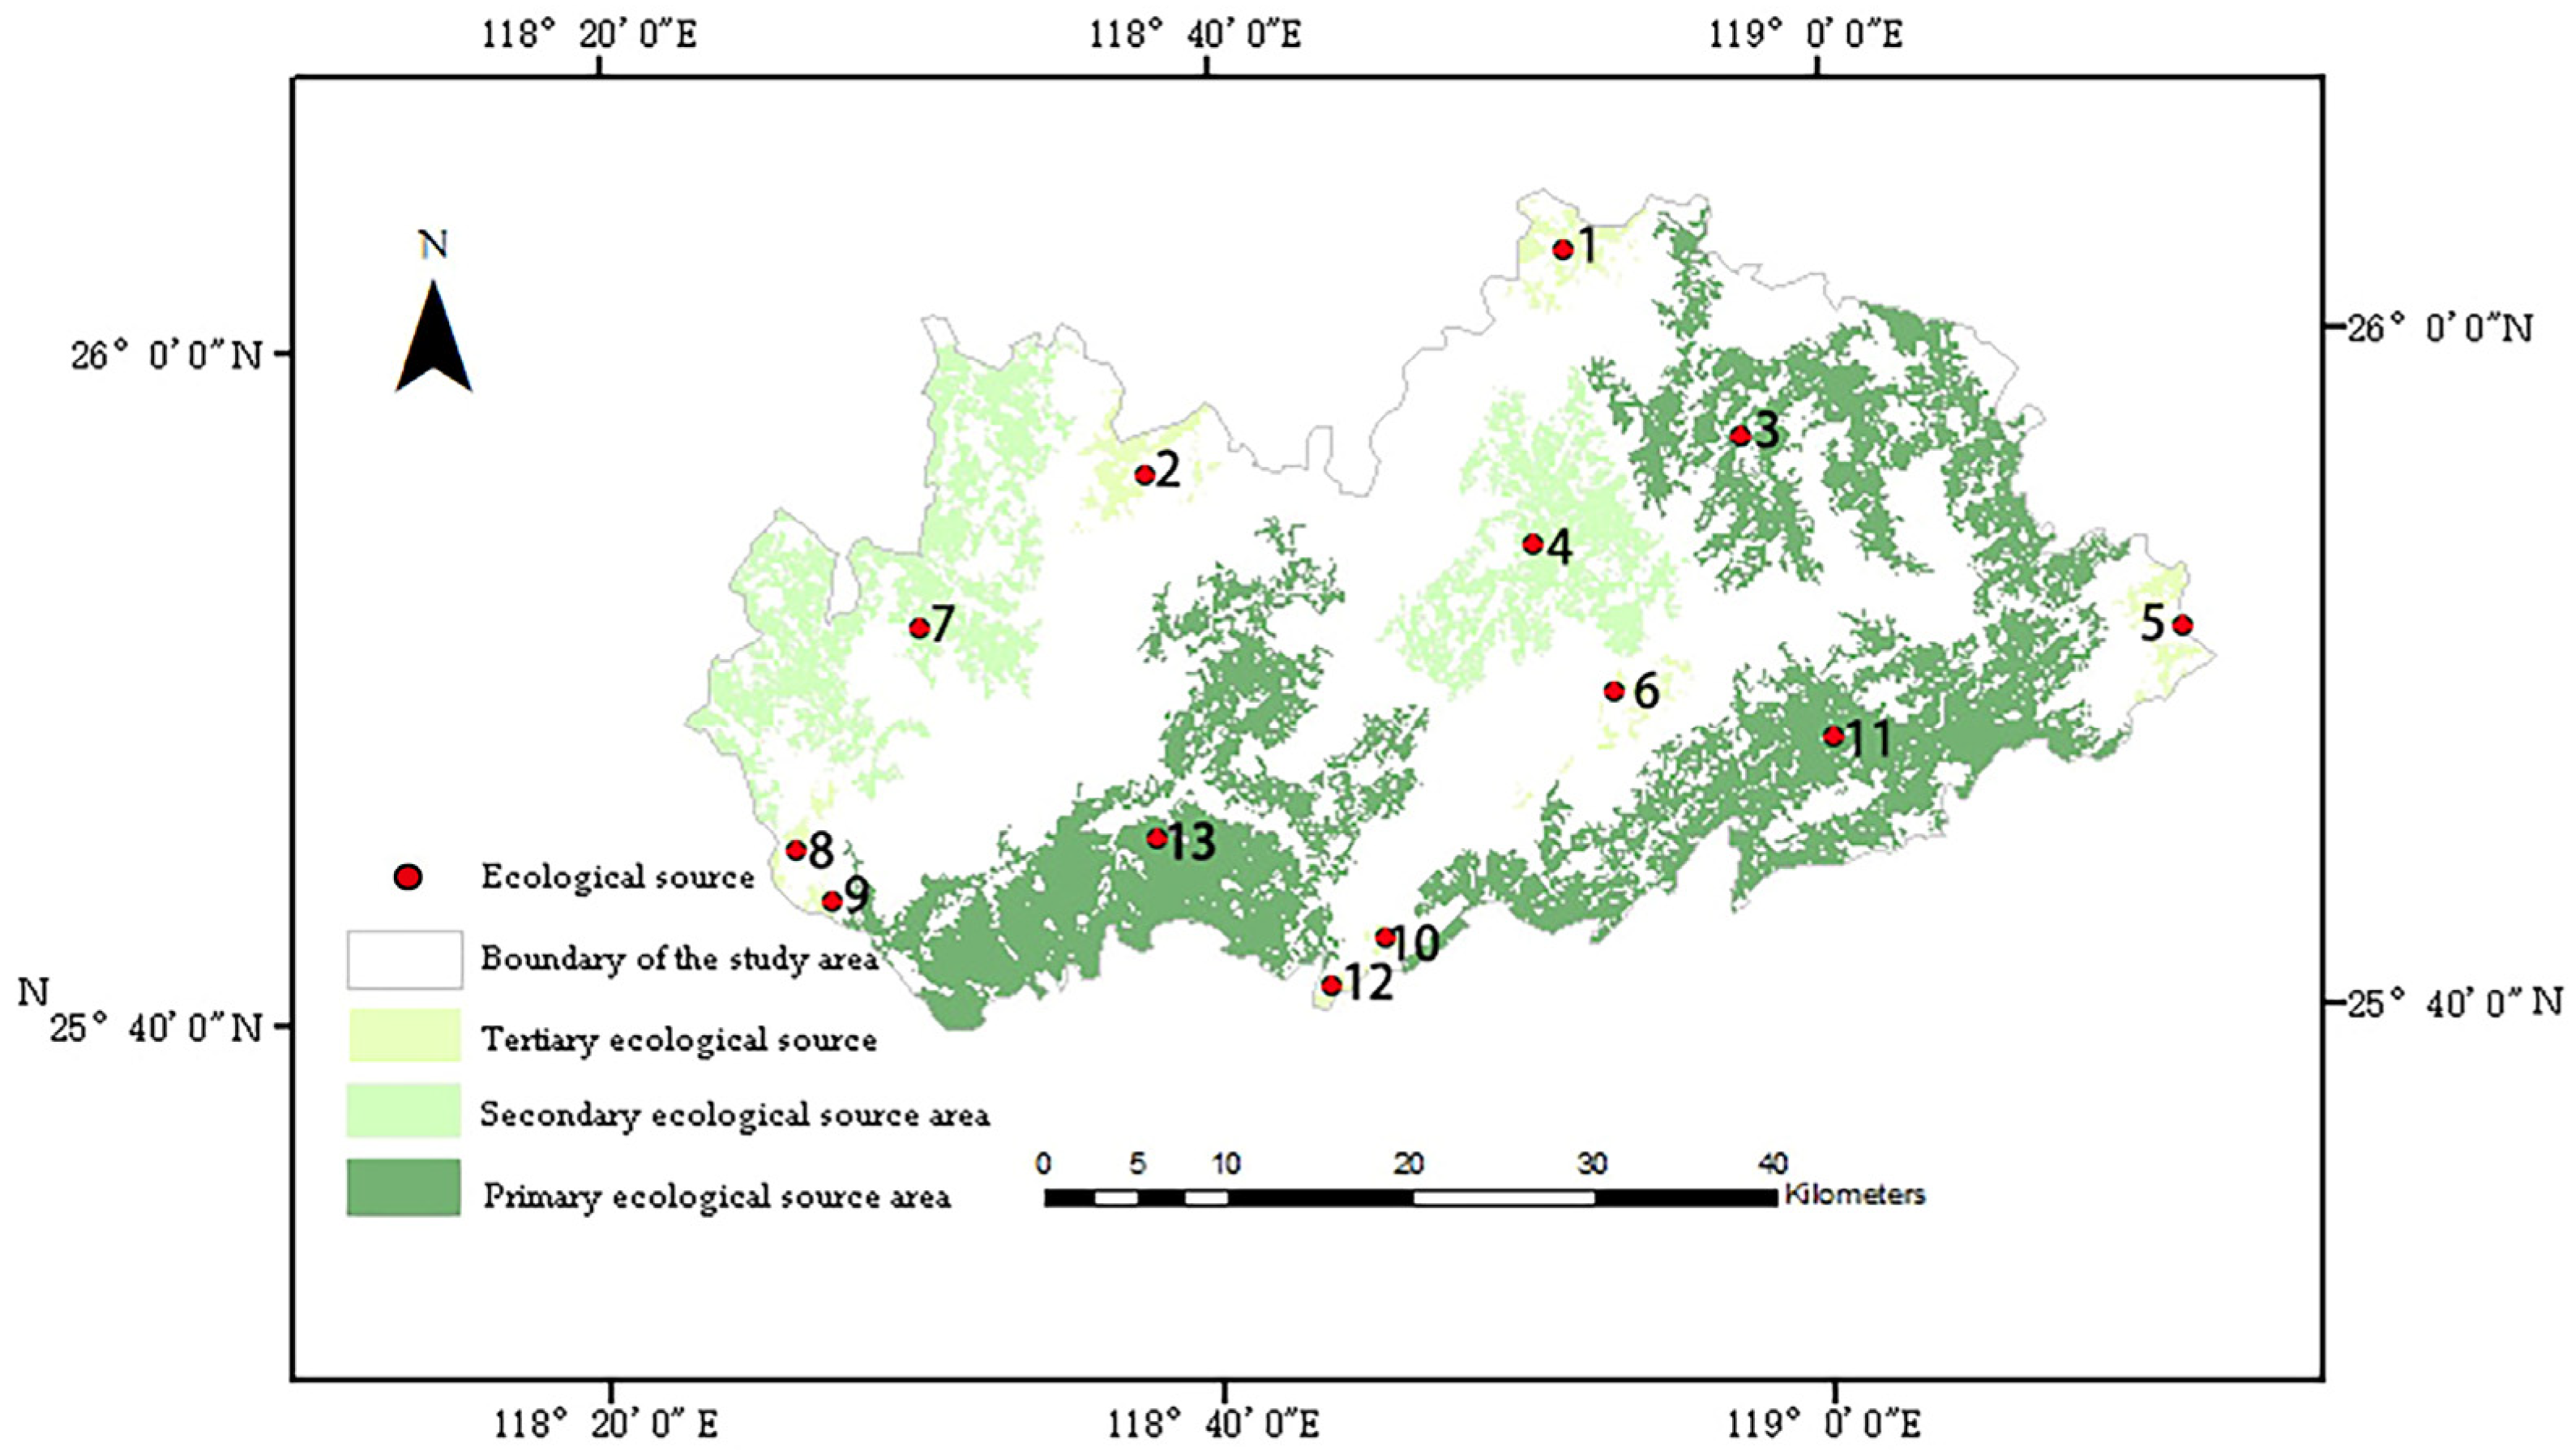
3.3. Ecological Source Extraction and Landscape Connectivity Evaluation in Yongtai County

Conefor 2.6 software was used to compute the landscape index, with the patch importance index (dPC) serving as the measurement standard. Thirteen core areas with dPC > 2 were identified and designated as ecological source areas (Table 4). Subsequently, based on the calculation outcomes, the patch importance index of ecological source areas was categorized into primary ecological source areas (dPC > 30), secondary ecological source areas (15 < dPC < 30), and tertiary ecological source areas (dPC < 15) (Figure 4). Higher connectivity indices of patches corresponded to greater dPC values, indicating enhanced stability of the ecosystem within the source area.
The distribution of ecological sources in Yongtai County, as depicted in Figure 4 and Table 4, reveals a predominant concentration in the eastern and southwestern regions, suggesting robust landscape connectivity between these areas. Conversely, the northern and central regions exhibit smaller ecological source areas, characterized by pronounced patch fragmentation and limited connectivity. Comparatively, patches in these regions hold relatively lower importance compared to those in the south, warranting an imperative to bolster ecological source construction efforts. Table 4 delineates three primary ecological source areas primarily situated in Yongtai County’s eastern and southern regions, where ecosystem service functionality is notably significant. These areas experience minimal human interference and are predominantly covered by expansive forested lands, hosting ecotourism scenic spots, nature reserves, and other ecologically significant zones. Patch 13 commands the highest dPC value at 61.75, spanning an area of 236.95 km2. Located north of the Shizhu Mountains, it encompasses the Baijigou ecotourism scenic spot, Matou Mountain, Daxi Reservoir, Jinming Xianshan, and various other biologically suitable habitats. Following closely are 11 patches, with a dPC value of 41.68, covering an area of 206.35 km2. Situated in the southeast of Yongtai County, these patches encompass the Tianmen Mountain Canyon Ecotourism Scenic Spot, Qingyun Mountain Scenic Spot, and numerous nature reserves. Patch 3, with a dPC value of 35.67, is primarily situated in the mountains around the Jiyan Scenic Area. There are two secondary ecological source areas, distributed in Yongtai County’s northwest and central regions, featuring smaller source areas. Additionally, eight tertiary ecological source areas, scattered along the county’s periphery with substantial spacing, exhibit dPC values below 15, hence contributing minimally to Yongtai County’s overall connectivity.

3.4. Ecological Network Construction and Analysis in Yongtai County

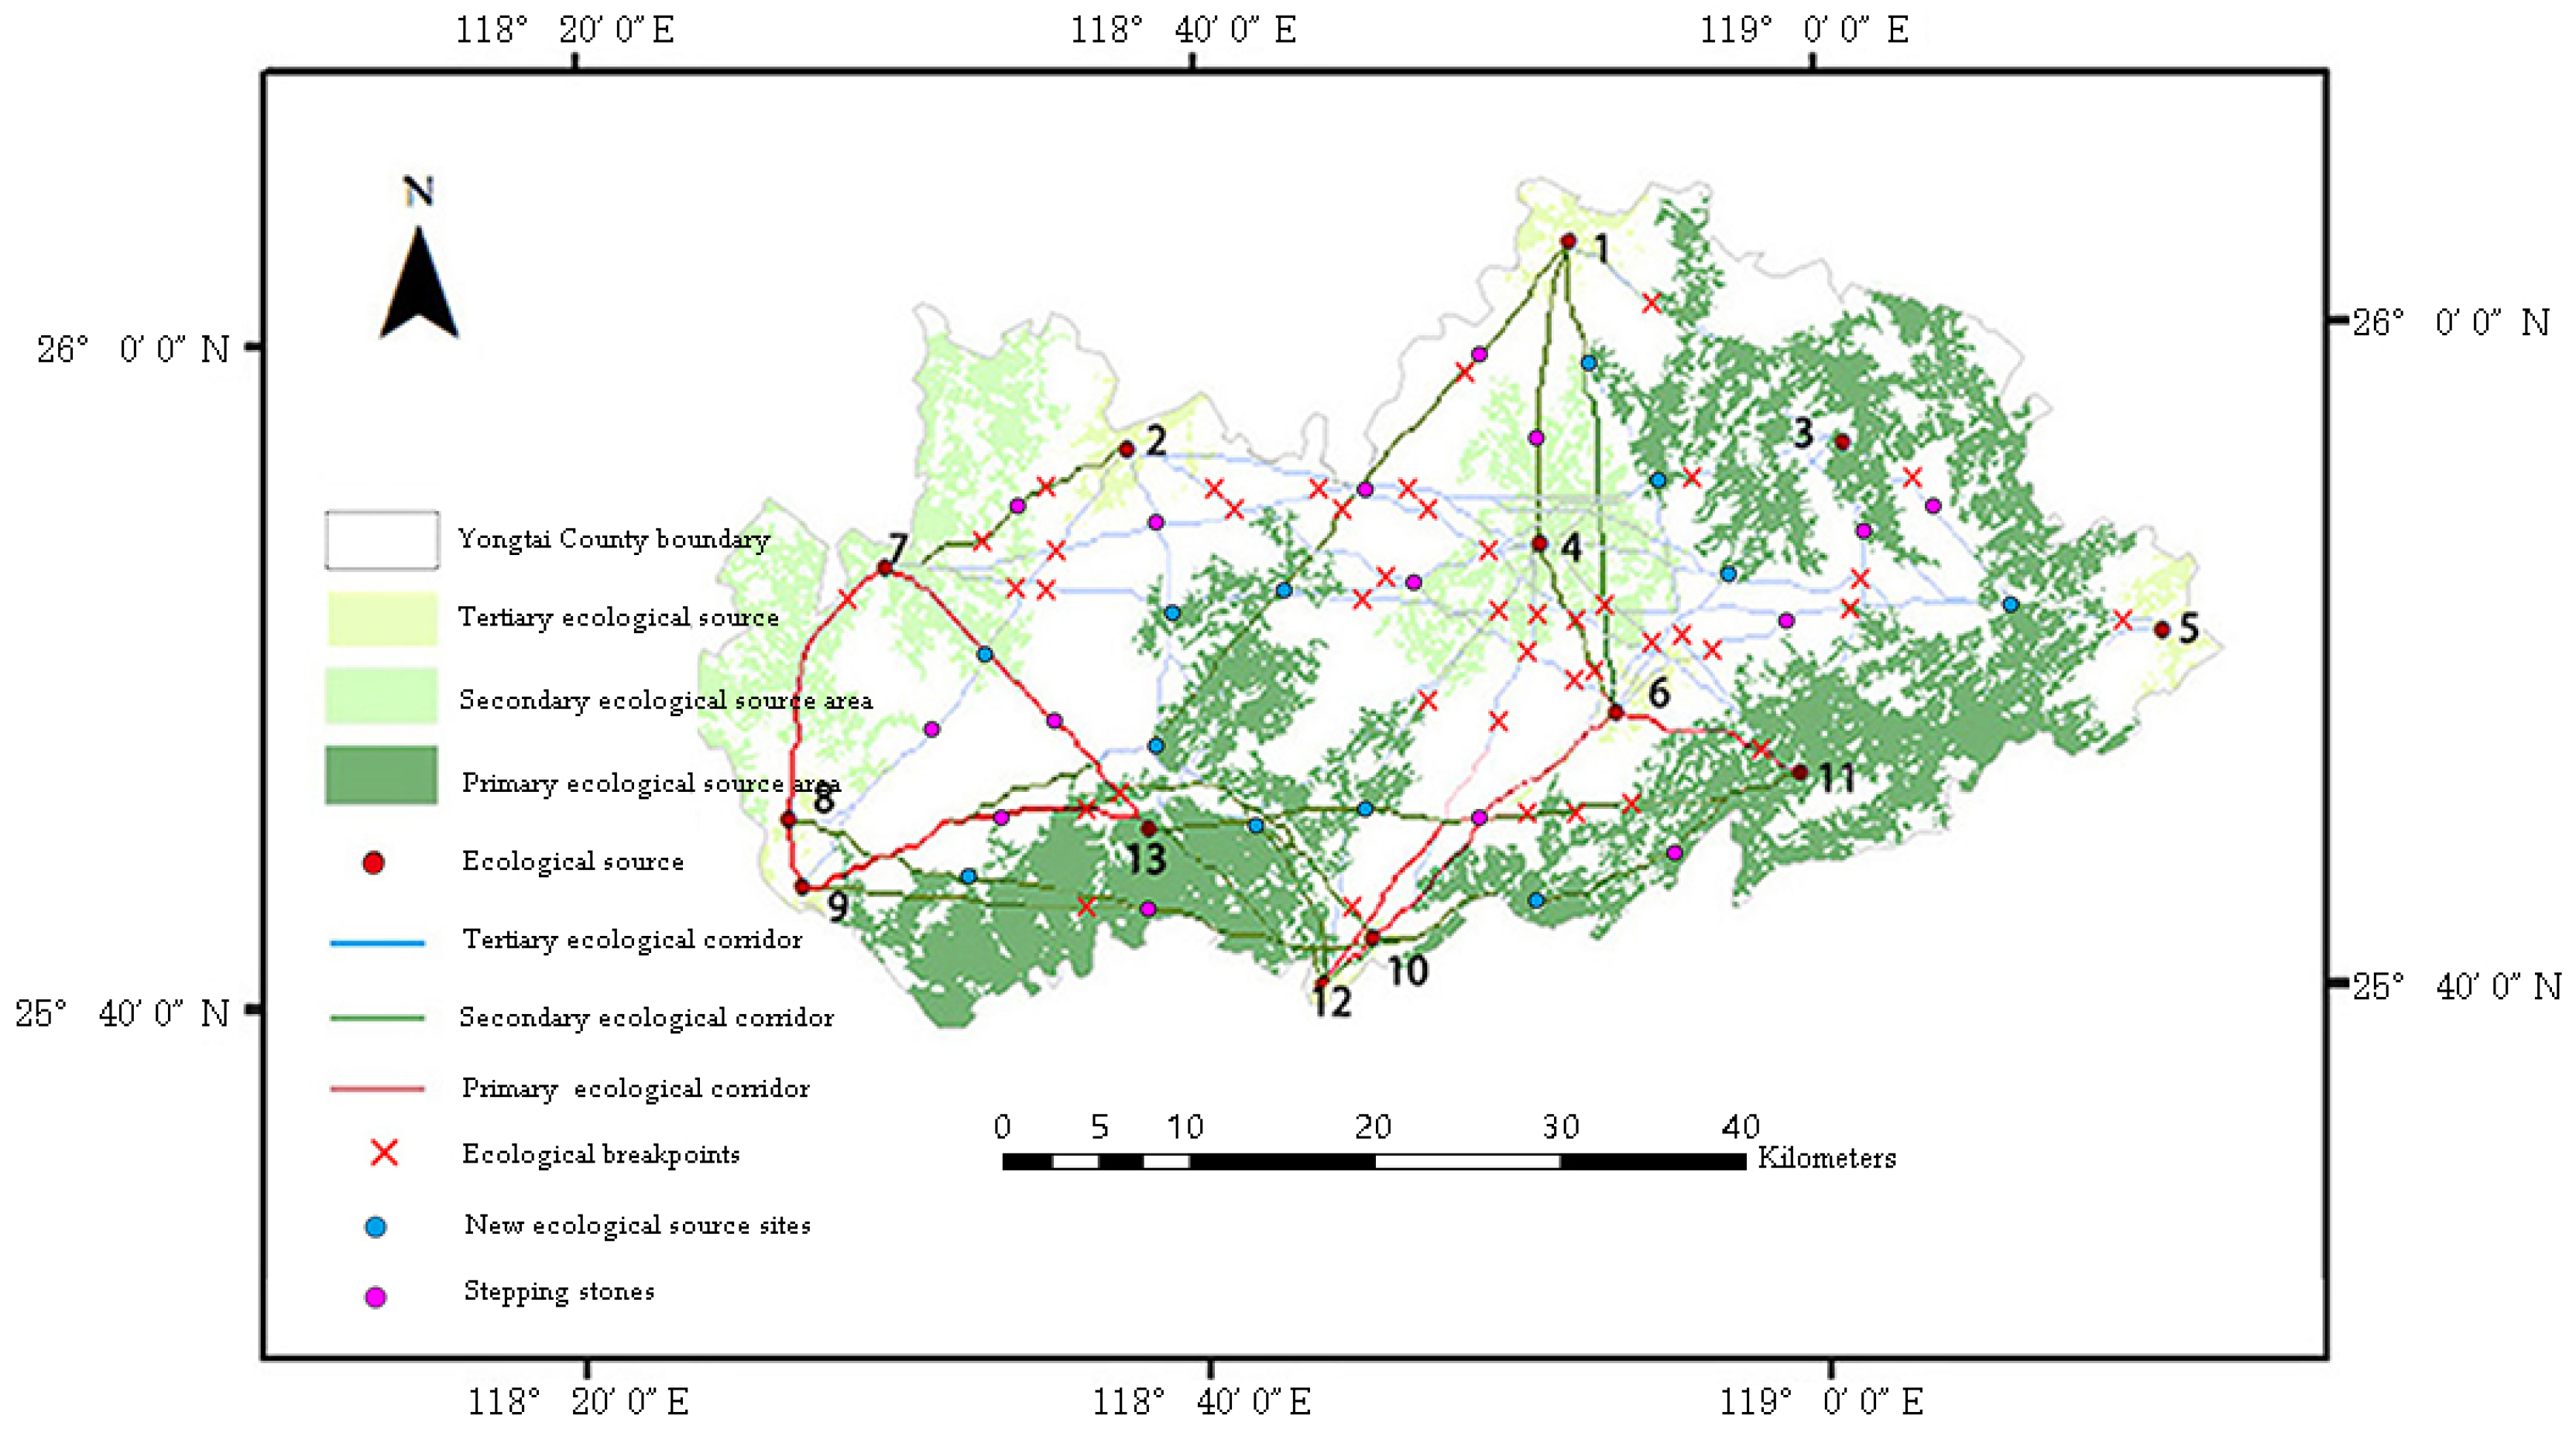
3.4.1. Extraction of Ecological Corridors in Yongtai County

The analysis of the integrated resistance surface (Figure 5) reveals a range of resistance values from 1.25 to 4.25. The central and northwestern regions exhibit elevated resistance values primarily because of the prevalence of urban, rural settlement, and agricultural land uses characterized by fine fragmentation and extensive habitat fragmentation. This pattern results from the intricate distribution of land use in the central area, including urbanization, rural settlements, and agriculture, leading to severe fragmentation of habitats. Railroads traverse the northwestern part, subjected to frequent human activities and significant disturbance. The presence of buildings, cultivated land, and railroads elevates resistance values in adjacent areas, impeding the flow of ecological energy. For natural forests with high ecological value, protective forests can be added for protection, and measures such as demolishing buildings and building stepping stones can be taken to alleviate the phenomenon of ecological fragmentation in the central region. Areas with lower resistance values are primarily situated in the southwest, southeast, and northeast. These areas feature higher elevations, steeper slopes, predominantly woodland cover, limited human presence, and superior habitats.
The MCR model utilizes the extracted ecological source areas and resistance surfaces to compute the minimum cumulative resistance value among these areas. Following the elimination of redundant corridors, a total of 78 potential ecological corridors are generated (Figure 6), forming a network distribution. Figure 5 illustrates the scarcity of ecological sources in the northwest and middle regions, resulting in a limited number of ecological corridors that are poorly integrated into Yongtai County’s overall ecological network, causing ecological disconnection. Consequently, in future ecological planning, priority should be given to developing this area as a focal point for construction efforts. At Baijigou Ecotourism Scenic Spot, Tianmen Mountain Canyon Ecotourism Scenic Spot, Ziezhai Mountain, Youyang Reservoir, and other locations, the close proximity of ecological source patches results in minimal flow path resistance, facilitating circulation. Consequently, ecological corridors in these regions exhibit dense distribution and promote effective ecological circulation. This observation suggests that constructing stepping stones in regions with limited ecological connectivity can significantly reduce the distance between patches and enhance the flow of ecological information.

3.4.2. Analysis of Ecological Corridors in Yongtai County

The gravity model was used to obtain the interaction strength between the 13 ecological source sites (Table 5). The higher the intensity, the higher the connection level between the ecological source sites, and the greater the significance of constructing corridors between the source sites. The gravity threshold was set to 500, and 8 primary ecological corridors, 13 secondary ecological corridors, and 67 tertiary ecological corridors were screened out (Figure 6). According to Table 5, the interaction strength between source 8 and 9 was the highest, at 50,793.22, indicating that the ecological gravitational force between the two is large, the connection is strong, the distance between the two places is close, and the resistance value is small, and in the future construction of corridors, we should focus on the implementation of such ecological corridors that are close to each other and have high interaction values. The interaction strength between source 3 and 2 is 0.39, and the ecological gravitational force is the smallest among all the source sites, because they are located in the east and west ends of Yongtai County, respectively, and the distance between them is far, and the resistance is large, and it is necessary to build ecological stepping stones between the source sites during the construction. In addition, the construction of such corridors requires a large cost. According to the distribution of corridors (Figure 6), the primary ecological corridors in Yongtai County are connected in a ring shape and a line shape, and the primary ecological corridors between source areas 7, 8, 9, and 13 are distributed in a ring shape and connected to the linear secondary ecological corridors between source areas 10, 11, 12, and 13. The above corridors are mostly located in the vicinity of the Baiji River Gorge Ecotourism Scenic Area, and attention should be paid to them in the planning to enhance the connectivity within the scenic area. Source sites 10, 11, 12, and 6 form a linear first-level ecological corridor, and source sites 3, 4, and 5 form a net-like third-level ecological corridor, which forms an important ecological barrier through the middle of Yongtai County with source sites 1 and 2, so as to reduce the impact of the fragmentation of ecological habitats in the middle of Yongtai County on the habitats of living organisms and their migrations. As can be seen from Figure 6, the lack of ecological sources in the central, southeastern, northeastern, and northwestern regions of Yongtai County results in the absence or scarcity of ecological corridors, leading to an incomplete ecological network in Yongtai County, which is not conducive to internal ecological cycles and flows. Therefore, it is necessary to add ecological stepping stones in this area to improve the overall network, such as building ecological buffer zones, or removing building facilities and replacing them with green areas, adding parks, etc., to strengthen the internal ecological links, promote ecological circulation, and alleviate the contradiction between urban development and environmental protection.

3.5. Optimization Strategy of Ecological Network in Yongtai County

Considering the specific conditions of Yongtai County and the outcomes of ecological network construction, this study optimizes the ecological network from the following three aspects: introducing new ecological sources, restoring ecological fracture points, and constructing stepping stones.

3.5.1. Establish and Protect Ecological Sources

Ecological source areas serve as vital functional nodes within the ecological network, playing a crucial role in upholding the stability of regional ecosystems. Notably, the central, western, and southern regions of Yongtai County lack connectivity. Consequently, based on the existing ecological source areas and considering the distribution of primary ecological source areas throughout Yongtai County, 12 core areas with enhanced connectivity were identified as new significant ecological source areas (refer to Figure 7). Subsequent efforts focused on ecological habitat protection within these 12 patches to enhance habitat quality. Moreover, the primary ecological source areas in the study area encompass extensive forests, scenic areas, and other sizable areas boasting favorable habitat conditions. These areas serve as vital biological reservoirs and migration sites for species, exerting profound influence on maintaining ecological balance and species diversity across the entire region. Accordingly, future planning endeavors should prioritize stringent protection measures for these primary ecological source areas. Additionally, concerted efforts should be made to plant more trees to establish connections between secondary ecological sources that are proximate and contiguous, thereby expanding the coverage of source areas, improving landscape connectivity, and bolstering ecosystem stability. As for the more distant tertiary ecological sources, particular attention should be directed towards protecting and constructing ecological corridors to ensure seamless connectivity within the overarching ecological network.

3.5.2. Rehabilitation of Ecological Breakpoints

Traffic road networks can hinder the occurrence of ecological processes, so that the landscape function is impaired, and the intersection of road network and ecological corridor is the area where the ecological corridor is easily fractured, which is called the ecological fracture point. In this study, 37 ecological breaks were identified in the study area by combining the data from the traffic network (Figure 7), and it is recommended to implement restoration through engineering measures, such as the construction of a special passageway flyover for animal migration, in order to reduce the impact of the road network on the migration and dispersal of species. The ecological fracture points in the study area are more concentrated in the south near the source patch; the area is densely populated with roads, forming an ecological fracture zone, and steps should be taken to reserve space for the construction of ecological corridors, enhance the area of green space, reasonably control the scope of construction land, reduce the interference of human activities, and ensure the migration of species and the normal flow of material and energy.

3.5.3. Building Stepping Stones

External activities and an area’s own conditions will affect the stability of the ecological corridor, and longer ecological corridors are more susceptible to external interference, resulting in lower stability. The connectivity between the north and south regions of Yongtai County is poor, the areas with high human activity intensity and comprehensive resistance value are concentrated in the center, and the distance between some ecological sources is large, which increases the chance of the ecological corridor being disturbed and prone to fracture, so it is necessary to quickly establish stepping stones to enhance the stability of the ecological corridor. Stepping stones are important temporary resting places in the process of biological migration, which can help to improve the success rate of species dispersal and migration as well as the survival rate of organisms. In this study, 15 stepping stones were identified in the middle of the ecological corridor, where the path of maximum cumulative resistance meets the ecological corridor, by combining the ecological network and ecological nodes (Figure 7).

4. Discussion

Compared with the traditional ecological network construction method, MSPA combined with the MCR model can be faster and more accurate in core area selection [10], source extraction, corridor screening, etc. The introduction of an resistance model to screen the importance of corridors can improve the scientific and reasonable ecological network construction [38]. When MSPA was used to analyze the landscape in this study, the edge could only be set to a uniform value due to the edge effect of MSPA [12]. In this study, the edge effect of Yongtai County was set to 30 m. However, Yongtai County has rich terrain and a variety of biological species, and some species are not suitable for living in the range where the edge effect is 30 m. In future research, the edge width setting of different species in the ecosystem should be clarified, and a more accurate and scientific ecological source identification method should be optimized or innovated. In addition, the main body of the ecological network is all kinds of species [36], so different types of control measures should be proposed [54], and corresponding migration corridors should be planned and constructed according to different species [23], so as to provide suggestions for the promotion of biodiversity conservation. Finally, the construction of ecological networks is an important strategy to restore and maintain ecological connectivity [47], and an important method to maintain ecological security and biodiversity [56]. Based on the aforementioned research, this study proposes protection recommendations for the ecological security pattern of Yongtai County, and the recommendations are as follows: (1) This study preliminarily constructs the ecological network system of Yongtai County and provides optimization measures for the ecological network. Based on the ecological elements and the direction of the corridors, in the future, we can start from the perspective of ecological protection, strengthen the control and management of the regional ecosystems, biodiversity, and the quality of the ecological environment, construct ecologically important barriers and ecological corridors, increase the connectivity of the ecological patches, and coordinate the common development of various ecological clusters in the region. (2) Construction of an important ecological barrier between the green water and green mountain restoration ring and the green heart experience ring of the nature reserve. Among the existing barriers, the green water and green mountain restoration belt is centered on the western and central areas of Yongtai County, where the degree of patch fragmentation is large, and is a key area for ecosystem restoration and biodiversity protection. The Nature Reserve Green Heart Experience Ring connects cultural and tourism attractions such as Qingyun Mountain Scenic Spot, Songkou Ancient Town, and the ecological source in the southwest of Yongtai County, and builds an ecological cultural and tourism system in Yongtai County with cultural and tourism attractions as the important nodes and ecological corridors and road green corridors as the guide lines. (3) Conservation and restoration of the ecological zone of Dazhang River, raising the ecological flow of river corridors in Yongtai County. It is recommended to create primary and secondary ecological corridors organically connecting ecological source patches, and comprehensively construct an ecological safety network in Yongtai County; promote the protection and restoration of water bodies, farmland, and forest land in multiple areas; and identify key areas for comprehensive watershed management, comprehensive land improvement, and forest quality enhancement to improve ecological quality and function. Yongtai County has strengthened the ecological protection of nature reserves such as Tianmen Mountain Canyon Ecotourism Scenic Spot and Baiji River Gorge Ecotourism Scenic Spot, built up barriers for the protection and restoration of forested land, and upgraded the functions of ecological sources.

5. Conclusions

This study employs MSPA and MCR models to construct the ecological network of Yongtai County. Initially, MSPA identifies ecological sources, with Conefor 2.6 software utilized for assessing landscape connectivity and grading these sources. Subsequently, the MCR model generates potential ecological corridors based on the comprehensive resistance surface, followed by quantitative analysis of corridor significance using the gravity model. The optimization of the ecological network involves augmenting and safeguarding ecological sources, rectifying ecological breakpoints, and establishing stepping stones. The research findings are as follows: (1) Ecological source areas in Yongtai County exhibit dispersion and fragmentation. The core area, identified through MSPA, spans 1071.06 km2, representing 64.52% of the study area, primarily concentrated in the southwest with notable stability. Bridge areas cover 206.82 km2, constituting 12.46% of the study area, necessitating strengthened protection and construction to bolster connectivity between ecological sources. Large edge areas with low connectivity and fragmented edges are susceptible to external interference. (2) A landscape index analysis reveals 13 ecological sources, predominantly wetlands and woodlands, situated in the eastern and southwestern regions. The absence of ecological sources in the northern and central areas results in an incomplete network system with imbalanced corridor distribution. Although Baiji Valley and Tianmen Mountain Canyon Ecotourism Scenic Area form significant ecological sources, the predominance of cultivated land in the western, northern, and central regions underscores the need for ecological stepping stones, achieved by converting farmland to forests. (3) Resistance value analysis highlights higher values in the middle and northwest regions, contrasting with lower values in the southwest, southeast, and northeast. Leveraging the resistance surface and MCR model, 78 potential ecological corridors are delineated, predominantly forming a network, with primary corridors typically arranged in a ring or linear pattern. Scant corridors in the northwest and middle impede internal ecological circulation, leading to ecological fragmentation. Primary corridors in the southwest and southeast extend from west to east, forming a barrier in the southern region. (4) The ecological network of Yongtai County is optimized by adding and protecting ecological sources, repairing ecological breakpoints, and building stepping stones. First, 12 core areas exhibiting enhanced connectivity are designated as significant new ecological sources. Second, leveraging traffic network data, 37 existing breakpoints are identified and remedied. Finally, 15 stepping stones are placed strategically within the ecological corridor, aligning with the intersection of the maximum cumulative resistance path and the ecological corridor. These optimization efforts not only enhance the integrity of the ecological network system but also elevate its biodiversity and ecosystem service value. This optimization enhances the ecological network’s integrity, biodiversity, and ecosystem service value.

Author Contributions

C.Z.: conceptualization, methodology, formal analysis, writing—original draft, writing—review and editing, visualization, software. X.T.: writing—review and editing, guidelines, Supervisions, funding acquisition. H.F. and Q.T.: formal analysis, writing—original draft, investigation. J.M.: methodological analysis, writing—original draft. H.G.: editing, formatting adjustments. All authors have read and agreed to the published version of the manuscript.

Funding

This study was funded by the National Natural Science Foundation of China under the project: “Research on the Spatial Evolution Mechanism of Lingnan Taoist Gardens”. Project Number is 51978272.

Institutional Review Board Statement

Not applicable.

Informed Consent Statement

Not applicable.

Data Availability Statement

No new data were created or analyzed in this study. Data sharing is not applicable to this article.

Conflicts of Interest

The authors declare no conflict of interest.

References

  1. Yuan, Y.H.; Xu, J.G. Research on the construction of landscape ecological network in mountainous cities. Urban Plan. 2015, 39, 105–112. [Google Scholar]
  2. Chen, Y.; Ma, Y.W.; Pan, J.F. Ecological network construction of a mountainous city taking into account the sensitivity of rocky desertification—A case study of Qujing City, Yunnan Province. J. Ecol. 2023, 43, 7060–7071. [Google Scholar]
  3. Chen, N.N.; Kang, S.Z. Construction of mountain ecological network in Qinling (Shaanxi section) based on MSPA and MCR models. J. Appl. Ecol. 2021, 32, 1545–1553. [Google Scholar]
  4. Zhang, S.F.; Li, Y.; Zhao, K.X. Optimization of green space landscape pattern in Guiyang City based on ecological network construction. China Gard. 2022, 38, 68–73. [Google Scholar]
  5. Du, Y.Y.; Hu, Y.N. Construction of ecological security pattern in southwest mountainous areas based on ecological importance and sensitivity—A case study of Dali Bai Autonomous Prefecture in Yunnan Province. J. Ecol. 2017, 37, 8241–8253. [Google Scholar]
  6. Li, H.; Liu, Y.; Li, Q.; Wang, X. Analysis of ecological security pattern in southern rare earth mining area based on MCR model. Geoscience 2020, 40, 989–998. [Google Scholar]
  7. Zhang, Y.X.; Biu, H.N. Construction of urban ecological security pattern based on MCR model—Taking Pingliang City in Gansu Province as an example. J. Nanjing Norm. Univ. (Nat. Sci. Ed.) 2021, 44, 54–62. [Google Scholar]
  8. Wang, X.L.; Wan, R.G. Construction and regulation of ecological security pattern in the Taihu Lake basin based on spatial morphology-minimum cumulative resistance model. J. Ecol. 2022, 42, 1968–1980. [Google Scholar]
  9. Qin, Z.B.; Xuan, J.; Huang, L.J. Construction of ecological network of island-type city based on MSPA and MCR modeling—Taking Pingtan Island of Fujian Province as an example. Soil Water Conserv. Res. 2023, 30, 303–311. [Google Scholar]
  10. Kowe, P.; Mutanga, O.; Dube, T. Advancements in the remote sensing of landscape pattern of urban green spaces and vegetation fragmentation. Int. J. Remote Sens. 2021, 42, 3797–3832. [Google Scholar] [CrossRef]
  11. Simpkins, C.E.; Dennis, T.E.; Etherington, T.R. Assessing the performance of common landscape connectivity metrics using a virtual ecologist approach. Ecol. Model. 2018, 367, 13–23. [Google Scholar] [CrossRef]
  12. Ke, S.; Zhang, Z.; Wang, Y. China’s forest carbon sinks and mitigation potential from carbon sequestration trading perspective. Ecol. Indic. 2023, 148, 110054. [Google Scholar] [CrossRef]
  13. Guo, H.Y.; Liu, J.W.; Chen, C.X. Construction of ecological network of nature reserves in Lancang River Basin of Yunnan Province. Soil Water Conserv. Bull. 2023, 43, 193–201. [Google Scholar]
  14. Clergeau, P.; Burel, F. The role of spatio-temporal patch connectivity at the landscape level: An example in a bird distribution. Landsc. Urban Plan. 1997, 38, 37–43. [Google Scholar] [CrossRef]
  15. Han, D.; Wang, C.; Yin, L.Q. Characteristics of nectar plant network and identification of important nectar plants in urban butterflies in Beijing. J. Ecol. 2021, 41, 8892–8905. [Google Scholar]
  16. Ostapowicz, K.; Vogt, P.; Riitters, K.H. Impact of scale on morphological spatial pattern of forest. Landsc. Ecol. 2008, 23, 1107–1117. [Google Scholar] [CrossRef]
  17. Rinaldo, A.; Gatto, M. River networks as ecological corridors: A coherent ecohydrological perspective. Adv. Water Resour. 2018, 112, 27–58. [Google Scholar] [CrossRef] [PubMed]
  18. Fábos, J.G. Green way plann in gin the United States: Its origins and recent case studies. Landsc. Urban Plan. 2004, 68, 321–334. [Google Scholar] [CrossRef]
  19. James, D.; Wickham, K.H.; Riitters, T.G. A national assessment of green infrastructure and change for the conterminous United States using morphological image processing. Landsc. Urban Plan. 2010, 94, 186–195. [Google Scholar]
  20. Koen, E.L.; Bowman, J.; Sadowski, C.; Walpole, A.A. Landscape connectivity for wildlife: Development and validation of multispecies linkage maps. Methods Ecol. Evol. 2014, 5, 626–633. [Google Scholar] [CrossRef]
  21. Jahanishakib, F.; Salmanmahiny, A.; Mirkarimi, S.H. Hydrological connectivity assessment of landscape ecological network to mitigate development impacts. J. Environ. Manag. 2021, 296, 113169. [Google Scholar] [CrossRef] [PubMed]
  22. Valero, E.; Álvarez, X.; Picos, J. Connectivity study in Northwest Spain: Barriers, impedances, and corridors. Sustainability 2019, 11, 5124. [Google Scholar] [CrossRef]
  23. Jongman, R.H. Ecological networks and greenways in Europe: Reasoning and concepts. J. Environ. Sci. 2003, 15, 173–181. [Google Scholar]
  24. Walker, N.J.; Schaffer-Smith, D.; Swenson, J.J. Improved connectivity analysis using multiple lowcost paths to evaluate habitat for the endangered San Martin titi monkey (Plecturocebus oenanthe) in north-central Peru. Landsc. Ecol. 2019, 34, 1859–1875. [Google Scholar] [CrossRef]
  25. Fremier, A.K.; Kiparsky, M.; Gmur, S.; Aycrigg, J.; Craig, R.K. A riparian conservation network for ecological resilience. Biol. Conserv. 2015, 191, 29–37. [Google Scholar] [CrossRef]
  26. Modica, G.; Praticò, S.; Laudari, L.; Ledda, A.; Di, F.S. Implementation of multispecies ecological networks at the regional scale: Analysis and multi-temporal assessment. J. Environ. Manag. 2021, 289, 112494. [Google Scholar] [CrossRef]
  27. Hashemi, R.; Darabi, H. The review of ecological network indicators in graph theory context: 2014–2021. Int. J. Environ. Res. 2022, 16, 24. [Google Scholar] [CrossRef]
  28. Pili, S.; Serra, P.; Salvati, L. Landscape and the city: Agro-forest systems, land fragmentation and the ecological network in Rome, Italy. Urban For. Urban Green. 2019, 41, 230–237. [Google Scholar] [CrossRef]
  29. Cunha, N.S.; Magalhaes, M.R. Methodology for mapping the national ecological network to mainland Portugal: Aplanning tool towards a green infrastructure. Ecol. Indic. 2019, 104, 802–818. [Google Scholar] [CrossRef]
  30. Harvey, E.; Gounand, I.; Ward, C.L.; Altermatt, F. Bridging ecology and conservation: From ecological networks to ecosystem function. J. Appl. Ecol. 2017, 54, 371–379. [Google Scholar] [CrossRef]
  31. Jing, H.; Chong, L.; Ying, Y.L. Construction of Greenland Ecological Network in West District of Zhuhai City Based on GIS. J. Northwest For. Coll. 2017, 32, 243–251. [Google Scholar]
  32. Chavez, J.P.S.; Berlin, G.L.; Sowers, L.B. Statistical method for selecting Landsat MSS ratios. J. Appl. Photogr. Eng. 1982, 8, 23–30. [Google Scholar]
  33. Hernandez, A.; Miranda, M.; Arellano, E.C. Landscape dynamics and their effect on the functional connectivity of a Mediterranean landscape in Chile. Ecol. Indic. 2015, 48, 198–206. [Google Scholar] [CrossRef]
  34. Bathiany, S.; Dakos, V.; Scheffer, M. Climate models predict increasing temperature variability in poor countries. Sci. Adv. 2018, 4, 5809. [Google Scholar] [CrossRef]
  35. Lumia, G.; Pratico, S.; Di, F.S. Combined use of urban Atlas and Corine land cover datasets for the implementation of an ecological network using graph theory within a multi-species approach. Ecol. Indic. 2023, 148, 110150. [Google Scholar] [CrossRef]
  36. Newton, A.C.; Hodder, K.; Cantarello, E. Cost–benefit analysis of ecological networks assessed through spatial analysis of ecosystem services. J. Appl. Ecol. 2012, 49, 571–580. [Google Scholar] [CrossRef]
  37. Víctor, R.; Javier, V.; Javier, G. Proposal of new Natura 2000 network boundaries in Spain based on the value of importance for biodiversity and connectivity analysis for its improvement. Ecol. Indic. 2021, 129, 461–468. [Google Scholar]
  38. Li, H.; Zheng, Y.T.; Huang, H. Construction of ecological network in Lushan City based on MSPA and MCR model. J. Cent. South For. Univ. Sci. Technol. 2024, 44, 98–107. [Google Scholar]
  39. Yang, W.Y.; Ye, H.Y. Identification of ecological networks in the Guangdong-Hong Kong-Macao Greater Bay Area based on habitat quality. J. Ecol. 2023, 43, 10430–10442. [Google Scholar]
  40. Liu, X.P.; Li, X.Y.; Li, Y.M. Construction and optimization of ecological networks in rapidly urbanizing areas—Taking Daxing District of Beijing as an example. J. Ecol. 2023, 43, 8321–8331. [Google Scholar]
  41. Du, X.Y.; Lu, F.N.; Wang, C.Y. Construction of county-scale ecological network based on MSPA-Conefor-MCR—Taking Yanqing District as an example. J. Appl. Ecol. 2023, 34, 1073–1082. [Google Scholar]
  42. Fang, Y.; Wang, J.; Huang, L.Y. Diagnosis and identification of key areas for ecological protection and restoration of national land space based on ecological security pattern—Taking Yantai City as an example. J. Nat. Resour. 2020, 35, 190–203. [Google Scholar]
  43. Gao, Y.; Mu, H.K.; Zhang, Y.L. Research on the optimization of the construction path of municipal scale green network system based on MSPA analysis method—Taking Zhaoyuan City as an example. J. Ecol. 2019, 39, 7547–7556. [Google Scholar]
  44. Hassan, S. Ecosystems and human well-being: Current state and trends. J. Bacteriol. 2005, 1, 1387–1404. [Google Scholar]
  45. Hawn, C.L.; Herrmann, J.D.; Griffin, S.R.; Haddad, N.M. Connectivity increases trophic subsidies in fragmented landscapes. Ecol. Lett. 2018, 21, 1620–1628. [Google Scholar] [CrossRef] [PubMed]
  46. Yang, K.; Cao, Y.G.; Feng, Z. Progress of ecological security pattern construction based on the least cumulative resistance model. J. Ecol. Rural Environ. 2021, 37, 555–565. [Google Scholar]
  47. Ye, H.; Yang, Z.; Xu, X. Ecological corridors analysis based on MSPA and MCR model—A case study of the Tomur World Natural Heritage Region. Sustainability 2020, 12, 959. [Google Scholar] [CrossRef]
  48. Zheng, Q.M.; Xing, Z.; Zhong, L.S. Construction of ecological security pattern in Pudacuo National Park. J. Ecol. 2021, 41, 874–885. [Google Scholar]
  49. Chen, X.; Peng, J.; Liu, Y.X. Construction of ecological security pattern in Yunfu City based on the framework of “importance-sensitivity-connectivity”. Geogr. Res. 2017, 36, 471–484. [Google Scholar]
  50. Lei, J.; Yan, X.Y. Evaluation of Urban Green Space System Planning Layout Based on Landscape Ecology—Taking Baotou Urban Area as an Example. J. Inn. Mong. Agric. Univ. (Nat. Sci. Ed.) 2007, 4, 248–253. [Google Scholar]
  51. Liu, Y.D.; He, Z.W.; Chen, J.H. Research on ecological network construction method based on MSPA and MCR modeling–Taking Nanchong City as an example. Southwest J. Agric. 2021, 34, 354–363. [Google Scholar]
  52. Han, S.H.; Mei, Y.G.; Ye, Z.Y. Construction of ecological security pattern in Yanping District, Nanping City, Fujian Province based on the least cumulative resistance model. Soil Water Conserv. Bull. 2019, 39, 192–198+205. [Google Scholar]
  53. Jiang, S.M.; Zhang, Y.; Tao, H.C. Construction and evaluation of green space ecological network in Guangzhou. J. Sun Yat-Sen Univ. (Nat. Sci. Ed.) 2016, 55, 162–170. [Google Scholar]
  54. Johnston, S.; Good, R. The Benefits of Restored Linear Vegetation Corridors for Biodiversity Conservation: A Case Study. Australas. Plant Conserv. J. Aust. Netw. Plant Conserv. 2016, 24, 22–24. [Google Scholar] [CrossRef]
  55. Chen, X.Y.; Chen, W.B. Construction and evaluation of ecological network in Poyang Lake Ecological and Economic Zone. J. Appl. Ecol. 2016, 27, 1611–1618. [Google Scholar]
  56. Loro, M.; Ortega, E.; Arce, R.M.; Geneletti, D. Ecological connectivity analysis to reduce the barrier effect of roads. An innovative graph⁃theory approach to define wildlife corridors with multiple paths and without bottlenecks. Landsc. Urban Plan. 2015, 139, 149–162. [Google Scholar] [CrossRef]
  57. Csermely, P. The wisdom of networks: General adaptation and learning mechanism of complex systems: The network core triggers fast responses to Known Stimulis innovations require the slow network periphery and are encoded by core-remodeling. Bioessays 2017, 40, 1700150. [Google Scholar] [CrossRef]
Figure 1. Location map of Yongtai County.
Sustainability 16 05559 g001
Figure 2. Distribution of land use types in Yongtai County.
Sustainability 16 05559 g002
Figure 3. Results of landscape pattern analysis of Yongtai County based on MSPA.
Sustainability 16 05559 g003
Figure 4. Yongtai County ecological source land results analysis map.
Sustainability 16 05559 g004
Figure 5. Yongtai County comprehensive resistance surface.
Sustainability 16 05559 g005
Figure 6. Potential ecological corridors in Yongtai County.
Sustainability 16 05559 g006
Figure 7. Optimized ecological network system of Yongtai County.
Sustainability 16 05559 g007
Table 1. Seven landscape types and ecological significance of Yongtai County based on MSPA.
Landscape TypesDescription
CoreHigh vegetation coverage, with ecological functions such as providing habitats for biological species, is of great significance for biodiversity conservation, and covers large habitat patches.
BridgeLong narrow patches connecting more than two core areas play a role in corridor connectivity for species migration and energy exchange. In this study, this is manifested as strip green spaces, protective forest belts, and river channels with riverbank green belts.
IsletRelatively isolated, habitat patches can serve as stepping stones for biological migration.
BranchOnly one end is connected to the core area, which is conducive to the local diffusion of core area biota patches.
LoopPathway for the exchange of material energy within the same core area.
PerforationSmall non-habitat patches within large habitat patches.
EdgeTransition zones with obvious edge effects between core areas and non-habitat patches, serve as buffer zones between core areas and external backgrounds or non-habitat patches.
Table 2. Resistance factor grading assignment.
Resistance FactorClassificationResistance ValueWeight
MSPA Landscape TypeCore, Bridge10.2
Branch, Islet2
Loop, Edge3
Perforation4
Background5
Distance from road (m)<12010.25
120~2002
200~3003
300~4004
>4005
Elevation (h)/m<27510.15
275~5002
500~7003
700~9604
>9605
Land UseWetland10.25
Woodland2
Arable land Grassland3
Naked land4
Construction Land5
Slope (i)<1010.20
10~252
25~353
35~454
>455
Table 3. Yongtai County outlook categorized statistical tables.
TypeArea/km2Percentage of Foreground Area/%Percentage of Study Area/%
Core1071.0664.52%48.02%
Bridge206.8212.46%9.27%
Islet13.990.84%0.63%
Edge154.269.29%6.92%
Perforation78.154.71%3.50%
Loop94.845.71%4.25%
Branch40.992.47%1.84%
Total1660.12100.00%74.42%
Table 4. Yongtai County ecological source land fact sheet.
CodedPCArea (km2)Area as a Percentage of Total Ecological Source Area (%)
1361.75236.9525.15%
1141.68206.3521.90%
335.67168.7917.92%
727.18147.7615.69%
417.2992.629.83%
107.892.990.32%
126.953.140.33%
85.537.230.77%
94.993.280.35%
14.2821.162.25%
23.7822.192.36%
63.0714.491.54%
52.7515.071.60%
Table 5. Matrix of inter-patch interactions in ecological source lands in Yongtai County.
Code12345678910111213
103.896.0310.133.34195.7554.9526.3042.1931.7041.7534.9429.06
2 00.391.510.5032.92156.7631.1149.3116.026.1317.9635.56
3 01.641.8054.886.854.216.756.8516.457.385.42
4 01.22242.8719.409.4915.3518.1422.2718.6314.56
5 056.9111.266.9811.169.4128.5110.428.11
6 0697.94416.11676.211518.932040.471413.03793.56
7 03456.103409.66484.46141.01541.151267.32
8 050,793.22279.4885.94313.56862.52
9 0460.18138.40516.061466.75
10 0166.8613,350.39926.64
11 0174.81121.45
12 0950.50
13 0
Disclaimer/Publisher’s Note: The statements, opinions and data contained in all publications are solely those of the individual author(s) and contributor(s) and not of MDPI and/or the editor(s). MDPI and/or the editor(s) disclaim responsibility for any injury to people or property resulting from any ideas, methods, instructions or products referred to in the content.

