Article

Analysis of the Decoupling Relationship between Environmental Pollution and Economic Development in Island Areas: A Case Study of Zhoushan Islands, China

1
School of Management, Ocean University of China, Qingdao 266000, China
2
School of Economics and Management, Zhejiang Ocean University, Zhoushan 316000, China
*
Author to whom correspondence should be addressed.
Sustainability 2024, 16(13), 5567; https://doi.org/10.3390/su16135567
Submission received: 5 June 2024 / Revised: 25 June 2024 / Accepted: 25 June 2024 / Published: 28 June 2024
(This article belongs to the Special Issue Natural Quality, Environmental Resources and Global Value Chain)

Abstract

:
Due to the geographical location and resource characteristics of island region, it is important to make its strategic position in the country and even the world. In order to realize the sustainable development of island region, it is necessary to conduct in-depth research on the interaction between the economy and the environment in island region. By combining the decoupling model and EKC theory, this paper adopted the data of economic growth and environmental pollution indexes from 2002 to 2022 to explore the relationship between economic growth and environmental pollution in Zhoushan Island, China. According to research findings, the overall decoupling state between environmental pollution and economic growth in Zhoushan Islands was not very stable, and EKC analysis further revealed that the decoupling of industrial waste gas, industrial solid waste and industrial wastewater was basically consistent with the EKC analysis results. It was not completely consistent with the traditional inverted U-shaped EKC, but showed an incremental relationship, meaning that as the economy grows, so do its emissions. In order to realize the coordinated and sustainable development of the regional economy and society, Zhoushan Islands should further implement industrial optimization and upgrading, adjust the energy structure, improve the scientific and technological level of environmental management, and strengthen inter-departmental cooperation in law enforcement.

1. Introduction

With the rapid development of economy, the consumption of resources by human activities is increasing, while the waste is continuously discharged to nature. At the same time, environmental problems are facing major challenges. As a special ecosystem of the earth, the island area has a relatively fragile ecological environment and a more limited ability to withstand pollution. Over-exploitation and unreasonable economic activities can easily lead to environmental pollution, destroy ecological balance, and even spill pollutants through the ocean to other areas. Therefore, the ecological and environmental problems in the island area have aroused widespread interest from various countries and all sectors of society in the world. How to coordinate the relationship between the economy and the environment in the island area is crucial to accelerate the sustainable development of the island area and safeguard the country’s marine rights and ecological security. Analyzing the research results of scholars at home and abroad, although some achievements had been made in the fields of economic construction [1,2], sustainable development evaluation [3,4] and tourism development strategy [5,6] in island areas, there were still some deficiencies and limitations to be improved. For example, the research on the unique ecosystem and environmental problems in island areas was not comprehensive enough, and most of them were analyzed from the perspective of certain industry; the analysis of the interaction mechanism between environmental change and economic development was not deep enough [7,8], mostly based on qualitative analysis [9,10], or the research cycle was not long enough [11,12]. In particular, in the research on the relationship between economy and environment by using EKC theory or decoupling model, most of them focused on the national or provincial level, but few analyzed the prefecture-level city as the research unit. At the same time, it was rare to use the above two theories together.
Taking the island region as the carrier and China’s Zhoushan Islands as the research object, this paper adopted the long-period index data of 21 years to explore the interaction mechanism between economy and environment in the island region. Firstly, this paper analyzed the state of economic development and environmental pollution of Zhoushan Islands by means of decoupling theory and determined whether economic growth changes synchronously with pollution emission. Secondly, the paper analyzed the specific situation of Zhoushan Islands with EKC theory and explored the nonlinear relationship between economic growth and environmental pollution in a certain absolute quantity. With the deep implementation of green city construction in Zhoushan Islands, the major problem that must be solved is coordination and sustainability of the regional economy and environment, and the important prerequisite for solving it is to quantitatively identify the relationship between regional economic development and environmental pressure. Zhoushan Islands, located in the East China Sea on the south side of the Yangtze River Estuary and the outer edge of Hangzhou Bay, is the only prefecture-level city in China composed of islands. With its unique geographical location and abundant marine resources, the urban economic development achieved tremendous achievements. From 2002 to 2022, the total GDP of the city increased from 15.73 billion yuan to 195.13 billion yuan, with an annual average growth of 13.42%; The total output value of industries above designated size increased from 19.01 billion yuan to 335.01 billion yuan, an average annual growth of 15.43%. The proportion of industrial added value in GDP increased from 33.9% to 48.7%, transforming from a traditional fishing-oriented city to an industrial city with coastal petrochemical, shipbuilding and offshore equipment manufacturing as its main industries. Moreover, a fairly good ecological environment is a valuable resource advantage of Zhoushan Islands. The air quality in the urban area had reached the national secondary standard all year round. In 2022, the water quality of the centralized drinking water sources above the county level in the city was 100%, and the water quality of the surface water transfer section was also 100%. At the same time, 95.0% of the surface water above municipal control was Class I-III in Zhoushan Islands. However, in the face of the slowdown of economic growth under the new normal, Zhoushan Islands’s economic development pressure was bound to increase day by day. In this context, it was a matter of concern whether more pressure will be exerted on the ecological environment in exchange for economic development. From the current data of the city, the total amount of industrial waste gas emissions from 2001 to 2022 increased from 10,259,170,000 to 337,812,660,000 standard cubic meters, with an average annual increase of 18.1%, and the total industrial solid waste emissions increased from 210,300 tons to 2,723,900 tons, an average annual increase of 13.0%, and the total industrial waste water discharge increased from 9.378 million tons to 23.90 million tons, with an average annual increase of 4.6%, indicating that along with economic development, environmental pressure tends to increase in Zhoushan Islands.

2. Literature Review

The decoupling theory was originally proposed by the Organization for Economic Cooperation and Development (OECD) to explore the relationship between regional economic development, environmental pollution and resource depletion [13], based on the long-term high dependence of economic growth on material consumption [14]. In recent years, more and more scholars had begun to explore the decoupling theory, and most of them currently concentrated on the measurement of energy [15,16], resources [17,18], carbon emissions [19,20] and so on, while there are few studies on the decoupling between economy and environment, mostly from the perspective of countries or provinces: Taking the BRICS countries as the research object, Sobia et al. [21] analyzed the decoupling state of environmental pollution and economic growth. Based on regional analysis, Kokovskyy [22] explored economic growth and pollutant emissions in Ukraine, showing that the decoupling of economic growth and pollutant emissions growth has begun, but the decoupling process had large regional differences. Based on the scientific development concept and theory, Zhao et al. [23] quantitatively analyzed the degree of decoupling between economic growth and resource and environmental pressure in Yunnan Province by using the decoupling evaluation method improved by elasticity analysis. With the deepening of the research, the research object gradually focused on certain types of environmental pollutants: Taking 31 provinces in China as the research object, Liu et al. [24] found that the decoupling between China’s economic development and wastewater began to appear, and the formulation and implementation of environmental policies in China had little relationship with the economic slowdown. Ren and Ma, [25], combining study of the decoupling model, found that industrial growth and industrial air pollution in Jilin Province are mainly in absolute decoupling. With the further development of the decoupling theory, some scholars found that the decoupling index will change with the selection of different base periods, and thus cannot accurately judge the decoupling state of economic growth and resources and environment [26,27]. Therefore, some scholars conduct research through the combination of decoupling theory and EKC, but the overall number of studies using this comprehensive perspective is still limited: By organically combining the decoupling model and EKC theory, Gao and Ma, [28] conducted an in-depth discussion on the relationship between economic development and environmental pollution in the western region of China and found that the overall decoupling trend in the western region was not very stable, and economic development still brought high pollution. Wu et al. [29] used the decoupling model and EKC model to analyze economic growth and environmental pressure in Anhui province, which showed that economic growth and environmental pressure in Anhui province basically realized relative decoupling, but environmental pressure did not decrease.
The theory of environmental Kuznets curve (EKC) was first proposed by Grossman and Krueger after studying the relationship between per capita income and environmental quality in many countries, and it presented the inverted U-shaped relationship, that is, in the initial stage of economic development, the environmental quality continued to deteriorate, and when it reached a certain critical point, the environmental quality would be improved again with economic development [30]. Later, the theory began to be widely used in the study of the relationship between economic growth and environmental quality and had been verified by many scholars. For example, Dagmawe et al. [31] conducted a quantitative analysis of sub-Saharan Africa’s economic growth and environmental quality and found that the two have significant EKC curve characteristics. Nafeesa et al. [32] used the spatial econometric model to verify the EKC hypothesis in South Asia. Bedakiyiba et al. [33] analyzed the relationship between economic growth and environmental pollution in West Africa and obtained a typical inverted U-shaped EKC between pollutants and economic indicators. However, with further development of the research, the traditional inverted U-shaped EKC cannot be proved in some cases, but some N-shaped EKC, inverted N-shaped EKC and S-shaped EKC had been found and empirically tested: Ling and Zhang, [34] found and tested the increasing linear relationship between industrial waste gas and economic development level in Guangdong Province, and industrial wastewater and solid waste were in line with the EKC characteristics of N-shaped EKC and inverted N-shaped EKC, respectively. Moutinho et al. [35] conducted an empirical analysis of EKC in Portugal and Spain and found a new environmental Kuznets curve with an inverted N-shaped EKC. Mythili and Mukherjee, [36] did not find the traditional inverted “U” curve through the empirical analysis of India, but a new “slanted S-shaped” EKC.
Therefore, this paper effectively combined the decoupling theory with the EKC theory. By discussing the absolute and relative changes of GDP and industrial pollutants, the paper determined whether the decoupling state lags behind economic growth, and explored the evolution process between economic development and environmental pollution of Zhoushan Islands in a more accurate and reliable way. Thus, it provided policy basis for Zhoushan Islands to achieve coordinated development of economy and environment, accelerate the exploration of a new path of high-quality development oriented by ecological civilization priority and green development, and then provided a reference case for sustainable economic development and ecological environmental protection in the global island region.

3. Study Design

3.1. Methods

3.1.1. Decoupling Model

Decoupling theory can be used to describe the correlation between economic development and environmental pressure [26]. At present, it is widely used in water resource utilization [37,38], urban land expansion [39,40], industrial carbon emission [41,42] and other fields. The OECD divided the decoupling relationship into two types, relative decoupling and absolute decoupling. If both economic growth and environmental pressure growth are positive, but the former is greater than the latter, it is called relative decoupling; If the growth rate of environmental pressure is negative or zero, while economic growth is still positive, it is called absolute decoupling. Moreover, Tapio [43] used the concept of decoupling elasticity coefficient and combined the changes of pollutant increment and economic increment to divide the decoupling states into eight types, as shown in Table 1. As the model is not affected by statistical dimensions and has a more refined division, it is the main method to study the decoupling relationship between economy and environment. Its calculation formula is as follows:
e = E F = Y / Y t 1 X / X t 1
In the formula, “e” is the decoupling elasticity coefficient; “Y” is the indicator of each pollutant, “ΔY” is the increment of pollutants, “ΔE” is the incremental change rate of pollutants; “X” is the indicator of economic development, “ΔX” is the increment of economic growth, “ΔF” is the change rate of economic growth, “t” is the current period, and “t − 1” is the base period.

3.1.2. EKC Model

The EKC theory describes the natural realization process of the decoupling relationship between economic growth and environmental pressure, that is, with economic growth, environmental pressure will automatically decline after reaching a peak value, thus showing an inverted U-shaped relationship with income level [29]. This theory is generally applied to the formulation of environmental policies [44,45], carbon emissions [46,47], and the assessment of the sustainability of economic growth [48,49]. The common EKC models usually include quadratic functions, cubic functions and logarithmic functions and the calculation models are as follows:
y = β 0 + β 1 x + β 2 x 2 + ε
y = β 0 + β 1 x + β 2 x 2 + β 3 x 3 + ε
l n y = β 0 + β 1 l n x + β 2 ( l n x ) 2 + β 3 ( l n x ) 3 + ε
In the formulas, “y” represents the amount of pollutant emissions, “x” represents the regional GDP, “β0” is a constant term, “β1”, “β2”, and “β3” are model parameters, and “ε” is a random error term. According to the different values of “β1”, “β2” and “β3”, it can reflect the different relationship between economic development and environmental pollution, as shown in Table 2.

3.2. Indicator Selection and Data Sources

Considering the availability of data, this paper selected the gross regional product (GDP) to measure the economic development level of Zhoushan Islands. Since the discharge of domestic pollutants accounted for a relatively small proportion of the total pollutants, industrial pollutants were selected to represent the degree of environmental pollution, including the discharge of industrial waste gas, the discharge of industrial solid waste and the discharge of industrial waste water. All the above data come from the “Zhoushan Statistical Yearbook” from 2003 to 2023.

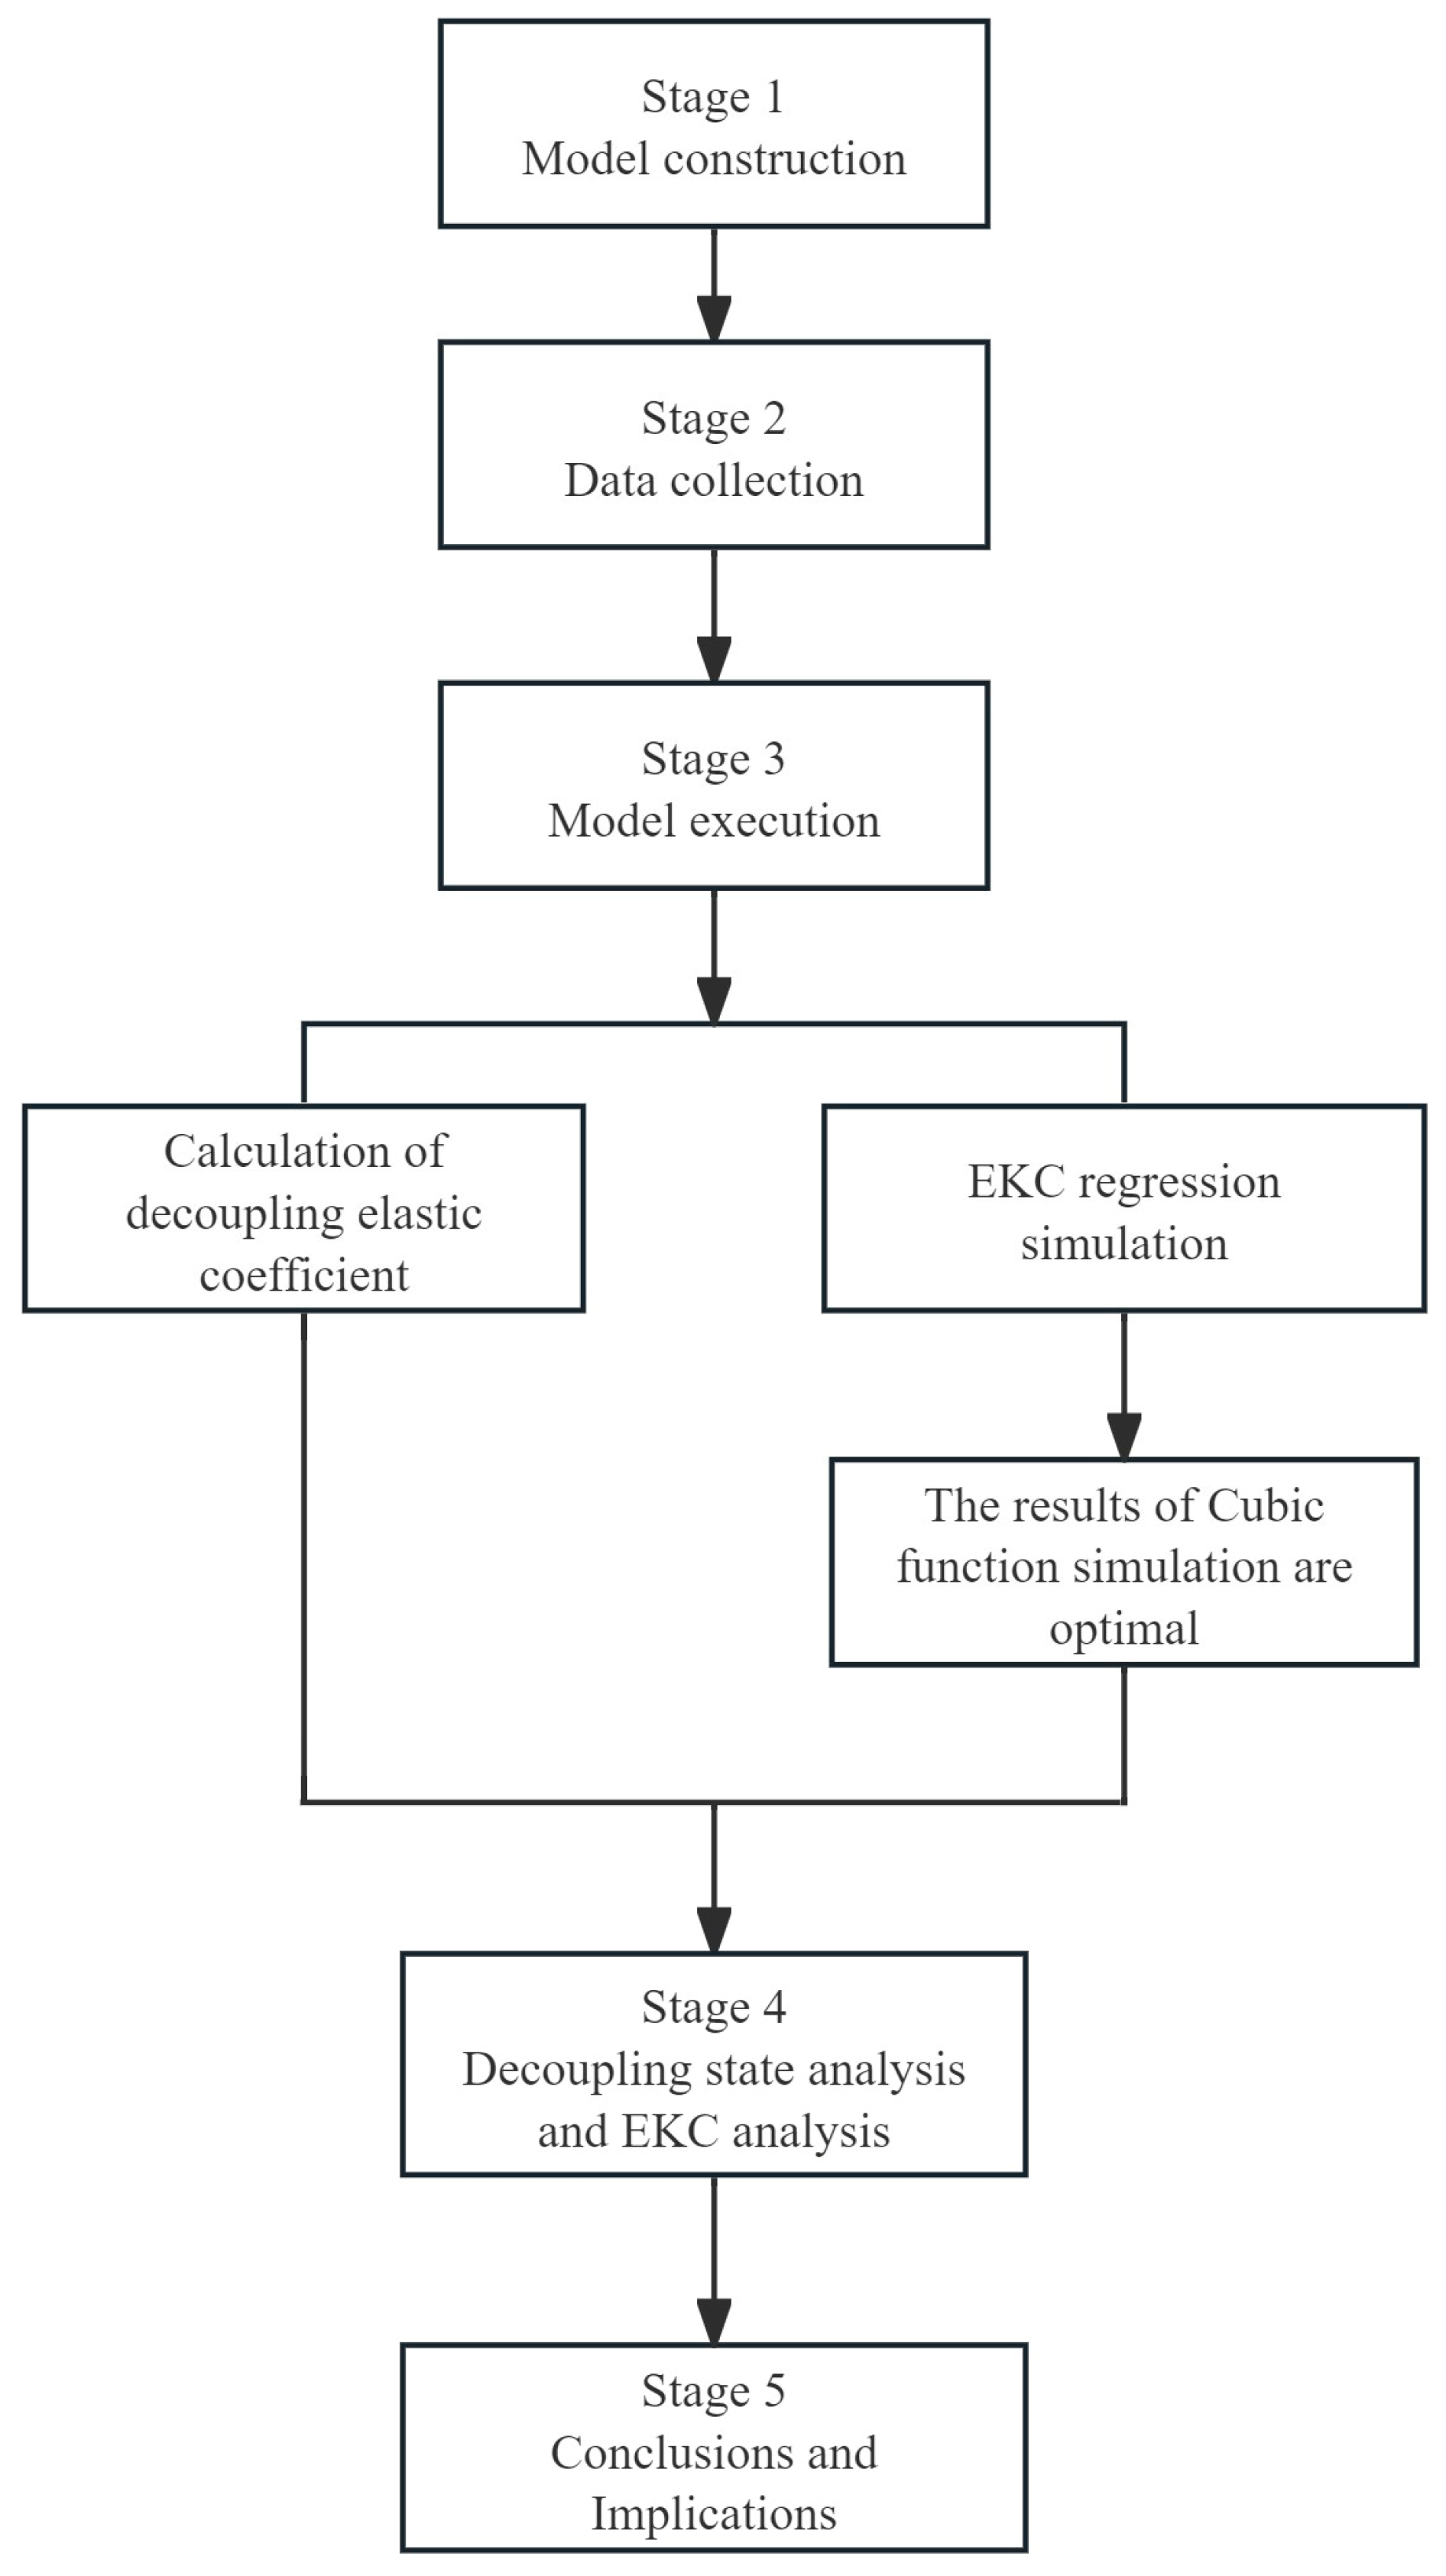
3.3. Study Procedure

It can be seen from Figure 1 that:
The first stage is model construction. The decoupling model is built through the relationship between economy and environment, and then the EKC model is established with the gross regional product (GDP) as the horizontal coordinate and the industrial waste gas emissions, industrial solid waste emissions and industrial wastewater emissions as the vertical coordinate. The second stage is data collection. The main data collected is the industrial waste, industrial solid waste, industrial wastewater discharge and gross production value of Zhoushan Islands from 2002 to 2022. The third stage is the model execution, which brings the collected data into the calculation formula of the decoupling model that has been constructed and obtains the decoupling elasticity coefficient. Corresponding to the eight decoupling states of Tapio decoupling model, the decoupling state of environmental pollutants and economic growth in Zhoushan Islands from 2002 to 2022 is analyzed. At the same time, the completed EKC model was simulated by using SPSS 16.0 software. It can be seen from the regression fitting degree that the simulation effect of the cubic function is better, so the cubic function is selected for the EKC analysis of the gross regional product and various environmental pollutants. The fourth stage is the analysis of decoupling state and EKC curve results, mainly analyzes the decoupling state of industrial waste gas, industrial solid waste, industrial wastewater and economic growth, and the EKC fitting curve of three environmental pollutants and the gross product. The fifth stage is to synthesize the above results to draw the conclusion of this paper and put forward the corresponding countermeasures and suggestions.

4. Results and Analysis

4.1. Measurement and Analysis of Decoupling State

It can be seen from Table 3 that:
First, the overall decoupling state of industrial waste gas was not stable, showing multiple changes of strong decoupling-weak decoupling-expansive negative decoupling. The weak decoupling state accounted for 19%, the strong decoupling state accounted for 33.3%, and the expansive negative decoupling state accounted for 42.9%, indicating that there was mainly expansive negative decoupling relationship between economic development and industrial waste gas in Zhoushan Islands. Among them, there were 4 years of expansionary negative decoupling before 2015, namely 2004, 2005, 2009 and 2011, indicating that economic growth was slow in these years, but industrial emissions grew faster and environmental pressure increased significantly. It is possible that the development of Zhoushan Islands was insufficient in the early stage, and the economic growth rate was slow. Meanwhile, many traditional enterprises were in the development mode of high energy consumption, low technology and low efficiency, and the structural pollution was relatively serious, which led to the situation that the pollutant discharge speed was faster than the economic development speed. The decoupling states were either strong decoupling or weak decoupling in the other years, indicating that the emission rate of industrial waste gas was less than or converged with the rate of economic growth, and the environmental pressure decreased. After 2015, weak decoupling and expansive negative decoupling appeared alternately and strong decoupling appeared in 2021, indicating that the environmental pressure in this stage sometimes decreased and then increased, and was in a relatively unstable state. Among them, the decoupling index increased significantly in 2015, which may be related to the rapid development of the petrochemical industry in that year.
Second, the overall decoupling state of industrial solid waste was also unstable, showing multiple changes of strong decoupling-weak decoupling-expansive negative decoupling. The weak decoupling state accounted for 33.3%, the strong decoupling state accounted for 28.6%, and the expansion negative decoupling state accounted for 33.3%, indicating that there were mainly weak decoupling and expansive negative decoupling states between economic growth and industrial solid waste in Zhoushan Islands. Before 2015, the decoupling of industrial solid waste developed well, except for expansive negative decoupling in 2003, 2007 and 2010, the remaining years showed strong decoupling or weak decoupling, and the discharge rate of industrial solid waste was lower than the economic growth rate. After 2015, except for weak decoupling in 2017, 2020 and 2021, the remaining years showed expansive negative decoupling or expansive coupling, indicating that the discharge rate of industrial solid waste was higher than or convergent with the economic growth rate, which means that while pursuing economic growth, Zhoushan Islands caused greater environmental pressure in recent years. Among them, there was a strong decoupling in 2022, which may be due to the effective implementation of the “zero waste city” construction implementation plan in Zhoushan City that year, which improved the level of solid waste management and governance capacity but did not completely reverse the overall situation in a higher position.
Third, the overall decoupling state of industrial waste water also showed multiple changes of strong decoupling-weak decoupling-expansive negative decoupling, but it was relatively stable. The weak decoupling state accounted for 19%, the strong decoupling state accounted for 47.6%, and the expansive negative decoupling state accounted for 28.6%, indicating that there was a predominantly strong decoupling state between economic growth and industrial waste water in Zhoushan Islands. Except for expansive negative decoupling in 2005, 2011, 2015, 2019 and 2020 and the expansive coupling in 2013, the rest of the years maintained the alternating change of strong decoupling and weak decoupling, showing that the discharge rate of industrial waste water was lower than the economic growth rate, and the relationship between industrial waste water discharge and economic growth was relatively good, which was inseparable from Zhoushan Islands’ emphasis on water environment pollution control in recent years.
In general, the decoupling state between economic development and environmental pressure in Zhoushan Islands is not stable, showing multiple changes of strong decoupling-weak decoupling-expansive negative decoupling. Industrial waste gas and industrial solid waste have not been completely decoupled, indicating that environmental pressure has not decreased along with economic growth in Zhoushan Islands. Especially in recent years, the number of pollutant emissions faster than the economic growth rate has increased, and emission reduction is still urgent and essential. The overall decoupling state of industrial waste water are greatly improved compared with industrial waste gas and industrial solid waste, but it is also necessary to strictly prevent the change of wastewater discharge speed faster than the economic growth rate because of excessive pursuit of economic growth (Table 3).

4.2. Results and Analysis of EKC Curve

A measurement model was established by taking the regional GDP as the abscissa, and the emissions of industrial waste water, industrial waste gas, and industrial solid waste as the ordinate, and regression simulations were carried out with the help of SPSS software. The regression fitting results are shown in Table 4. From the regression fit, it can be seen that the simulation effect of cubic function is better, and the “R2” of the three environmental pollution indicators are all greater than 0.7. At the same time, the “F” test value shows that the regression equations of these indicators are also significant in general. Therefore, this paper selects the cubic function to conduct EKC analysis on the regional GDP and various environmental pollutants.

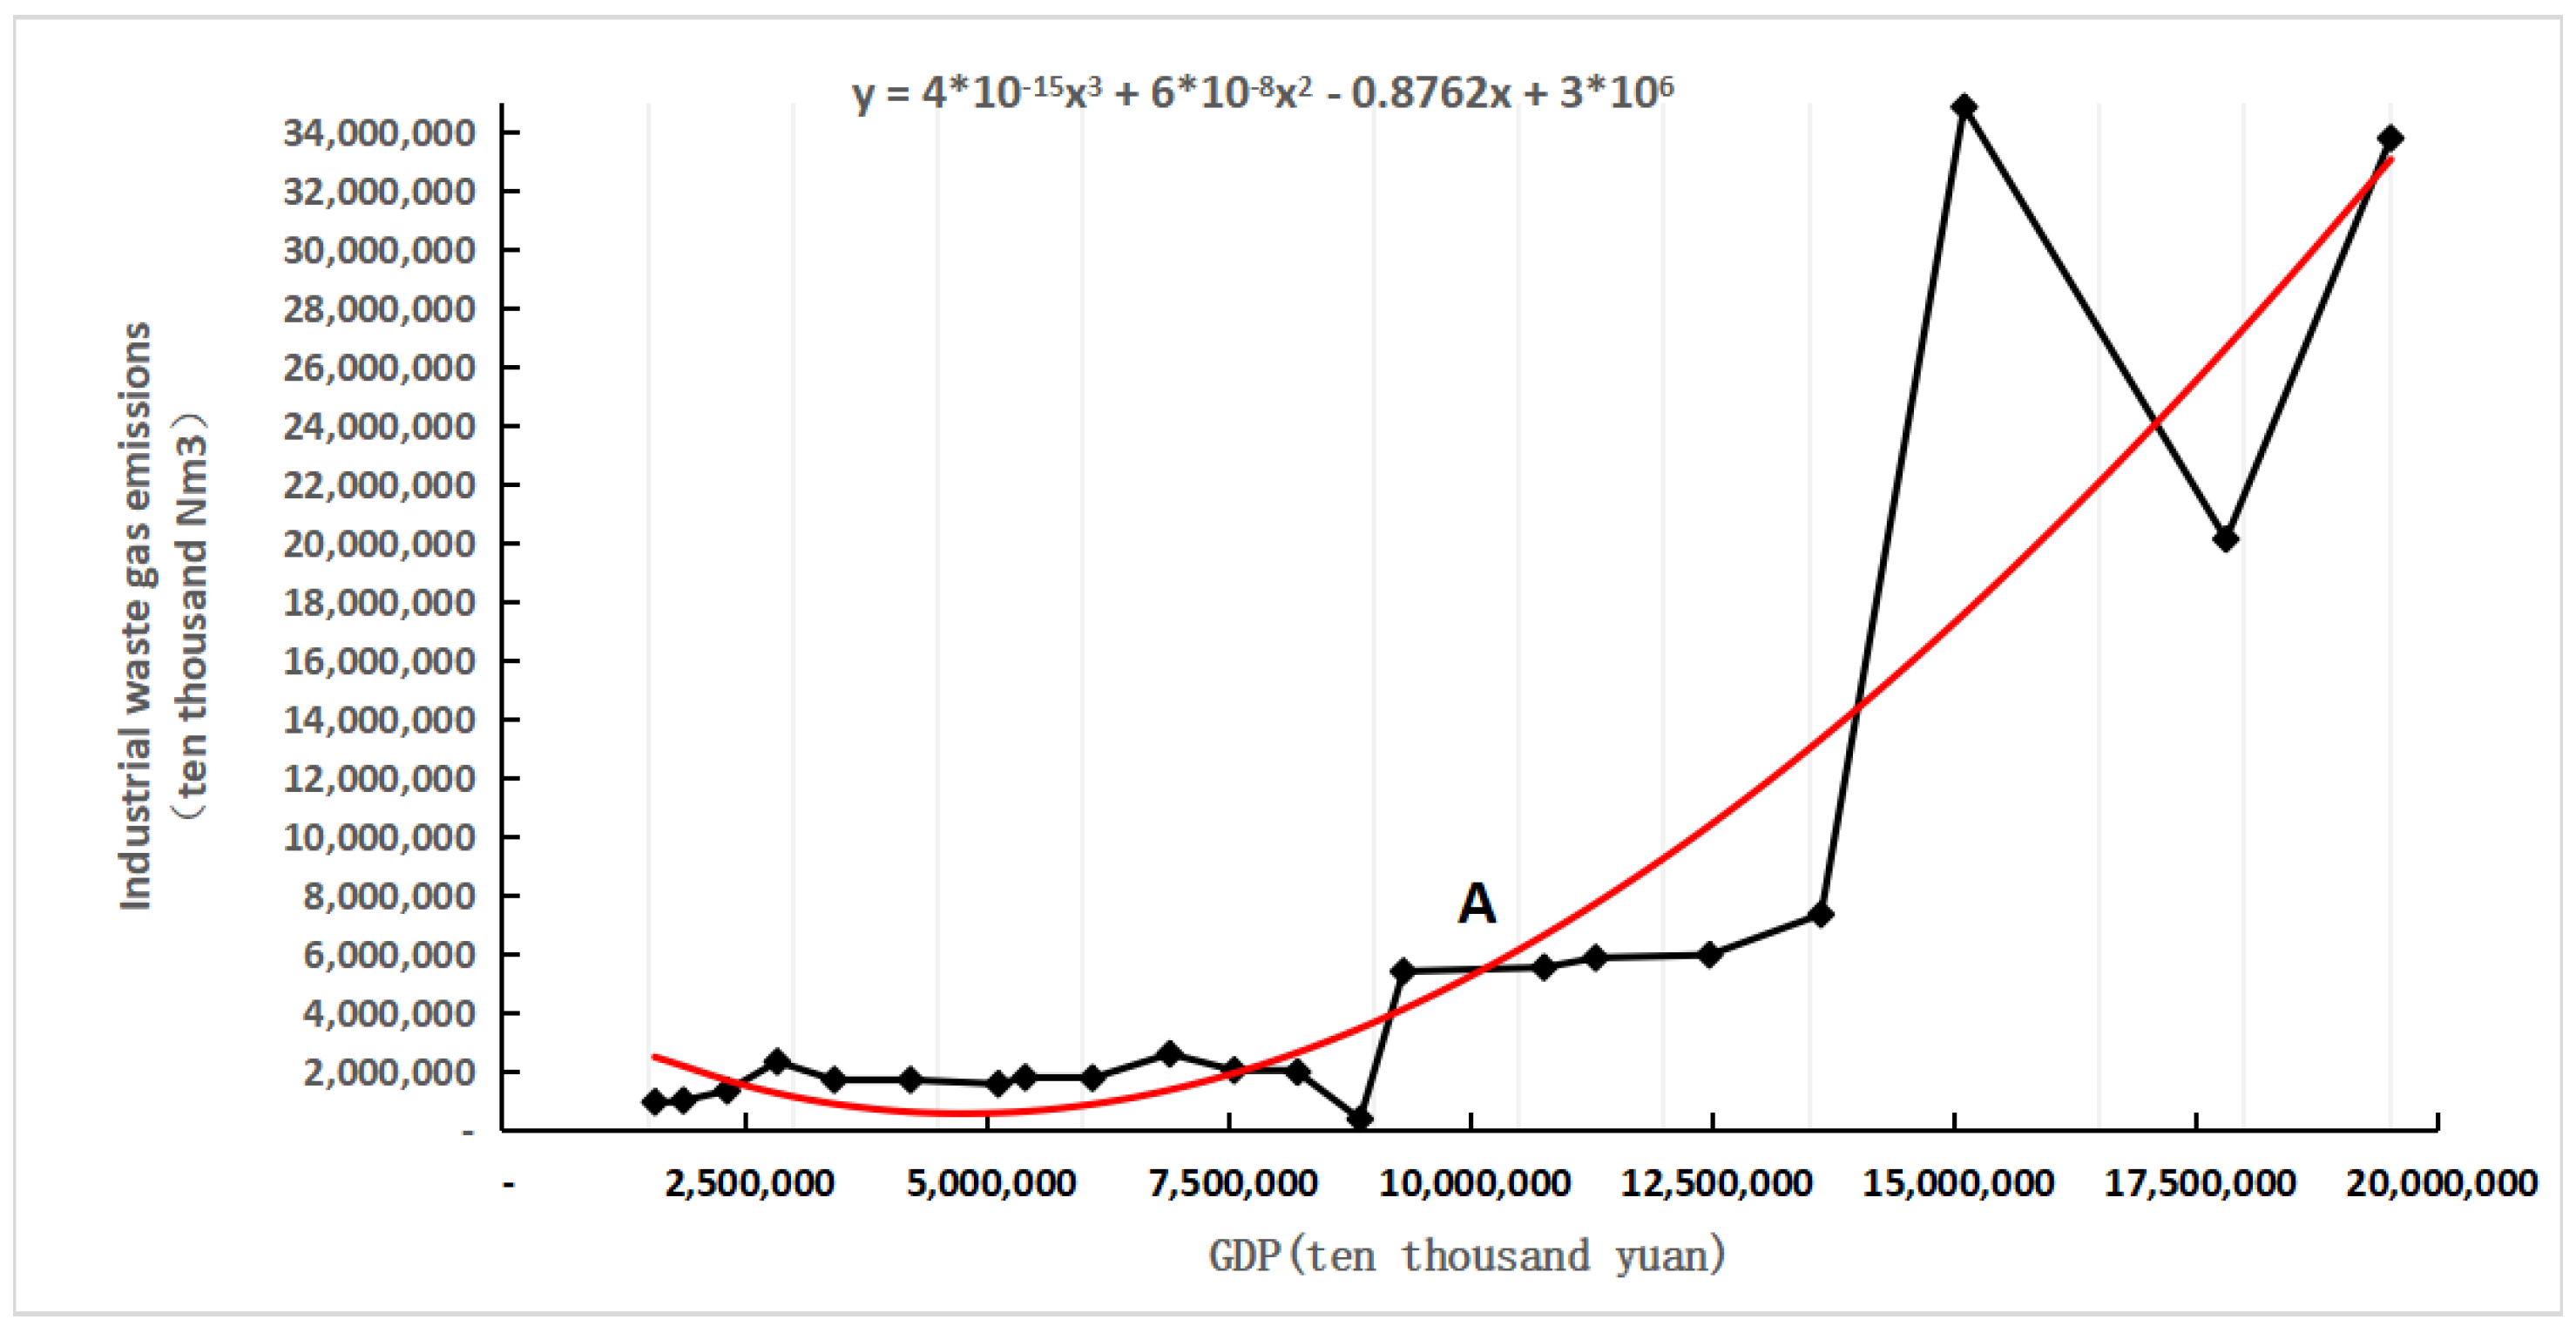
4.2.1. EKC Analysis of Industrial Waste Gas Emissions

It can be seen from Figure 2 that the overall relationship between GDP of Zhoushan Islands and industrial waste gas emissions is increasing simultaneously, and there is no obvious inverted U-shape EKC. That is, with the growth of GDP, industrial waste gas emissions will also increase. Before 2015, represented as “A” in Figure 2, industrial waste gas emissions increased slowly with economic growth, but after 2015, it developed at a relatively high level. Especially in 2020, the amount of waste gas emissions increased significantly, reaching 348,495.07 million standard cubic meters, with a growth rate of 375% compared with the previous year. On the one hand, this may be related to the green petrochemical base built by Zhoushan Islands in order to promote economic growth. The base is planned to be developed in three stages (currently under development and construction), aiming to actively promote the construction of the integrated project of oil refining, ethylene and aromatics refining, and initially form a petrochemical raw material production base. The petrochemical industry and chemical industry are the main sources of industrial waste gas, so the development of the petrochemical industry in Zhoushan Islands has led to the production of more industrial waste gas. On the other hand, the waste gas emission is closely related to traditional energy consumption. The more energy consumption, the greater the emission. According to the Zhoushan Statistical Bulletin, in 2020, the city’s social electricity consumption was 10.34 billion kwh, an increase of 57.9% over the previous year. The large energy demand coupled with the rapid development of the petrochemical industry led to a significant increase in industrial waste gas emissions in 2020. Since 2021, due to Zhoushan’s implementation of high-quality development actions for pollution reduction and carbon reduction in the petrochemical industry, exhaust gas emissions have been controlled to a certain extent, but have not shown a complete reversal trend.
The state of economic development will affect the formulation of government environmental regulations and policies, which in turn will have an impact on the quality of the environment [50]. Due to the superior natural conditions of Zhoushan Islands, its air quality ranks among the top in China all year round, so atmospheric protection is not as urgent as economic growth. At the same time, although the regional GDP and per capita GDP of Zhoushan Islands have increased significantly in recent years, they are not comparable to other areas in Zhejiang Province. Compared with prefecture-level cities, the economic development level of the Zhoushan Islands is still relatively low. Therefore, in order to realize the further advancement of economic construction, the dependence on petrochemical industry and other industries has been continuously strengthened in Zhoushan Islands. Moreover, considering the limited space for reducing energy consumption under the existing technical conditions, if Zhoushan Islands does not pay enough attention to industrial optimization and upgrading, and changing the traditional energy structure and technical level, it can be expected that industrial waste gas emissions will continue to increase.

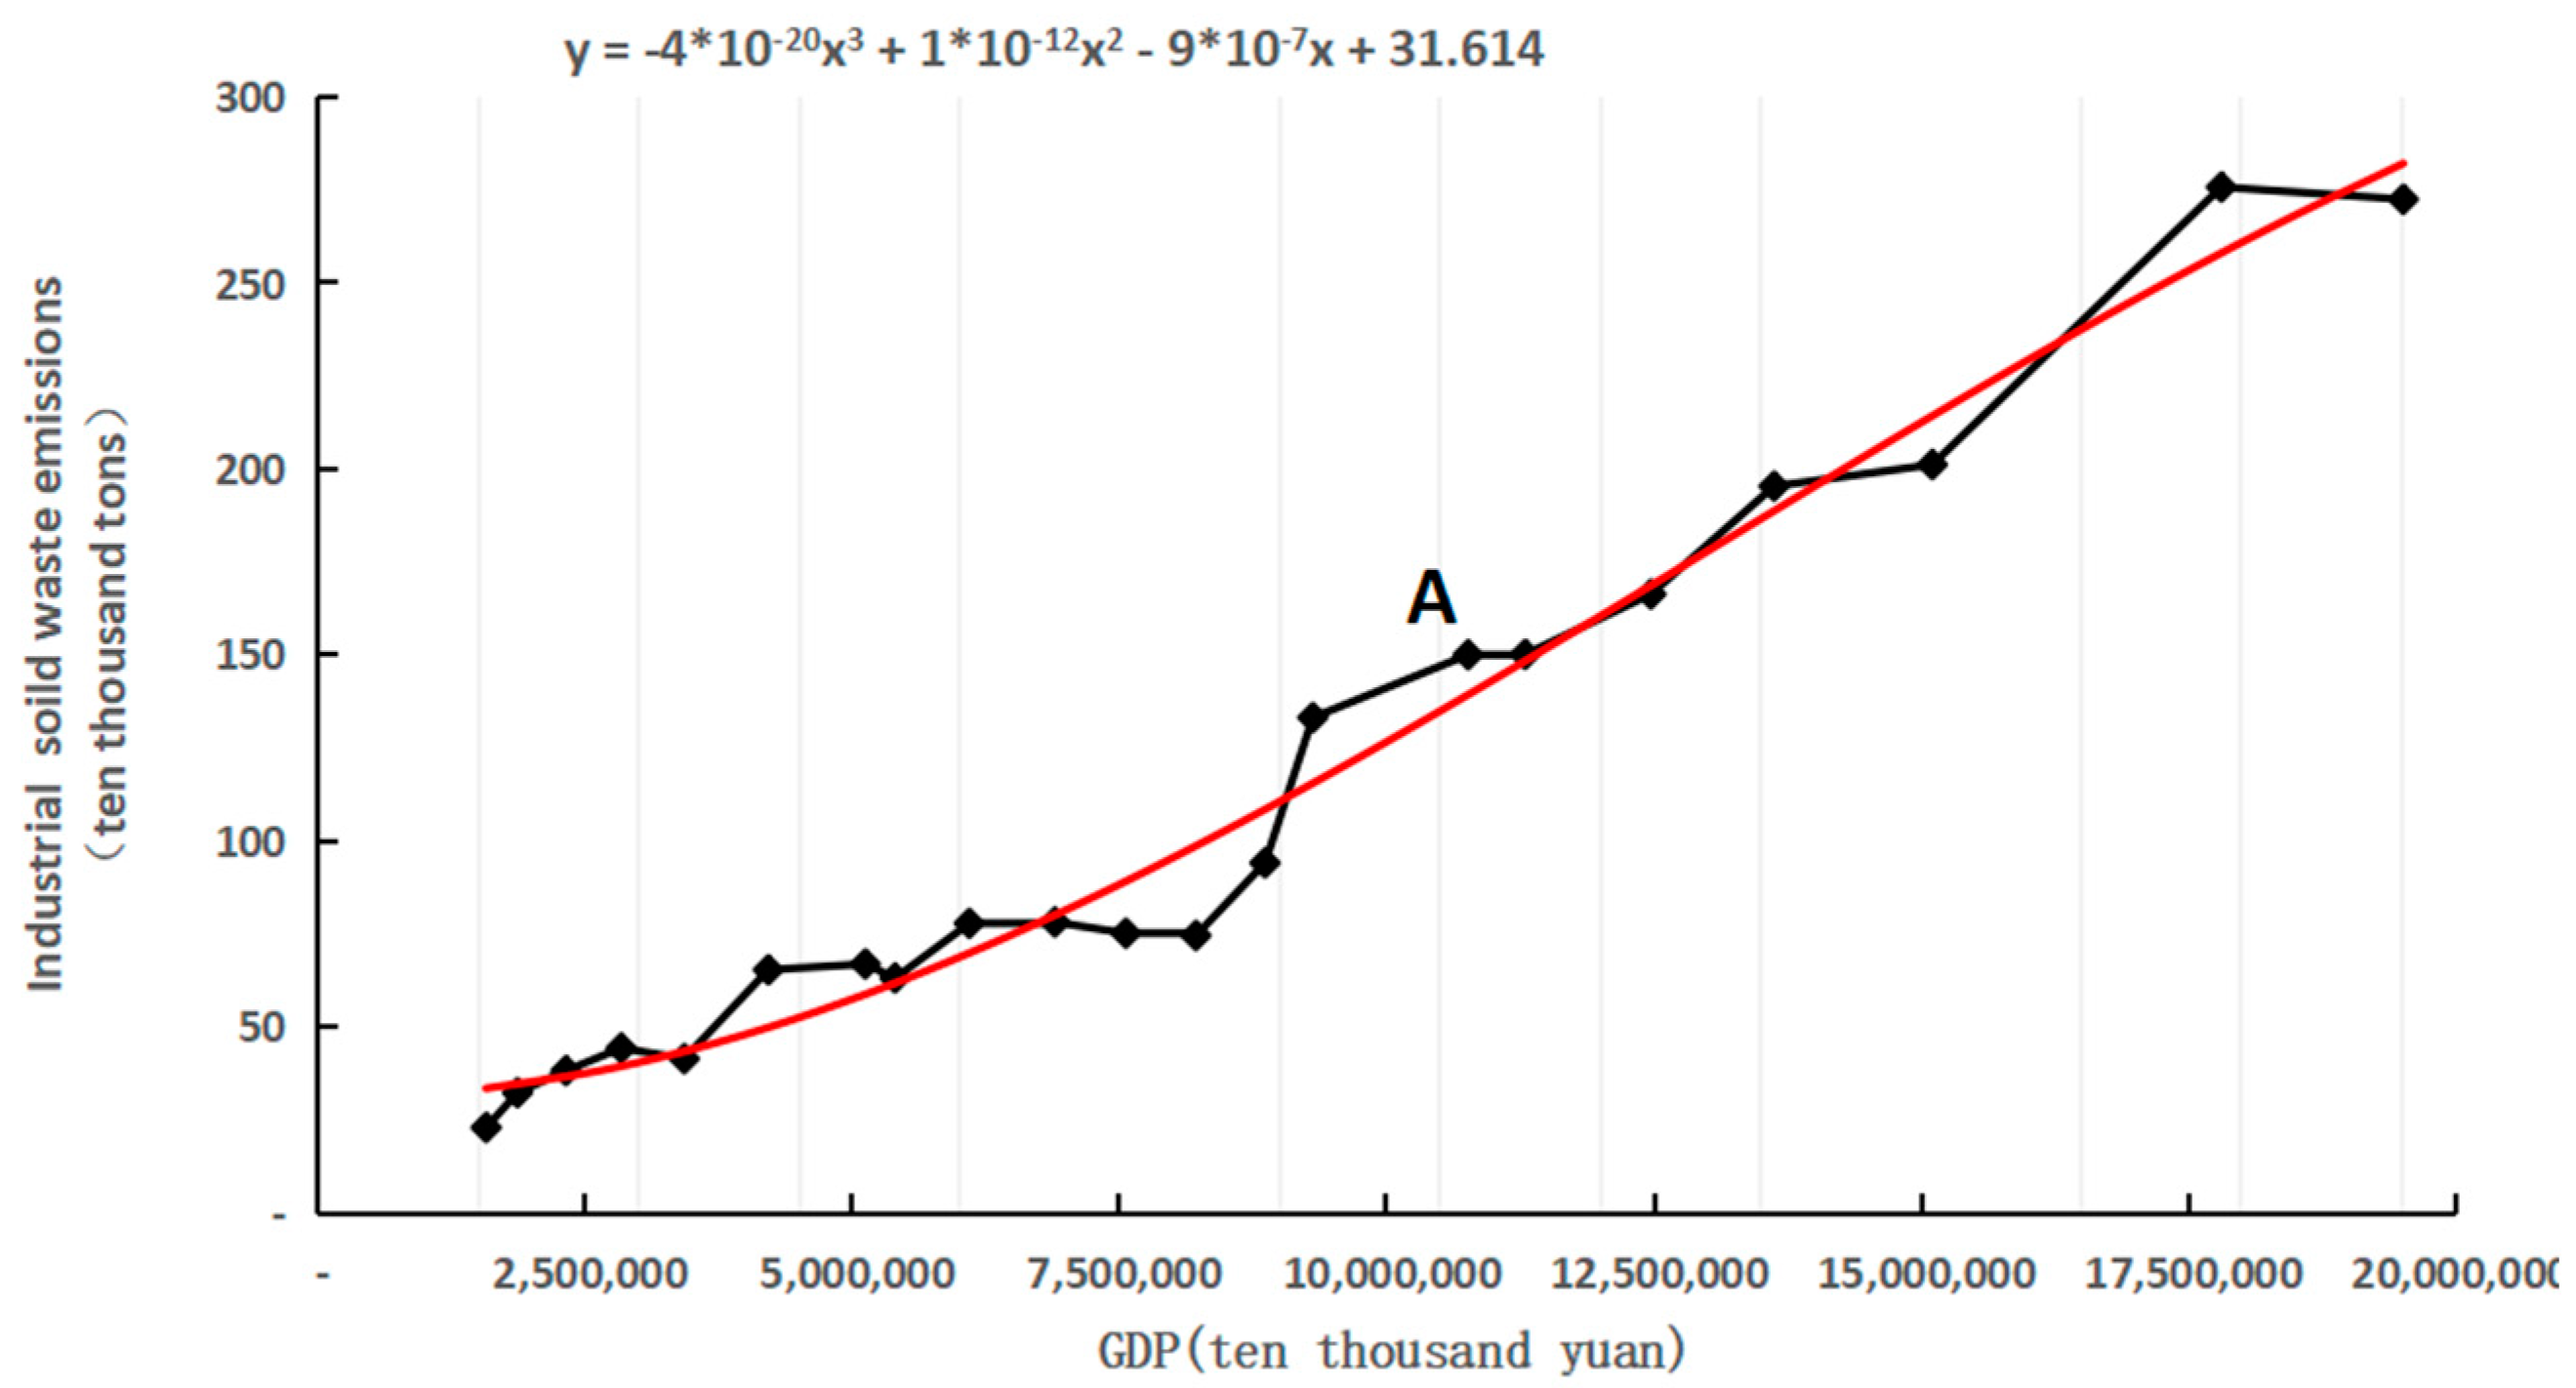
4.2.2. EKC Analysis of Industrial Solid Waste Emissions

It can be seen from Figure 3 that the overall relationship between GDP of Zhoushan Islands and industrial solid waste emissions is increasing simultaneously, and there is no obvious inverted U-shape curve. That is, with the growth of GDP, industrial solid waste emissions will also increase. In 2015, also represented as “A” in Figure 3, the discharge of industrial solid waste increased rapidly, an increase of 56.87% compared with 2014, and it also showed a rapid growth trend in the following years. This also proves that economic growth has not been completely decoupled from industrial solid waste. On the one hand, during the 13th Five-Year Plan period, Zhoushan Islands focused on promoting green petrochemicals, ships and marine engineering equipment, port trade and logistics and other 100 billion industrial clusters. These economic activities generated a lot of industrial solid waste, and the structural pollution was obvious, which in turn caused the solid waste discharge to show an obvious upward trend. For example, in 2021, the total industrial output value of Zhoushan Islands above designated size will reach 232.76 billion, an increase of 46.7% over 2020, while the discharge of industrial solid waste reached 2.7568 million tons, an increase of 37.08% over 2020. On the other hand, the composition of industrial solid waste is complex, so the treatment is difficult, the treatment cycle is long, and the emission will not decrease in the short term even with the increase in pollution control investment [51]. Therefore, the industrial solid waste emissions in Zhoushan Islands have been at a high level since 2015.

4.2.3. EKC Analysis of Industrial Wastewater Emissions

It can be seen from Figure 4 that there is an inverted U-shaped EKC relationship between GDP of Zhoushan Islands and industrial wastewater emissions. Before 2015, represented as A in Figure 4, industrial wastewater emissions continued to increase with economic growth. Its upward trend reached the highest point of 22,021,600 tons in 2015, and then it has begun to decline with economic growth. It can also be seen from the EKC that the decoupling of industrial wastewater and economic growth after 2015 was very obvious. On the one hand, the traditional industries of papermaking, printing and dyeing, electroplating, chemical industry, shipbuilding, and aquatic products in Zhoushan Islands have driven the local economic development in the early stage, but due to the low level of industrial development, these enterprises did not pay attention to pollution control, resulting in continuous pollution of the local water environment. However, with the comprehensive promotion of “five water co-governance” in Zhejiang Province and the promulgation and implementation of documents such as the “Opinions on the Comprehensive Implementation of the River Chief System”, water pollution control has become the focus of governments at all levels, including Zhoushan Islands. The 13th Five-Year Plan for Ecological Environmental Protection in Zhoushan Islands clarified a number of regulations such as drinking water management, river regulation, key sewage industry regulation, and sea pollution prevention and control, aiming to fight the battle against water pollution and further improve the quality of the local water environment. After 2018, documents such as “Zhoushan Islands’s Zero Sewage Direct Discharge Area Construction Plan” and “Zhoushan Islands’s Sewage Treatment Implementation Plan in 2018” were successively issued, making reasonable and scientific policy arrangements for water environment management. On the other hand, Zhoushan Islands is composed of many islands, with a shortage of freshwater resources, and its economic development largely depends on the ocean. Therefore, protecting the freshwater environment and the marine environment of Zhoushan Islands is not only a necessity for economic development but also closely related to people’s lives. As the water environment quality of Zhoushan Islands decreased year by year, the habitants’ awareness of water environment protection continued to strengthen. The measures taken by the government, society and the public have led to a significant decline in industrial wastewater emissions after 2015. However, in 2019 (point “B” in Figure 4), the industrial wastewater emissions rebounded, indicating that relevant departments of Zhoushan Islands should pay attention to prevent the expansive negative decoupling or expansive coupling between economic development and industrial wastewater, which will reduce the quality of the water environment.

5. Conclusions and Implications

5.1. Conclusions

Using the decoupling model and EKC theory, this paper analyzed the relationship between economic growth and environmental pollution in Zhoushan Islands, China from 2002 to 2022, and drew the following main conclusions:
First, from 2002 to 2022, the overall decoupling state between economic development and environmental pressure in Zhoushan Islands is not stable, showing multiple changes of strong decoupling-weak decoupling-expansive negative decoupling. Industrial waste gas and industrial solid waste have not been completely decoupled, with expansive negative decoupling as the main state, while industrial wastewater has achieved strong decoupling with economic development, thus exerting less pressure on the environment in Zhoushan Islands.
Second, The EKC curve analysis results show that there is no traditional inverted U-shape EKC between industrial waste gas, as well as industrial solid waste, and economic development in Zhoushan Islands, but they have developed in a simultaneously increasing relationship, that is, with the growth of the economy, industrial waste gas and solid waste emissions will also increase. By contrast, industrial wastewater has an obvious inverted U-shape EKC with economic growth, indicating that it is effectively controlled in the later stage of development and has a good relationship with economic development.
Third, the decoupling state of the three environmental pollutants is basically consistent with the analysis results of the EKC, but not completely consistent with the traditional inverted U-shape EKC. This shows that the degree of environmental pollution does not always evolve automatically following the development pattern of rising first and then falling. Judging from the current decoupling relationship between economic development and environmental pollution in Zhoushan Islands, it is necessary to intervene in order to achieve coordinated and sustainable development.
There is still room for further research in this paper, which is mainly shown in the following aspects: First, this paper discussed the issue between economy and environment in island area. If the relationship between environmental change and economic development in the surrounding sea area can be discussed through comparative analysis between island area and land area, the research will be more complete. Second, in the research process, this paper only briefly mentioned the impact of macro-level factors such as industrial development and ecological construction on economic development but did not analyze the impact of micro-level factors such as residents’ environmental awareness and consumption behavior on economic development. Therefore, based on in-depth local research, we discuss the relationship between economic development and environmental pollution in the island area from a micro perspective, which is also the future research direction.

5.2. Implications

Based on the above conclusions, according to the current economic development status and environmental conditions of Zhoushan Islands, in order to better promote the decoupling of economic growth and environmental pollution in the island area, this paper puts forward the following countermeasures:
First, Zhoushan Islands should carry out further implementation of industry optimization and upgrading. In the study of the decoupling state of industrial waste gas, it was found that by the middle of the study in 2015, the increase in the decoupling index may be closely related to the rapid development of the petrochemical industry in the Zhoushan Islands. Therefore, the island area should transform and upgrade enterprises with high energy consumption and high pollution, integrate and restructure, and promote enterprises to implement clean production and green transformation and development. For example, island areas can strengthen the construction of environmental protection infrastructure and the improvement of ship painting technology for ship repair and building enterprises, and promote the comprehensive utilization of industrial solid waste and the industrialization of solid waste treatment technology, to improve the green development level of the petrochemical industry.
Second, the above research found that the overall decoupling status of industrial wastewater is significantly improved compared with industrial waste gas and industrial solid waste, which is due to the unique geographical location of Zhoushan Islands. Therefore, island areas should give full play to their geographical advantages, make use of their mountainous and sea resources, further develop new energy sources such as tidal energy and wind energy, reduce the use of fossil energy and build a clean, safe and efficient energy system, so as to provide green support for urban development.
Third, Zhoushan Islands can rely on digital technology to improve the level of environmental management. While pursuing economic growth, we should not be at the expense of the environment. The above research found that the emission rate of industrial solid waste is higher than or similar to the economic growth rate, which is still a large environmental pressure. Island areas should adopt technologies such as big data and artificial intelligence to deeply explore and integrate the application of ecological environment data, build a smart and efficient environmental management information system, and comprehensively improve the integrity, systematicness and synergy of ecological environment governance. At the same time, from the perspective of harmonious and symbiotic development between man and nature, the government should correctly handle the relationship between high-quality economic development and high-level protection of the ecological environment, effectively reduce the cost of resources and environment for development, and continuously enhance the potential of development.
Finally, Zhoushan Islands should establish an overall coordination mechanism to strengthen departmental cooperation in law enforcement. The above research found that there is still much room for progress in coordinating the relationship between economic development and environmental pollution in Zhoushan Islands. Island areas should pay attention to the overall planning of land and sea, build a cross-departmental coordination mechanism, and strengthen linkage and cooperation on the basis of implementing responsible entities, so as to coordinately promote the level of ecological environment supervision and optimize the effectiveness of ecological environment governance. The government should play a leading role by providing some financial support to environmentally friendly enterprises, setting scientific emission standards and promoting energy price reform. At the same time, the relevant departments should also raise the entry threshold of industry, limit the development of high-pollution and high-consumption enterprises, and encourage enterprises to take the road of environmental protection and energy-efficient economic development.

Author Contributions

Conceptualization, F.L. and D.Q.; methodology, Y.H.; software, F.L.; validation, F.L., D.Q. and Y.H.; formal analysis, F.L.; investigation, D.Q.; resources, D.Q.; data curation, F.L.; writing—original draft preparation, F.L.; writing—review and editing, D.Q.; visualization, Y.H.; supervision, Y.H.; project administration, Y.H.; funding acquisition, Y.H. All authors have read and agreed to the published version of the manuscript.

Funding

This research received no external funding.

Institutional Review Board Statement

Not applicable.

Informed Consent Statement

Informed consent was obtained from all subjects involved in the study.

Data Availability Statement

All the above data come from the “Zhoushan Statistical Yearbook” from 2003 to 2023.

Conflicts of Interest

The authors declare no conflict of interest.

References

  1. Rani, S.; Ahmed, M.K.; Xiongzhi, X.; Yuhuan, J.; Keliang, C.; Islam, M.M. Economic valuation and conservation, restoration management strategies of Saint Martin’s coral island, Bangladesh. Ocean Coast. Manag. 2020, 183, 105024. [Google Scholar] [CrossRef]
  2. Margaret, V.S.; Karen, F.; Simon, T. Collaboration a solution for small island developing states to address food security and economic development in the face of climate change. Ocean Coast. Manag. 2022, 221, 106132. [Google Scholar]
  3. Praene, P.J.; Payet, M.; Bénard-Sora, F. Sustainable transition in small island developing states: Assessing the current situation. Util. Policy 2018, 54, 86–91. [Google Scholar] [CrossRef]
  4. Tyedmers, E.; Malik, A.; Fry, J.; Geschke, A.; Yousefzadeh, M. Sustainable development opportunities in small island nations: A case study of the Cook Islands. J. Clean. Prod. 2020, 277, 123045. [Google Scholar] [CrossRef]
  5. Thanh, M.; Carl, S. Scenario-based planning for tourism development using system dynamic modelling: A case study of Cat Ba Island, Vietnam. Tour. Manag. 2016, 68, 336–354. [Google Scholar]
  6. Kurniawan, F.; Adrianto, L.; Bengen, D.G.; Prasetyo, L.B. The social-ecological status of small islands: An evaluation of island tourism destination management in Indonesia. Tour. Manag. Perspect. 2019, 31, 136–144. [Google Scholar] [CrossRef]
  7. Baek, S.; Kim, H.; Chang, J.H. Optimal Hybrid Renewable Power System for an Emerging Island of South Korea: The Case of Yeongjong Island. Sustainability 2015, 7, 13985–14001. [Google Scholar] [CrossRef]
  8. Kahn, G.J.; Horrocks, M.; Nieuwoudt, K.M. Agriculture, Domestic Production, and Site Function: Microfossil Analyses and Late Prehistoric Landscapes of the Society Islands. Econ. Bot. 2014, 68, 246–263. [Google Scholar] [CrossRef]
  9. Cherp, A.; Kopteva, I.; Mnatsakanian, R. Economic transition and environmental sustainability: Effects of economic restructuring on air pollution in the Russian Federation. J. Environ. Manag. 2003, 68, 141–151. [Google Scholar] [CrossRef] [PubMed]
  10. Mafizur, M.R.; Khosrul, A. Life expectancy in the ANZUS-BENELUX countries: The role of renewable energy, environmental pollution, economic growth and good governance. Renew. Energy 2022, 190, 251–260. [Google Scholar]
  11. Sueyoshi, T.; Yuan, Y. China’s regional sustainability and diversified resource allocation: DEA environmental assessment on economic development and air pollution. Energy Econ. 2015, 49, 239–256. [Google Scholar] [CrossRef]
  12. Zhao, N.; Hussien, E.; Bowen, L. The efforts of China to combat air pollution during the period of 2015–2018: A case study assessing the environmental, health and economic benefits in the Beijing-Tianjin-Hebei and surrounding “2 + 26” regions. Sci. Total Environ. 2022, 853, 158437. [Google Scholar] [CrossRef]
  13. OECD. Indicators to Measure Decoupling of Environmental Pressures for Economic Growth; OECD: Paris, France, 2002. [Google Scholar]
  14. Deng, H.; Duan, N. Evaluation mode of decoupling and its impact on circular economy. China Popul. Resour. Environ. 2004, 6, 46–49. [Google Scholar]
  15. Chen, M.Y. Decoupling of Energy Consumption from Economic Growth in BRICS in the Context of Novel Coronavirus Pneumonia Based on Tapio Decoupling Index. Basic Clin. Pharmacol. Toxicol. 2020, 127, 238. [Google Scholar]
  16. Wei, W.D.; Cai, W.Q.; Guo, Y.; Bai, C.Q.; Yang, L.Z. Decoupling relationship between energy consumption and economic growth in China’s provinces from the perspective of resource security. Resour. Policy 2020, 68, 101693. [Google Scholar] [CrossRef]
  17. Profillidis, V.; Botzoris, G.; Galanis, A. Decoupling of economic activity from transport-related energy consumption:an analysis for European Union member countries. Int. J. Innov. Sustain. Dev. 2018, 12, 271–286. [Google Scholar] [CrossRef]
  18. Scheel, C.; Aguiñaga, E.; Bello, B. Decoupling Economic Development from the Consumption of Finite Resources Using Circular Economy. A Model for Developing Countries. Sustainability 2020, 12, 1291. [Google Scholar] [CrossRef]
  19. Dagmawe, T.; Hawitibo, A.L. Carbon decoupling and economic growth in Africa: Evidence from production and consumption-based carbon emissions. Resour. Environ. Sustain. 2021, 6, 100040. [Google Scholar]
  20. Han, Y.; Zhang, J.J.; Yuan, M.J. Carbon emissions and economic growth in the Yellow River Basin: Decoupling and driving factors. Front. Environ. Sci. 2022, 10, 1089517. [Google Scholar] [CrossRef]
  21. Sobia, N.; Muhammad, M.; Muhammad, Z.; Ahmad, B.S.; Muddassar, S. The influence of energy consumption and economic growth on environmental degradation in BRICS countries: An application of the ARDL model and decoupling index. Environ. Sci. Pollut. Res. Int. 2021, 29, 13042–13055. [Google Scholar]
  22. Kokovskyy, L. Regional analysis of decoupling economic growth and pollutant emmissions into the air in Ukraine. GOT—Rev. Geogr. Ordenam. Territ. 2014, 5, 143–160. [Google Scholar] [CrossRef]
  23. Zhao, X.G.; Pan, Y.J.; Zhao, Q.Y.; Hu, Z.D.; Yao, H.; Yang, X.Y. Decoupling analysis between regional economic growth and resources and environmental pressure based on view of scientific development: A case study of Yunnan Province. Econ. Geogr. 2011, 31, 1196–1201. [Google Scholar]
  24. Liu, C.H.; Cai, W.; Zhai, M.Y.; Zhu, G.; Zhang, C.X.; Jiang, Z.G. Decoupling of wastewater eco-environmental damage and China’s economic development. Science of the Total Environment. Sci. Total Environ. 2021, 789, 147980. [Google Scholar] [CrossRef]
  25. Ren, J.M.; Ma, Y.J. Spatial and temporal evolution of the decoupling relationship between industrial growth and industrial air pollution in Jilin Province. J. Univ. Chin. Acad. Sci. 2019, 36, 72–81. [Google Scholar]
  26. Xia, Y.; Zhong, M.C. The relationship between economic development and environmental pollution decoupling theory and EKC hypothesis: On the decoupling division of prefecture-level cities in China. China Popul. Resour. Environ. 2016, 26, 8–16. [Google Scholar]
  27. Wang, Y.Q.; Huang, H.Z. Decoupling effect, spatial and temporal characteristics and driving factors of carbon emissions in China. Acta Ecol. Sin. 2019, 44, 2228–2243. [Google Scholar]
  28. Gao, X.C.; Ma, L. Research on the relationship between environmental pollution and economic development in western China based on decoupling and EKC theory. J. Southwest Univ. Natl. (Humanit. Soc. Sci. Ed.) 2014, 35, 117–122. [Google Scholar]
  29. Wu, K.Y.; Liu, X.W.; Zhu, Q.; Zhang, H. Delinking relationships between economic growth and environmental stress in Anhui Province: Based on MFA method. Areal Res. Dev. 2012, 31, 29–33. [Google Scholar]
  30. Grossman, G.M.; Krueger, A.B. Environmental Impacts of a North American, Free Trade Agreement; NBER Working Paper; No. 3914; MIT Press: Cambridge, MA, USA, 1991. [Google Scholar]
  31. Tenaw, D.; Beyene, A.D. Environmental sustainability and economic development in sub-Saharan Africa: A modified EKC hypothesis. Renew. Sustain. Energy Rev. 2021, 143, 110897. [Google Scholar] [CrossRef]
  32. Nafeesa, M.; Asma, A.; Vipin, J.; Supat, C.; Shahzad, M.S. The role of technological innovation in environmental pollution, energy consumption and sustainable economic growth: Evidence from South Asian economies. Energy Strategy Rev. 2022, 39, 100745. [Google Scholar]
  33. Bedakiyiba, F.B.; Enoch, N.; Boakye, A.A.; Fosu, E.O.A. The effects of economic growth, trade liberalization, and financial development on environmental sustainability in West Africa. The role of institutions. Res. Glob. 2022, 5, 100104. [Google Scholar]
  34. Ling, L.W.; Zhang, D.B. Study on EKC curve Test and Influencing Factors of Industrial “Three Wastes” in Guangdong Province: Based on Kaya identity and LMDI decomposition method. Ecol. Econ. 2017, 33, 161–166. [Google Scholar]
  35. Moutinho, V.; Varum, C.; Madaleno, M. How economic growth affects emissions? An investigation of the environmental Kuznets curve in Portuguese and Spanish economic activity sectors. Energy Policy 2017, 106, 326–344. [Google Scholar] [CrossRef]
  36. Mythili, G.; Mukherjee, S. Examining Environmental Kuznets Curve for river effluents in India. Environ. Dev. Sustain. 2011, 13, 627–640. [Google Scholar] [CrossRef]
  37. Gao, M.G.; Lu, Q.Y. Study on the decoupling relationship between water resources utilization and economic development in the Yellow River Basin. Environ. Sci. Technol. 2021, 44, 198–206. [Google Scholar]
  38. Wang, X.F.; Shen, D.J.; Li, W. Research on mechanism, model and application of decoupling of water resources and economic growth. China Popul. Resour. Environ. 2019, 29, 139–147. [Google Scholar]
  39. Liu, S.C.; Ye, Y.M.; Zhong, S.Q. Study on the Relationship between the expansion of urban construction Land and the relocation and decoupling of Economic Growth in China. Resour. Environ. Yangtze Basin 2019, 29, 2563–2571. [Google Scholar]
  40. Zhang, Y.; Gao, Y.J. Study on the decoupling relationship between urban land expansion and economic growth in Huaihe River Ecological Economic Belt. Resour. Environ. Yangtze Basin 2019, 32, 1573–1582. [Google Scholar]
  41. He, Y.Y.; Wei, Z.X. The Relationship between industrial carbon emission and economic growth: An empirical study based on speed decoupling and quantity decoupling. J. Nat. Sci. Hunan Norm. Univ. 2021, 44, 19–29. [Google Scholar]
  42. Dai, S.L.; Zhang, W.M. Analysis on the influence and change trend of industrial carbon emission in six provinces in Central China. Ind. Technol. Econ. 2022, 41, 152–160. [Google Scholar]
  43. Tapio, P. Towards a theory of decoupling: Degrees of decoupling in the EU and the case of road traffic in Finland between 1970 and 2001. Transp. Policy 2005, 12, 137–151. [Google Scholar] [CrossRef]
  44. Li, X.X.; Pan, X.Q. Analysis of foreign trade and environmental policies affecting China’s environmental Kuznets curve. Contemp. Financ. Econ. 2007, 78–84. [Google Scholar] [CrossRef]
  45. Chen, Y.; Yao, Y.; Sun, Q.X. Design of optimal environmental policy in the path of economic growth. Financ. Trade Econ. 2017, 38, 99–115. [Google Scholar]
  46. Chen, D.H.; Zhang, J. Environmental Kuznets curve analysis of carbon emissions in China: An empirical study based on spatial panel model. Stat. Inf. Forum 2012, 27, 48–53. [Google Scholar]
  47. Tian, W.; Xie, D. Testing and analysis of agricultural environment Kuznets curve in China from the perspective of carbon emission. Ecol. Econ. 2017, 33, 37–40. [Google Scholar]
  48. Jiang, Z.H.; Feng, Z.X. A theoretical explanation of environmental Kuznets curve based on sustainable development. Oper. Res. Manag. 2008, 4, 16–22. [Google Scholar]
  49. Lin, S. Low-carbon City Development and Sustainable Economic Growth: An Empirical study between the CO2 emissions in Wuhan City. Ecol. Econ. 2014, 30, 98–100. [Google Scholar]
  50. He, H.S. Environmental quality, environmental regulation and industrial structure optimization: Based on the panel data empirical analysis of the eastern, central and western areas of China. Areal Res. Dev. 2015, 34, 105–110. [Google Scholar]
  51. Jin, S.W.; Wu, P.; Jin, J.L. Environmental Kuznets curve (EKC) shape features in typical cities of Anhui Province and analysis of gray correlation degree. Acta Sci. Circumst. 2013, 33, 2068–2077. [Google Scholar]
Figure 1. Study procedure.
Sustainability 16 05567 g001
Figure 2. Fitting curve of the relationship between regional GDP and industrial waste gas emissions in Zhoushan Islands from 2002 to 2022.
Sustainability 16 05567 g002
Figure 3. Fitting curve of the relationship between regional GDP and industrial solid waste emissions in Zhoushan Islands from 2002 to 2022.
Sustainability 16 05567 g003
Figure 4. Fitting curve of the relationship between regional GDP and industrial wastewater emissions in Zhoushan Islands from 2002 to 2022.
Sustainability 16 05567 g004
Table 1. Eight types of decoupling states in Tapio decoupling model.
State IState IIΔYΔXeExpressionMeaning
DecouplingStrong decoupling<0>0e < 0The economy grows while environmental pollution decreasesThe best
Weak decoupling>0>00 < e < 0.8The economy grows while environmental pollution slowly increasesGood
Recessive decoupling<0<0e > 1.2The economy slowly declines while environmental pollution significantly decreasesRelatively good
CouplingExpansive coupling>0>00.8 ≤ e < 1.2The economy grows while environmental pollution increasesNot bad
Recessive coupling<0<00.8 ≤ e < 1.2The economy declines while environmental pollution decreasesRelatively bad
Negative decouplingExpansive negative decoupling>0>0e > 1.2The economy slowly grows while environmental pollution significantly increasesBad
Weak negative decoupling<0<00 ≤ e < 0.8The economy declines while environmental pollution slowly decreasesVery bad
Strong negative decoupling>0<0e < 0The economy declines while environmental pollution increasesThe worst
Table 2. The relationship between economic development and environmental pollution.
No.β1, β2, β3Relationship
1β1 > 0, β2 < 0, β3 > 0N-shaped curve
2β1 < 0, β2 > 0, β3 < 0Inverted N-shaped curve
3β1 > 0, β2 < 0, β3 = 0Inverted U-shaped curve
4β1 < 0, β2 > 0, β3 = 0U-shaped curve
5β1 ≠ 0, β2 = β3 = 0Linear
Table 3. Decoupling elasticity coefficient and decoupling state between environmental pollutants and economic growth in Zhoushan Islands from 2002 to 2022.
YearIndustrial Waste GasDecoupling StateIndustrial Solid WasteDecoupling StateIndustrial Waste WaterDecoupling State
2002−0.4960.5430.658
20030.2782.188−0.439
20041.4060.7510.344
20053.3440.7133.296
2006−1.288−0.310−0.124
20070.0032.508−0.167
2008−0.3830.1120.446
20092.608−1.0390.080
2010−0.0911.810−1.519
20113.5900.0303.223
2012−2.258−0.394−0.850
2013−0.336−0.0950.846
20140.912−1.343−2.073
201530.99011.2565.086
20160.1591.083−2.221
20171.1930.569−2.651
20180.1651.529−0.855
20192.3282.0572.731
202034.5280.2732.118
2021−3.3052.901−1.066
20227.103−0.1265.514
Note: “①” represents “Strong decoupling”, “②” represents “Weak decoupling”, “③” represents “Expansive negative decoupling”, “④” represents “Expansive coupling”.
Table 4. The regression fit results of EKC.
Environmental IndicatorsR2F Test Value
Quadratic FunctionCubic FunctionLogarithmic FunctionCubic Function
Industrial waste gas emissions0.7930.7930.39821.749 **
Industrial solid waste emissions0.9740.9780.784248.600 **
Industrial waste water emissions0.1470.6470.20510.397 **
Note: ** meaning significant at the 5% level.
Disclaimer/Publisher’s Note: The statements, opinions and data contained in all publications are solely those of the individual author(s) and contributor(s) and not of MDPI and/or the editor(s). MDPI and/or the editor(s) disclaim responsibility for any injury to people or property resulting from any ideas, methods, instructions or products referred to in the content.

