Article

Recycling Iron Ore Waste through Low-Cost Paving Techniques

by
Virlene Leite Silveira
1,
Antônio Carlos Rodrigues Guimarães
1,
Lisley Madeira Coelho
1,*,
William Wilson dos Santos
1,
Pedro Henrique Poubel Mendonça da Silveira
2,3 and
Sergio Neves Monteiro
2
1
Department of Fortification and Construction, Military Institute of Engineering—IME, Praça General Tibúrcio, 80, Urca, Rio de Janeiro 22290-270, Brazil
2
Department of Materials Science, Military Institute of Engineering—IME, Praça General Tibúrcio, 80, Urca, Rio de Janeiro 22290-270, Brazil
3
West Zone Campus, Rio de Janeiro State University—UERJ, Avenida Manuel Caldeira de Alvarenga, 1203, Campo Grande, Rio de Janeiro 23070-200, Brazil
*
Author to whom correspondence should be addressed.
Sustainability 2024, 16(13), 5570; https://doi.org/10.3390/su16135570
Submission received: 9 May 2024 / Revised: 17 June 2024 / Accepted: 21 June 2024 / Published: 29 June 2024

Abstract

:
Research on road construction has evolved and advanced. Environmental sustainability considerations are now an integral part of the specific focus of these infrastructure projects. This study investigated the feasibility of recycling on iron ore reject through cost-effective pavement techniques, demonstrating significant improvements in the performance of stabilized mixtures with the addition of anti-dust treatment. The mineralogical and chemical analysis of the reject, coupled with the conducted priming tests (LWT and WTAT), highlighted the effectiveness and promising application of these materials in construction. Under a load of 33 kg, the anti-dust-treated mixture showed a deformation of 5.3 mm, compared to 7.76 mm for the stabilized reject–emulsion mixture. Similar improvements were observed in reject–soil–emulsion mixtures, with a sinking of 4.16 mm for anti-dust-treated specimens compared to 6.99 mm for stabilized mixtures. The results of the WTAT test corroborated the effectiveness of the layer formed by the anti-dust treatment; in all cases, the mass loss was less than 2%. These findings have significant implications for sustainability in construction, contributing to environmental conservation and resource efficiency.

1. Introduction

The discussion about road construction is now extending beyond mere quality, also focusing on environmental sustainability. The environmental impact of road construction has been widely debated, reflecting concerns in various industries [1,2]. Within this context, unpaved roads play a crucial role in Brazil, connecting rural areas and small towns, facilitating the transportation of agricultural and industrial products, as well as providing access to general services. They contribute to the development and improvement of the quality of life of communities served by them [3,4].
In this sense, research by the National Confederation of Transport [5] revealed a significant demand for paving works on still unpaved highways. Indeed, a large part of the national road network (87.6%) remains unpaved, highlighting the urgent need for studies and paving works to improve the Brazilian road infrastructure. As a result, significant investments are being made in maintaining these highways to ensure continuous traffic, and it is feasible to reduce these costs by adopting low-cost pavements in conditions where resources are limited and traffic conditions do not require traditional paving [6].
In the field of pavement construction, emerging techniques such as soil emulsion, bituminous stabilization, and the use of various types of waste in pavement layers have gained prominence in the scientific community, resulting in studies focused on innovation in the low-cost pavement sphere. The development of pavements using these techniques not only promotes improvements in the quality of the road construction sector but also meets the socio-economic needs of regions with limited infrastructure investments [7,8,9].
Recent studies, such as that of Andavan and Kumar [10,11,12], demonstrate a considerable improvement in the resistance of soil layers with the use of asphalt emulsion. This technique can be applied to gravel roads or highway shoulders, making urban or rural roads with low traffic more accessible, combining the soil–emulsion technique with a thin surface asphalt coating. In addition, several studies have been conducted using alternative materials in asphalt applications, aiming for greater wear resistance [13,14,15,16].
Current research into dust suppression methods has mainly focused on dust dispersion, with an emphasis on dust control techniques to improve air quality and reduce environmental impacts [17,18,19]. However, there is a significant gap in the literature regarding mechanical analyses of the potential of anti-dust treatment, especially in stabilizing and improving the mechanical properties of building materials. Thus, this would not only reduce construction costs but also ensure a better quality of life for the population in regions with unpaved roads, resulting in significantly improved traffic conditions during rainy periods.
Considering the abovementioned, this research aims to investigate the effects of reusing iron mining waste combined with anti-dust treatment and bituminous stabilization techniques, through the evaluation of the affinity relationship between waste–emulsion. In this way, it is intended to contribute to the reduction in waste accumulation in disposal piles and improve traffic conditions during rainy periods on unpaved roads.

2. Materials and Methods

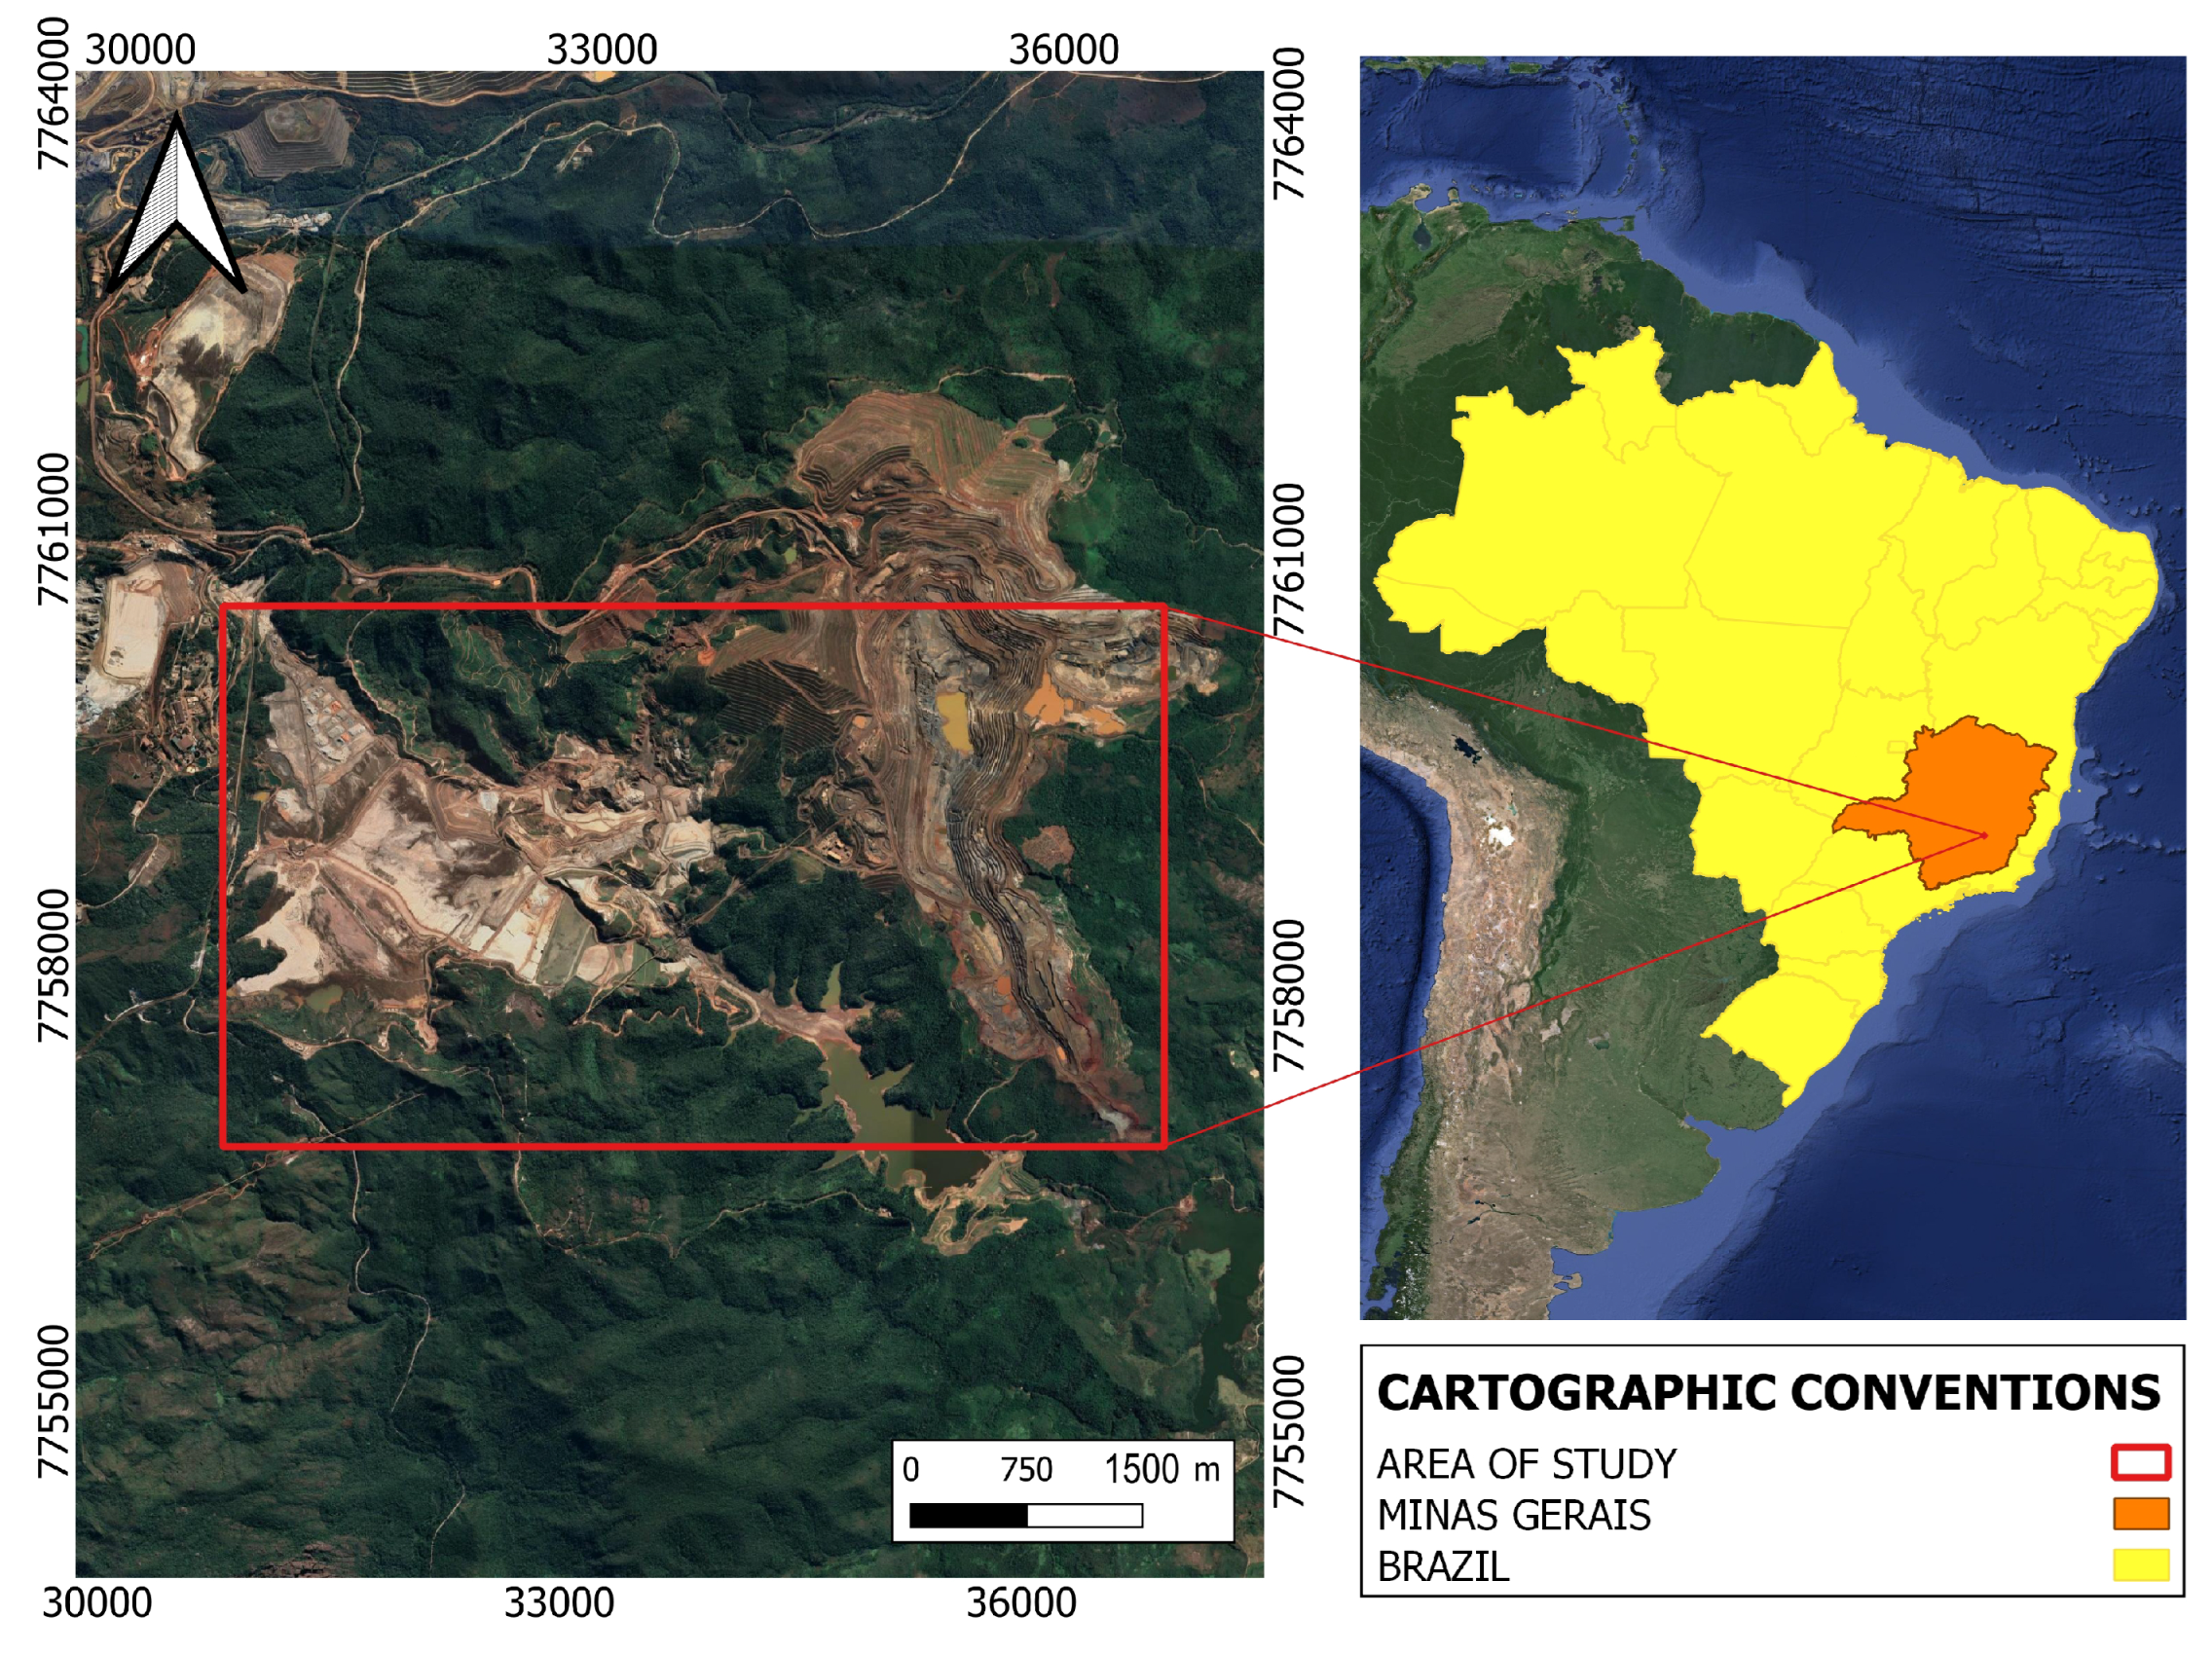
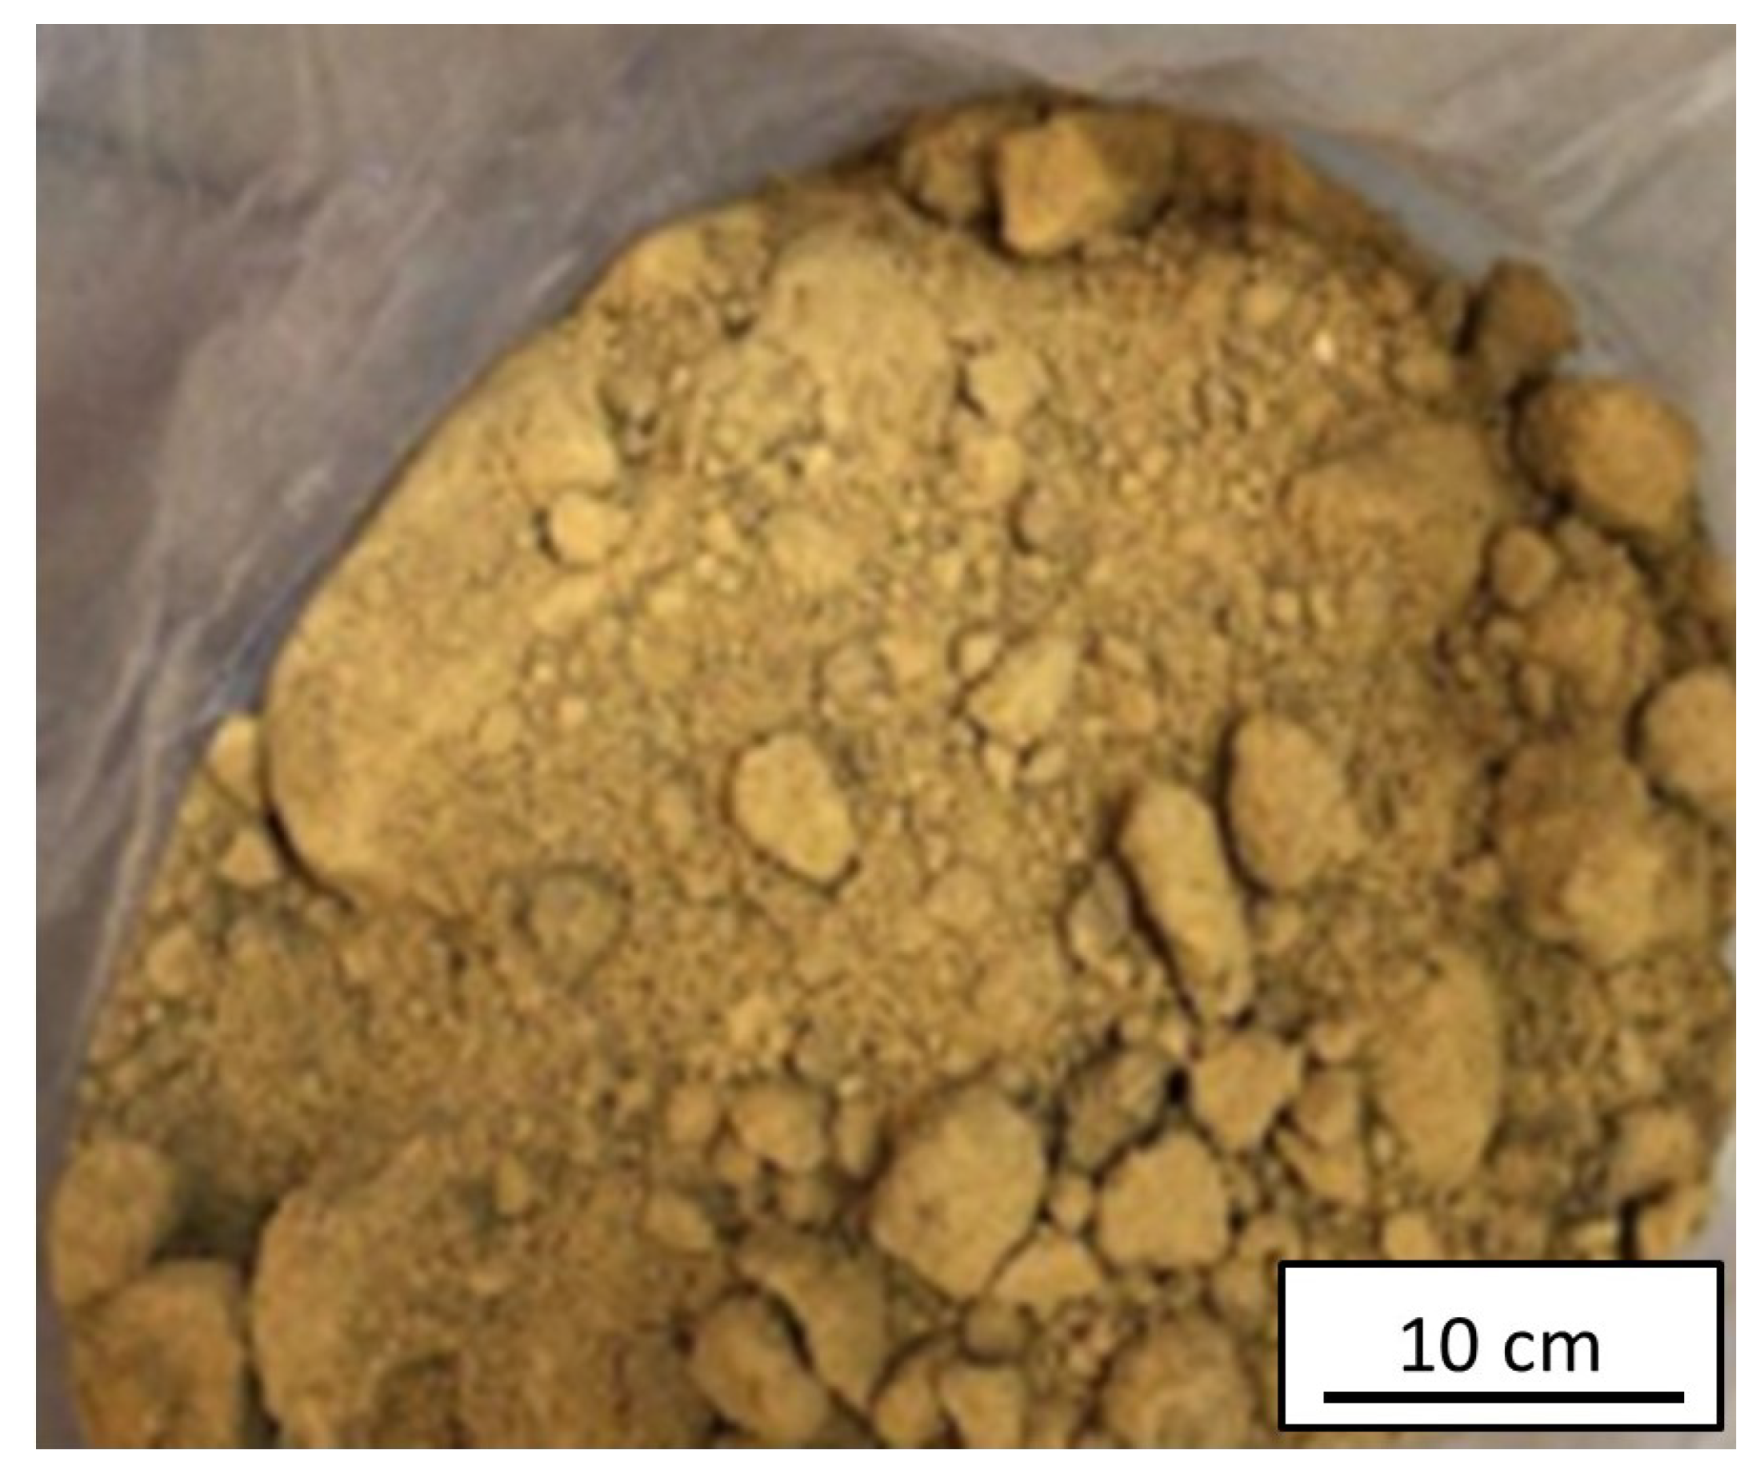
2.1. Description of Extraction Site and Materials Used

The material used in this paper was obtained from a source of sandy tailings resulting from iron mining, located in the vicinity of the dam of the industrial unit of Germano, in the state of Minas Gerais, Brazil. The geographical location of the region from which the material was extracted is shown in Figure 1.
The tailings sample underwent a series of evaluations to assess its physical, chemical, and mineralogical properties as well as to verify the feasibility of its application in paving. Figure 2 presents a flowchart of the tests and characterizations performed. The characterizations and tests conducted on the tailings will be explained in the following subsections.

2.2. Physical Characterization
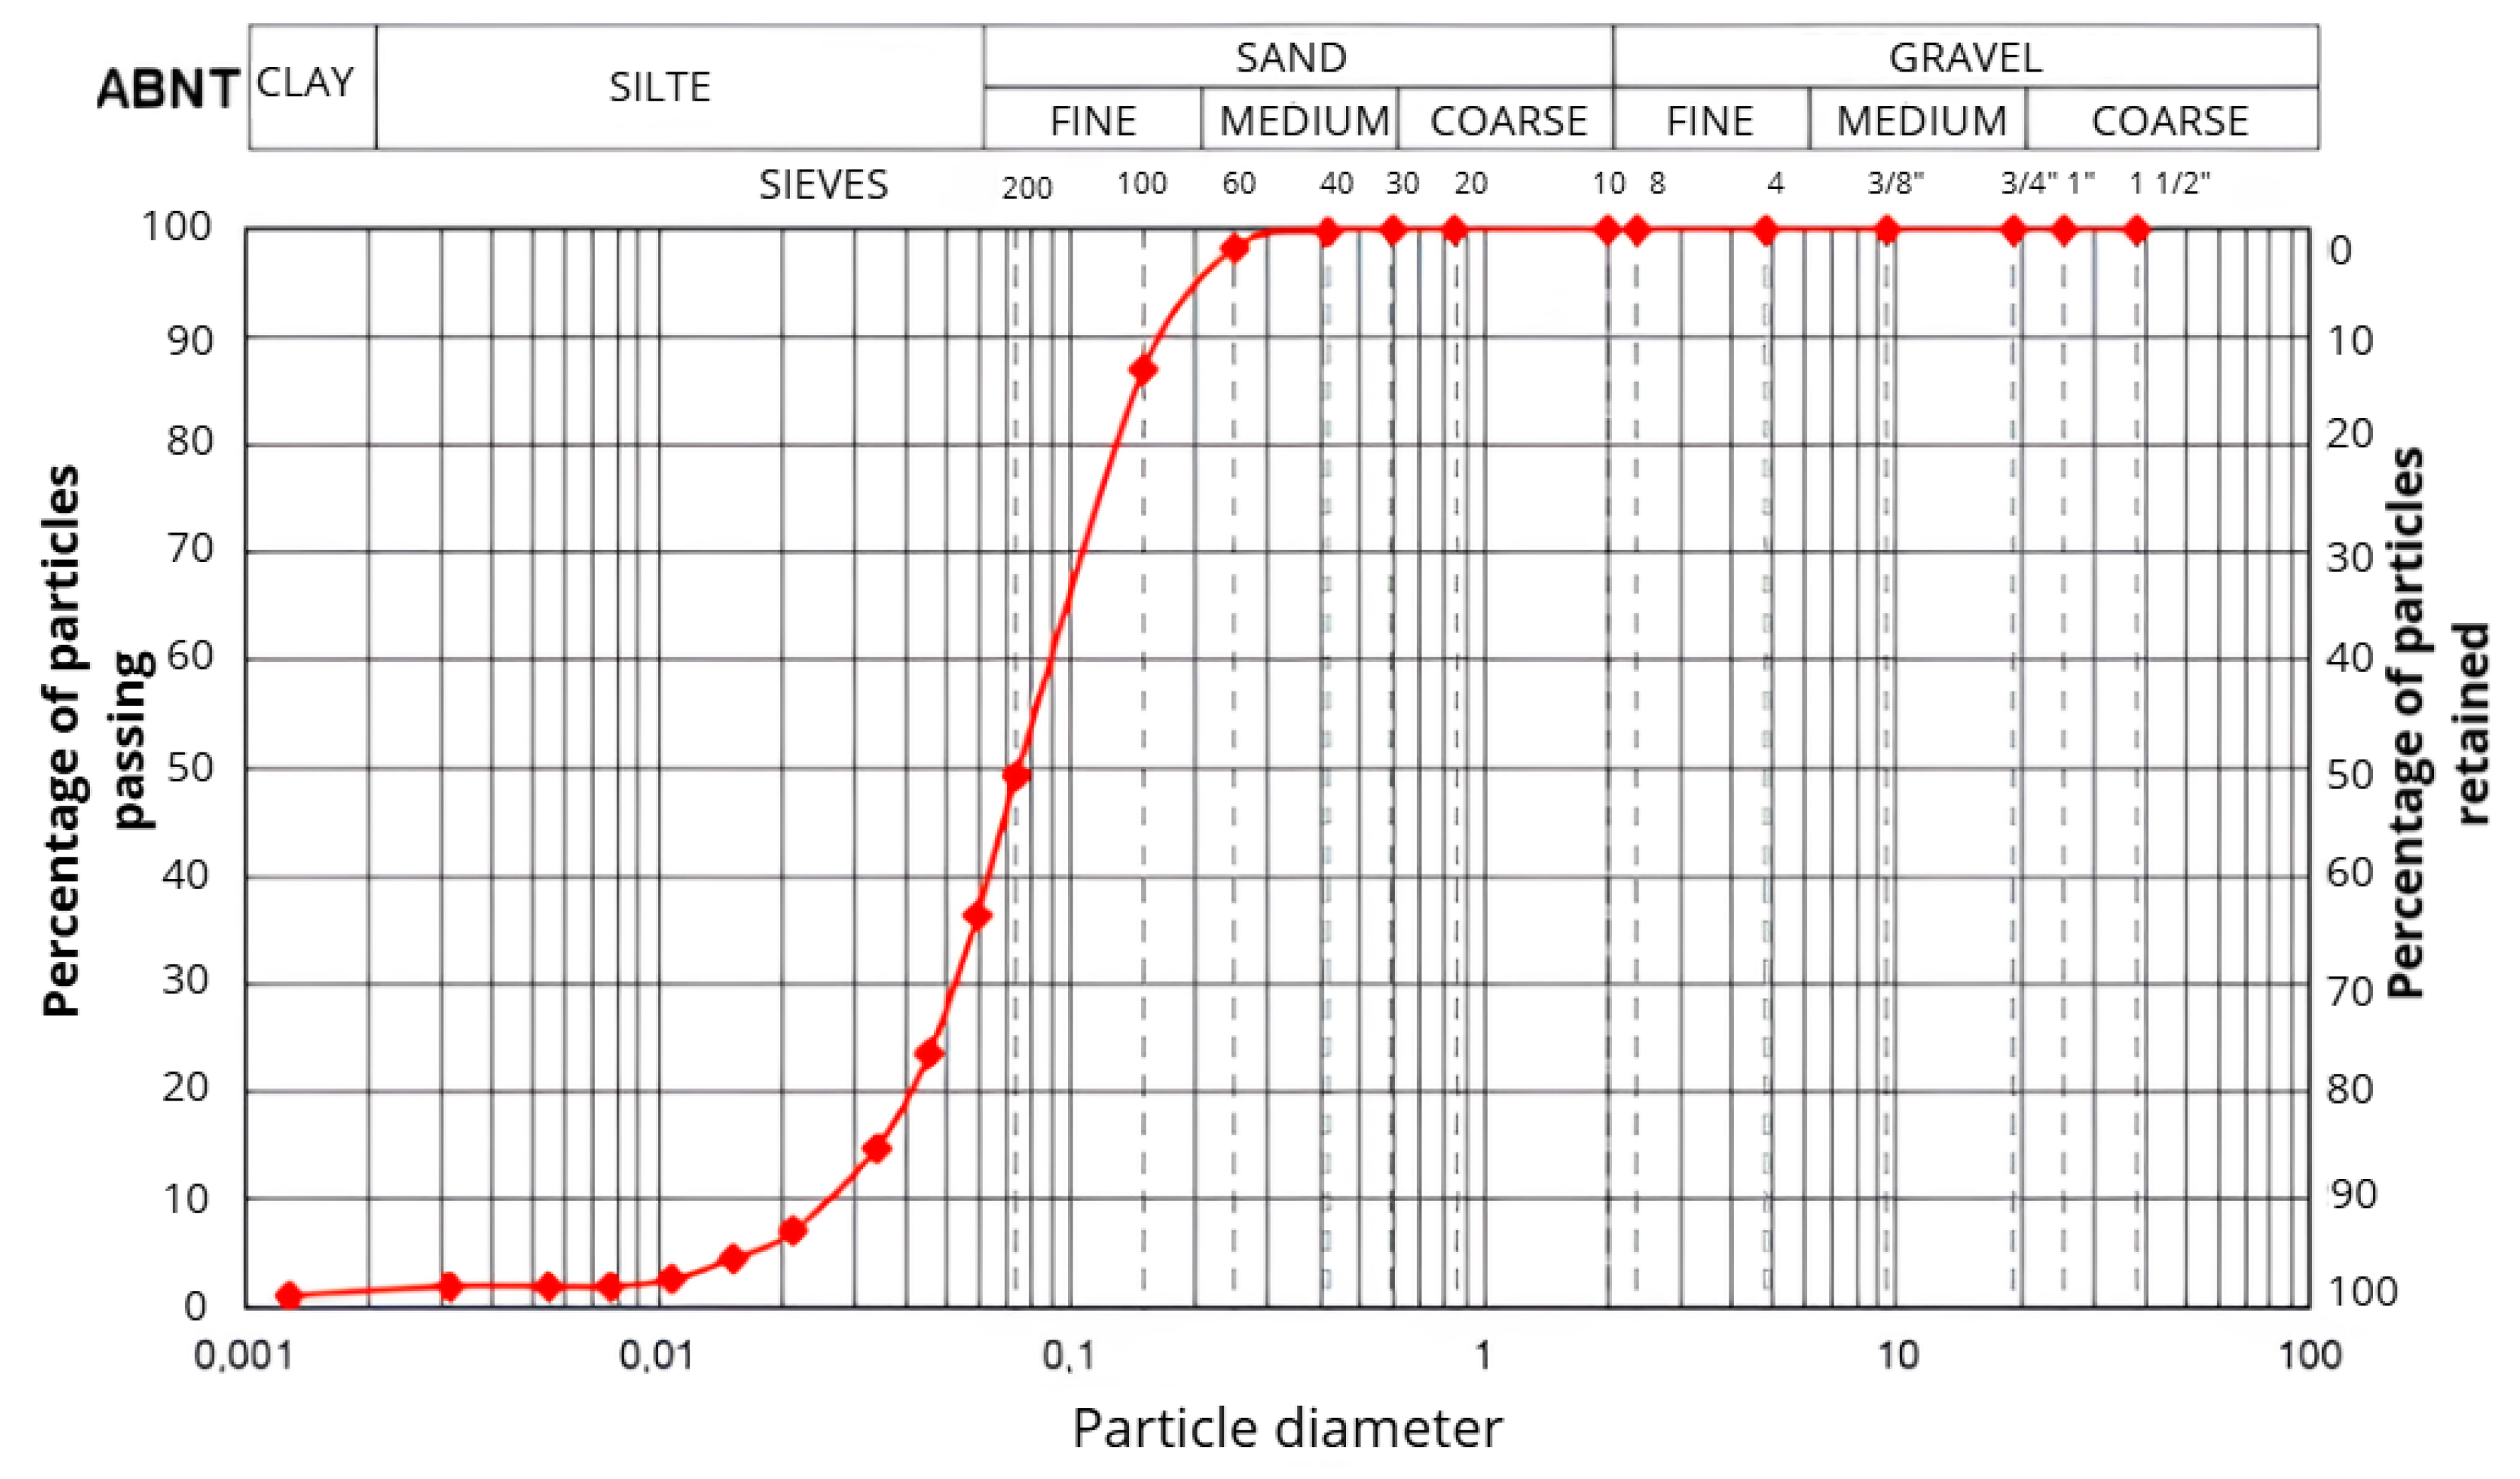
2.2.1. Granulometry

The granulometry of the sandy tailings was conducted following the standard DNER-083 [20], using both the sieving and sedimentation methods. Additionally, the laser diffraction granulometry test was employed as established in standard ISO-13320 [21], aiming to analyze the particle size distribution of fine material or fillers passing through the sieve opening of 0.075 mm.
The laser granulometry test was conducted using the Malvern Mastersizer 2000 equipment (São Paulo, Brazil). Two samples of the tailings that passed through the sieve number #200, with an aperture of 0.075 mm, were analyzed after the conventional sieving process. As for the soil used in the study, only sieve granulometry was performed. Additionally, for both the tailings and the soil, compaction tests DNER-162 [22], sand equivalent DNER-054 [23], density DNER-084 [24], and consistency limits DNER-082 [25] and DNER-122 [26] were conducted.

2.2.2. Aggregate Image Measurement System (AIMS)

The AIMS test is based on image processing to assess the external characteristics of aggregates, such as the 2D and 3D shape index, angularity, texture, and roundness. It is conducted in stages corresponding to the different sieves used in their granulometry. However, for fine aggregates, such as the studied tailings, only data related to 2D shape index and angularity are considered. This procedure was carried out following the standards AASTHO PP64-10 [27] and AASTHO TP81-10 [28], using the equipment available in the Geotechnical Laboratory at the Federal University of Rio de Janeiro, Brazil.

2.3. Mineralogical, Chemical, and Environmental Characterization of the Tailings

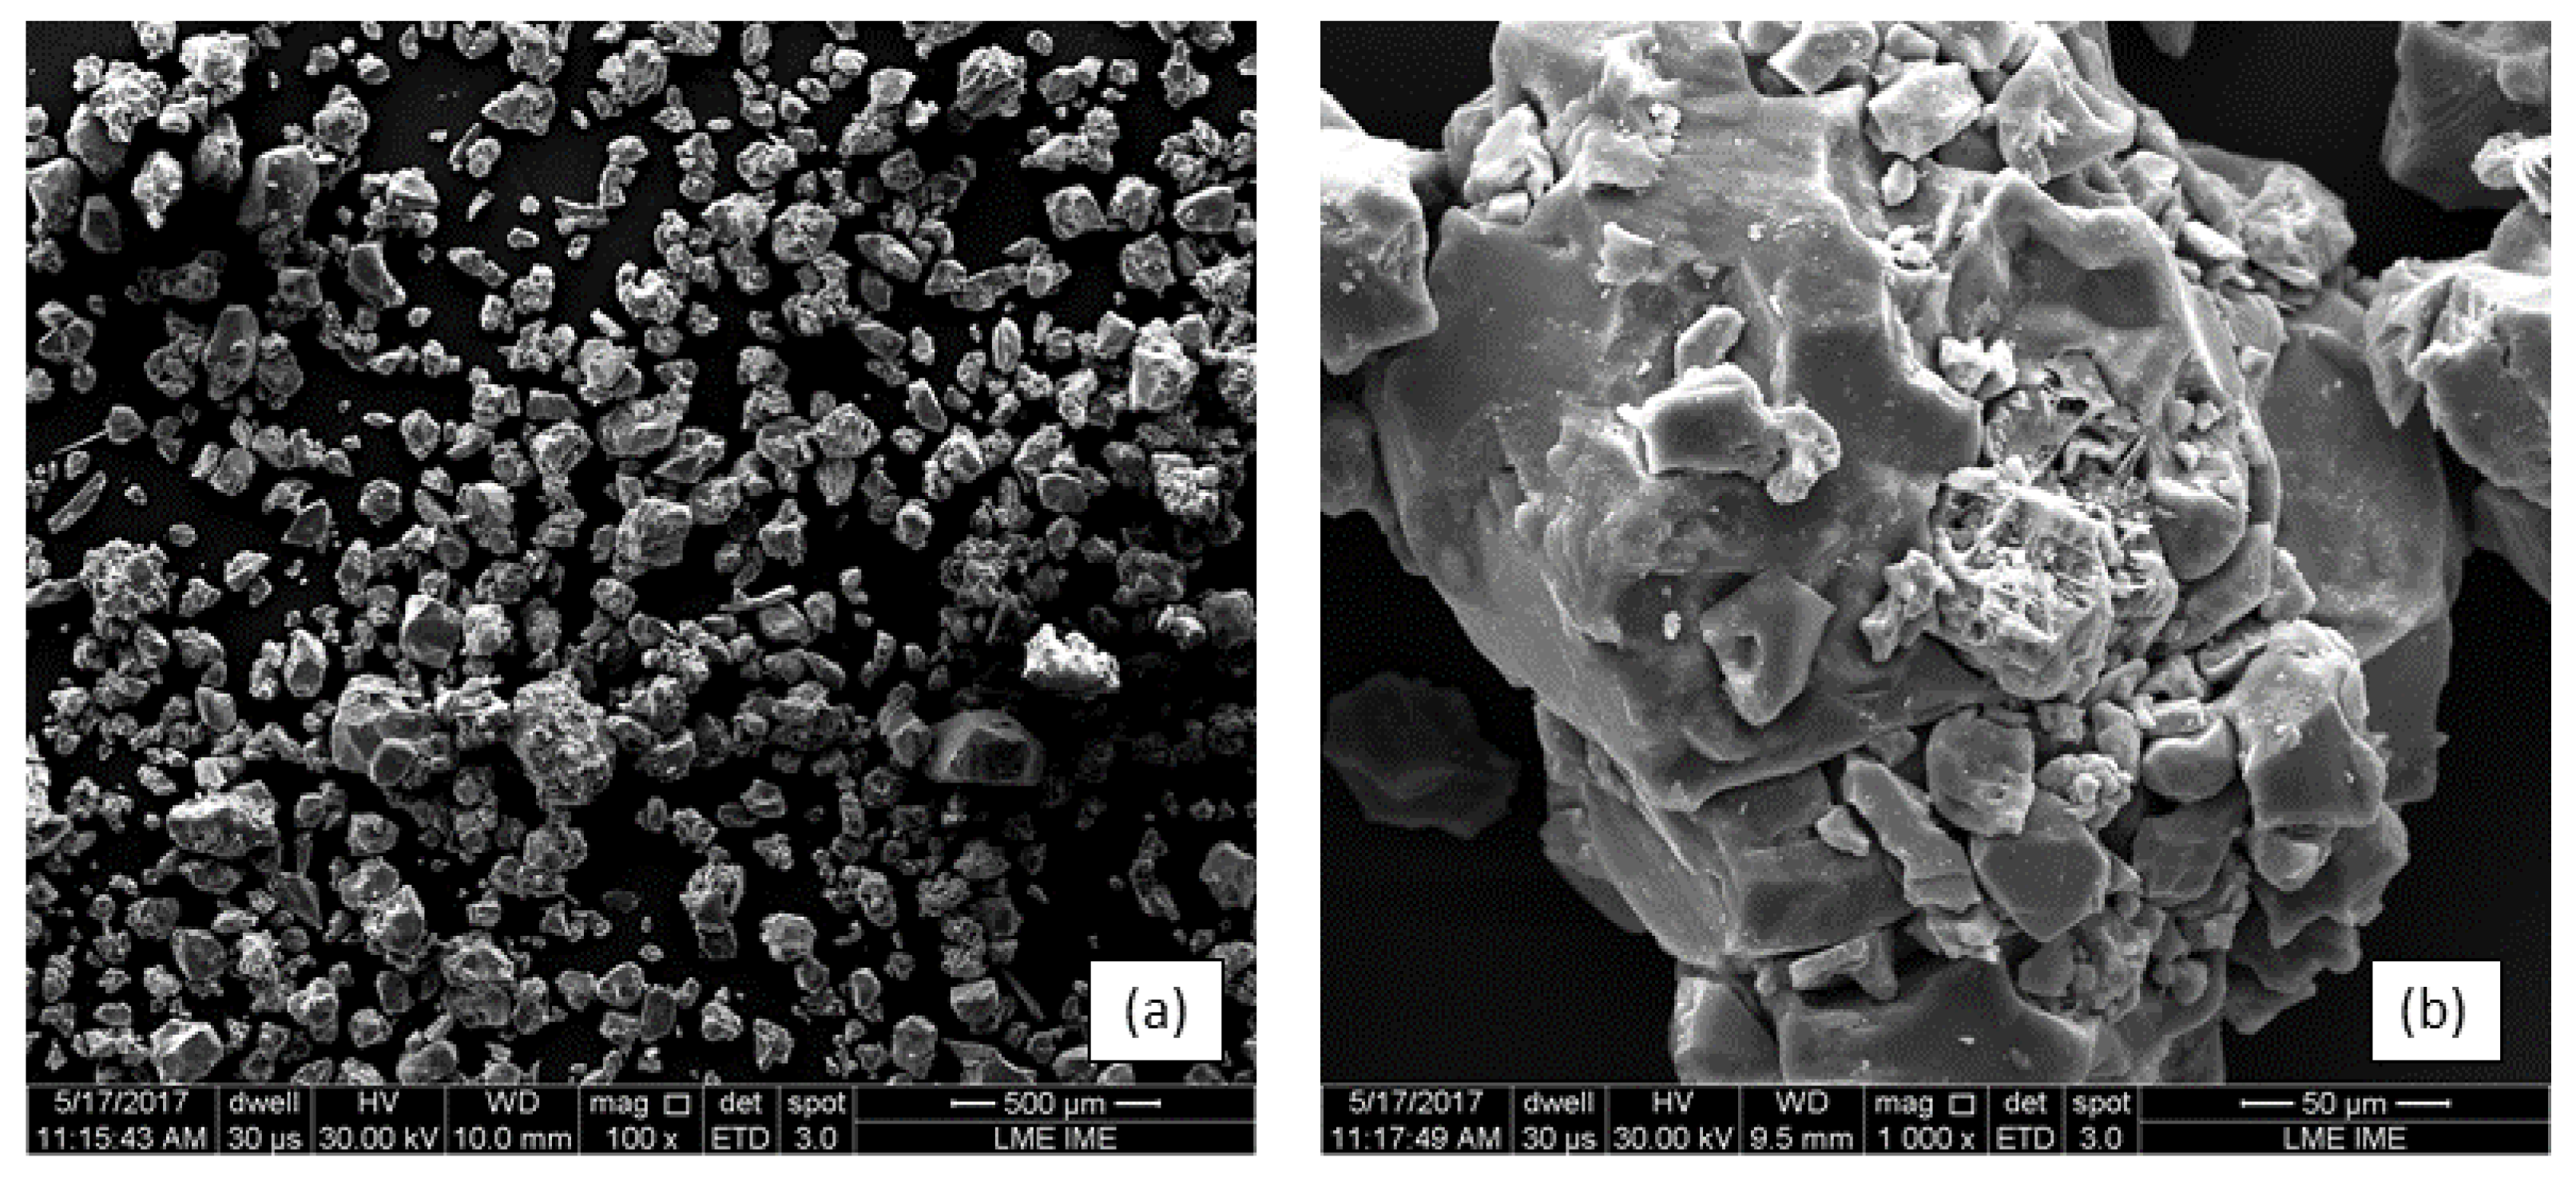
2.3.1. Scanning Electron Microscopy (SEM) and Energy-Dispersive X-ray Spectroscopy (EDX)

The samples were morphologically analyzed by SEM using the QUANTA FEG 250 microscope, manufactured by FEI (Hillsboro, OR, USA). The samples were coated with gold utilizing a Leica ACE600 high-vacuum coating chamber (Wetzlar, Germany). SEM analysis was carried out under the following parameters: electron beam power of 20 kV, working distance ranging between 10.5 and 13 mm, spot size of 5, and image magnification at 100 and 1000×, utilizing the secondary electron detector. For EDX analysis, a detector from the manufacturer Bruker (Billerica, MA, USA) was employed, coupled to the microscope column.

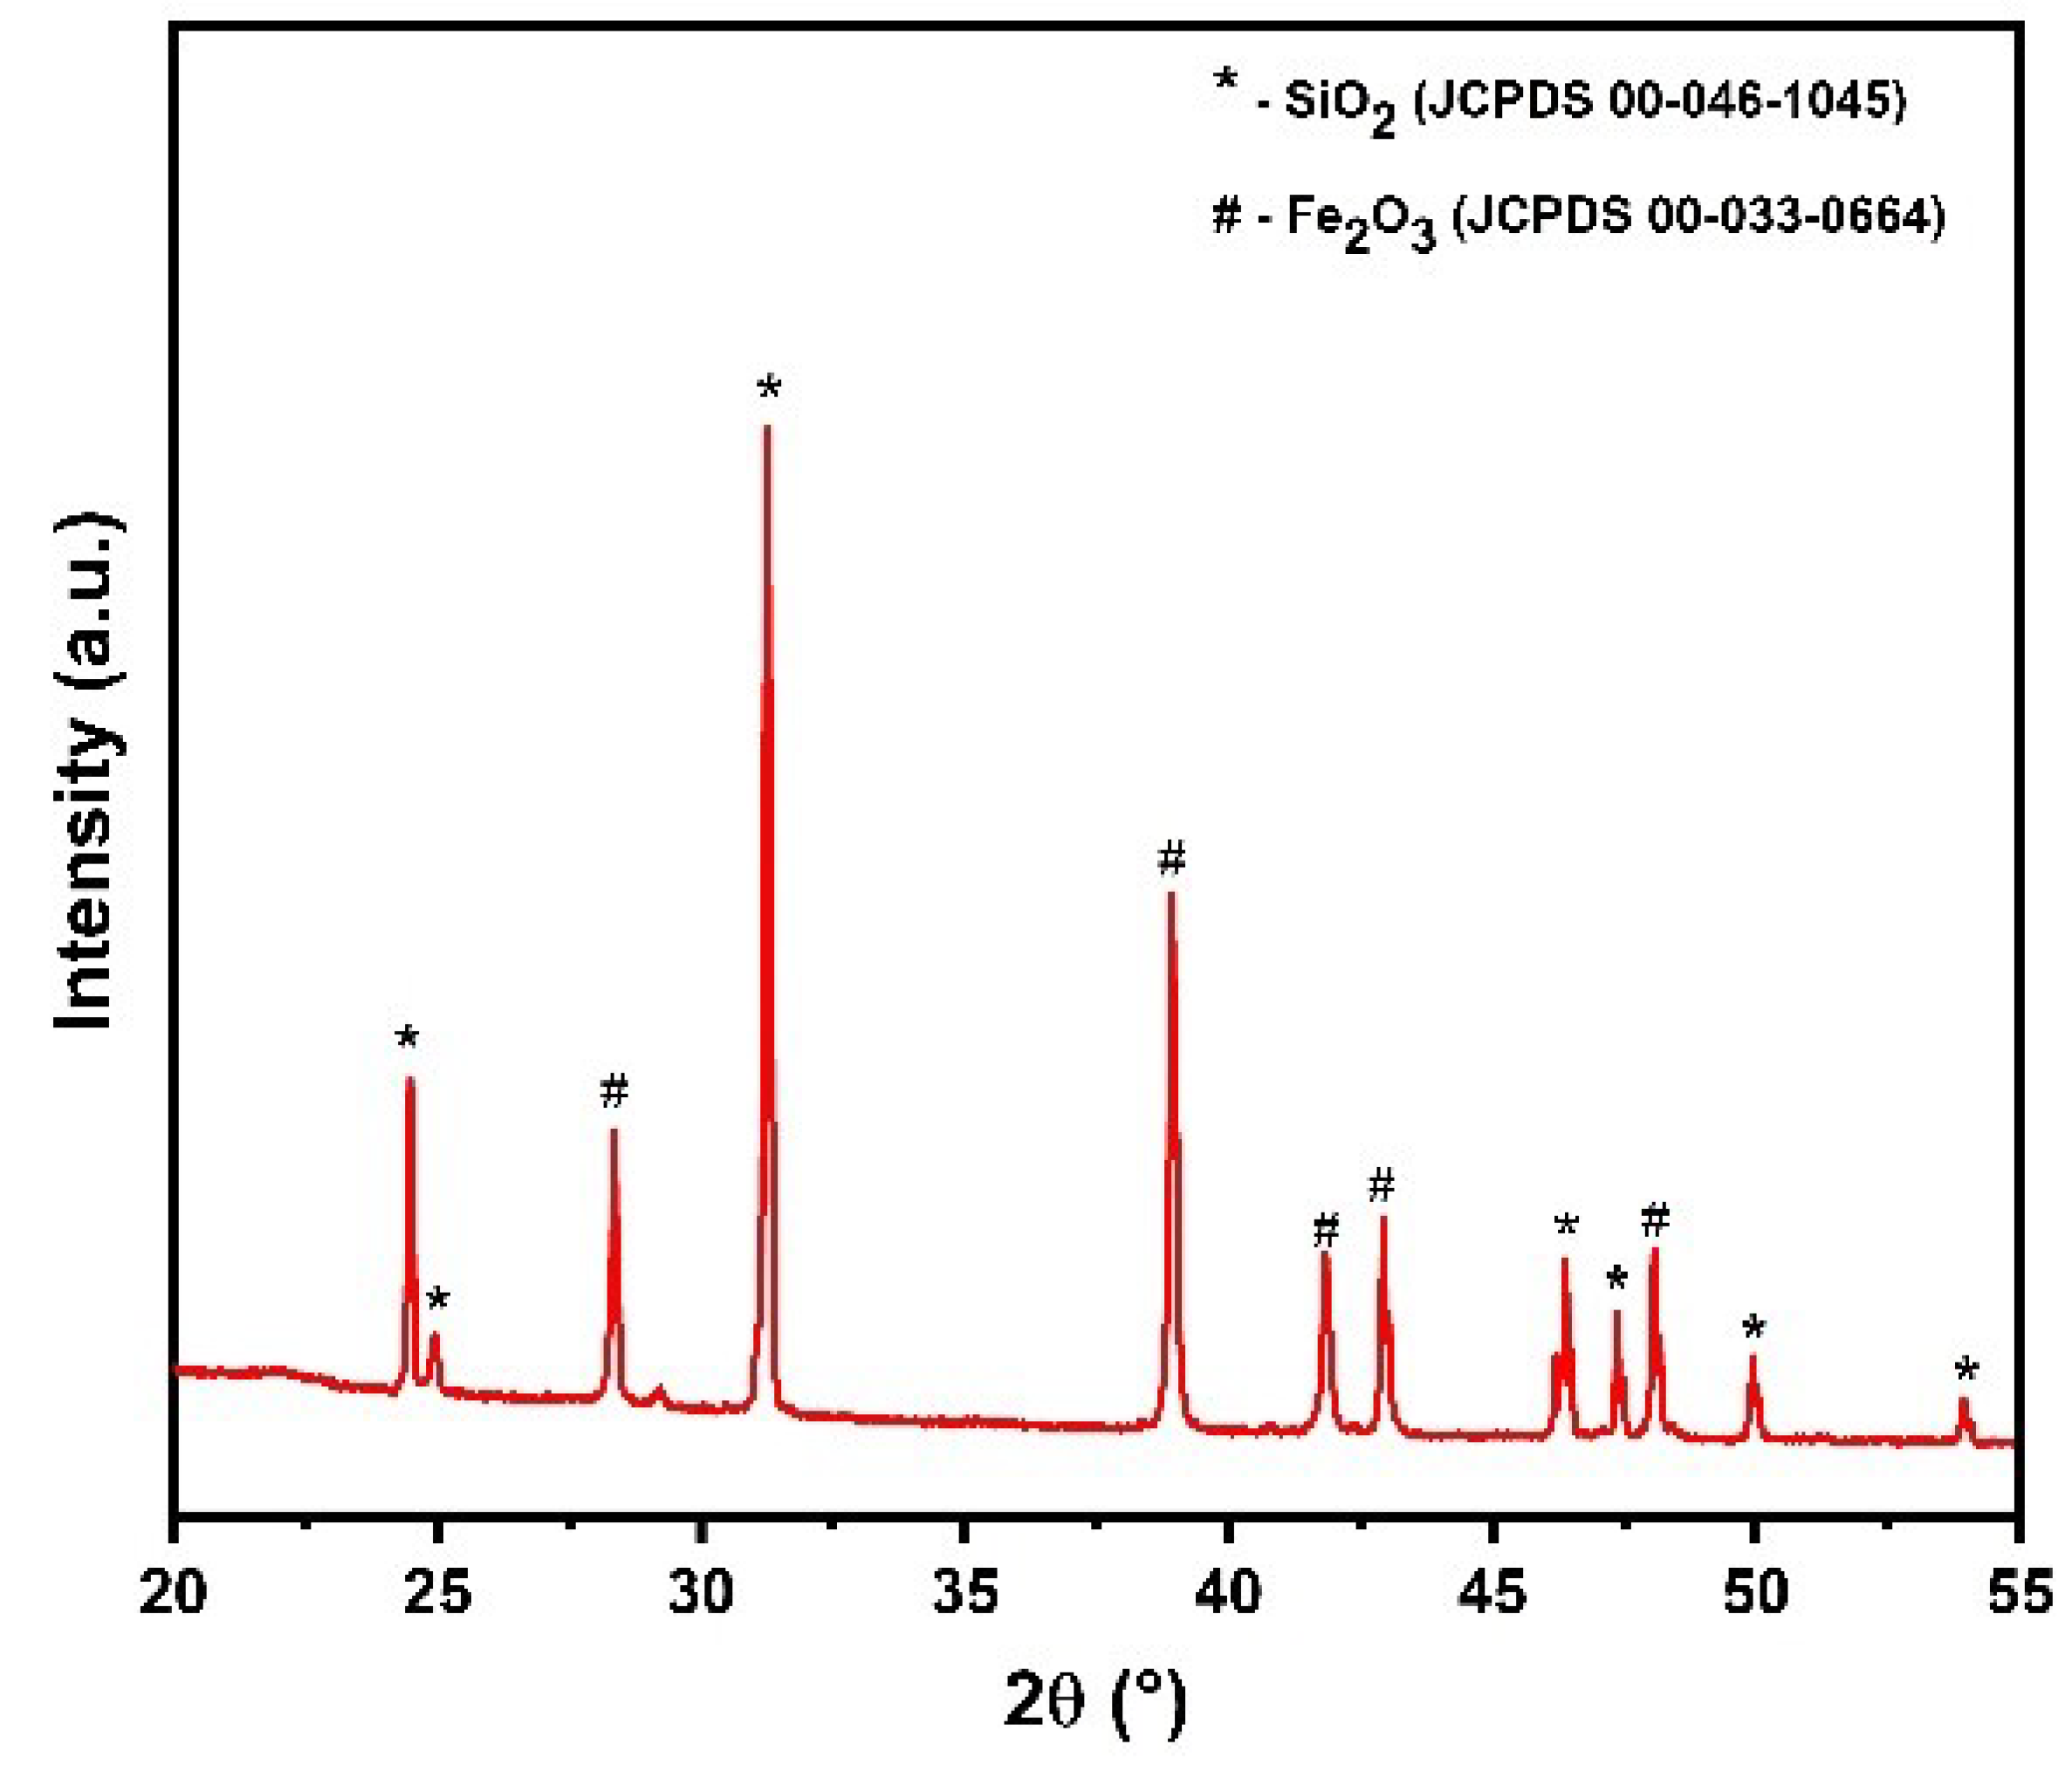
2.3.2. X-ray Diffraction (XRD)

To perform the XRD analysis, the samples were inserted in a monocrystalline silicon substrate. The analysis was performed using the Xpert Pro MRD System equipment from PANalytics (Vancouver, BC, Canada) with Cobalt K α radiation (1.789 A), at a scan speed of 4°/min and a power of 40 mA × 40 kV and scanning from 20° to 55°.

2.4. Priming Evaluation

Cationic slow and medium breaking emulsions (RL-1C and RM-1C) were tested at rates of 1.2 L/m2 and 1.5 L/m2, while the cutback petroleum asphalt CM-30 was tested at rates of 0.6 L/m2, 0.8 L/m2, and 1.0 L/m2. These priming tests were conducted on stabilized mixtures of iron mining tailings and emulsion (tailings–emulsion) and tailings–soil–emulsion. The samples consisted of sandy tailings with 6 wt.% emulsion, and of sandy tailings with 2 wt.% emulsion and 10 wt.% soil replacing the dry weight of the tailings.
To ensure adequate viscosity and facilitate the spread of the emulsion on the test specimens, priming with RL-1C emulsions, RM-1C, and petroleum cutback asphalt (CM-30) was performed at room temperature, as well as by heating the asphalt material to 60 °C.
Furthermore, to improve viscosity, the dilution of RL-1C and RM-1C emulsions by 50 wt.% was tested, applying the diluted emulsion (1:5 by volume) directly onto the compacted base at rates ranging from 0.4 to 2.3 L/m2. For each studied mixture, test specimens (TSs) were molded at intermediate energy (13 blows) using a Marshall mold (Marshall Mold & Engineering, Glendale Heights, IL, USA), with the process being carried out in duplicate at the optimum compaction moisture content.
The priming was carried out immediately after compaction using a syringe, and the TSs were left to rest for 72 h. Although the priming emulsion broke within the first 24 h, the additional resting time is related to the stability of the test specimen for demolding. After this procedure, the TSs were cut longitudinally, and the penetration thickness of the bituminous material was measured at three distinct points, determining the average.

2.5. Anti-Dust Treatment (ADT)

To validate the use of the ADT technique in the layers of the base made of mining tailings, test specimens were prepared using the same base studied in the priming analysis (tailings–emulsion). These test specimens were prepared by adding a thin layer of coating and/or anti-dust layer, formed by the combination of fine aggregate (tailings) and emulsion.
The anti-dust treatment layer was applied in two stages, known as the simple anti-dust treatment (SADT). In the first stage, called bath 1, the base layer was primed. In the second stage, bath 2, the emulsion was dispersed after complete infiltration in the first bath, around 24 h, followed by salting, which consisted of covering the layer with sandy tailings immediately after priming.
For salting, a rate of 4.0 kg/m2 of sandy tailings was used. This rate was determined based on manual ABEDA [29], which suggests a range of 4.0 kg/m2 to 6.0 kg/m2 for this stage. The minimum rate was chosen due to observations during the tests, which indicated that the material was not completely absorbed by the emulsion, resulting in excess for higher rates used.

2.6. Surface Wear Evaluation

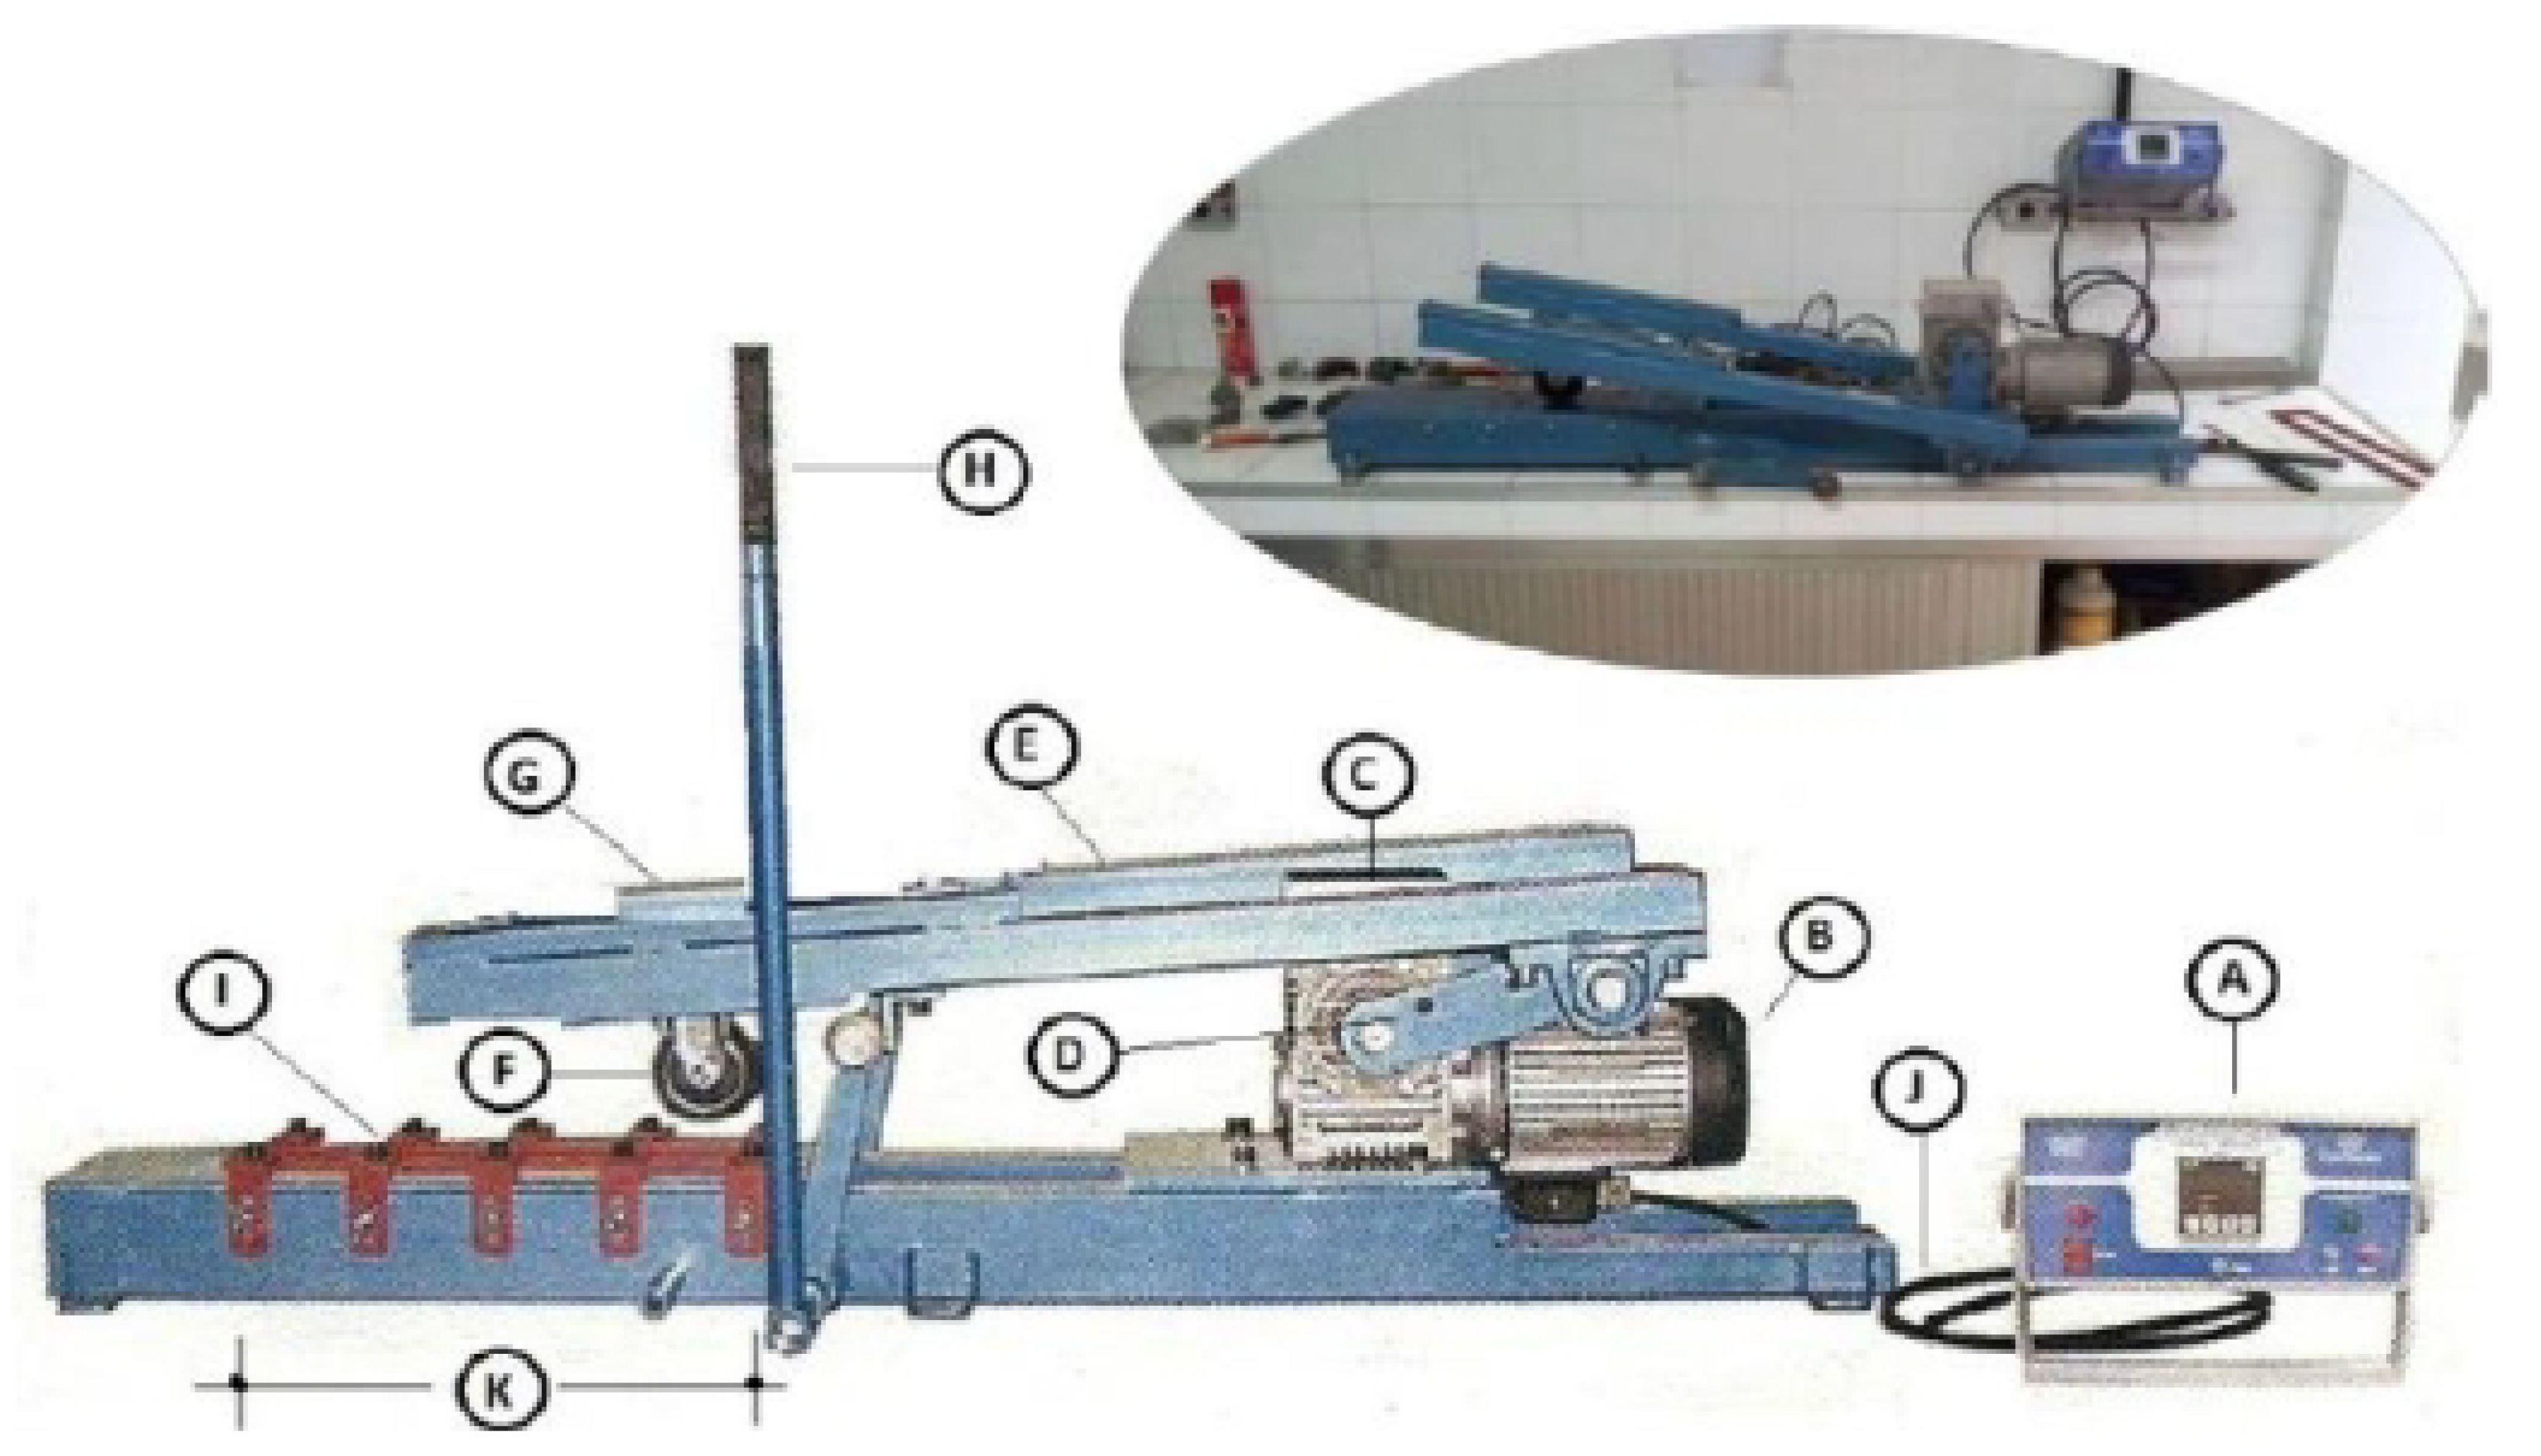
2.6.1. Loaded Wheel Test (LWT)

The LWT was conducted following the guidelines established in the NBR 1484 [30] standard, aiming to assess the impact of compaction and the deformation characteristics of the layer under traffic simulation. To perform the LWT, we used equipment from the manufacturer Contenco Indústria e Comércio Ltd. (São José da Lapa, Brazil), installed in the soil and bitumen laboratory of the Military Institute of Engineering, Brazil, as illustrated in Figure 3.
The molds used in the preparation of the samples were made as rectangular boxes, with the top open to receive the material. The main modification in relation to the original mold lies in the lateral confinement, provided by the iron box walls, with a height of 50 mm, while the width (50 mm) and length (380 mm) remain as stipulated by the standard. The FL 312 UFN wheel from Novex (Colchester, UK), capable of supporting up to 170 kg, was selected for the test.
During the test, the load was initially set to ±10.0 kg and increased by ±10.0 kg every 500 cycles until reaching the maximum load of 56 kg. The test was concluded when noticeable defects appeared or when the specimen ruptured. Cycle counting was performed by an electronic footstep controller, where each cycle corresponds to two passes of the test wheel.
Considering that the test is adapted for soils, sample analysis involved visual observations, focusing on common pavement defects such as disaggregation, wheel track depressions, consolidation settlements, corrugation, or the formation of potholes. Results were categorized into approval concepts (very good and good) or disapproval (poor and very poor), based on scores related to depressions and irregularities observed during the test execution. Performance ratings in the LWT test are detailed in Table 1.

2.6.2. Wet Track Abrasion Test (WTAT)

The WTAT was conducted according to the brazilian standard [31]. The test consists of subjecting a test specimen to abrasion caused by the action of a rubber hose, at a determined speed and over a predefined number of cycles. The mold used for making the test specimens consisted of plates with 6.3 mm thickness, forming a closed cylinder at the base, with internal dimensions of 50.0 mm in height and 300.0 mm in diameter. The material compaction in the mold was carried out using a Marshall compaction hammer. The Figure 4 shows the mold used and the test process.
The evaluation stage of stabilization in reject–emulsion mixtures began after compaction. On the other hand, in the anti-dust treatment, it was necessary to apply primer according to the rate established in the priming test, wait for the emulsion break time (24 h), and leave the soil-printed mold in an oven at a temperature close to 50 ºC for 48 h for the asphalt emulsion curing before conducting the WTAT abrasion test.
The analysis of the results is based on vertical permanent deformation, which is calculated by the difference between the final (post-test) and initial (pre-test) average heights. Abrasion loss is determined by the difference in mass between the final (post-test) and initial (pre-test) of the test specimens. Evaluation is performed through scoring, obtained by summing three scores related to mass loss due to abrasion, vertical permanent deformation, and visual observations of the material at the end of the test, according to the criteria described in Table 2.

3. Results and Discussion

3.1. Physical Evaluation (Reject)

Figure 5 shows the particle size analysis of the studied reject. The mining reject exhibited 1% clay, 36% silt, 56% fine sand, and 7% coarse sand. The reject showed approximately 50% of material passing through sieve number 200.
According to Figure 5, the sandy reject exhibited a characteristic maximum dimension of 0.3 mm and a fineness modulus of 0.14, indicating it to be a very fine material. The particle size analysis revealed that the material is below 0.3 mm, with 86.2% below 0.15 mm. From the laser diffraction granulometric curve, illustrated in Figure 6, it was observed that 90% of the residue particles are distributed between the ranges of 1 μ m and 100 μ m, with an average size of 52 μ m.
Analyzing the particle size distribution curves in both tests, it can be stated that the residue exhibited an adequate distribution for its classification as fine aggregate, composed mainly of silt and fine sand. The results for the AIMS test conducted for the angularity and 2D shape variables are presented in Table 3.
According to the results in Table 3, the reject exhibits particle shapes both semi-circular and semi-elongated. Although the classification of these particles is predominantly semi-elongated, a considerable portion of the sample is classified as semi-circular (35.1%), while the semi-elongated classification encompasses 37.5% of the particles.
Considering the application in asphalt pavement, the presence of a significant percentage of flat and elongated aggregates can lead to breakage during the compaction process, resulting in alterations in the gradation of the mixture and leading to changes in the expected properties. Knowing that rounded aggregates tend to have low angularity and non-rounded aggregates tend to have high angularity, it can be inferred that the reject analyzed in this paper exhibits low angularity. The angularity of an aggregate influences the resistance to permanent deformation of asphalt mixtures, as irregular or angular aggregates provide greater interlocking and resistance to displacement between particles during compaction.
Regarding the real density of the sandy reject, a value of 2.80 g/cm3 was found, which is considered high compared to values commonly found in fine aggregate with similar particle size distributions. For example, natural aggregate typically has a mean density of approximately 2.73 g/cm3.
The Atterberg limits results for the sandy reject show that the material behaves as non-liquid and non-plastic due to its granular behavior, which did not exhibit plastic characteristics during the test. Through the compaction test, the reject exhibited an optimum moisture content of 4.9% and a maximum dry density of 1.66 g/cm3.
Regarding the sand equivalent test, the result was 70%, confirming the sandy characteristic of the reject. Rejects tend to exhibit properties of fine to medium sandy soils, containing approximately 60 to 70% sand.
In terms of environmental analysis, the leaching of metals resulted in values below the maximum limits stipulated by NBR10004 [32]. Similarly, the solubilization tests indicated levels of solubilized constituents below the maximum limits prescribed by NBR10004 [32]. The leaching and solubilization tests for volatile and semi-volatile organic compounds produced non-detectable results, falling below the detection limits of the adopted technique and below the maximum limits established by the standard. Thus, the reject does not contain contaminating constituents and can be used in asphalt pavement.
Therefore, based on the results obtained, the mining reject sample can be categorized as Class II B—Non-Hazardous Inert as defined by NBR10004. It is important to note that there is no specific standard for the use of waste or rejects in pavement. Therefore, NBR10004 is used generically to establish classification criteria for solid waste regarding their potential environmental and human health risks.

Physical Evaluation (Soil)

The soil used in the study was collected in the district of Mariana, Minas Gerais, Brazil. It was visually identified as sandy soil with a yellow color as shown in Figure 7. The visual characterization of soil, especially its yellow coloration, is essential for understanding the physical and chemical properties analyzed in this study. The yellow hue suggests the presence of iron oxides [33], indicating soil oxidation conditions. This information is crucial for pavement studies, as iron oxides affect the stability and durability of paving materials.
Table 4 presents the characteristics of the granulometric composition of the sandy soil as well as the consistency limits and their classifications [34] within the Unified Soil Classification System (USCS) of the Highway Research Board (HRB) and by the Methodology Miniature Compacted Tropical (MCT) [35].
According to the MCT methodology, the soil classified as NA’ or also called non-lateritic sandy soil, is genetically the most representative type of saprolitic soils, originating from quartz-rich rocks such as granite, gneiss, and sandstones. According to Nogami and Villibor [36], soils of this group composed of well-graded sand and with the nature and percentage of fines within traditionally stipulated conditions may present suitable conditions for use as pavement bases.
Among the other characteristics of this soil, tests were also conducted for grain real density and compaction, according to Brazilian standard DNIT 443 [37], to obtain parameters such as density, optimum moisture content, and maximum dry density ( σ max) as presented in Table 5.

3.2. Mineralogical and Chemical Analysis of the Reject

Figure 8 illustrates the SEM image of the sample fraction, with magnification degrees of 100 and 1000×, respectively. The micrograph reveals the material heterogeneity, showing the presence of grains with different particle sizes. It is possible to identify that the surface of the grains is smooth with the absence of pores, there are some fissures, and their shape can be interpreted as irregular.
The EDX analysis illustrated in Figure 9 revealed a high concentration of silicon and iron, which is entirely acceptable since all samples are products of iron ore beneficiation. The results found in the reject samples are consistent with those of Apaza et al. [38], who found silicon and iron contents similar to those in this study, addressing the same material.
The reject exhibited null reactivity due to the absence of heavy metals, posing no serious environmental risks from a chemical standpoint and allowing its application in pavement applications. The EDX analysis indicated the presence of Fe (6.13 wt.%), Al (0.10 wt.%), high Si content (42.96 wt.%), O (37.43 wt.%), and C (13.38 wt.%). The high silicon content suggests the presence of quartz as corroborated by XRD analysis.
The XRD diffractogram is shown in Figure 10. Two mineral phases can be observed in the sample: quartz (JCPDS 00-046-1045) as the main mineral, and a second phase composed of hematite (JCPDS 00-033-0664), being the most abundant subordinate mineral. The presence of iron in the sample, such as hematite (Fe2O3), and silicon through quartz (SiO2) justify the non-expansive nature of the sandy residue.
The presence of iron in the sample, in the form of oxide, with hematite having a specific gravity between 5.17 and 5.18 g/cm3, and the presence of silicon, through quartz with a specific gravity of about 2.65 g/cm3, justify the real density values found for the sandy reject. The literature shows the presence of other clay minerals in similarly processed sandy rejects, such as goethite, kaolinite, and vermiculite [39].
The results of the chemical analysis by X-ray fluorescence (XRF) are presented in Table 6. It was observed that the mining reject is essentially composed of SiO2 (88.68%) and, secondarily, by Fe2O3 (9.46%). Additionally, it showed very low values of soluble salts, soluble sulfates, and chlorides, considered irrelevant.

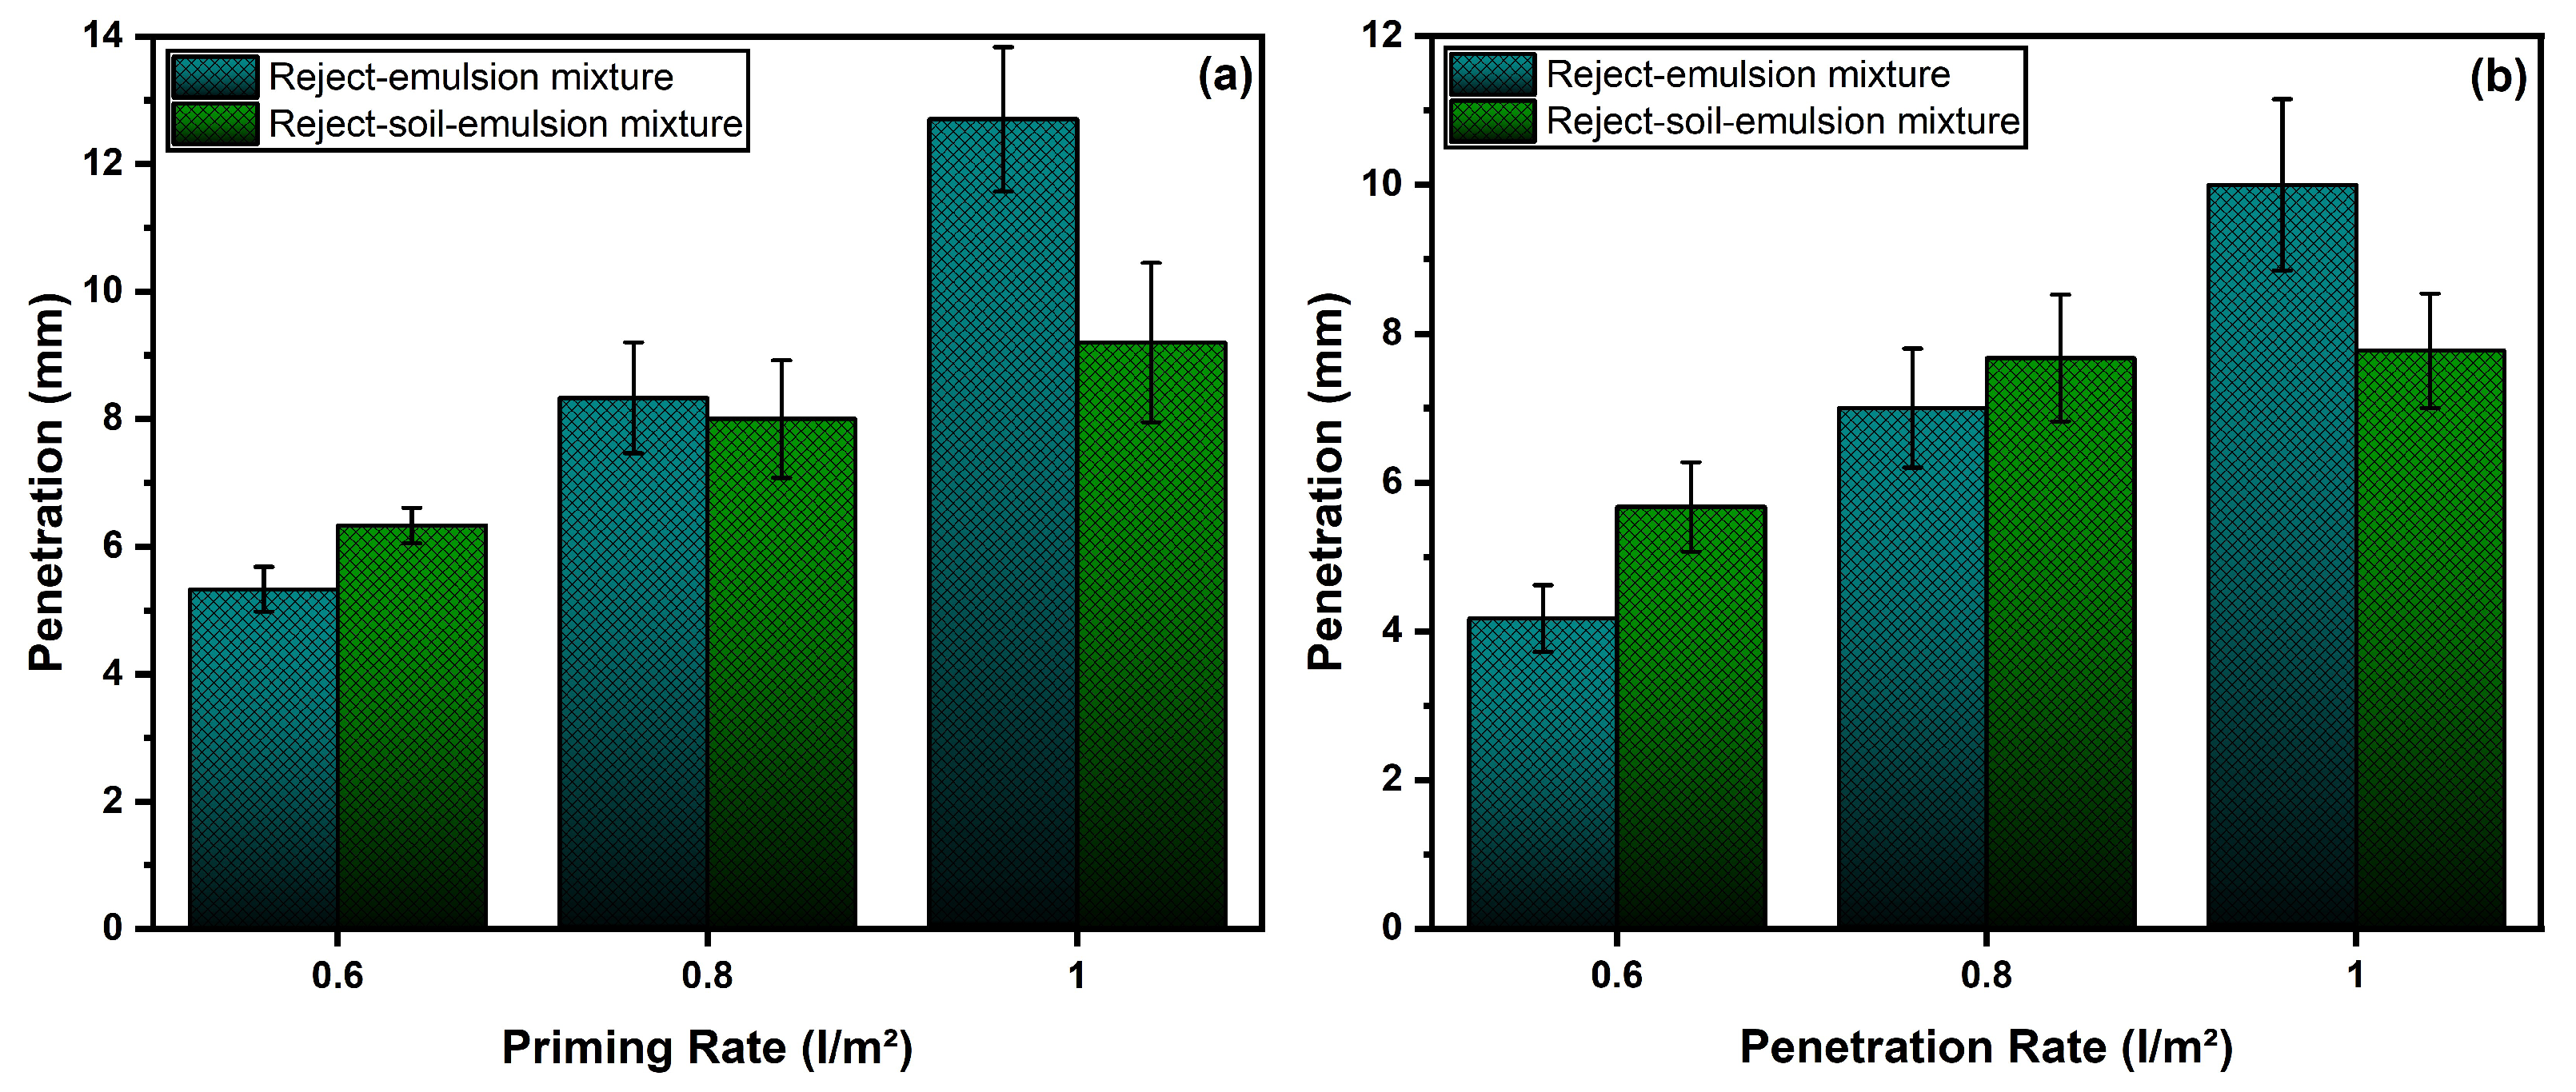
3.3. Verificação da Imprimação

Figure 11 shows the appearance of the compacted samples and primed with conventional emulsions type RL-1C and RM-1C in the Marshall cylinder and close-up details of the primer applied, highlighting the occurrence of exudation, respectively.
As illustrated in the figures, in all situations, even when tested diluted and/or heated, the conventional slow-break or medium-break emulsions did not penetrate the reject–emulsion layer. It was observed that the use of conventional emulsions type RL-1C and RM-1C for priming the studied reject–emulsion mixture is not feasible. In this case, the results were discarded, and penetration measurement was not performed since it did not occur.
Similarly, samples primed with CM-30 were analyzed, and unlike the former, they performed well. Figure 12 shows some of the samples of the reject–emulsion mixture after priming with CM-30 as expected after 72 h of breaking the primer, and after longitudinal breaking for penetration measurement.
Observing the good interaction of the mixtures (reject–emulsion and reject–soil–emulsion) with CM-30, the penetration depth was measured using a caliper, with 3 measurements at central points of the specimen. The variation of CM-30 application rates tested (0.6 L/m2, 0.8 L/m2, and 1.0 L/m2), with and without heating, on asphalt penetrations can be seen in Figure 13.
In all analyzed samples, a greater penetration was observed in cases where CM-30 was not heated. According to previous studies conducted by Villibor [40], the average penetration values considered satisfactory range between 4 and 13mm. Additionally, according to guidelines established by the standard [41] for priming, the ideal application values range between 0.8 and 1.6 L/m2. These parameters are corroborated by the technical specification [42] for asphalt priming waterproofing, which indicates usual application rates in the range of 1.0 to 1.3 L/m2 when using medium-cure petroleum diluted asphalt on fine sandy soils.
Therefore, based on these references, the optimal application rate of 1.0 L/m2 was established as the most suitable for the priming process.

3.4. Surface Wear Verification

For both LWT and WTAT wear tests, duplicate specimens were prepared, and the primer application rate used was 1.0 L/m2 with CM-30 without heating as determined in the primer test.

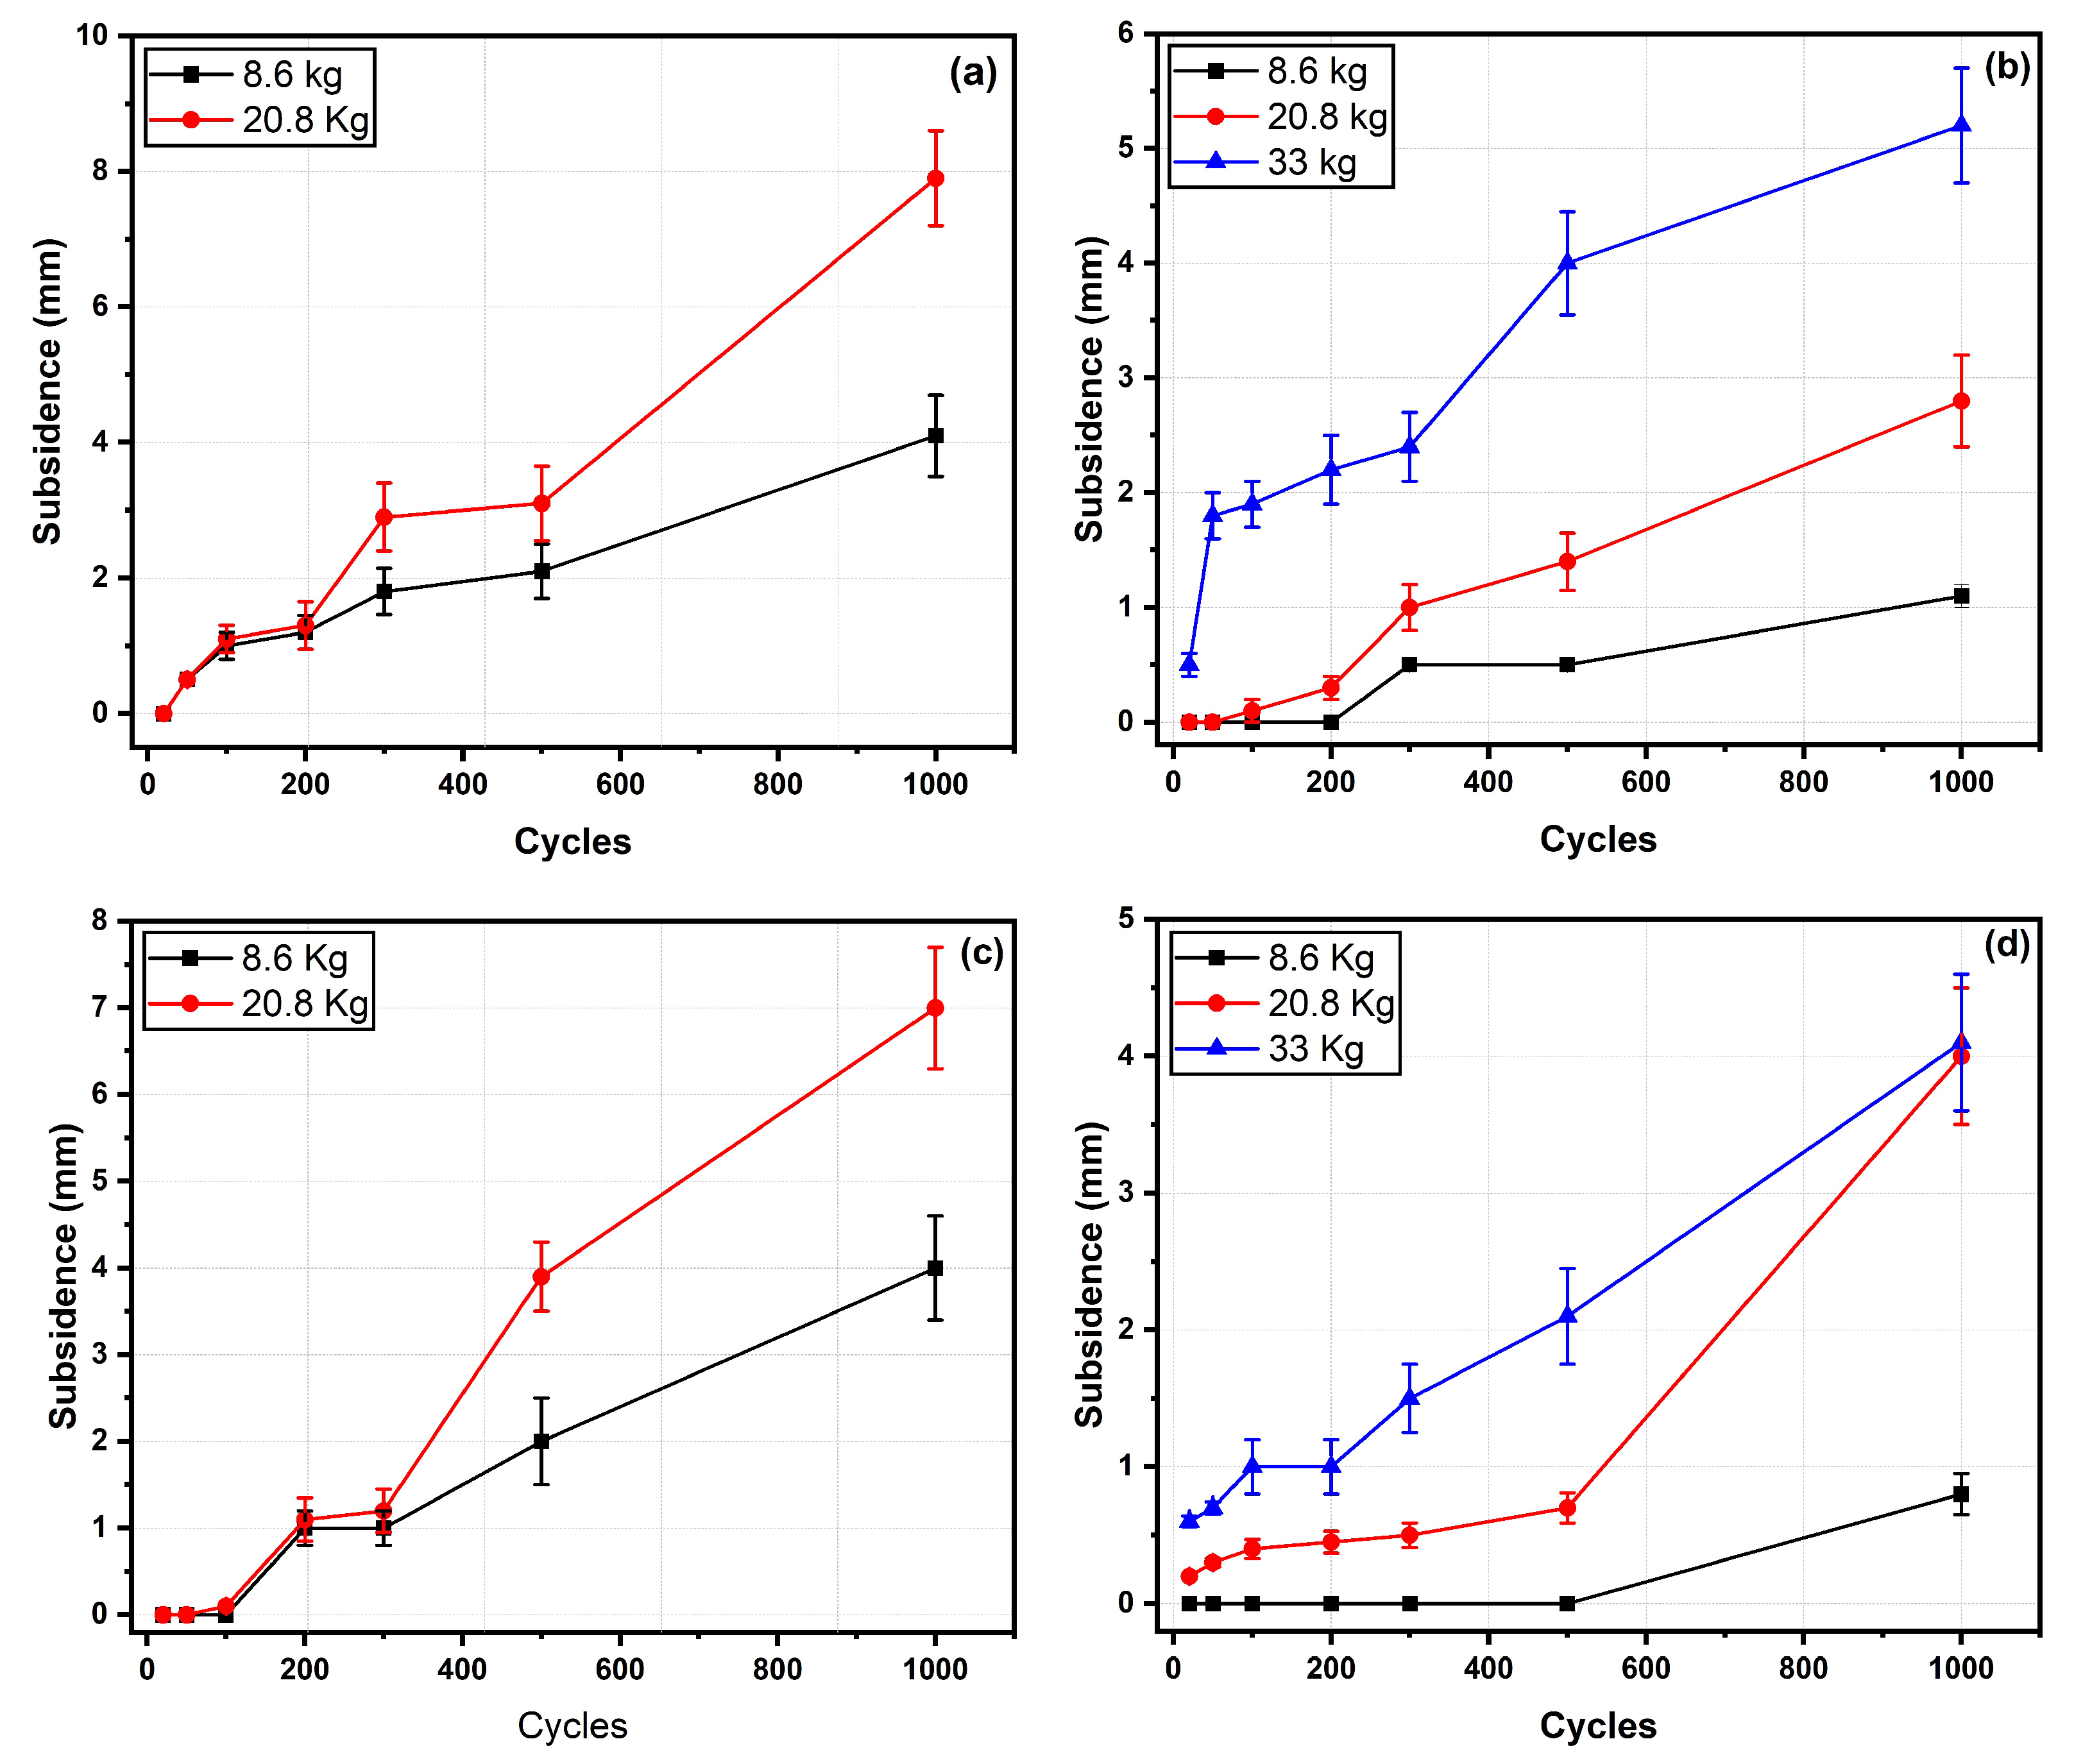
3.4.1. Loaded Wheel Test (LWT)

The results are presented separately for the two tested mixtures (reject–emulsion and reject–soil–emulsion), comparing the techniques used (emulsion stabilization and anti-dust treatment). Figure 14a presents the LWT results for bituminous stabilization, while Figure 14b shows the anti-dust treatment, both in mixtures with reject and 6% emulsion. Figure 14c,d represent the LWT results for bituminous stabilization and anti-dust treatment, respectively, in reject–soil–emulsion mixtures.
The criterion for stopping the test was established based on the occurrence of defects or the formation of significant depressions. Thus, the results indicate that the reject–emulsion sample withstood up to the second level of load (20.8 kg), while the mixture containing the anti-dust treatment endured until the third load increment. Therefore, the incorporation of the anti-dust treatment in the reject–emulsion mixture resulted in a superior capacity to withstand loads and load passage cycles before defects were observed.
With the application of a load of 33 kg, the mixture with the anti-dust treatment reached a deformation of 5.3 mm, while for the stabilized mixture (reject–emulsion), defects appeared during the 20.8 kg load cycle with a much larger deformation (7.76 mm).
Similar to observations in reject–emulsion mixtures, the performance of reject–soil–emulsion mixtures also showed significant improvements when the anti-dust treatment was used (see Figure 14c,d). Notably, at the third load increment (33 kg), the specimens with the anti-dust treatment recorded a sinking of 4.16 mm. In contrast, for reject–soil–emulsion stabilization, a higher sinking (6.99 mm) was observed only after the second load increment.
In both mixtures analyzed, it was evident that the addition of the anti-dust layer exerted a significant influence on the deformation and sinking behavior of the wheel tracks, providing greater resistance to the sandy reject layer.
Therefore, considering the adopted criteria and performance attributes, the mixtures incorporating the anti-dust treatment presented the best results and were able to withstand higher loads. Both for stabilization with 6% emulsion and for the content of 2% emulsion with the addition of 10% soil, these mixtures demonstrated a behavior classified as “Good” according to the LWT test qualification parameters. On a 20-point scale, they scored 16, characterized by limited occurrence of defects, formation of ridges without plate detachment, and deformation within the range of 4 to 6 mm.

3.4.2. Wet Track Abrasion Test (WTAT)

The analysis and interpretation of the results were conducted by evaluating the performance of the specimens in three distinct ways: qualitative assessment of the specimen, measurement of vertical permanent deformation by calculating the difference between the initial and final average heights, and determination of abrasion loss from the difference between the initial and final masses.
Overall, the tested specimens showed satisfactory results for both the anti-dust treatment and the reject–emulsion stabilization analysis. Figure 15 illustrates the appearance of the specimens for the two analyzed techniques after the 300 s cycle as anticipated.
It was observed that in the specimens subjected to the anti-dust treatment, a slight disaggregation occurred, while in the reject–emulsion stabilization, where only the primer was applied, the shiny appearance of the specimen suggests signs of the beginning of the exudation process, although discreetly.
Considering the favorable results obtained, a second stage of the test was conducted, consisting of another 300 s cycle under the same conditions provided during the first cycle. Figure 16 shows the appearance of the specimens after this second cycle.
After a second test cycle, the first visible defects appeared on the specimens. While the specimens subjected to the anti-dust treatment remained virtually intact, the specimens tested for reject–emulsion stabilization, properly primed, exhibited evident defects, leading to the interruption of the test.
The results of abrasion loss, derived from the WTAT tests for the studied mixtures, are presented in Table 7. It is important to note that the tests were conducted in duplicate, and the results presented refer to the first 300 s of testing.
Analyzing Table 7, it is observed that in all cases, there was good performance regarding the wear of the surface layer of the specimens. In all cases, the mass loss was less than 2%, being slightly higher in the reject–emulsion mixtures, evidencing that the anti-dust layer provides greater durability when compared to reject–emulsion mixtures that are only primed.
According to the evaluation criteria proposed in this study, the mixtures exhibited a behavior classified as “Very Good”. Similarly, the evaluation of vertical permanent deformation also obtained a “Very Good” classification. The values obtained for this parameter were minimal, with their measurement considered irrelevant, since the specimens showed little or no deformation.
The visual observations of performance, coupled with the analysis of vertical permanent deformation and the determination of mass loss due to abrasion, lead to the conclusion that the reject–emulsion mixtures, whether primed or subjected to the formation of the anti-dust layer, exhibit excellent performance in terms of durability and wear resistance, simulating traffic action through the WTAT test.
Furthermore, the effectiveness of the layer formed by the anti-dust treatment was confirmed, where the material for salting was adequately absorbed by the emulsion through capillarity, forming a thin layer that, through the test, performs the intended function.

4. Summary and Conclusions

In this research, the use of iron ore waste as a stabilizing material and the application of the anti-dust treatment technique were investigated. The main objective was to evaluate the resistance of reject–emulsion and reject–soil–emulsion mixtures through durability and wear tests (LWT and WTAT), using qualitative visual criteria for assessment.
Additionally, the study aimed to assess the feasibility of using the waste as a low-cost pavement technique due to the potential positive environmental impacts associated.
The following are the main summarized conclusions:
1.
The sandy tailings analyzed proved to be a viable alternative fine aggregate. Leaching tests showed values below the limits established by ABNT, indicating its suitability for iron mining.
2.
Although the mixtures did not withstand the maximum load in the LWT test, they performed well. The mixture with anti-dust treatment had less deformation (5.3 mm) compared to the stabilized one (7.76 mm) under a load of 33 kg. Similarly, the reject–soil–emulsion mixture treated with anti-dust showed less subsidence (4.16 mm) compared to the stabilized one (6.99 mm).
3.
In all cases, the mass loss was less than 2%, with the tailings–emulsion mixture showing slightly more loss. The anti-dust treatment provided greater durability compared to the primed mixtures alone.
4.
These mixtures are viable alternatives for low-traffic roads. The adaptations to the test procedures are effective for soil analysis, but it is necessary to discuss the maximum load and the relationship with the level of traffic. Further studies are needed to improve the prediction of permanent deformations, including correlations with dynamic triaxial tests and laboratory-field factors for better interpretation of the results.

Author Contributions

Conceptualization, V.L.S., L.M.C. and W.W.d.S.; methodology, V.L.S., L.M.C., W.W.d.S. and P.H.P.M.d.S.; software, L.M.C., W.W.d.S. and P.H.P.M.d.S.; formal analysis, S.N.M. and A.C.R.G.; investigation, V.L.S., L.M.C., W.W.d.S. and P.H.P.M.d.S.; resources, P.H.P.M.d.S.; data curation, S.N.M. and A.C.R.G.; writing-original draft preparation, L.M.C., W.W.d.S. and P.H.P.M.d.S.; writing-review and editing, L.M.C., W.W.d.S., P.H.P.M.d.S. and S.N.M.; supervision, A.C.R.G.; project administration, A.C.R.G.; funding acquisition, S.N.M. All authors have read and agreed to the published version of the manuscript.

Funding

This study was financed in part by the Coordenação de Aperfeiçoamento de Pessoal de Nível Superior-Brasil (CAPES)—Finance Code 001.

Institutional Review Board Statement

Not applicable.

Informed Consent Statement

Not applicable.

Data Availability Statement

The data presented in this study are available on request from the corresponding author.

Acknowledgments

The authors would like to thank SAMARCO Mineração S.A., located in the municipality of Mariana-MG, for supplying the material for the study.

Conflicts of Interest

The authors declare no conflicts of interest.

References

  1. Ghale, S.R.; Pataskar, S.V. Comparison of Cold Mix and Hot Mix Asphalt. Int. J. Eng. Res. Mech. Civ. Eng. Special Issue 2021, 118–121. [Google Scholar]
  2. Trunzo, G.; Moretti, L.; D’Andrea, A. Life cycle analysis of road construction and use. Sustainability 2019, 11, 377. [Google Scholar] [CrossRef]
  3. Martins, A.S.; Cunha, D.B.C.; Nascimento, M.d.V. Unpaved rural roads: Evaluation of trafficability conditions in a stretch contained within a community in the Sertão of Pernambuco, Brazil. Res. Soc. Dev. 2020, 9, e4409108652. [Google Scholar] [CrossRef]
  4. de Oliveira, J.F.; Griebeler, N.P.; Correchel, V.; da Silva, V.C. Erodibility and critical shear stress in unpaved road soils. Braz. J. Agric. Environ. Eng. 2009, 13, 955–960. [Google Scholar]
  5. National Confederation of Transport: SEST SENAT, Brasília. CNT Road Research 2022; National Confederation of Transport: Brasília, Brazil, 2022. [Google Scholar]
  6. Sousa, M.A.S.; Guimarães, A.C.R.; Castro, C.D. Geotechnical and resilient characteristics of slope soils along the route of the Carajás Railway for use in transportation infrastructure. Geosul 2021, 36, 119–144. [Google Scholar] [CrossRef]
  7. Rodrigues, P.M.B.; Dantas Neto, S.A.; Babadopulos, L.F.d.A.L. Evaluation of the shear behavior of soil-emulsion mixtures with emulsion contents ranging from 16% to 28% by mass. Matéria 2023, 28, e20230062. [Google Scholar]
  8. Fernandes, L.F.; Souza, B.M.M.d.; Neto, O.d.F.; França, F.A.N.; Júnior, O.F.d.S. Sandy soil stabilization with asphalt emulsion for paving purposes. Res. Soc. Dev. 2022, 11, e0711124274. [Google Scholar] [CrossRef]
  9. Félix, A.S.; Neto, J.A.G.; Medeiros, B.L.A.V.; Barbosa, N.P.; Costa, L.F.; Medeiros, L.E.L. Alkaline stabilization of Kaolinitic soils for Adobe production. Braz. J. Dev. 2022, 8, 46839–46851. [Google Scholar] [CrossRef]
  10. Ahmad, A.; Sutanto, M.H.; Ahmad, N.R.; Khan, M.A.; Wahab, A.; Sapar, N.I.F.; Hashir, M. Feasibility of bituminous stabilizer in the stabilization of problematic soil: An overview on the non-traditional soil additive. AIP Conf. Proc. 2023, 2688, 040012. [Google Scholar] [CrossRef]
  11. Andavan, S.; Kumar, B.M. Case study on soil stabilization by using bitumen emulsions—A review. Mater. Today Proc. 2020, 22, 1200–1202. [Google Scholar] [CrossRef]
  12. Abiola, O.S.; Wilson, R.; Barnard, A.; Hattingh, S.K.; Kupolati, W.; Odunfa, S.O. Avaliação da emulsão de cimento e betume nas características de resistência do solo granular nativo da África do Sul como material básico do curso. FUOYE J. Eng. Technol. 2019. [Google Scholar] [CrossRef]
  13. Jin, D.; Wang, J.; You, L.; Ge, D.; Liu, C.; Liu, H.; You, Z. Waste cathode-ray-tube glass powder modified asphalt materials: Preparation and characterization. J. Clean. Prod. 2021, 314, 127949. [Google Scholar] [CrossRef]
  14. Jin, D.; Boateng, K.A.; Chen, S.; Xin, K.; You, Z. Comparison of rubber asphalt with polymer asphalt under long-term aging conditions in Michigan. Sustainability 2022, 14, 10987. [Google Scholar] [CrossRef]
  15. Jin, D.; Yin, L.; Xin, K.; You, Z. Comparison of asphalt emulsion-based chip seal and hot rubber asphalt-based chip seal. Case Stud. Constr. Mater. 2023, 18, e02175. [Google Scholar] [CrossRef]
  16. Jin, D.; Yin, L.; Malburg, L.; You, Z. Laboratory evaluation and field demonstration of cold in-place recycling asphalt mixture in Michigan low-volume road. Case Stud. Constr. Mater. 2024, 20, e02923. [Google Scholar] [CrossRef]
  17. Enayatizamir, N.; Landi, A.; Ghafari, H.; Mokfi, M. Wind erodibility and dust (PM10) emission control in two different soil textures using microbial inoculation and sugarcane bagasse application. Arab. J. Geosci. 2022, 15, 1097. [Google Scholar] [CrossRef]
  18. Zhang, M.; Wang, R.; Liu, F.; Xu, P. Anti-wind erosion and anti-dust mechanisms of microbial consolidation of bare soil. Environ. Earth Sci. 2021, 80, 705. [Google Scholar] [CrossRef]
  19. Baziar, M.; Sanaie, M.; Amirabadi, O. Mitigation of Dust Emissions of Silty Sand Induced by Wind Erosion Using Natural Soybean Biomaterial. Int. J. Civ. Eng. 2021, 19, 595–606. [Google Scholar] [CrossRef]
  20. DNER-ME 083; Aggregates—Granulometric Analysis. DNER—National Department of Road Transportation: Rio de Janeiro, Brazil, 1998.
  21. ISO 13320; Particle Size Analysis—Laser Diffraction Methods. International Organization for Standardization: Geneva, Switzerland, 2009.
  22. DNER-ME 162; Soils—Compaction Tests Using Worked Samples. DNER—National Department of Road Transportation: Rio de Janeiro, Brazil, 1994.
  23. DNER-ME 054; Sand Equivalent. DNER—National Department of Road Transportation: Rio de Janeiro, Brazil, 1997.
  24. DNER-ME 084; Fine Aggregate—Determination of Real Density. DNER—National Department of Road Transportation: Rio de Janeiro, Brazil, 1995.
  25. DNER-ME 082; Determination of Plastic Limit. DNER—National Department of Road Transportation: Rio de Janeiro, Brazil, 1994.
  26. DNER-ME 122; Determination of Liquid Limit of Soils—Reference Method and Expedited Method. DNER—National Department of Road Transportation: Rio de Janeiro, Brazil, 1994.
  27. AASHTO PP 64-10; Standard Method for Determining Aggregate Source Shape Values from Digital Image Analysis Shape Properties. AASHTO: Washington, DC, USA, 2010.
  28. AASHTO TP 81-10; Standard Method of Test for Determining Aggregate Shape Properties by Means of Digital Image Analysis. AASHTO: Washington, DC, USA, 2010.
  29. Brazilian Association of Asphalt Distribution Companies (ABEDA). Basic Manual of Asphalt Emulsions, 2nd ed.; ABEDA: Rio de Janeiro, Brazil, 2001. [Google Scholar]
  30. NBR 1484; Road Freight Transport—Management and Quality Systems. ABNT: Rio de Janeiro, Brazil, 2022.
  31. NBR 14746; Cold Microsurfacing and Asphalt Slurry—Determination of Loss by Wet Abrasion (WTAT). ABNT: Rio de Janeiro, Brazil, 2014.
  32. NBR 10004; Solid Waste—Classification. ABNT: Rio de Janeiro, Brazil, 2004.
  33. Jahn, R.; Blume, H.P.; Asio, V.; Spaargaren, O.; Schad, P. Guidelines for the Description of Soil Colours, 4th ed.; Langohr, R., Brinkman, R., Nachtergaele, F.O., Krasilnikov, R.P., Eds.; Food and Agriculture Organization of the United Nations: Rome, Italy, 2006. [Google Scholar]
  34. AASHTO M 145-91 (2021); Standard Specifications for Transportation Materials and Methods of Sampling and Testing and Provisional Standards. American Association of State Highway and Transportation Officials: Washington, DC, USA, 2021.
  35. DNIT 259/2023; CLA Soils-Classification of Tropical Fine Soils for Road Purposes Using Compacted Specimens in Miniature Equipment—Classification. DNIT—National Department of Transport Infrastructure: Brasília, Brazil, 2023.
  36. Nogami, J.S.; Villibor, D.F. Low-Cost Paving with Lateritic Soils; Vilibor: São Paulo, Brazil, 1995. [Google Scholar]
  37. DNIT Standard 443/2023; ME Pavimentação—Soils—Compaction Test Using Tripartite Molds—Test Method. DNIT—National Department of Transport Infrastructure: Brasília, Brazil, 2023.
  38. Apaza, F.R.; Guimarães, A.C.R.; Sousa, M.A.d.S.; Castro, C.D. Study on the use of Iron Ore Residue in asphalt microsurfacing. Revista Transportes, 31 August 2016. [Google Scholar]
  39. Nunna, V.; Hapugoda, S.; Pownceby, M.; Sparrow, G. Beneficiation of low-grade, goethite-rich iron ore using microwave-assisted magnetizing roasting. Miner. Eng. 2021, 166, 106826. [Google Scholar] [CrossRef]
  40. Villibor, D.F. Economic Pavements—New Considerations. Ph.D. Thesis, School of Engineering of São Carlos, University of São Paulo, São Paulo, Brazil, 1981. [Google Scholar]
  41. DNER ES 306; Pavement—Priming. DNER-National Department of Road Transportation: Rio de Janeiro, Brazil, 1997.
  42. ET-DEPOO/019; Secretariat of Transportation—Department of Roadways. Bituminous Waterproofing Primer: São Paulo, Brazil, 1997.
Figure 1. Geographical location of the area where the sandy material was extracted.
Sustainability 16 05570 g001
Figure 2. Flowchart of the experimental procedure for the study.
Sustainability 16 05570 g002
Figure 3. LWT equipment testing at the IME soil laboratory: (A) digital controller (on/off, reset, displays cycles on the screen, etc.); (B) electric motor; (C) rotating speed reducer box with a cycle counter switch; (D) rotating arm; (E) horizontal arm; (F) traffic wheel; (G) place to accommodate the load (max. 56 kg); (H) lever to lift the arm and the load; (I) positioning location (track) of the test specimen and the clamps holding its support; (J) electric cable for the motor and cycle counter switch; and (K) track space (30 cm) traveled by the wheel.
Sustainability 16 05570 g003
Figure 4. Procedures for WTAT test: (a) compaction with the Marshall compaction hammer; (b) mixing reject emulsion after being compacted and primed; (c) sample for anti-dust treatment immediately after application of the second emulsion bath and reject as salting; (d) test in progress.
Sustainability 16 05570 g004
Figure 5. Particle size distribution of the studied iron ore reject, showing the proportion of different particle sizes within the sample.
Sustainability 16 05570 g005
Figure 6. Laser diffraction particle size distribution curve.
Sustainability 16 05570 g006
Figure 7. Yellow sandy soil sample.
Sustainability 16 05570 g007
Figure 8. Scanning electron microscopy (SEM) images of reject powders at different magnifications: (a) 100×, showing the overall particle distribution; (b) 1000×, highlighting the detailed morphology of the particles.
Sustainability 16 05570 g008
Figure 9. Energy-dispersive X-ray (EDX) analysis of reject powders, showing the elemental composition with peaks corresponding.
Sustainability 16 05570 g009
Figure 10. XRD diffractogram of reject powder.
Sustainability 16 05570 g010
Figure 11. Samples of reject–emulsion primed with conventional emulsions type RL-1C and RM-1C. (a) Primed specimen before extraction; (b) Extracted specimen with formation of asphalt film on the surface.
Sustainability 16 05570 g011
Figure 12. Samples of reject–emulsion and reject–soil–emulsion primed with CM-30.
Sustainability 16 05570 g012
Figure 13. Penetration values of the primer in samples of reject–emulsion and reject–soil–emulsion: (a) without heating of CM-30; (b) with heating of CM-30.
Sustainability 16 05570 g013
Figure 14. LWT test results. (a) Bituminous stabilization and reject–emulsion mixture; (b) anti-dust treatment and reject–emulsion mixture; (c) bituminous stabilization and reject–soil–emulsion mixture; (d) anti-dust treatment and reject–soil–emulsion mixture.
Sustainability 16 05570 g014
Figure 15. Appearance of the specimens for the anti-dust treatment (a) and for the reject–emulsion stabilization (b) after the end of a 300 s cycle of the WTAT test.
Sustainability 16 05570 g015
Figure 16. Appearance of the specimens for the anti-dust treatment (a) and for the reject–emulsion stabilization (b), where signs of primer layer detachment can be observed, after the end of two cycles of 300 s of the WTAT test.
Sustainability 16 05570 g016
Table 1. Assessment of pavement surface conditions and LWT test qualification.
RatingVisual ObservationsSinking (mm)
Primed Base (Soil–Emulsion)Anti-Dust Treatment
10No defects, minimal wear,
absence of exudation,
detachment less than 20%
for anti-dust
<2.0<4.0
8Few defects, detachment
up to 40% for primed base
or detachment up to 50% for
anti-dust, slight exudation,
appearance of ridges without
plate detachment
2.0–4.04.0–6.0
5Detachment above 40%
for primed base or above
50% for anti-dust, detachment
in joints, exudation,
appearance of ridges with
plate detachment
4.0–6.06.0–10.0
0Total destruction>6.0>10.0
LWT Test Qualification
ConceptRating
Excellent18 to 20
Good15 to 17
Poor8 to 14
Very Poor0 to 7
Table 2. Assessment of pavement surface conditions and WTAT test qualification.
GradeVisual ObservationsDetachment (mm)
Primed Base (Soil–Emulsion)Anti-Dust Treatment
28 to 30Detachment up to 20% for
ADT study and up to 10% for
study of a primed base,
both with absence of exudation.
<30 for ADT, and
<5 for primed
base.
<2.0 for ADT, and
<0.5 for primed
base.
23 to 27Detachment from 20 to 50% for
ADT study and from 10 to 20% for
study of a primed base,
both with slight exudation.
30 to 50 for
ADT, and 5 to 10
for primed
base.
2.0 to 3.0 for
ADT, and 0.5 to 1.0
for primed
base.
16 to 22Detachment from 50 to 80% and/or
exudation for ADT study and from
20 to 50% and/or exudation for
study of a primed base.
50 to 80 for
ADT, and 10 to 20
for primed
base.
3.0 to 4.0 for
ADT, and 1.0 to 1.5
for primed
base.
0 to 15Detachment greater than 80% and/or
exudation for ADT study and
greater than 50% and/or exudation
for study of a primed base.
>80 for ADT, and
>20 for primed
base.
>4.0 for ADT, and
>1.5 for primed
base.
WTAT Test Qualification
ConceptGrade
Very Good28 to 30
Good23 to 27
Poor16 to 22
Very Poor0 to 15
Table 3. Results for AIMS test.
PropertyReject (% of Particles)
Shape IndexCircular17.2
Semi-circular35.1
Semi-elongated37.5
Elongated10.2
No. of particles901
Standard Deviation2
CV%25.97
ClassificationSemi-elongated
AngularityRounded52.1
Sub-rounded37.6
Sub-angular10.1
Angular1.2
No. of particles989
Standard Deviation1035.7
CV%32.36
ClassificationRounded
Table 4. Soil characterization.
Composition (%)Consistency
Indices (%)
Classification
SoilClaySiltSandGravelLLPLHRBSUCSMCT
412534026.220.5A-4ML-CLNA’
Table 5. Compaction table.
Optimum Moisture
Content (%)
Maximum Dry
Bulk Specific Gravity (g/cm3)
Real Grain Density (g/cm3)
14.801.742.65
Table 6. Chemical analysis of mining reject by XRF.
Oxidewt.%
Loss on Ignition0.43
SiO288.88
Al2O30.34
Fe2O39.46
CaO0.55
MgO0.07
SO30.08
Na2O0.02
K2O0.01
Table 7. WTAT tests for the studied mixtures.
WTAT Test—Abrasion Loss (%)
Treatment/MixtureMixture + Mold Weight (g)
BeforeAfterAbrasion Loss(%)
anti-dust treatment6% emulsion11,135.5
11,006.4
11,128
11,000.1
7.5
6.3
0.07
0.06
2% emulsion
and 10% soil
10,940
10,183.9
10,878
10,153.5
62
30.4
0.57
0.30
Stabilization
reject–emulsion
6% emulsion10,923.3
10,560.8
10,758.7
10,433.4
164.6
127.4
1.51
1.21
2% emulsion
and 10% soil
10,176
10,254
10,061.2
10,123.4
114.8
130.6
1.12
1.27
Disclaimer/Publisher’s Note: The statements, opinions and data contained in all publications are solely those of the individual author(s) and contributor(s) and not of MDPI and/or the editor(s). MDPI and/or the editor(s) disclaim responsibility for any injury to people or property resulting from any ideas, methods, instructions or products referred to in the content.

