Abstract
As one of the most rapidly developing provinces in China in the past two decades, Anhui Province has seen an increasing demand for clean energy in recent years due to industrial transformation and the requirements of dual carbon targets. This paper opts to investigate roof-mounted distributed photovoltaics, which are more suitable for development in densely populated areas. Current research on distributed photovoltaics largely focuses on vague estimations of power generation potential, without adequately considering the specific development conditions of different regions. This paper starts from the actual situation affecting the development of roof-mounted distributed photovoltaics and selects a smaller number of factors that are more in line with reality for hierarchical analysis, constructing a relatively simple but practical evaluation system (“meteorological-geographical-socio-economic”). At the same time, this paper innovatively proposes different schemes for the full lifecycle power generation and emission reduction benefits of roof-mounted distributed photovoltaics and compares them, providing a foundation for subsequent in-depth research. Key findings include the following: The northern regions of Anhui Province exhibit higher suitability for rooftop distributed PV, with residential areas being the primary influencing factor, followed by solar radiation considerations; the annual power generation potential of rooftop distributed PV in Anhui Province constitutes around 80% of the total electricity consumption in 2021, but the potential is predominantly concentrated in rural areas, resulting in spatial disparities in power generation and consumption across the province; developing the rooftop distributed PV industry based on suitability can yield substantial power generation and emission reduction benefits, translating to an estimated reduction of approximately 1.28 × 10⁸ tCO2 annually, representing around one-third of Anhui Province’s carbon emissions in 2021.
1. Introduction
In recent years, the relentless increase in global temperatures has indirectly or directly led to a variety of natural disasters. The greenhouse effect, primarily driven by gases like carbon dioxide, has irreversible impacts on human activities, life, and ecosystems [1]. The global climate crisis prompted the International Energy Agency (IEA) to release the “Global Energy Industry 2050 Net-Zero Emissions Roadmap” in 2021, aiming for net-zero energy-related carbon dioxide emissions by 2050 [2]. As the energy sector contributes approximately three-quarters of current greenhouse gas emissions, the depletion of traditional energy sources, such as petroleum and coal, raises concerns about climate warming and air pollution [3]. Strengthening decarbonization of the energy sector and the development of renewable energy sources is imperative [4,5,6]. Developing new energy, particularly solar energy, is crucial for achieving global carbon neutrality due to its cleanliness, environmental friendliness, sustainability, and long-term potential [7]. Among many new energy sources, solar energy is considered to be one of the most promising energy sources due to its advantages such as cleanliness, environmental protection, sustainability, and long-term use [8].
China has a vast territory and abundant terrestrial solar energy resources. The western and northern regions of China boast longer periods of sunlight, higher levels of solar radiation stability, and a greater number of effective sunny days. These characteristics endow these areas with more advantageous solar energy resources when compared to the southeastern and coastal regions of China [9,10,11,12]. Some scholars have evaluated the solar energy resources in local areas [13,14,15,16,17,18]. In addition to these studies, other scholars have conducted research on the conversion of solar energy into thermal energy [19,20]. To harness solar energy effectively, it is essential to assess the suitability of regional photovoltaic development. The northwest region, with low population density and ample solar resources, holds significant potential for large-scale solar photovoltaic development, followed by regions like southwest China and north China. Other regions face natural challenges such as low latitude, high cloud cover, abundant precipitation, and limited sunlight, all of which are detrimental to the development of the photovoltaic industry [21,22]. Previous studies have assessed the climate and spatial suitability for large-scale centralized photovoltaic development in specific regions [23,24,25,26]. Bao et al. used the spatial principal component analysis (SPCA) method to assess the potential and emission reduction benefits of centralized photovoltaic (PV) power generation in Xinjiang [27], while Zhang and Ma et al. used remote sensing to study the siting problem of centralized photovoltaic power plants [22,23]. At present, most of the research on distributed photovoltaics focuses on economic benefits and related technologies [24,25,26,27,28,29,30,31]. Researchers including Liu have amalgamated diverse datasets to formulate models for assessing the power output of rooftop solar photovoltaic systems [32,33,34]. Other academics, such as Li and Luca Bergamasco, have employed alternative approaches to determine the extent of rooftop areas suitable for photovoltaic installation [35,36]. Existing studies lack analyses that reveal the theoretical benefits of distributed PV and the potential for carbon reduction based on the results of suitability assessments.
Anhui Province is one of the most rapidly developing provinces in China in recent years, and its development process in the past two decades is very similar to China’s development. Looking at geographical conditions and economic and social conditions as a whole, the differences between the north and the south of Anhui are similar to the differences between the north and the south of China. It is also a key player in China’s photovoltaic module production, boasting a cumulative grid-connected photovoltaic capacity of 2.15 × 10⁷ kW by the end of 2022 (including 1.06 × 10⁷ kW of centralized photovoltaics and 1.09 × 10⁷ kW of distributed photovoltaics), securing the sixth position nationally. The economic landscape and the photovoltaic industry in the region exhibit substantial potential for further development. Therefore, Anhui Province was selected as the research area to analyze how to coordinate the development of the distributed photovoltaic industry in this area and calculate how much contribution that the carbon emission reduction brought by photovoltaic industry can make to carbon neutrality of this area and China. This will provide a reference for the study of distributed photovoltaic development in China and other similar regions of the world.
Previous studies have predominantly focused on the site selection and power generation potential of centralized photovoltaic power stations, primarily targeting areas with sparse populations [27,28,29,30,31,32,33,34]. This paper opts to investigate roof-mounted distributed photovoltaics, which are more suitable for development in densely populated areas, thereby broadening the horizons for the development of photovoltaics. While there have been studies on distributed photovoltaics, they have largely centered on vague estimations of potential power generation and the use of GIS technology to extract all available areas [35,36,37]. The specific development conditions of different regions have not been fully considered in the assessments, and few papers have discussed the full lifecycle development plans and the estimation of power generation and emission reduction benefits of distributed PV. This paper starts from the actual situation affecting the development of roof-mounted distributed photovoltaics and selects a smaller number of factors that are more in line with reality for hierarchical analysis, constructing a relatively simple but practical evaluation system. At the same time, this paper innovatively proposes different schemes for the full lifecycle power generation and emission reduction benefits of roof-mounted distributed photovoltaics and compares them, providing a foundation for subsequent in-depth research. It is hoped that this can address the division of regional suitability for the development of distributed photovoltaics and fill the gap in the overall theoretical literature on the overall development process.
2. Methodology
2.1. Materials
2.1.1. Overview of the Study Area
Anhui Province, situated in East China along the middle and lower reaches of the Huaihe River, spans 139,400 square kilometers, constituting 1.45% of China’s total land area. The topography encompasses plains, hills, and mountains, leading to the classification of the province into five geomorphological regions: Huaihe plain area, Jianghuai platform hilly area, western Anhui hilly mountain area, riverside plain area, and southern Anhui hilly and mountainous area, contributing 30.48%, 17.56%, 9.99%, 24.91%, and 16.70% to the province’s total area, respectively. Administering 16 prefecture-level cities, Anhui Province had a permanent population of 61.27 million as of the end of 2022, with 39.85% residing in rural areas. Notably, Anhui is a significant hub for agricultural production, energy, raw materials, and processing manufacturing in China.
2.1.2. Evaluation Method and Overall Process
Some scholars have utilized the multi-criteria decision making (MCDM) method to conduct research on photovoltaic construction [38,39], but this thesis aims to start from the actual situation affecting the development of roof-mounted distributed photovoltaics. It is necessary to select fewer but more practical factors for hierarchical analysis to construct a relatively simple but practical evaluation system. This study selected five factors that are highly relevant to the development of roof-mounted distributed photovoltaics (these five factors can represent many other factors to some extent). Utilizing meteorological, geographical, and socioeconomic data, this study employs the analytical hierarchy process (AHP) to establish a multi-dimensional assessment framework for “meteorology-geography-socioeconomics” to assess the suitability of rooftop distributed photovoltaic (PV) implementation in Anhui Province.
After determining the suitability of photovoltaic development in various prefecture-level cities of Anhui Province and selecting specific development methods, calculations for the power generation and emission reduction over the entire lifecycle are to be conducted on such a foundation. Additionally, considering the full life cycle component attenuation of photovoltaic systems and power system emission factors, the study assesses the long-term emission reduction advantages of rooftop distributed PV in the context of “carbon peaking and carbon neutrality”.
2.2. Suitability Factors and Technical Parameters
2.2.1. Reasonable Selection of Data Sources and Evaluation Indicators
The data in this study comprise meteorological, geographical, and socioeconomic information. Meteorological data consist of daily observations from 46 meteorological stations in Anhui Province and its surrounding areas spanning 1960 to 2020, sourced from the “China Meteorological Scientific Data Sharing Service Network” (https://docs.mlogcn.com (accessed on 1 September 2023)). Geographical data represent the average altitude of cities in Anhui Province. Social and economic data include land classification data from the third national land census data service platform and annual GDP per capita from the Anhui Province Statistical Yearbook.
Considering the characteristics of distributed photovoltaics, the multitude of restricted areas for cultivated land in Anhui Province, and the uneven economic development in the province, a comprehensive evaluation of regional suitability must integrate various influences. This can be categorized into three aspects:
Meteorological Factors: In this article, it is sunshine hours, through which the annual average solar radiation is calculated. Photovoltaic power generation is closely related to solar radiation and is the main indicator affecting the suitability of regional photovoltaic development. At the same time, the number of sunshine hours also affects the stability of photovoltaic output. Stable sunshine hours are of particularly important significance to the stability of power supply. The greater the total solar radiation and the higher the stability of solar radiation in an area, the higher the suitability for photovoltaic development here.
Cost Factors: These factors need to consider the local geographical environment and economic development level. That is to say, in terms of geographical environment, the vast plains are conducive to large-scale transportation, installation and maintenance of photovoltaics, while hilly and mountainous areas will increase investment costs. Therefore, based on the geographical conditions and characteristics of Anhui Province, we chose to evaluate the regional environmental suitability based on the average altitude of various places. In terms of economic development level, photovoltaic development is not only related to the realization of the goal of carbon peak carbon neutrality, but also a people’s livelihood project. Therefore, priority should be given to developing areas with relatively backward economic levels and providing them with more resource tilt. Per capita GDP can be a good indicator of the economic development of a region. That is, the lower the region’s per capita GDP, the more priority it needs to support the development of the photovoltaic industry.
Deployment Area: The area that can be deployed for photovoltaics is the most important factor affecting the development of photovoltaics. This article only considers rooftop distributed photovoltaics. Therefore, the larger the roof area of a residential area and the larger the area that can be deployed for photovoltaic development, the more suitable this area is for the development of rooftop distributed photovoltaics.
2.2.2. Suitability Assessment Method
The AHP was employed to assign weights to the five factors, determining their respective significance in the suitability evaluation [40]. Simultaneously, quantitative calculations were performed for the five factors influencing the development of rooftop distributed photovoltaics. Scores were then assigned based on the degree of impact on suitability. Specifically, higher scores were assigned for greater total solar radiation and larger residential roof areas, while lower scores were assigned for higher values of sunshine duration stability, regional average altitude, and per capita GDP. Finally, the weights of factors and the corresponding scores were combined and analyzed to assess the suitability of various cities in Anhui Province for the implementation of rooftop distributed photovoltaics. In this context, the weights of the factors are derived from the judgment matrix, where the pairwise comparison ratios within the matrix represent the relative degree of influence of each factor on suitability. These ratios are determined by expert scoring and previous research. Table 1 presents the judgment matrix for each factor constructed through the analytic hierarchy process.

Table 1.
Judgment matrix.
2.2.3. Solar Energy Resource Assessment
Ideal astronomical radiation serves as the basis for estimating total solar radiation. As per established research [37], the following formula is applied for the estimation:
Here, Q represents total solar radiation, Qn denotes astronomical radiation, and the units are MJ/m2. Coefficients and are empirical, with = 0.1538 and = 0.5372 based on previous research specific to Anhui Province [41]. S represents the sunshine percentage, which is the ratio of actual sunshine hours to potential (theoretical) sunshine hours.
The stability of sunshine hours is expressed by the ratio of the maximum value to the minimum value of the days with sunshine hours greater than 6 h in each month of the year.
day1, day2, …, day12, respectively, represent the number of days with more than 6 h of sunshine in each month from January to December. represents the stability of sunshine, where a lower value indicates higher stability of sunshine.
2.2.4. Estimation Method for Roof Distributed Photovoltaic Paving Area
In estimating the area where photovoltaics can be deployed, this study chose to use the third land survey data of the People’s Republic of China as the basis, and based on domestic urban and township planning and laws and regulations related to construction, using the following formula to estimate Anhui Roof area of residential areas in prefecture-level cities across the province.
where:
Sroof: The roof area (in 10 thousand hectares);
Scity, Svillage, Shamlet: the total land area of the city, village, and hamlet, respectively. It is derived from the third national land survey and uses 2021 data as a reference (in 10 thousand hectares).
Other parameter information is shown in Table 2.
Table 2.
Other relevant parameters for Equation (3).
2.3. Economic and Environmental Benefit Analysis
2.3.1. Ideal Power Generation Benefit Estimation Method
Based on the research on rooftop distributed photovoltaic power generation by Liu, Hu and others [32,34], and combined with current relevant technological advances, the rooftop distributed photovoltaic power generation potential of cities in Anhui Province is estimated. The formula for calculating annual photovoltaic power generation is as follows:
where
Hy: The annual effective power generation (kWh/a).
Table 3 provides additional parameter-related information and their values.
Table 3.
Other relevant parameters for Equation (4).
2.3.2. Methods for Estimating Carbon Reduction Benefits
For photovoltaic power generation projects, the main methodology used to calculate the carbon emission reduction effect is “Renewable Energy Grid-Connected Power Generation Methodology (Second Edition)” (CM-001-V02) [46]. The main concept is to build new photovoltaic power generation projects to replace the electricity generated by fossil energy-dominated power grids to achieve control and reduction in greenhouse gas emissions. The carbon reduction benefit of a photovoltaic project in a certain year can be calculated by the following formula.
where
: Emission reduction in a certain year (in T);
: After considering attenuation, Net grid-connected power generation of grid-connected power plant/generating unit projects in year y (in MWh/yr).
Other parameter information and values within the formula can be found in Table 4.
Table 4.
Other relevant parameters for Equation (5).
3. Results
3.1. Calculation Results of Factor Weights
Based on the judgment matrix presented in Table 1, the weights assigned to total solar radiation, sunshine stability, residential area, average altitude, and per capita GDP are 0.24, 0.17, 0.42, 0.07, and 0.1, respectively. Table 5 displays the matrix’s maximum characteristic root (λmax), which equals 5.307. With a consistency index (CI) of 0.077, a random index (RI) of 1.11 for (n = 5), the consistency ratio (CR) is calculated as CR = CI/RI = 0.069 < 0.1, indicating that the inconsistency of the matrix falls within the acceptable range. The consistency passes the significance test [35].
Table 5.
Consistency test results.
3.2. Analysis and Classification Results of Influencing Factors
The calculation of the weights shows that the size of the residential area and the total solar radiation have the greatest influence on the suitability. To investigate the pivotal factors influencing the suitability of regional photovoltaic development, we initially analyzed the computed results of solar radiation and residential roof area in Anhui Province. Subsequently, all factors influencing the suitability of rooftop distributed photovoltaics were categorized using the natural break point method [48]. The method refers to the process of arranging data in its natural order of magnitude and categorizing it accordingly.
3.2.1. Distribution of Solar Energy Resources
Analyzing 61 years of daily sunshine hours data from 46 national meteorological stations in and around Anhui Province, we assessed solar energy abundance in different locations. Employing GIS and the Kriging interpolation method [49], we generated the trend diagram for average annual solar radiation distribution across Anhui Province, depicted in Figure 1. The trend chart illustrates a general pattern of more solar radiation in northern Anhui, less in the south, and a relatively balanced distribution from east to west. Anhui Province can be categorized based on radiation levels into a high radiation area in the north, a low radiation area in the south, and a transition area in the center. Southern Anhui’s solar radiation distribution is notably influenced by terrain, particularly evident in southwestern Anhui, where it aligns with mountainous regions, notably in the Huangshan area with the lowest solar radiation. Conversely, northern Anhui, characterized by flat terrain, low altitude, and relatively stable weather conditions, experiences higher average annual solar radiation.
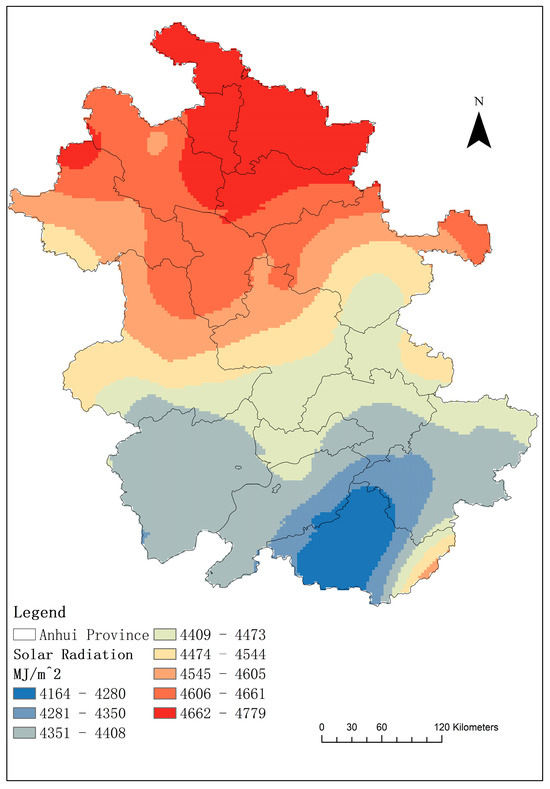
Figure 1.
Average annual solar radiation distribution trend.
In the “Solar Energy Resource Assessment Method” issued by the China Meteorological Administration, the solar energy resources in Anhui Province are assessed based on stability and utilization value [50]. The utilization value is determined by evaluating the number of days with annual average sunshine hours exceeding 6 h. An extremely long utilization period is defined when the days are greater than or equal to 280, very long between 280 and 240 days, and long if the days are less than 240. Stability is calculated using Formula (2), where K < 2 is considered stable, 2 ≤ K ≤ 4 is relatively stable, and K > 4 is unstable. This classification serves as the standard for assessing stability, with evaluation results presented in Table 6.
Table 6.
Usage period and stability.
The average annual number of days with more than 6 h of sunshine across all regions in Anhui Province ranges from greater than 160 to less than 240, indicating generally extended utilization periods. Suzhou City records the highest annual average of such days at 216. With the exception of Huangshan City, the stability of solar energy in all prefecture-level cities in Anhui Province falls within a relatively stable range.
3.2.2. Characteristics of Roof Area in Residential Areas
Residential roof area stands out as a key factor influencing the deployment of distributed photovoltaics across diverse locations. Table 7 displays the land area in cities, towns, and villages at various levels in Anhui Province. Fuyang City leads in total urban and village land area, while Huangshan City has the smallest total land area. The village land area order in each city aligns closely with the total area order. Villages contribute around 73% to the overall land area, with northern Anhui’s three cities, Lu’an, and Chuzhou having substantial residential areas, exceeding 80% in four cities. Except for Hefei, Wuhu, and Tongling, most prefectures and cities allocate the largest area to villages, followed by townships and urban areas, possibly linked to regional economic development. Hefei City, with superior economic development, maintains a notably higher proportion of urban area compared to other cities. Formula (3) is used to calculate the roof area that can be used for photovoltaic deployment in prefecture-level cities. These roof distribution patterns will affect the regional differences in the development of distributed photovoltaics in each city.
Table 7.
Land area table.
3.2.3. Factor Ranking Results
The five factors—total solar radiation, sunshine stability, residential area, average altitude, and per capita GDP—are systematically graded in this study. Scores ranging from 3 to 8 are assigned based on the actual conditions and calculation outcomes. An 8-point score signifies the highest level, while 3 points denote the lowest.
This research focuses on prefecture-level cities, assessing them comprehensively during factor assignment. For the evaluation of total solar radiation, results obtained after Kriging interpolation (Figure 1) are back-extracted. The average value acquired from prefecture-level cities is utilized to represent the city’s average annual total solar radiation. When assessing residential area, the provided data are computed as the overall average distribution within the city.
Table 8 and Table 9 present the standardized grading of factors, including total solar radiation, sunshine stability, residential area, average altitude, and per capita GDP. The results of factor grading are depicted in Figure 2.
Table 8.
Factor standardized grading (1).
Table 9.
Factor standardized grading (2).
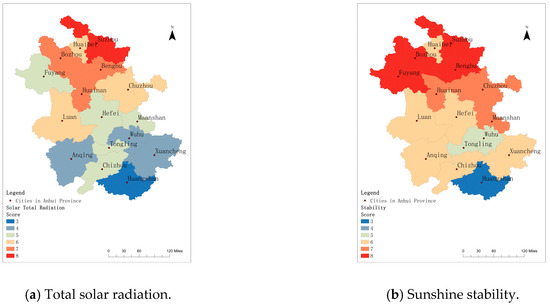
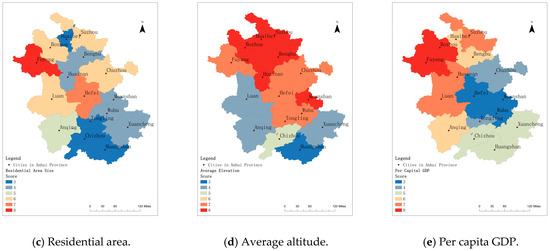
Figure 2.
Factor grading results.
3.3. Analysis of Suitability and Power Generation Potential of Rooftop Distributed Photovoltaic Development
3.3.1. Suitability Analysis
The weight analysis and factor classification results are amalgamated, leading to the delineation of three suitability zones: low (3–4.9), medium (4.9–5.95), and high (5.95–7.5). In the low-suitability zone, there are six prefecture-level cities, while the medium- and high-suitability zones encompass five prefecture-level cities.
Figure 3 illustrates the suitability classification, where red, orange, and yellow denote high, medium, and low suitability areas, respectively. Notably, with the exception of Huaibei, all low-suitability areas are situated in southern Anhui. This is attributed to the relatively limited habitable area and solar energy resources in cities in southern Anhui. Figure 4 illustrates the interrelationship between solar radiation levels and the distribution of suitable areas. Huaibei City falls into the low-suitable category mainly due to its small area and constrained roof space for photovoltaic installation. Conversely, northern Anhui and central Anhui exhibit predominantly medium-high suitability areas. Among them, the three cities in northern Anhui and the two cities in Lu’an and Chuzhou are highly suitable for distributed photovoltaic development owing to elevated solar radiation, relatively stable sunshine hours, and expansive residential areas. The residential areas suitable for photovoltaic installation in these highly suitable zones constitute nearly half of the province’s total residential area, thus offering substantial power generation potential for the province.
Figure 3.
Suitability grading chart.
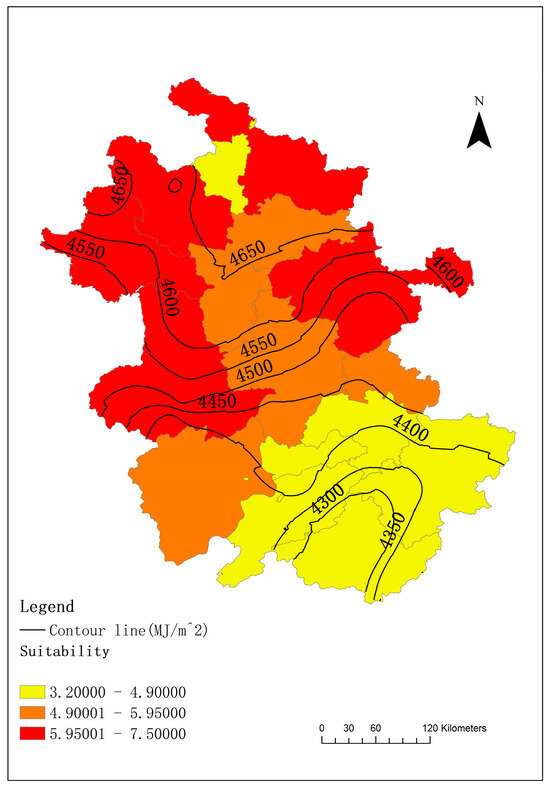
Figure 4.
Suitability and solar radiation relationship chart.
3.3.2. Power Generation Potential Analysis
By estimating the rooftop photovoltaic power generation potential in Anhui Province, it can be seen that when fully developed, the province’s annual power generation potential is approximately 2.15 × 10¹¹ kWh, accounting for approximately 80% of the total electricity consumption in Anhui Province in 2021. This value is consistent with in 2021, the electricity consumption of the entire industry in Anhui Province (2.28 × 10¹¹ kWh) is basically the same. The power generation potential of the high-suitability area is 1.05 × 10¹¹ kWh, accounting for about 50% of the province’s potential power generation that year. Medium and low suitability areas can provide about 30% and 20% of power generation respectively, which are 6.57 × 10¹⁰ kWh and 4.44 × 10¹⁰ kWh, respectively. Compared with centralized photovoltaics, rooftop distributed photovoltaics do not require additional land occupation if centralized photovoltaics are required to provide the same power generation capacity. The national average land density of photovoltaic power generation studied by Yang et al. is 0.027 m2/kWh [51], which means that approximately 5800 km2 of land needs to be utilized, which is equivalent to additional. It occupies 4% of the land area of Anhui Province, and Anhui Province is an important grain producing area in the country. It has strict restrictions on farmland protection and does not have too many large areas of high-quality land for the development of centralized photovoltaics. There is an expanse of 3.79 million square kilometers of land in China available for the construction of centralized photovoltaic (PV) power stations, which possess an annual power generation potential of 1.38 × 10¹⁴ kWh. Furthermore, as per the study by Zhang et al., the power generation potential of centralized PV in the highly suitable regions of China alone amounts to 33.41 × 10¹² kWh, which is a figure over five times the total electricity generation of China for the year 2016 [19]. The data on generation and abatement potential of the relevant studies are presented in the following Table 10.
Table 10.
Relevant research results.
Research findings highlight dislocation differences between cities in terms of annual rooftop photovoltaic power generation and electricity consumption, and the annual electricity consumption in high-suitability areas is equivalent to that in low-suitability areas, accounting for only about 30% of the province’s total. Except for Chuzhou City, the other four cities in the high suitability area can provide power generation that far exceeds the city’s annual electricity consumption. However, in the cities in the medium- and low-suitability areas, the city’s annual power generation is basically insufficient to maintain the annual electricity consumption.
Table 11 presents each city’s annual potential power generation and electricity consumption in 2021, along with the proportion of total power generation and the power generation-to-consumption times.
Table 11.
Power generation and electricity consumption and their ratios.
3.4. Advantages of Development in Suitable Areas and Analysis of Power Generation and Emission Reduction Benefits
3.4.1. Comparison of Development Methods
Developing photovoltaics is a lengthy and cyclical process, making large-scale achievements challenging in the short term. Planning the installation of distributed photovoltaic systems on rooftops to maximize benefits is a pressing issue.
To assess benefits, a six-year period is considered, comparing two approaches: suitable region development and balanced development. In the divided suitable area method, rooftop distributed photovoltaics are developed in the order of high, medium and low suitability, with the installation tasks for each category completed every two years. The balanced development method involves simultaneous photovoltaic installation in all cities over six years, completing one-sixth each year. Power generation over this period is detailed in Table 12. By presenting the data through Figure 5, it can be readily observed that the regional development approach, compared to the balanced development approach, can provide an additional 1.25 × 10¹¹ kWh of power generation potential (The area between the two broken lines represents the additional electricity generation). This approach also enhances carbon emission reduction benefits, contributing to earlier achievement of carbon peak and carbon neutrality.
Table 12.
Electricity is generated by different development methods over the years.
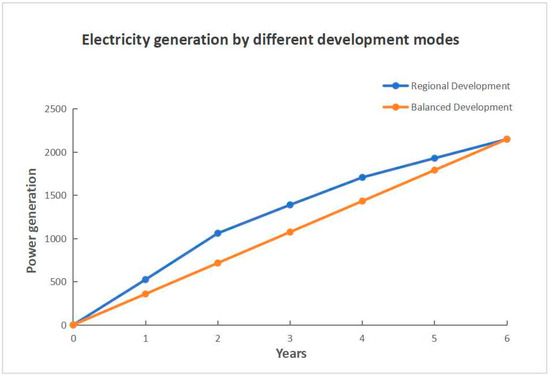
Figure 5.
Comparison of power generation capacity of different development methods.
3.4.2. Full Life Cycle Power Generation and Emission Reduction Estimation
Adopting a regional development approach, we estimate the actual power generation and emission reduction benefits of distributed photovoltaic power generation in Anhui Province over its life cycle. This estimation considers the attenuation of photovoltaic modules, assuming a 25-year lifespan for the panels, with timely updates. The deployed photovoltaics are fully replaced every 6 years, constituting a 30-year cycle. Photovoltaic module power attenuation follows the CHGMN72D model N-type monocrystalline high-efficiency double-glass module of ZhongHuan Low Carbon New Energy (Anhui) Company as the standard. The PV module degradation rate (RD) is often nonlinear. Scholars such as Marios Theristis have conducted extensive research on this subject [52,53]. In this research, to simplify the computational process of this section, it is hypothesized that the performance of photovoltaic (PV) systems will exhibit a linear degradation over their entire service life. The module’s power attenuation rate is capped at 1% in the first year and 0.4% in subsequent years, based on the findings of Yang et al. [54], detailed in Table 13 (attenuation rate). Emission reduction benefits are calculated using Formulas (8)–(11), considering the East China Power Grid, to which the Anhui Provincial Power Grid belongs. The power marginal emission factor and capacity marginal emission factor for the East China Power Grid in 2019, sourced from the Ministry of Ecology and Environment data [47], are 0.792 and 0.387, respectively.
Table 13.
Attenuation rate.
Based on the information above, the rooftop distributed photovoltaic project in Anhui Province is expected to generate a total of 5.72 × 10¹² kWh over its 30-year operational period, with an average annual power generation of 1.91 × 10¹¹ kWh. Based on the research findings of Shi and colleagues, photovoltaic power generation of 1 kWh can reduce carbon emissions by 0.997 kg, with the conversion factor considered to be 0.997 [55]. This initiative is estimated to lead to a total carbon reduction of 5.70 × 10⁹ tons, equating to an average annual carbon reduction of around 1.90 × 10⁸ tons. Additionally, it is anticipated to reduce SO2 emissions by about 1.63 × 10⁶ tons, NOX by about 7.25 × 10⁵ tons, CO by about 2.37 × 10⁴ tons, and TSP (total suspended particulate matter) by about 3.63 × 10⁴ tons. Detailed annual power generation and carbon emission reduction data for the rooftop distributed photovoltaic projects in Anhui Province are presented in Table 14, while the reduction in other pollutants is outlined in Table 15.
Table 14.
Annual power generation and carbon emission reduction.
Table 15.
Emission reduction of other pollutants.
4. Discussion
Based on the research parameters, Anhui Province has a planned rooftop area for a photovoltaic development of 2.63 × 10⁵ ha, with an annual power generation potential of 2.15 × 10¹¹ kWh and an annual carbon emission reduction potential of 1.49 × 10⁸ t. Nationally, there are 5.15 × 10⁶ ha of available rooftop area for photovoltaic deployment. Using the average solar radiation in Anhui Province as a benchmark, the estimated national rooftop distributed photovoltaic power generation potential is around 4.18 × 10¹² kWh, constituting approximately 50.1% of the country’s total electricity consumption in 2021 (8.31 × 10¹² kWh). This percentage is considerably lower than Anhui Province’s 80%, mainly due to lower solar radiation in industrially developed and economically dense areas with high electricity consumption. Additionally, sparsely populated regions in the west and north have limited rooftop areas, hindering rooftop photovoltaic development but potentially reducing carbon emissions by about 3.09 × 10⁹ t annually. According to Shan, Guan et al.’s national carbon accounting [56], this reduction corresponds to around 27.6% of the national carbon emissions in 2021 (11,295 Mt). It is essential to note that the above estimates are based on ideal conditions, and the national average solar radiation is likely higher than that of Anhui Province. The study focuses solely on the rooftop distributed photovoltaic development potential in Anhui Province, excluding the power generation and emission reduction potential of centralized photovoltaics. In China’s western and northern regions, centralized photovoltaics show greater potential, aligning with government support for their development in northwest China [57].
Based on the information provided in Table 12, it can be deduced that due to variations in developmental approaches and regional characteristics, there exists a significant disparity in the power generation potential. Consequently, it is imperative to select photovoltaic (PV) development models and formulate corresponding development plans that are tailored to the specific conditions of each locality. The adoption of a tailored strategy for each region is crucial for achieving regional energy transformation and the “dual carbon” goals, which refer to the objectives of peak carbon dioxide emissions and carbon neutrality. This targeted approach, often termed as “one region, one policy,” is of paramount importance for the successful transition to a sustainable energy future in line with the global commitment to mitigate climate change.
Considering different regions and local conditions is crucial for selecting the appropriate photovoltaic development model and formulating corresponding plans. The “one location, one policy” approach is essential for achieving regional energy transformation and meeting carbon reduction goals. Government documents, such as those from the National Energy Administration, emphasize differentiated development of rooftop distributed photovoltaics within regions [58], At the same time, the large regional development of photovoltaic construction investment is huge, there should be sequential development [59]. This research provides theoretical support for selecting development areas. Taking Anhui Province as an example, there is a significant disparity in power generation potential between high- and low-suitability areas. When choosing pilot or advance construction areas, prioritizing high-suitability areas is advisable due to their higher power generation potential. As shown in Table 16. The contribution amount referred to is the proportion of the power generation potential of villages in a certain prefecture-level city relative to the total power generation potential of the citywide (including city, village, and hamlet). In terms of power generation potential, villages in all cities in the province contribute over 60%, with highly suitable areas reaching nearly 90%. Even in low-suitability areas, the village power generation contribution rate is generally above 70%. Villages demonstrate substantial potential for rooftop distributed photovoltaic development.
Table 16.
Village power generation potential.
Analyzing the power generation potential of rural areas alone reveals a grading map of village photovoltaic power generation contribution in Anhui Province (The data are sourced from Table 16) (Figure 6). Comparing it with the power generation and electricity consumption ratio diagram of each citywide (total electricity generation of the citywide/total electricity consumption of the citywide) (Figure 7) suggests a correlation. Regions with a high ratio of electricity generation to consumption tend to have lower per capita income and a less developed overall economy. Simultaneously, a significant contribution from photovoltaic power generation in villages indicates more rural areas with lower economic development levels. This situation poses a challenge of uncoordinated power production and use in the development of distributed photovoltaics.
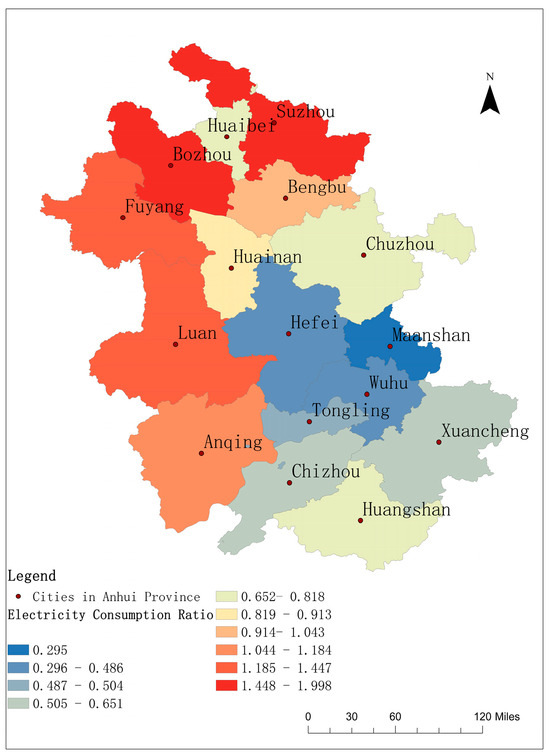
Figure 6.
Village power generation contribution chart.
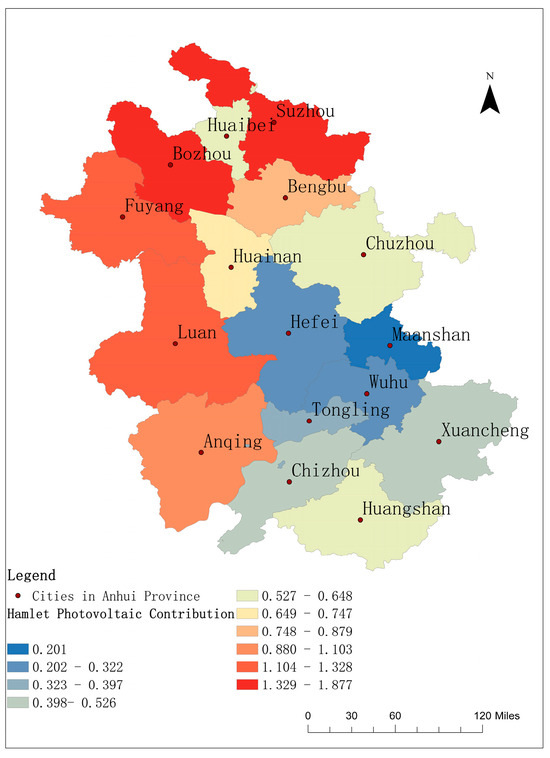
Figure 7.
Electricity generation and consumption ratio chart.
Addressing this challenge requires solving the distribution of electricity. Current research focuses on energy storage and transmission. Energy storage is crucial for the stable use and distribution of photovoltaic power generation, representing a primary constraint on the development of photovoltaic and other new energy sources [60,61,62]. Effective transmission necessitates the establishment of a large-scale power transmission system to facilitate timely distribution within extensive areas. This requires forward-looking planning and construction by relevant policymakers.
This paper has exclusively examined the power generation potential of distributed photovoltaic (PV) systems installed on rooftops. However, in practical applications, distributed PV systems are also prevalent in various other scenarios, such as alongside roadsides, over water surfaces, and within public facilities. These contexts present a multitude of opportunities for further in-depth research, which could be explored in future studies. Utilizing published data pertaining to roads and water bodies in Anhui Province, the author has employed the same computational methodology to preliminarily estimate the power generation and emission reduction potential available from these alternative applications, as depicted in the Table 17 below.
Table 17.
Road and water power generation and carbon reduction potential in Anhui Province.
In conclusion, the widespread adoption of rooftop distributed photovoltaics encounters challenges like constrained potential, policy complexities, and technical limitations. Nevertheless, given the growing global emphasis on new energy sources, climate change, and energy sustainability, ongoing research endeavors in energy storage and transmission technologies hold promise for scaling up rooftop distributed photovoltaics. This advancement aligns with broader objectives such as achieving early carbon peak and carbon neutrality, offering prospects for sustainable and clean production and living.
5. Conclusions
This study utilizes meteorological, economic, and geographical factors as indicators to assess the suitability of rooftop distributed photovoltaic development in Anhui Province amid the context of carbon peak and carbon neutrality. The evaluation encompasses power generation potential and emission reduction benefits, offering a pragmatic approach to solar photovoltaic utilization in areas unsuitable for large-scale centralized photovoltaics. The findings provide an insightful and effective planning solution for regional photovoltaic deployment and serve as a reference for analogous regions exploring distributed photovoltaic development.
(1) Suitable areas for rooftop distributed photovoltaics in Anhui Province are predominantly situated in the northern high and southern low regions. These highly suitable areas contribute half of the province’s potential power generation, with residential area size being the primary influencing factor, followed by solar radiation considerations.
(2) Anhui Province has huge potential for rooftop distributed photovoltaic power generation. The annual power generation potential will account for approximately 80% of the total electricity consumption in Anhui Province in 2021. However, the power generation potential is mainly concentrated in rural areas and there are spatial differences in power generation and consumption across the province. The use of high-voltage transmission grids should be considered to achieve unified power generation and utilization within the region.
(3) Sequential development of the rooftop distributed photovoltaic industry based on suitability yields increased power generation potential and emission reduction benefits. Over the entire life cycle, Anhui Province could reduce annual emissions by approximately 1.28 × 10⁸ tCO2, constituting about one-third of the province’s carbon emissions in 2021 and contributing to earlier achievement of carbon neutrality.
(4) Rooftop distributed photovoltaics are restricted by the roof area and have huge power generation potential but insufficient upper limit. At the same time, regional electricity consumption is still growing rapidly. Rooftop photovoltaics alone cannot meet the demand for clean electricity. All regions should develop multiple types of new energy sources according to local conditions, in order to achieve clean replacement and sustainable development of traditional energy sources as soon as possible.
Author Contributions
All authors contributed to the study conception and design. Material preparation was performed by J.W. The data collection and analysis were performed by Q.H. and X.L. The chart was made by Y.L. The first draft of the manuscript was written by Q.H., X.L. and S.Y., and all authors commented on previous versions of the manuscript. All authors read and approved the final manuscript.
Funding
This research was funded by National Key Research and Development Program of China (Grant numbers 2017YFD0301301).
Institutional Review Board Statement
Not applicable.
Informed Consent Statement
Not applicable.
Data Availability Statement
Data related to the research are reported in the manuscript. Any additional data may be acquired from the corresponding author upon request.
Conflicts of Interest
The authors declare no conflicts of interest.
References
- Jiang, J. The Global Carbon Cycle: From Fundamental Scientific Issues to National Green Responsibility. Science 2021, 73, 39–44. [Google Scholar]
- International Energy Agency. 2021. Available online: https://www.iea.org/reports/net-zero-by-2050?language=zh (accessed on 15 January 2024).
- Wang, Y. Promotion and Utilization Research of Photovoltaic Power Generation in Rural and Remote Areas of China. Master’s Thesis, Chinese Academy of Agricultural Sciences, Beijing, China, 2012. [Google Scholar]
- Bertolino, A.M.; Giganti, P.; Santos, D.D.D.; Falcone, P.M. A matter of energy injustice? a comparative analysis of biogas development in Brazil and Italy. Energy Res. Soc. Sci. 2023, 105, 103278. [Google Scholar] [CrossRef]
- Falcone, P.M. Sustainable Energy Policies in Developing Countries: A Review of Challenges and Opportunities. Energies 2023, 16, 6682. [Google Scholar] [CrossRef]
- Pasquale, M.F.; Llaria, T. Energy, environment, and resources | Pathways to the green hydrogen development by promoting circular economy. Manag. Policy Implic. 2023. Available online: https://www.researchgate.net/publication/376527314_Energy_environment_and_resources_Pathways_to_the_green_hydrogen_development_by_promoting_circular_economy_Managerial_and_policy_implications (accessed on 15 January 2024).
- Zou, C.C.; Xiong, B.; Xue, H.Q. The position and role of new energy in carbon neutrality. J. Pet. Explor. Dev. 2021, 48, 411–420. [Google Scholar]
- Yan, Y.F.; Zhang, Z.E.; Zhang, L. Solar energy utilisation technology and its application. J. Sol. Energy 2012, 33 (Suppl. S1), 47–56. [Google Scholar]
- Shen, Y.B. An overview of the application of satellite remote sensing data in the assessment of solar energy resources in China in the past 20 years. J. Meteorol. 2010, 36, 111–115. [Google Scholar]
- Shen, Y. Comprehensive Assessment of the Spatial Distribution and Regional Development Potential of Solar Energy Resources in Our Country. Doctoral Dissertation, Lanzhou University, Lanzhou, China, 2014. [Google Scholar]
- Liang, Y.L.; Shen, Y.B.; Bai, L. Solar energy resource assessment and development potential in South China. J. Appl. Meteorol. 2017, 28, 481–492. [Google Scholar]
- Shen, Y.B.; Wang, C.H.; Chen, Y. Changes in surface solar radiation and its influence on temperature changes in the three northeastern provinces of China. J. Geosci. 2023, 43, 2045–2052. [Google Scholar]
- Zhou, Y.; Wu, W.X.; Hu, Y. Assessment of the potential of available solar energy resources in Jiangsu Province. J. Renew. Energy 2010, 28, 10–13. [Google Scholar]
- Yao, Y.B.; Zhen, S.Z.; Dong, H.C. Characteristics of spatial and temporal variability of solar radiation in Northwest China. J. Arid Zone Res. 2023, 40, 863–873. [Google Scholar]
- Li, K.; He, F.N. Regional analysis of the development potential of terrestrial solar energy resources in China. J. Prog. Geosci. 2010, 29, 1049–1054. [Google Scholar]
- Jiang, T.F.; Guo, H.F.; Luo, H.M. Climate suitability of photovoltaic power generation in Hunan. J. Prog. Meteorol. Sci. Technol. 2022, 12, 58–62. [Google Scholar]
- Yuan, H.Y.; Gui, H.; Zhang, T.B. Study on the suitability of photovoltaic development on the western Sichuan plateau based on remote sensing data. J. Remote Sens. Nat. Resour. 2023, 35, 301–311. [Google Scholar]
- Chen, G.; Ji, Z. A Review of Solar and Wind Energy Resource Projection Based on the Earth System Model. Sustainability 2024, 16, 3339. [Google Scholar] [CrossRef]
- Katsaprakakis, D.A. Computational Simulation and Dimensioning of Solar-Combi Systems for Large-Size Sports Facilities: A Case Study for the Pancretan Stadium, Crete, Greece. Energies 2020, 13, 2285. [Google Scholar] [CrossRef]
- Arnaoutakis, G.E.; Kefala, G.; Dakanali, E.; Katsaprakakis, D.A. Combined Operation of Wind-Pumped Hydro Storage Plant with a Concentrating Solar Power Plant for Insular Systems: A Case Study for the Island of Rhodes. Energies 2022, 15, 6822. [Google Scholar] [CrossRef]
- Liu, L.C.; Sun, Z.X.; Wu, F. Assessment of spatial suitability and emission reduction benefits of photovoltaic development in Beijing-Tianjin-Hebei region. J. Geogr. 2022, 77, 665–678. [Google Scholar]
- Zhang, Q.; Xin, X.Z.; Zhang, H.L. Suitability analysis of building photovoltaic power plants in Chinese regions based on remote sensing data and multi-factor evaluation. J. Geo-Inf. Sci. 2018, 20, 119–127. [Google Scholar]
- Ma, Y.F. Research and Application of GIS-Based Solar Photovoltaic Power Station Site Selection Method. Master’s Thesis, Northern Nationalities University, Ninxia, China, 2020. [Google Scholar]
- Yang, C.H.; Ge, Z.X. Research on feed-in pricing of distributed photovoltaic power generation. J. Price Theory Pract. 2018, 51–55. [Google Scholar] [CrossRef]
- Gulkowski, S.; Krawczak, E. Long-Term Energy Yield Analysis of the Rooftop PV System in Climate Conditions of Poland. Sustainability 2024, 16, 3348. [Google Scholar] [CrossRef]
- Fattoruso, G.; Toscano, D.; Venturo, A.; Scognamiglio, A.; Fabricino, M.; Di Francia, G. A Spatial Multicriteria Analysis for a Regional Assessment of Eligible Areas for Sustainable Agrivoltaic Systems in Italy. Sustainability 2024, 16, 911. [Google Scholar] [CrossRef]
- Bao, J.; Li, X.; Yu, T.; Jiang, L.; Zhang, J.; Song, F.; Xu, W. Are Regions Conducive to Photovoltaic Power Generation Demonstrating Significant Potential for Harnessing Solar Energy via Photovoltaic Systems? Sustainability 2024, 16, 3281. [Google Scholar] [CrossRef]
- Zhang, Z.Z.; Lu, Q.Q.; Zhang, J.M. Research progress and outlook of distributed photovoltaic power generation technology under the goal of “dual carbon”. J. Sol. Energy 2023, 17–21. [Google Scholar] [CrossRef]
- Xiao, R.Z. Analysis of construction cost and revenue of distributed photovoltaic power plant. J. Sci. Technol. Innov. Appl. 2020, 30, 64–65. [Google Scholar]
- Yang, K.; Fu, Y.H.; Jiang, Z.B. Multi-objective time-sharing tariff optimisation strategy based on distributed photovoltaic power generation. J. Ind. Eng. 2021, 24, 108–115. [Google Scholar]
- Cong, L.Y. Study on the Economic Benefits of Distributed Photovoltaic Power Generation in the Beijing-Tianjin-Hebei Region. Master’s Thesis, Beijing Institute of Petrochemical Technology, Beijing, China, 2022. [Google Scholar]
- Liu, G.X.; Wu, W.X.; Zhang, X.J. Study on the assessment of available rooftop solar energy resources--Taking the data of Jiangsu Province in 2000 as an example. J. Yangtze River Basin Resour. Environ. 2010, 19, 1242–1248. [Google Scholar]
- Guo, X.L. Assessment of the Photovoltaic Potential of Rooftop Solar Energy in Xuzhou City Based on Roof Area. Master’s Thesis, China University of Mining and Technology, Beijing, China, 2015. [Google Scholar]
- Hu, Y.N.; Li, X.H.; Kang, X.Y. Evaluation of distributed rooftop photovoltaic power generation and economic benefits in Inner Mongolia. J. Arid Zone Resour. Environ. 2021, 35, 66–72. [Google Scholar]
- Ko, L.; Wang, J.C.; Chen, C.Y.; Tsai, H.Y. Evaluation of the development potential of rooftop solar photovoltaic in Taiwan. J. Renew. Energy 2015, 76, 582–595. [Google Scholar] [CrossRef]
- Borfecchia, F.; Pollino, M.; Cecco, L.D. Integrated GIS and Remote Sensing Techniques to Support PV Potential Assessment of Roofs in Urban Areas. In Proceedings of the International Conference on Computational Science and Its Applications, Ho Chi Minh City, Vietnam, 24–27 June 2013. [Google Scholar]
- Lu, Y.Y.; Tian, H.; Lu, J. Spatial and temporal variations of total solar radiation in Anhui Province in the past 50 years. J. Meteorol. Sci. Technol. 2016, 44, 769–775. [Google Scholar]
- Keroglou, I.; Tsoutsos, T. Optimal siting of solar desalination plants in Crete, Greece employing a GIS/MCDM approach. Renew. Energy 2024, 2024, 120168. [Google Scholar] [CrossRef]
- Gkeka-Serpetsidaki, P.; Tsoutsos, T. Sustainable site selection of offshore wind farms using GIS-based multi-criteria decision analysis and analytical hierarchy process. Case study: Island of Crete (Greece). In Low Carbon Energy Technologies in Sustainable Energy Systems; Academic Press: New York, NY, USA, 2021. [Google Scholar]
- Xu, X.M. Application of Analytic Hierarchy Process. J. Stat. Decis. 2008, 156–158. [Google Scholar]
- Li, D.D.; He, H.; Qiu, H.S.; Wu, Z. The spatiotemporal distribution characteristics and potential assessment of solar radiation energy resources in Anhui Province. J. Anhui Agric. Univ. 2022, 49, 990–996. [Google Scholar]
- Ministry of Housing and Urban-Rural Development of the People’s Republic of China. 2012. Available online: https://www.mohurd.gov.cn/gongkai/zhengce/zhengcefilelib/201201/20120104_208247.html (accessed on 29 May 2024).
- Ministry of Housing and Urban-Rural Development of the People’s Republic of China. 2010. Available online: https://www.mohurd.gov.cn/gongkai/zhengce/zhengcefilelib/201102/20110228_202685.html (accessed on 29 May 2024).
- Cheng, Z.L.; Wang, F.; Feng, Y.F. A Multidimensional Evaluation of the Potential for Rooftop Photovoltaic Utilization in Urban Buildings: A Case Study of Guangzhou City. Sol. Energy 2021, 64–74. [Google Scholar]
- New thermophotovoltaic systems can increase the conversion efficiency of solar cells to 80%. Renew. Energy 2013, 31, 29. Available online: https://qikan.cqvip.com/Qikan/Article/Detail?id=47811434 (accessed on 15 January 2024).
- National Voluntary Greenhouse Gas Emission Reduction Trading System. 2023. Available online: https://www.ccchina.org.cn/list.aspx?clmId=159 (accessed on 15 January 2024).
- Ministry of Ecological Environment of the People’s Republic of China. 2020. Available online: https://www.mee.gov.cn/ywgz/ydqhbh/wsqtkz/202012/t20201229_815386.shtml (accessed on 15 January 2024).
- Li, N.Q.; Xu, G.Y. Analysis of Land Use Data Gridding Based on the Natural Breaks (Jenks) Optimization Method. J. Surv. Mapp. 2020, 4, 6. [Google Scholar]
- Li, J.X.; Li, C.K.; Yin, Z.H. Kriging Interpolation Method Based on ArcGIS and Its Application. J. Surv. Mapp. 2013, 9, 5. [Google Scholar]
- Liang, Y.L.; Shen, Y.B.; Bai, L. Assessment and Development Potential of Solar Energy Resources in South China. J. Appl. Meteorol. 2017, 28, 481–492. [Google Scholar]
- Yang, Q.; Huang, T.Y.; Wang, S.G. A GIS-based high spatial resolution assessment of large-scale PV generation potential in China. Appl. Energy 2019, 247, 254–269. [Google Scholar] [CrossRef]
- Theristis, M.; Livera, A.; Micheli, L.; Ascencio-Vásquez, J.; Makrides, G.; Georghiou, G.E.; Stein, J.S. Comparative Analysis of Change-Point Techniques for Nonlinear Photovoltaic Performance Degradation Rate Estimations. IEEE J. Photovolt. 2021, 11, 1511–1518. [Google Scholar] [CrossRef]
- Theristis, M.; Livera, A.; Micheli, L.; Jones, C.B.; Makrides, G.; Georghiou, G.E.; Stein, J.S. Modeling nonlinear photovoltaic degradation rates. In Proceedings of the 2020 47th IEEE Photovoltaic Specialists Conference (PVSC), Calgary, AB, Canada, 15 June–21 August 2020; pp. 208–212. [Google Scholar]
- Yang, W.; Yang, Y. Common Issues and Discussion on the Calculation of Annual Power Generation Based on the Attenuation of Photovoltaic Modules. J. Sol. Energy 2016, 76–78+45. [Google Scholar]
- Shi, D.H. Saving 1 kilowatt-hour of electricity reduces how much CO2? Sol. Energy 2010, 12, 64. [Google Scholar]
- Shan, Y.L.; Guan, Y.R. Assessment to China’s recent emission pattern shifts. J. Earth’s Future 2021, 9, e2021EF002241. [Google Scholar]
- General Office of the Ministry of Natural Resources of China. 2023. Available online: https://www.gov.cn/zhengce/zhengceku/2023-04/03/content_5749824.htm (accessed on 15 January 2024).
- China National Energy Administration. 2021. Available online: https://www.gov.cn/zhengce/zhengceku/2021-09/15/content_5637323.htm (accessed on 15 January 2024).
- Wang, Y.; Wang, R.; Tanaka, K.; Ciais, P.; Penuelas, J.; Balkanski, Y.; Sardans, J.; Hauglustaine, D.; Liu, W.; Xing, X.; et al. Accelerating the energy transition towards photovoltaic and wind in China. Nature 2023, 619, 761–767. [Google Scholar] [CrossRef] [PubMed]
- Jaxa-Rozen, M.; Trutnevyte, E. Sources of uncertainty in long-term global scenarios of solar photovoltaic technology. Nat. Clim. Chang. 2021, 11, 266–273. [Google Scholar] [CrossRef]
- Sepulveda, N.A.; Jenkins, J.D.; Edington, A. The design space for long-duration energy storage in decarbonized power systems. Nat. Energy 2021, 6, 506. [Google Scholar] [CrossRef]
- Arbabzadeh, M.; Sioshansi, R.; Johnson, J.X. The role of energy storage in deep decarbonization of electricity production. Nat. Commun. 2019, 10, 3413. [Google Scholar] [CrossRef]
Disclaimer/Publisher’s Note: The statements, opinions and data contained in all publications are solely those of the individual author(s) and contributor(s) and not of MDPI and/or the editor(s). MDPI and/or the editor(s) disclaim responsibility for any injury to people or property resulting from any ideas, methods, instructions or products referred to in the content. |
© 2024 by the authors. Licensee MDPI, Basel, Switzerland. This article is an open access article distributed under the terms and conditions of the Creative Commons Attribution (CC BY) license (https://creativecommons.org/licenses/by/4.0/).