
Examining the Impact of Urban Connectivity on Urban Innovation Efficiency: An Empirical Study of Yangtze River Delta in China


Abstract
:1. Introduction
2. Literature Review and Conceptual Framework
2.1. Measurement of Innovation Efficiency
2.2. Determinants of Urban Innovation Efficiency
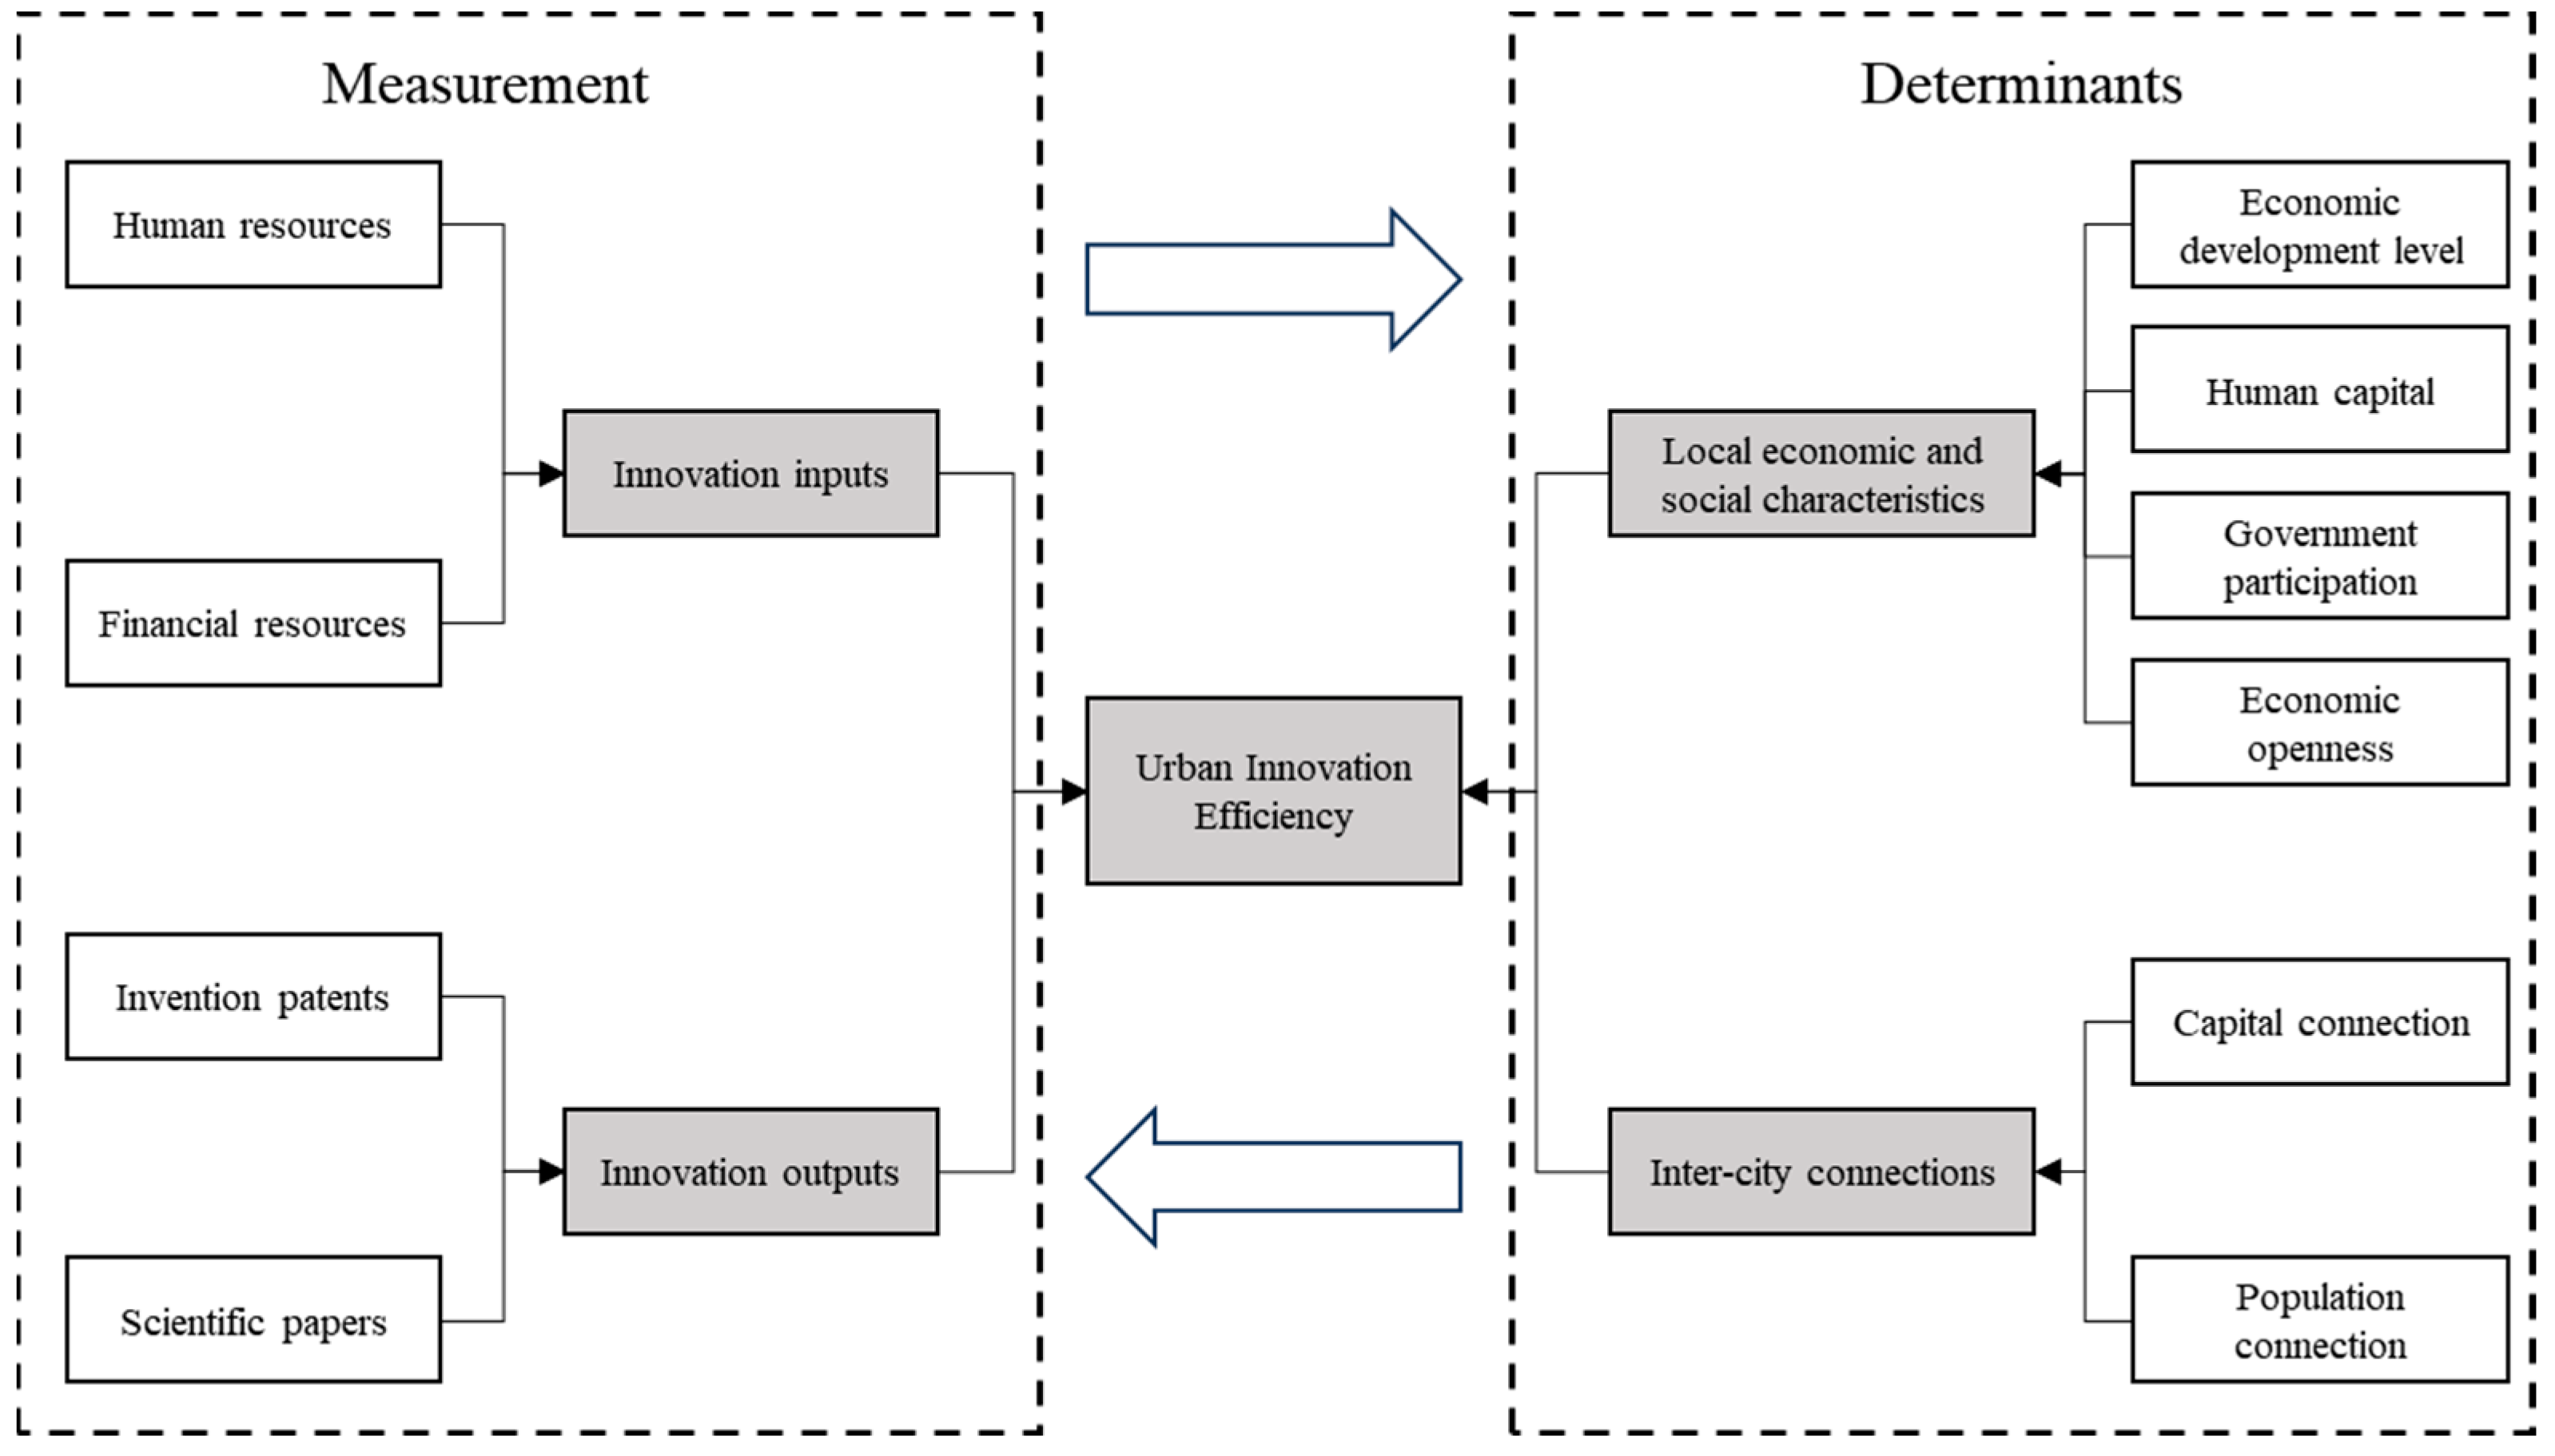
2.3. Conceptual Framework
3. Data and Methods
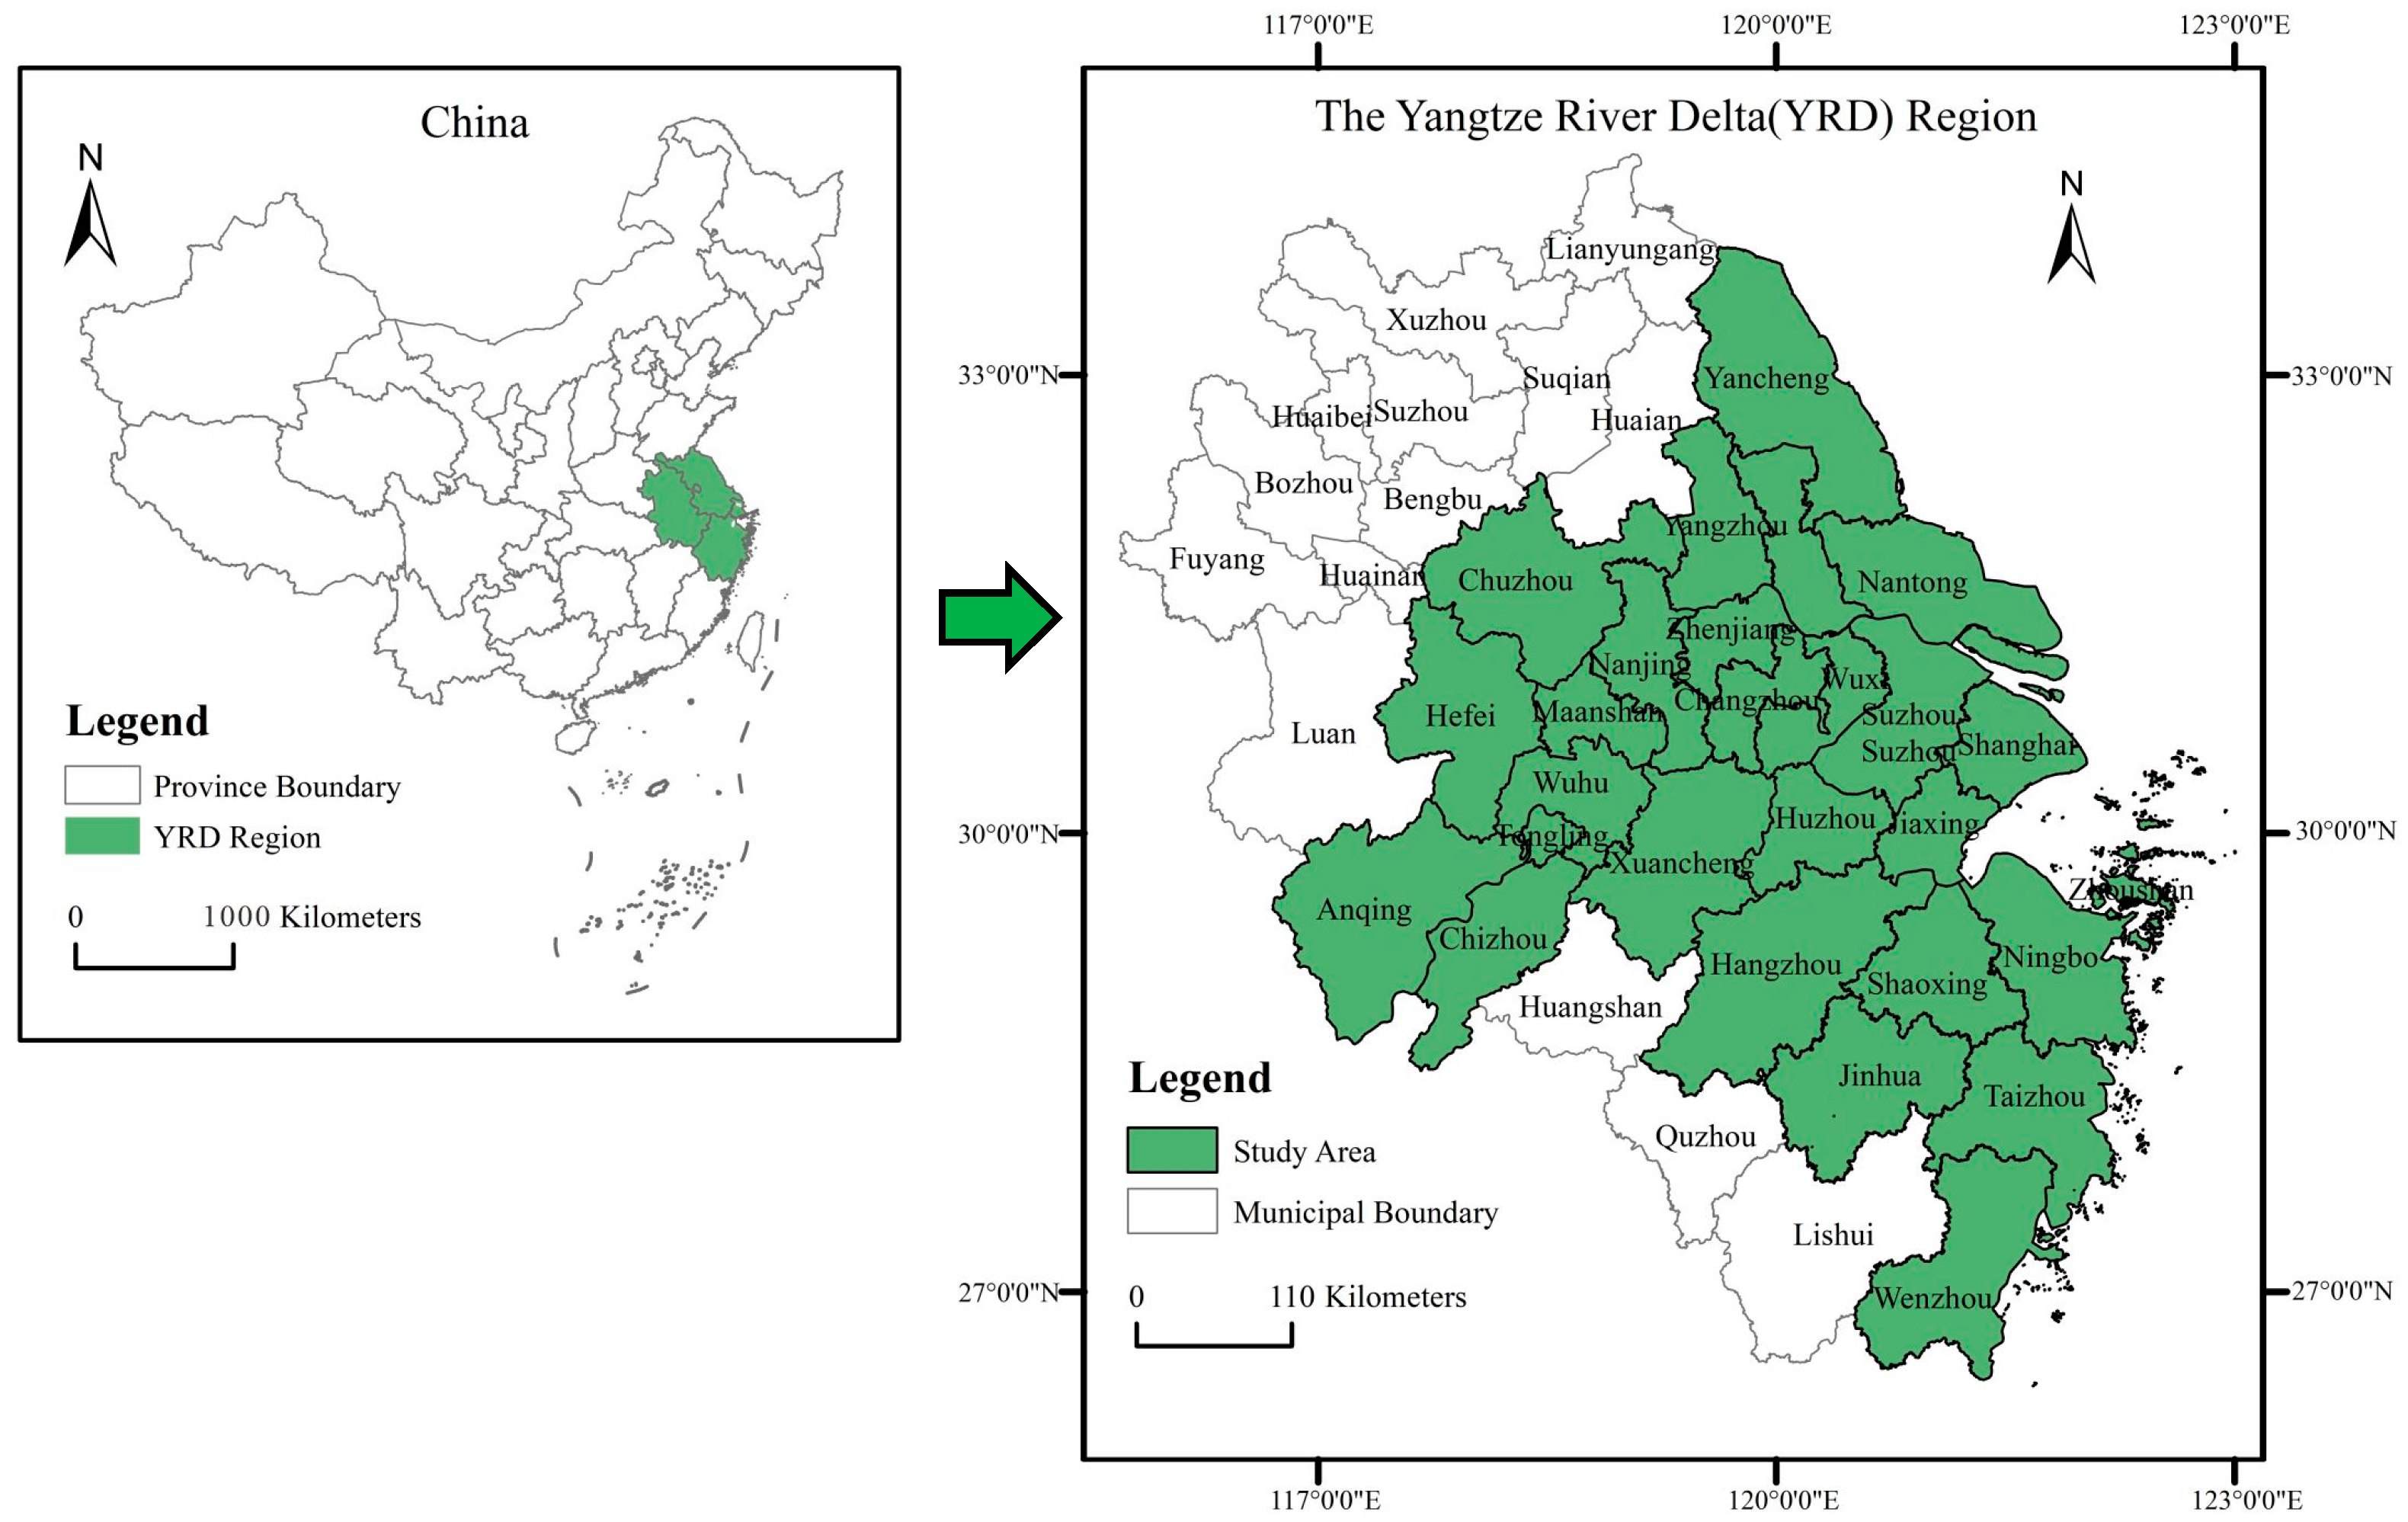
3.1. Study Area
3.2. Data Sources
3.3. Data Envelopment Analysis
3.4. Spatial Regression Models
4. Innovation Efficiency Patterns in YRD Cities
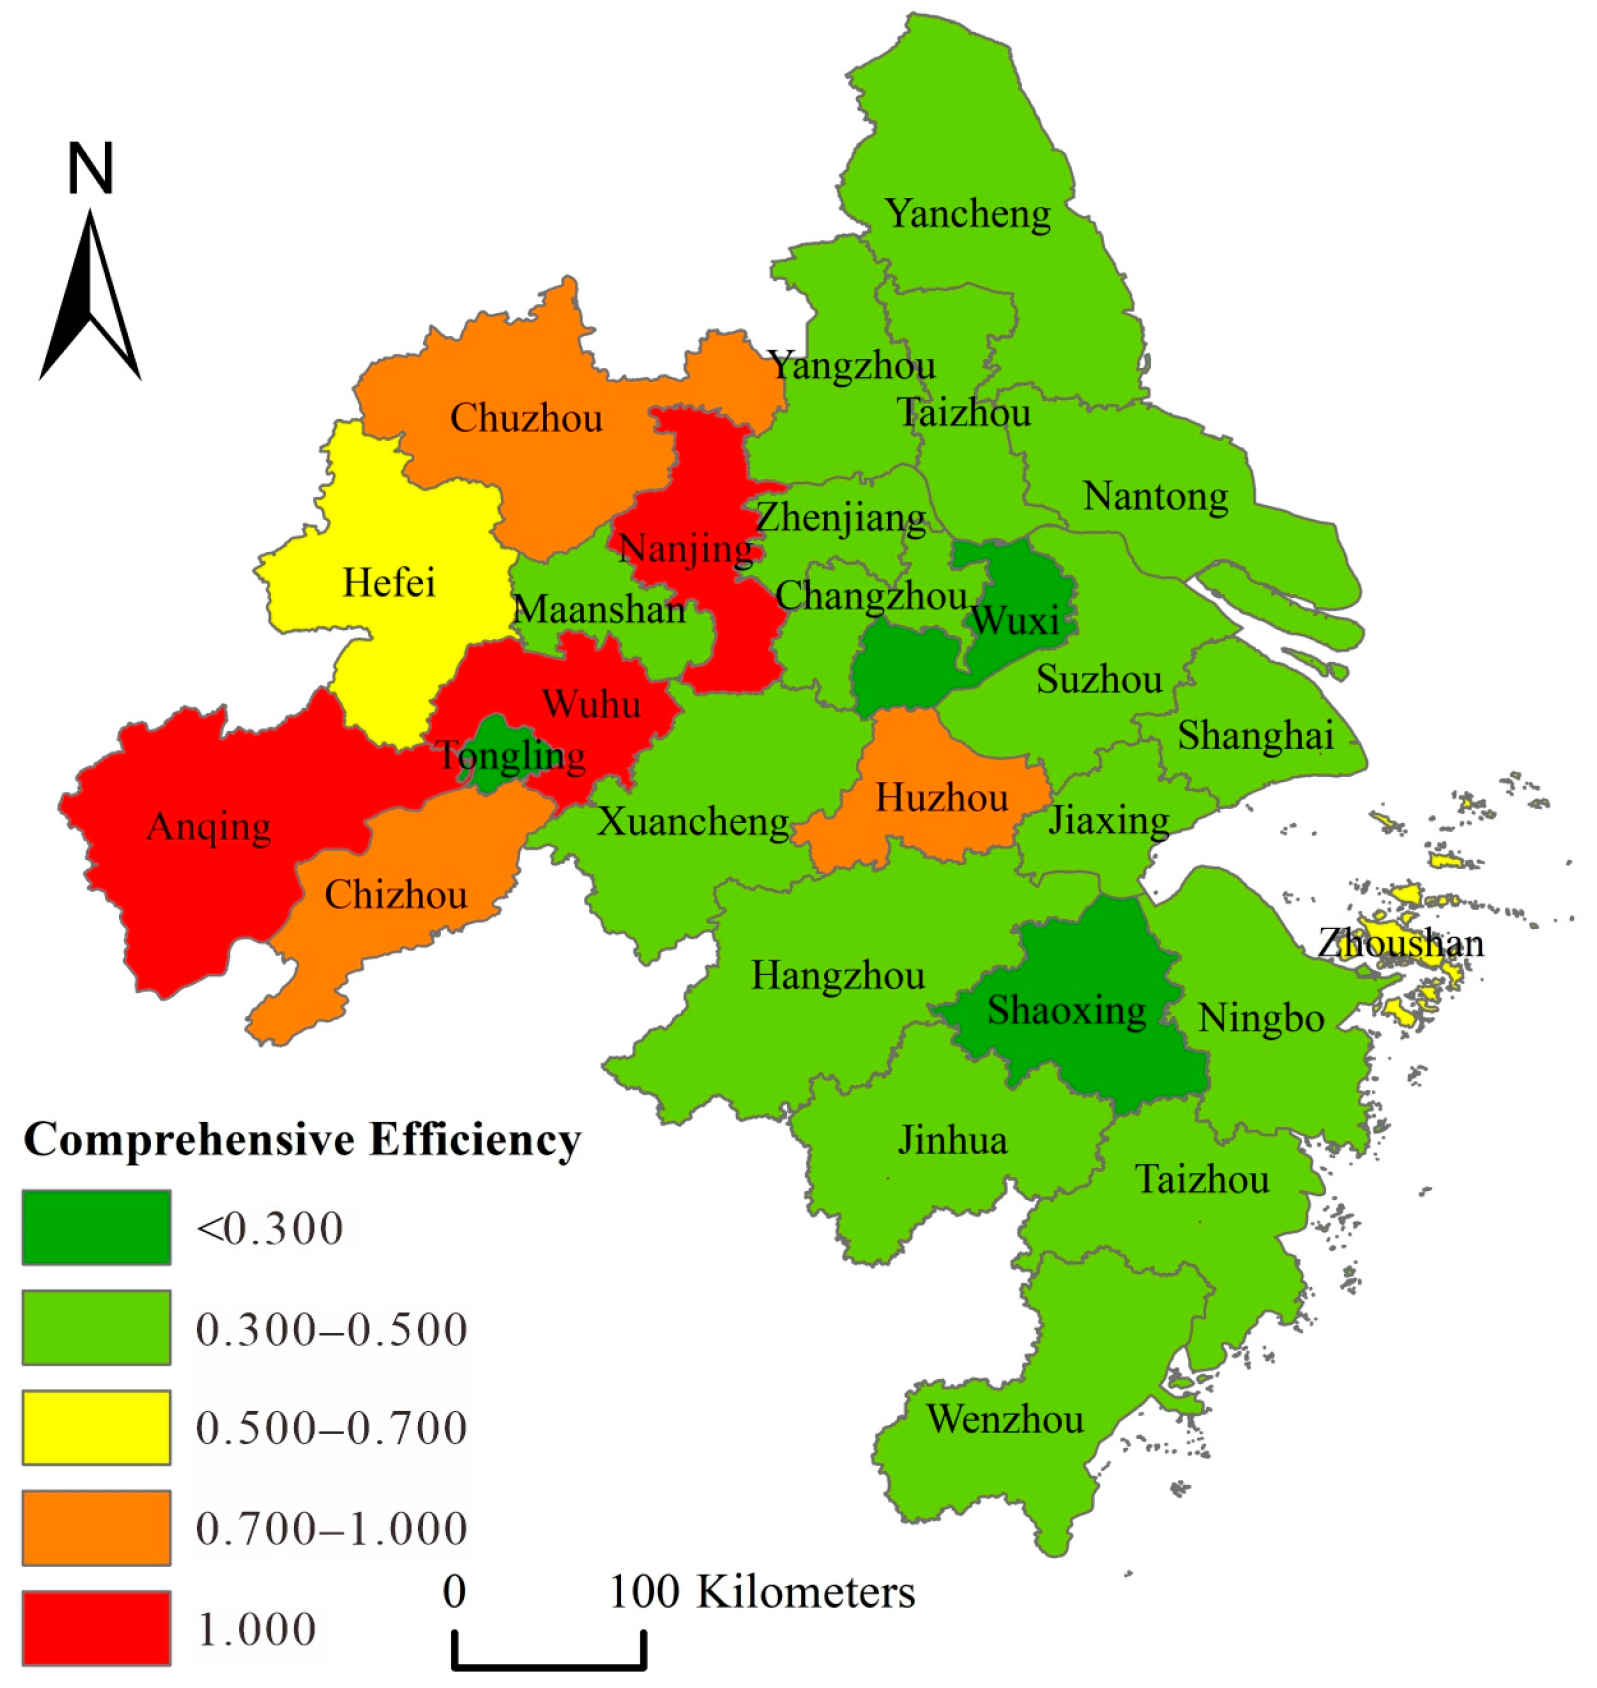
4.1. Comprehensive Efficiency
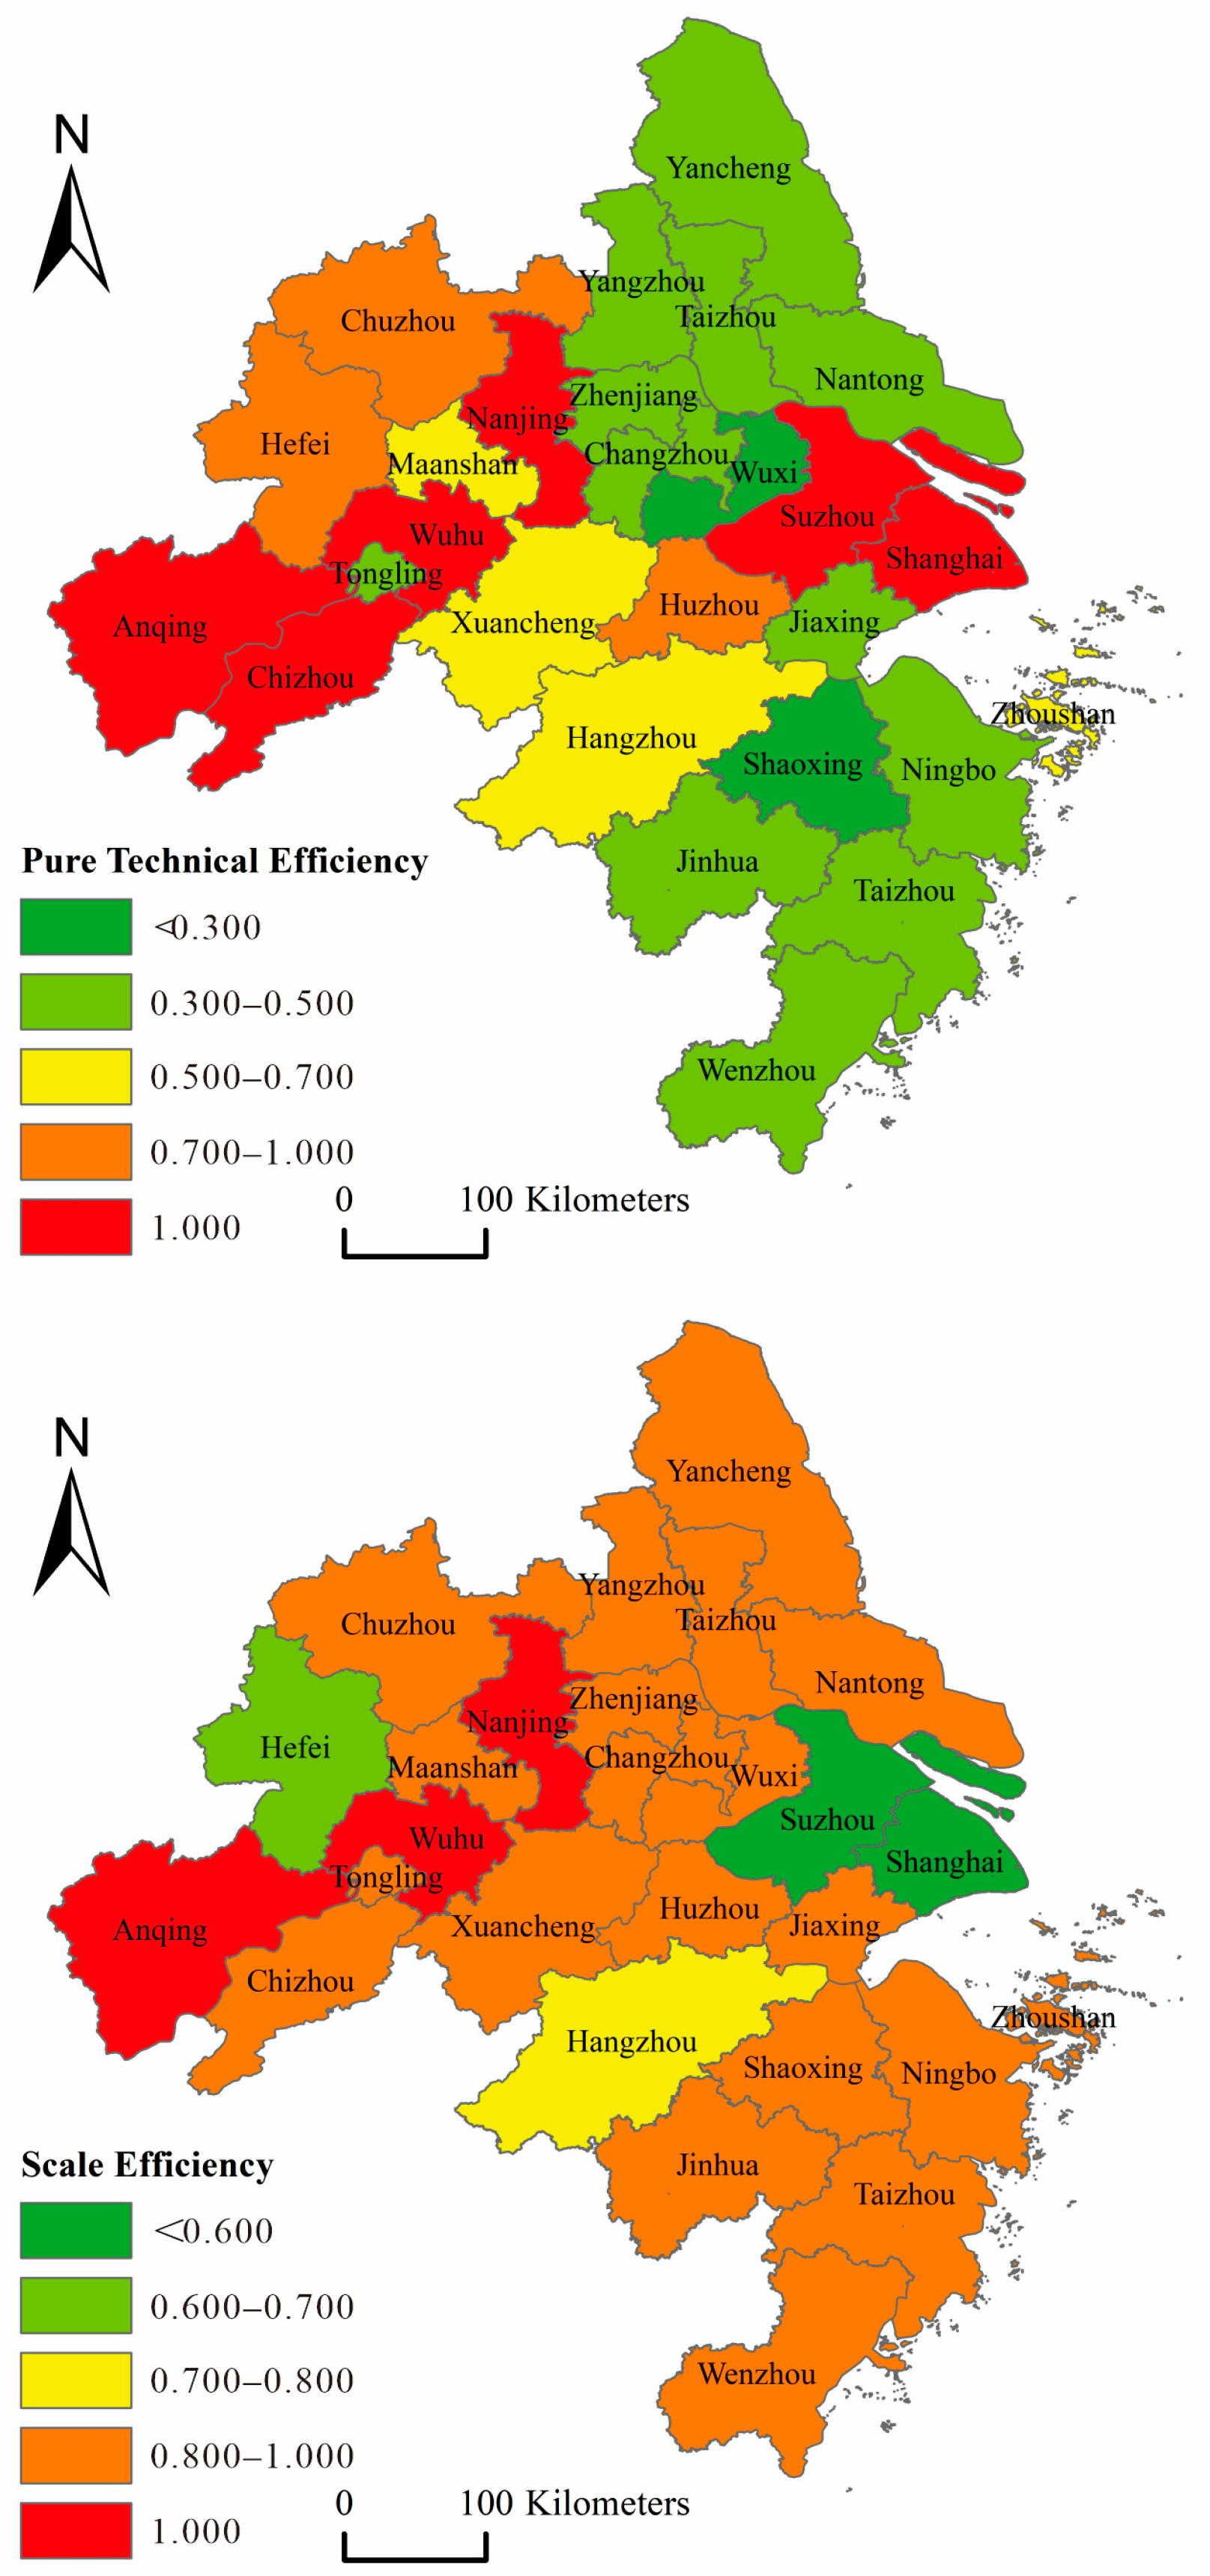
4.2. Pure Technical Efficiency
4.3. Scale Efficiency
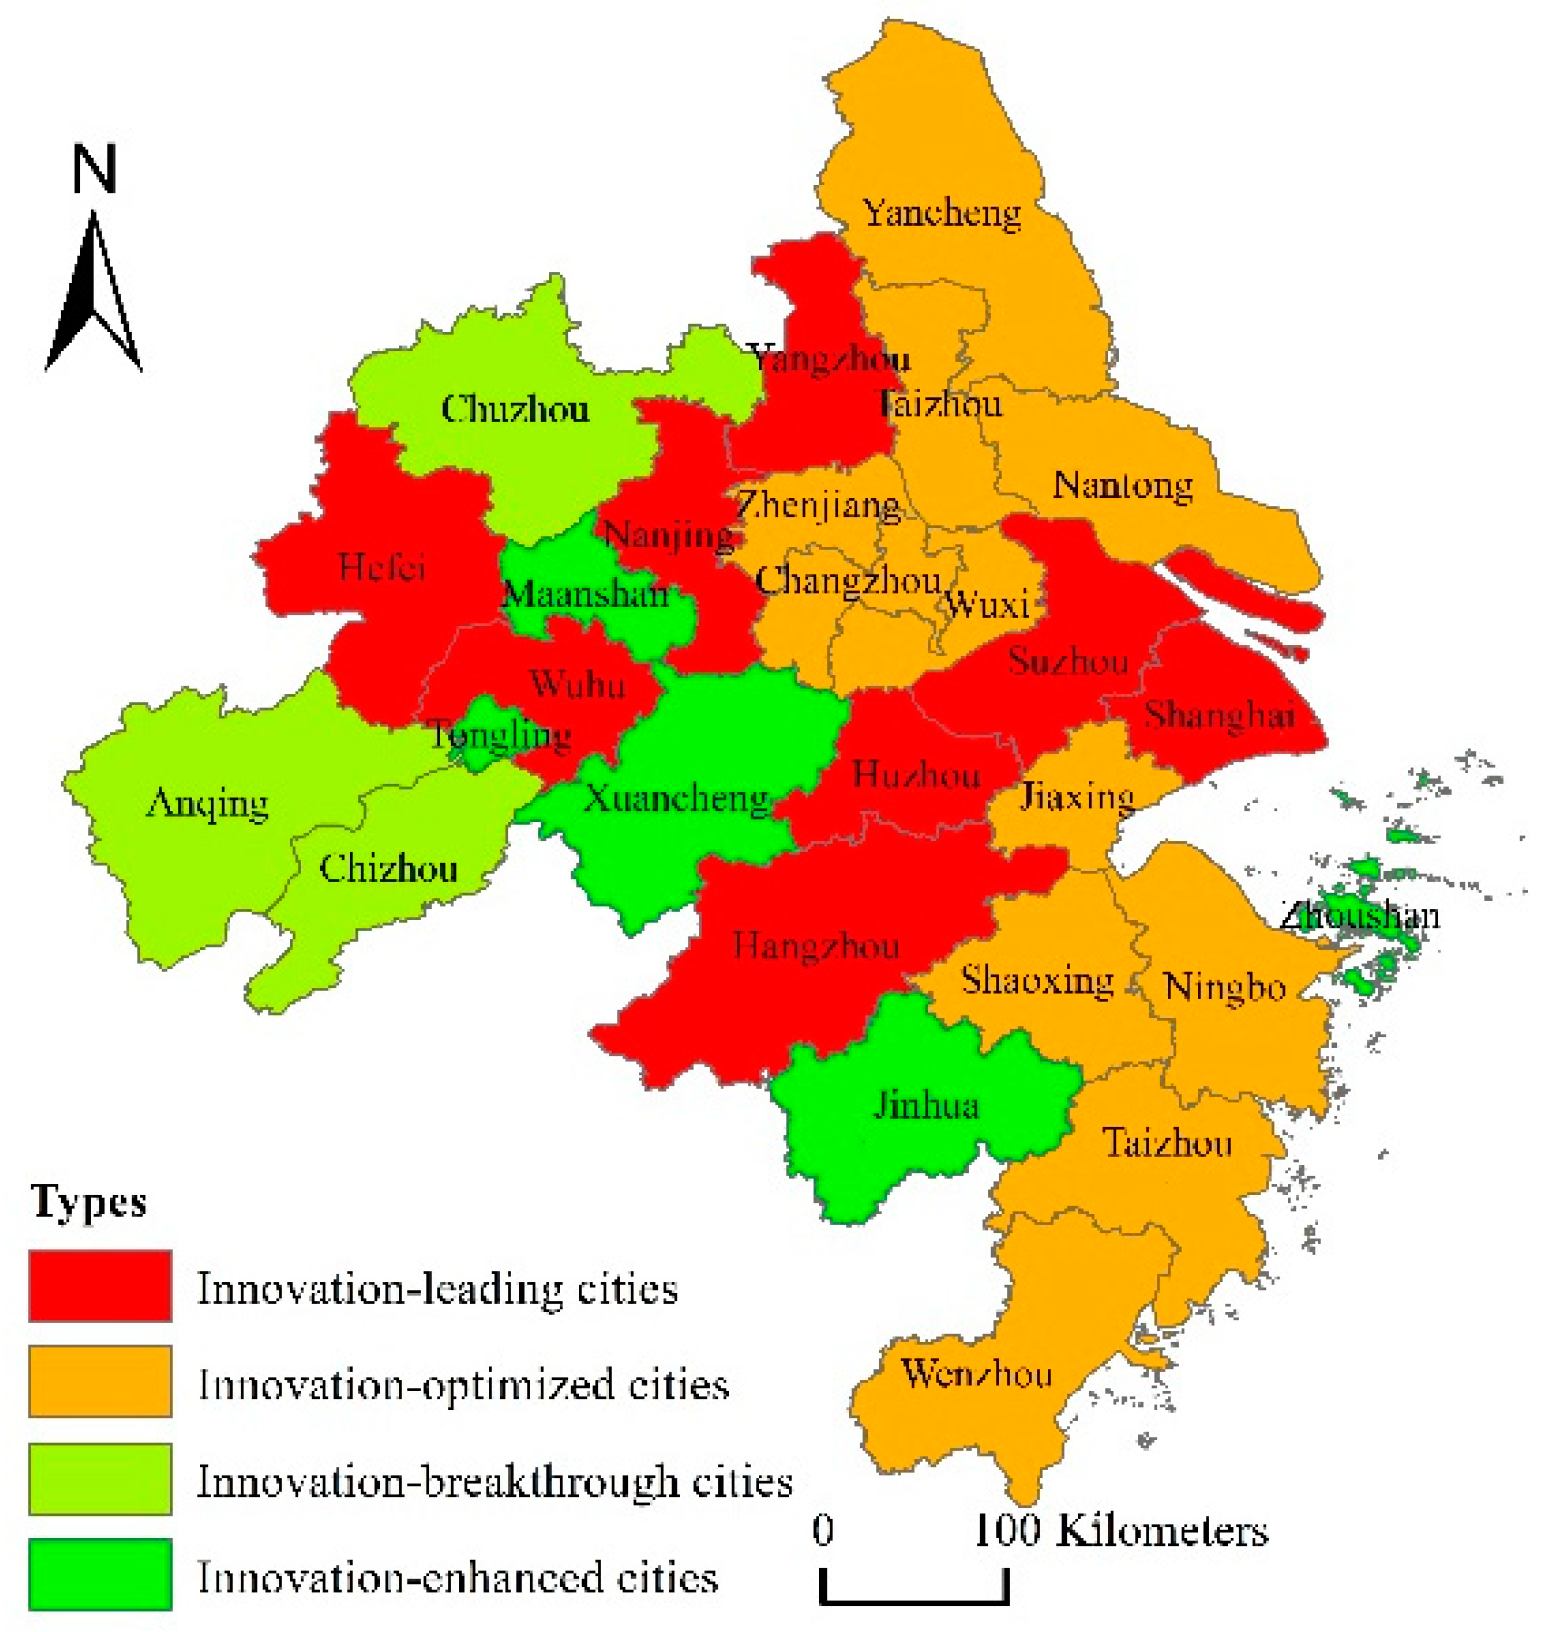
4.4. Types of Innovation Input–Output
5. Determinants of Innovation Efficiency in YRD Cities
5.1. Variables Selection
5.2. Determinants of Urban Innovation Efficiency
5.2.1. Urban Socio-Economic Characteristics
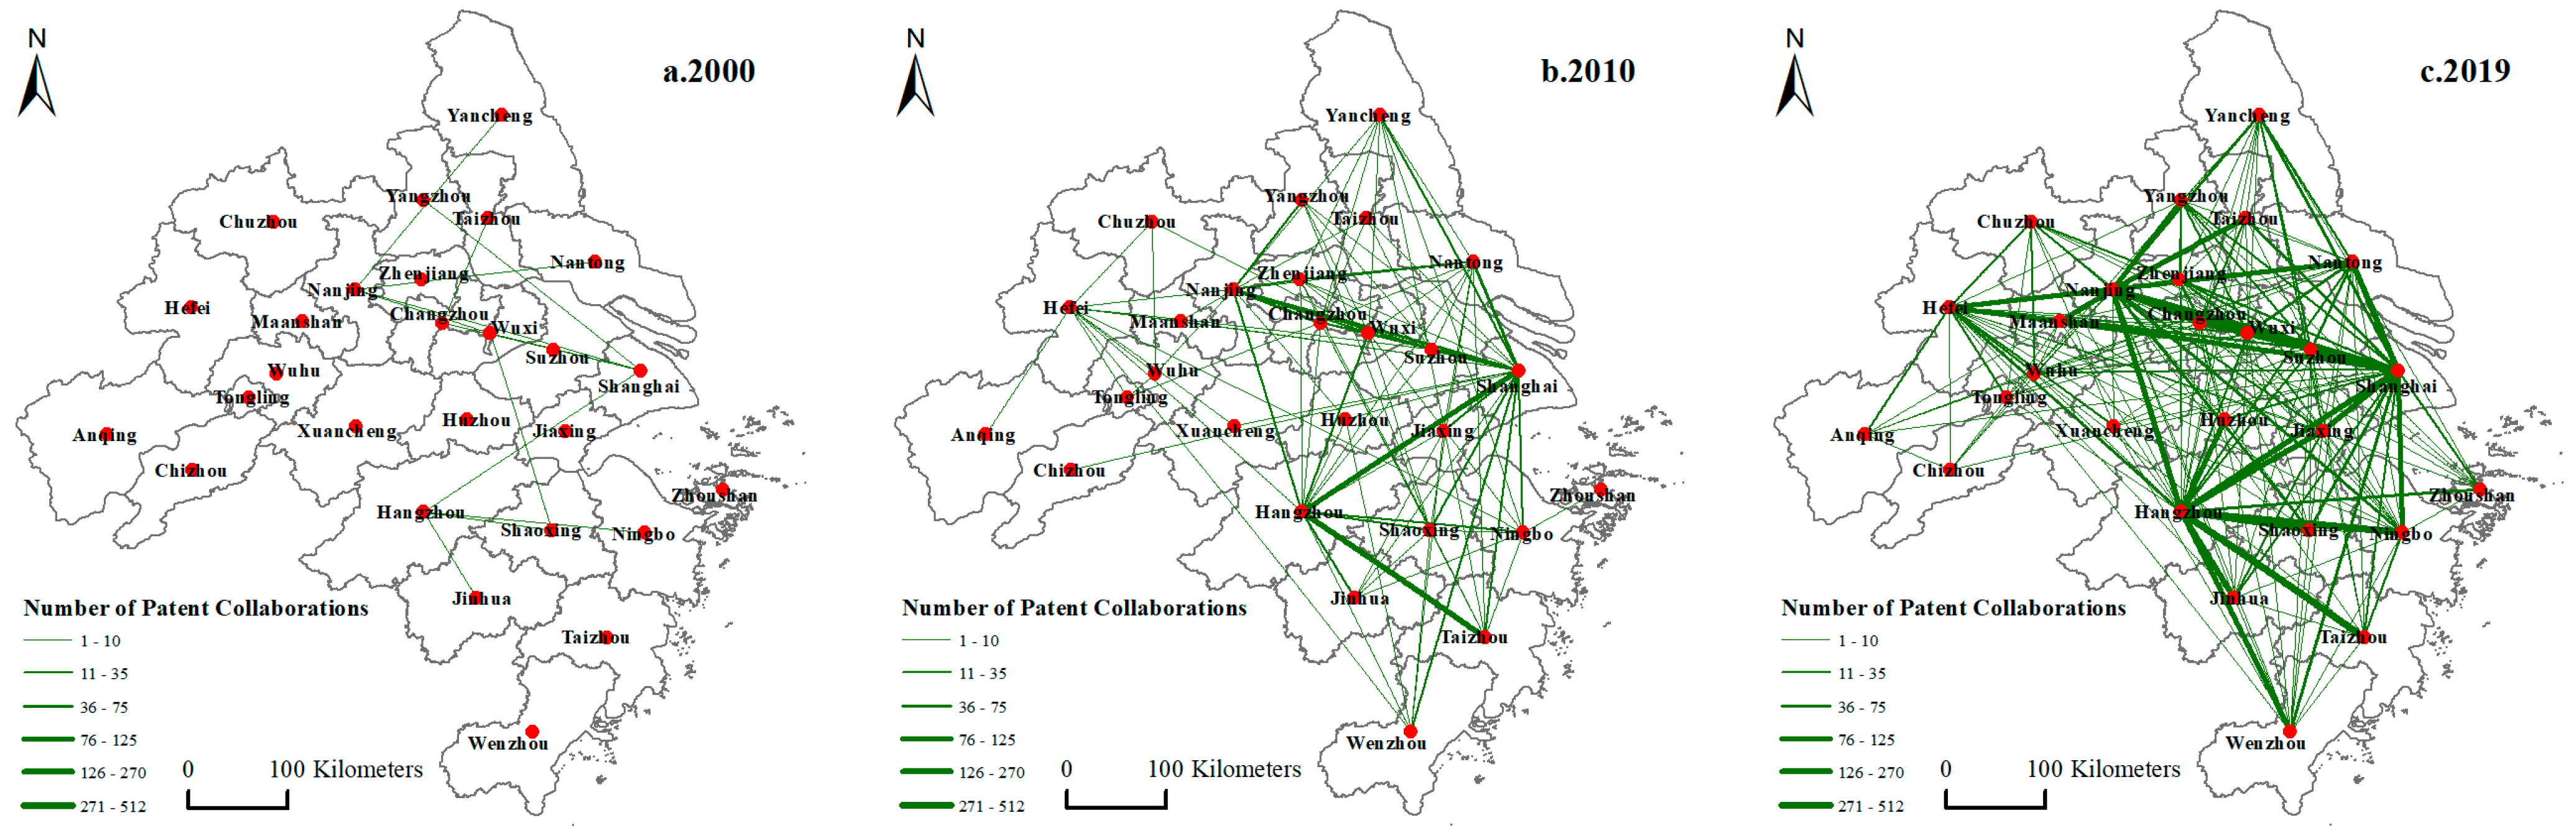
5.2.2. Urban Connections
5.2.3. Spatial Spillover Effects
6. Conclusions and Discussion
Author Contributions
Funding
Institutional Review Board Statement
Informed Consent Statement
Data Availability Statement
Conflicts of Interest
References
- Godin, B. The knowledge-based economy: Conceptual framework or buzzword? J. Technol. Transf. 2006, 31, 17–30. [Google Scholar] [CrossRef]
- Hsu, G.J.Y.; Lin, Y.H.; Wei, Z.Y. Competition policy for technological innovation in an era of knowledge-based economy. Knowl.-Based Syst. 2008, 21, 826–832. [Google Scholar] [CrossRef]
- Zaidi, A.R.; Qazi, N.; Hassan, N.; tu Zehra, F.; Malokani DK, A.K.; Amjad, A. Innovative urban policies in the post-development era: Insights from East Asia. J. Posit. Sch. Psychol. 2023, 7, 195–207. [Google Scholar]
- Zhang, J.X.; Cheng, J.W.; Philbin, S.P.; Ballesteros-Perez, P.; Skitmore, M.; Wang, G. Influencing factors of urban innovation and development: A grounded theory analysis. Environ. Dev. Sustain. 2023, 25, 2079–2104. [Google Scholar] [CrossRef] [PubMed]
- Pilot: New York City a Roadmap to Make New York City the Global Hub of Urban Innovation. Available online: https://edc.nyc/sites/default/files/2023-11/Pilot-NYC-Report-11-10-2023.pdf (accessed on 26 November 2023).
- Lu, C.; Chen, M.; Tian, G. Spatial-temporal evolution and influencing factors of urban green innovation efficiency in China. J. Environ. Public Health 2022, 2022, 4047572. [Google Scholar] [CrossRef] [PubMed]
- Feng, S.; Kong, Y.; Liu, S.; Zhou, H. Study on the Spatio-Temporal Evolution and Influential Factors of Green Innovation Efficiency in Urban Agglomerations of China. Sustainability 2022, 15, 676. [Google Scholar] [CrossRef]
- Chen, K.; Guan, J. Measuring the efficiency of China’s regional innovation systems: Application of network data envelopment analysis (DEA). Reg. Stud. 2012, 46, 355–377. [Google Scholar] [CrossRef]
- Cullinane, K.; Wang, T.F.; Song, D.W.; Ji, P. The technical efficiency of container ports: Comparing data envelopment analysis and stochastic frontier analysis. Transp. Res. Part A Policy Pract. 2006, 40, 354–374. [Google Scholar] [CrossRef]
- Hsu, Y. Cross national comparison of innovation efficiency and policy application. Afr. J. Bus. Manag. 2011, 5, 1378. [Google Scholar]
- Guan, J.; Zuo, K. A cross-country comparison of innovation efficiency. Scientometrics 2014, 100, 541–575. [Google Scholar] [CrossRef]
- Wang, S.; Fan, J.; Zhao, D.; Wang, S. Regional innovation environment and innovation efficiency: The Chinese case. Technol. Anal. Strateg. Manag. 2016, 28, 396–410. [Google Scholar] [CrossRef]
- Chen, W.; Si, W.; Chen, Z.M. How technological innovations affect urban eco-efficiency in China: A prefecture-level panel data analysis. J. Clean. Prod. 2020, 270, 122479. [Google Scholar] [CrossRef]
- Ying, S.; Fang, Q.; Ji, Y. Research on green innovation efficiency measurement and influencing factors in the three major coastal urban agglomerations in China. Front. Environ. Sci. 2023, 11, 1276913. [Google Scholar] [CrossRef]
- Zhang, Y.; Cui, M. Determining the innovation efficiency of resource-based cities using a relational network dea model: Evidence from China. Extr. Ind. Soc. 2020, 7, 1557–1566. [Google Scholar] [CrossRef]
- Hu, B.; Yuan, K.; Niu, T.; Zhang, L.; Guan, Y. Study on the spatial and temporal evolution patterns of green innovation efficiency and driving factors in three major urban agglomerations in China—Based on the perspective of economic geography. Sustainability 2022, 14, 9239. [Google Scholar] [CrossRef]
- Castells, M. Local and global: Cities in the network society. Tijdschr. Voor Econ. En Soc. Geogr. 2002, 93, 548–558. [Google Scholar] [CrossRef]
- Taylor, P.; Derudder, B. World City Network: A Global Urban Analysis; Routledge: London, UK, 2015. [Google Scholar]
- Sassen, S. Global Networks, Linked Cities; Routledge: New York, NY, USA, 2002. [Google Scholar]
- Yu, X.D.; Wang, X.Y.; Chang, J.; Cheng, Q.P. Four Major International Trends in the Development of Regional Innovation Integration and Their Implications. Available online: https://www.163.com/dy/article/FR8KOPEB0511D98B.html (accessed on 31 May 2024).
- Dutta, S.; Lanvin, B.; Wunsch-Vincent, S.; León, L.R. Global Innovation Index 2022: What Is the Future of Innovation-Driven Growth? Available online: https://www.wipo.int/edocs/pubdocs/en/wipo-pub-2000-2022-en-main-report-global-innovation-index-2022-15th-edition.pdf (accessed on 31 May 2024).
- Gao, Y.; Scherngell, T.; Neuländtner, M. Drivers for inter-city innovation networks across Chinese cities: Modelling physical versus intangible effects. Chin. Geogr. Sci. 2024, 1–16. [Google Scholar] [CrossRef]
- Yu, H.; Ke, H.; Ye, Y.; Fan, F. Agglomeration and flow of innovation elements and the impact on regional innovation efficiency. Int. J. Technol. Manag. 2023, 92, 229–254. [Google Scholar] [CrossRef]
- Sheng, Y.; Zhao, J.; Zhang, X.; Song, J.; Miao, Y. Innovation efficiency and spatial spillover in urban agglomerations: A case of the Beijing-Tianjin-Hebei, the Yangtze River Delta, and the Pearl River Delta. Growth Chang. 2019, 50, 1280–1310. [Google Scholar] [CrossRef]
- Fan, F.; Lian, H.; Wang, S. Can regional collaborative innovation improve innovation efficiency? An empirical study of Chinese cities. Growth Change 2020, 51, 440–463. [Google Scholar] [CrossRef]
- Wang, Q.; Chen, Y.; Guan, H.; Lyulyov, O.; Pimonenko, T. Technological innovation efficiency in China: Dynamic evaluation and driving factors. Sustainability 2022, 14, 8321. [Google Scholar] [CrossRef]
- Wu, J.; Sun, W. Regional Integration and Sustainable Development in the Yangtze River Delta, China: Towards a Conceptual Framework and Research Agenda. Land 2023, 12, 470. [Google Scholar] [CrossRef]
- Zhang, Y.; Song, R.; Zhang, K.; Wang, T. The characteristics and modes of urban network evolution in the Yangtze River Delta in China from 1990 to 2017. IEEE Access 2021, 9, 5531–5544. [Google Scholar] [CrossRef]
- Brenner, T.; Broekel, T. Methodological issues in measuring innovation performance of spatial units. Ind. Innov. 2011, 18, 7–37. [Google Scholar] [CrossRef]
- Acs, Z.J.; Anselin, L.; Varga, A. Patents and innovation counts as measures of regional production of new knowledge. Res. Policy 2002, 31, 1069–1085. [Google Scholar] [CrossRef]
- Liu, H.; Fan, J.; Zhou, K. Development pattern of scientific and technological innovation and typical zone in China based on the analysis of scale and efficiency. Geogr. Res. 2018, 37, 910–924. [Google Scholar]
- Liu, S.; Du, D.; Qin, X.; Hou, C. Spatial-temporal pattern and influencing factors of China’s innovation efficiency based on innovation value chain. Sci. Geogr. Sin. 2019, 39, 173–182. [Google Scholar]
- Fan, F.; Lian, H.; Wang, X.; Wang, S. Threshold effect of regional collaborative innovation on innovation performance. Sci. Geogr. Sin. 2020, 40, 165–172. [Google Scholar]
- Bai, J.; Jiang, F. Synergy innovation, spatial correlation and regional innovation performance. Econ. Res. J. 2015, 50, 174–187. [Google Scholar]
- Gao, W.; Chou, J. Innovation efficiency, global diversification, and firm value. J. Corp. Financ. 2015, 30, 278–298. [Google Scholar] [CrossRef]
- Nagaoka, S.; Motohashi, K.; Goto, A. Patent statistics as an innovation indicator. In Handbook of the Economics of Innovation; North-Holland: Oxford, UK, 2010; Volume 2, pp. 1083–1127. [Google Scholar]
- Ponta, L.; Puliga, G.; Manzini, R. A measure of innovation performance: The Innovation Patent Index. Manag. Decis. 2021, 59, 73–98. [Google Scholar] [CrossRef]
- Liu, J.; Lu, K.; Cheng, S. International R&D spillovers and innovation efficiency. Sustainability 2018, 10, 3974. [Google Scholar] [CrossRef]
- Kalapouti, K.; Petridis, K.; Malesios, C.; Dey, P.K. Measuring efficiency of innovation using combined Data Envelopment Analysis and Structural Equation Modeling: Empirical study in EU regions. Ann. Oper. Res. 2020, 294, 297–320. [Google Scholar] [CrossRef]
- Chen, Y.; Li, X.; Li, W. Analysis on Determinants and Spatiotemporal Heterogeneity of Science and Technology Innovation Efficiency at Chinese Provincial Level. China Soft Sci. 2021, 137–149. [Google Scholar]
- Kang, L.; Song, Z. Research Framework and Empirical Study of Input-output Efficiency of Resources and Environment in China. Sci. Geogr. Sin. 2020, 40, 1868–1877. [Google Scholar]
- Zhu, L.; He, R.; Zheng, W. Study on Spatial-Temporal Pattern and Driving Factors of Urban Innovation Efficiency of Urban Agglomeration in the Middle Reaches of Yangtze River. Resour. Environ. Yangtze Basin 2019, 28, 2279–2288. [Google Scholar]
- Wu, F.; Fu, X.; Zhang, T.; Wu, D.; Sindakis, S. Examining whether government environmental regulation promotes green innovation efficiency—Evidence from China’s Yangtze River economic belt. Sustainability 2022, 14, 1827. [Google Scholar] [CrossRef]
- Chen, Y. Impact of foreign direct investment on regional innovation capability: A case of China. J. Data Sci. 2007, 5, 577–596. [Google Scholar] [CrossRef]
- Castells, M. The Rise of the Network Society; Blackwell: Oxford, UK, 1996. [Google Scholar]
- Xu, L. Measurement of innovation efficiency in the Yangtze River Delta urban agglomeration. Stat. Decis. 2021, 84–87. [Google Scholar]
- Cheng, G. Data Envelopment Analysis Method with MaxDEA Software; Intellectual Property Publishing House: Beijing, China, 2014. [Google Scholar]
- Cao, X.; Zeng, G.; Zou, L. Spatial Differentiation of Input-Output Efficiency of R&D Resources in Case of Yangtze River Delta Urban Agglomeration. Econ. Geogr. 2015, 35, 104–111. [Google Scholar]
- Rong, T.; Zhao, Z. Empirical Study on Regional Innovation Efficiency and Financial Support. Stat. Decis. 2015, 31, 159–162. [Google Scholar]
- Lee, C.Y. The Differential Effects of Public R&D Support on Firm R&D: Theory and Evidence from Multi-Country Data. Technovation 2011, 31, 256–269. [Google Scholar]
- Li, Z.; Yang, S. Fiscal Decentralization, Government Innovation Preferences and Regional Innovation Efficiency. J. Manag. World 2018, 34, 29–42. [Google Scholar]
- Anselin, L. Spatial Econometrics: Methods and Models; Kluwer Academic Publishers: Dordrecht, The Netherlands, 1988; p. 284. [Google Scholar]
- Bathelt, H.; Malmberg, A.; Maskell, P. Clusters and Knowledge: Local Buzz, Global Pipelines and the Process of Knowledge Creation. Prog. Hum. Geogr. 2004, 28, 31–56. [Google Scholar] [CrossRef]
- Jiang, L.; Ji, M. Foreign Direct Investment, Knowledge Spillovers and Regional Innovation of Yangtze River Delta—An Empirical Study Based on Panel Data. Sci. Technol. Econ. 2011, 24, 68–72. [Google Scholar]

| Cities | Comprehensive Efficiency | Pure Technical Efficiency | Scale Efficiency |
|---|---|---|---|
| Shanghai | 0.432 | 1.000 | 0.432 |
| Nanjing | 1.000 | 1.000 | 1.000 |
| Wuxi | 0.280 | 0.282 | 0.994 |
| Changzhou | 0.369 | 0.374 | 0.987 |
| Suzhou | 0.431 | 1.000 | 0.431 |
| Nantong | 0.334 | 0.338 | 0.987 |
| Yangzhou | 0.424 | 0.432 | 0.980 |
| Zhenjiang | 0.414 | 0.416 | 0.997 |
| Yancheng | 0.409 | 0.416 | 0.984 |
| Taizhou | 0.388 | 0.397 | 0.978 |
| Hangzhou | 0.449 | 0.630 | 0.713 |
| Ningbo | 0.358 | 0.358 | 0.999 |
| Wenzhou | 0.379 | 0.431 | 0.878 |
| Huzhou | 0.773 | 0.774 | 0.999 |
| Jiaxing | 0.432 | 0.441 | 0.979 |
| Shaoxing | 0.252 | 0.253 | 0.997 |
| Jinhua | 0.368 | 0.394 | 0.934 |
| Zhoushan | 0.506 | 0.611 | 0.828 |
| Taizhou | 0.302 | 0.313 | 0.963 |
| Hefei | 0.529 | 0.786 | 0.673 |
| Wuhu | 1.000 | 1.000 | 1.000 |
| Maanshan | 0.493 | 0.518 | 0.953 |
| Tongling | 0.285 | 0.318 | 0.898 |
| Anqing | 1.000 | 1.000 | 1.000 |
| Chuzhou | 0.765 | 0.771 | 0.993 |
| Chizhou | 0.969 | 1.000 | 0.969 |
| Xuancheng | 0.455 | 0.504 | 0.902 |
| Average Value | 0.511 | 0.584 | 0.905 |
| Innovation Inputs | Comprehensive Efficiency | |||
|---|---|---|---|---|
| High Efficiency | Medium Efficiency | Low Efficiency | ||
| Input Scale | High Input | Nanjing | Hefei, Hangzhou, Shanghai, Suzhou, Yangzhou | Changzhou, Ningbo, Wuxi, Nantong |
| Medium Input | Wuhu, Huzhou | Jiaxing, Zhenjiang, Yancheng | Taizhou, Wenzhou, Taizhou, Shaoxing | |
| Low Input | Chuzhou, Anqing, Chizhou | Zhoushan, Maanshan, Xuancheng | Jinhua, Tongling | |
| Variables | Variable Definition | Expected Impact | |
|---|---|---|---|
| Local socio-economic characteristics | Economic base | Gross domestic product per capita (CNY) | Positive |
| Financial support | Balance of deposits and loans from financial institutions at the end of the year (CNY 10,000) | Positive | |
| Human capital | The number of university college students enrolled per ten thousand people (individuals) | Positive | |
| Government participation | The proportion of science and technology expenditure in local government financial expenditure (%) | Negative | |
| Openness | Proportion of actual utilization of foreign capital to regional GDP (%) | Positive | |
| Inter-city connection characteristics | Investment connection | Network-weighted centrality based on the headquarter–branch investment network of A-share-listed firms | Positive |
| Population connection | Network-weighted centrality based on Baidu migration data | Positive | |
| Variables | Mean | Median | Standard Deviation | Variance | |
|---|---|---|---|---|---|
| Urban socio-economic characteristics | Economic base | 0.4706 | 0.4590 | 0.2849 | 0.0812 |
| Financial support | 0.1275 | 0.0717 | 0.2009 | 0.0403 | |
| Human capital | 0.2293 | 0.1780 | 0.2188 | 0.0479 | |
| Government participation | 0.2949 | 0.2785 | 0.1924 | 0.0370 | |
| Openness | 0.2429 | 0.1757 | 0.2407 | 0.0579 | |
| Inter-city connection characteristics | Investment connection | 0.1656 | 0.0918 | 0.2157 | 0.0465 |
| Population connection | 0.2628 | 0.1589 | 0.2554 | 0.0652 | |
| Variables | OLS | SLM | SEM | |
|---|---|---|---|---|
| Local socio-economic characteristics | Economic base | −0.4549 ** (0.1995) | −0.4743 *** (0.1672) | −0.2975 *** (0.1132) |
| Financial support | −0.1049 (0.8632) | 0.1044 (0.7121) | 0.4830 (0.6716) | |
| Human capital | 0.3989 (0.2835) | 0.3928 * (0.2310) | 0.3531 ** (0.1683) | |
| Government participation | −0.1718 (0.3005) | −0.1813 (0.2480) | −0.5640 ** (0.2242) | |
| Openness | 0.1578 (0.2228) | 0.2337 (0.1842) | 0.4336 *** (0.1544) | |
| Urban connection characteristics | Investment connection | −0.4429 (0.8887) | −0.8076 (0.7483) | −1.2140 (0.6429) |
| Population connection | 0.6376 (0.4821) | 0.7803 * (0.3984) | 0.8659 *** (0.2811) | |
| Constant | 0.5651 *** (0.0937) | 0.6738 *** (0.1269) | 0.5314 *** (0.0563) | |
| ρ | / | −0.2429 | / | |
| λ | / | / | −0.8861 *** | |
| R2 | 0.4780 | 0.5074 | 0.6345 | |
| LogL | 9.8736 | 10.4851 | 12.3519 | |
| AIC | −3.7471 | −2.9701 | −8.7038 | |
| SC | 6.6196 | 8.6924 | 1.6629 | |
Disclaimer/Publisher’s Note: The statements, opinions and data contained in all publications are solely those of the individual author(s) and contributor(s) and not of MDPI and/or the editor(s). MDPI and/or the editor(s) disclaim responsibility for any injury to people or property resulting from any ideas, methods, instructions or products referred to in the content. |
© 2024 by the authors. Licensee MDPI, Basel, Switzerland. This article is an open access article distributed under the terms and conditions of the Creative Commons Attribution (CC BY) license (https://creativecommons.org/licenses/by/4.0/).
Share and Cite
Yang, C.; Xue, S.; Gao, P.; Guo, X. Examining the Impact of Urban Connectivity on Urban Innovation Efficiency: An Empirical Study of Yangtze River Delta in China. Sustainability 2024, 16, 5647. https://doi.org/10.3390/su16135647
Yang C, Xue S, Gao P, Guo X. Examining the Impact of Urban Connectivity on Urban Innovation Efficiency: An Empirical Study of Yangtze River Delta in China. Sustainability. 2024; 16(13):5647. https://doi.org/10.3390/su16135647
Chicago/Turabian StyleYang, Chuankai, Shuaijun Xue, Peng Gao, and Xu Guo. 2024. "Examining the Impact of Urban Connectivity on Urban Innovation Efficiency: An Empirical Study of Yangtze River Delta in China" Sustainability 16, no. 13: 5647. https://doi.org/10.3390/su16135647