Article

Analysis of the Spatiotemporal Evolution and Driving Mechanisms of Impervious Surfaces along the Jiaozhou Bay (China) Coast over the Past Four Decades

1
College of Geodesy and Geomatics, Shandong University of Science and Technology, Qingdao 266590, China
2
Key Laboratory of Submarine Geosciences and Second Institute of Oceanography, Ministry of Natural Resources, Hangzhou 310012, China
3
College of Earth Science and Engineering, Shandong University of Science and Technology, Qingdao 266590, China
4
Key Laboratory of Marine Geology and Environment, Institute of Oceanology, Chinese Academy of Sciences, Qingdao 266071, China
5
Shandong Provincial Geo-Mineral Engineering Exploration Institute, Jinan 250014, China
*
Authors to whom correspondence should be addressed.
Sustainability 2024, 16(13), 5659; https://doi.org/10.3390/su16135659
Submission received: 7 June 2024 / Revised: 26 June 2024 / Accepted: 29 June 2024 / Published: 2 July 2024

Abstract

:
Impervious surfaces serve as critical indicators for monitoring urbanization processes and assessing urban ecological conditions. The precise extraction and analysis of the spatiotemporal variations in impervious surfaces are essential for informing urban planning strategies. The unique location advantage of Jiaozhou Bay makes it an important urban gathering area. Based on Landsat remote sensing image data, the extraction effect and accuracy of urban built-up area index, biophysical index, and random forest classification were compared and analyzed. Then, the optimal random forest method was used to extract impervious water information from 8 Landsat satellite images of the coastal area of Jiaozhou Bay from 1986 to 2022. Over the past four decades, the impervious surface area in the Jiaozhou Bay coastal region has expanded dramatically from 71.53 km2 in 1986 to 1049.16 km2 in 2022, with the most significant increase, nearly doubling, occurring between 2011 and 2017. Spatially, the distribution of impervious surfaces has expanded progressively from coastal to inland areas and from central to peripheral zones, particularly toward the southwest in Huangdao District and Jiaozhou City. The distribution of impervious surfaces in the Jiaozhou Bay coastal area is primarily confined to flat and gently sloping nearshore regions due to natural constraints like terrain slope. Concurrently, policy initiatives, along with population and economic growth, have catalyzed the rapid expansion of these surfaces. These insights are invaluable for comprehending the urban spatiotemporal dynamics and patterns along the Jiaozhou Bay coast and offer fresh perspectives for research into urban transformations and the sustainable development of ecological environments in other coastal regions.

1. Introduction

Impervious surfaces are defined as materials that, under the influence of natural or anthropogenic factors, isolate groundwater and decelerate its infiltration into the soil, thus modifying surface runoff velocities and patterns of material deposition [1]. In ecological contexts, impervious surfaces are typically urban anthropogenic features such as roofs, parking lots, and concrete or asphalt roads that prevent water from percolating into the soil [2]. The rapid development of urbanization in coastal areas has changed the existing land use and land cover [3], making many natural landscapes dominated by green vegetation gradually replaced by impervious surface. Furthermore, the expansion of impervious surfaces serves as an indicator of the extent of urban construction land, reflecting the rate of urbanization and providing a measure of urban ecological quality [4]. However, the proliferation of impervious surfaces contributes to several environmental challenges, including urban heat islands, urban flooding, degradation of aquatic ecosystems, and drought. Therefore, effectively obtaining accurate and reliable spatial and temporal distributions and evolution characteristics of urban impervious surfaces, and analyzing their patterns and driving mechanisms, are essential for supporting dynamic urbanization monitoring, scientific urban planning, and the protection and sustainable development of ecological environments. This provides significant research and practical value.
Remote sensing technology, with its extensive monitoring coverage and rapid data acquisition capabilities, is extensively employed in the extraction and analysis of impervious surfaces. Different sensors can be selected according to different spatial scales, such as MODIS, Sentinel, Quick Bird, Landsat, etc. Landsat data have medium spatial resolution and are easy to obtain, which is widely used in urban impervious surface extraction. The primary methods for extracting impervious surfaces via remote sensing include manual interpretation [5,6,7], spectral mixture analysis [8,9,10], index-based methods [11,12,13,14], decision tree models [15,16], regression models [17,18,19], and machine learning classifications [20,21,22]. These methods have their limitations. Manual interpretation is subjective and prone to errors with limited scope [5]. Spectral mixture analysis, while successful in extracting impervious surfaces in some regions, struggles to discern details within medium-to-low spatial resolution remote sensing data and in acquiring adequate pure end-members, potentially reducing accuracy [23]. The index method, although straightforward, utilizes band arithmetic to enhance impervious surface information for extraction, yet it does not accurately reflect the true abundance of impervious surfaces [24].
Machine learning approaches, in contrast, are flexible and efficient, automatically enhancing through experiential learning with high accuracy in managing complex data sources, thus providing distinct advantages in extracting impervious surface information at urban scales [25]. Zhang employed the random forest model to extract impervious surfaces from high-resolution remote sensing imagery of Tianjin, effectively minimizing misclassifications and omissions, achieving high accuracy [26]. Gao et al. applied random forest and support vector machine methods to extract impervious surfaces from remote sensing imagery of Hohhot. Their findings indicate that random forest classification offers superior accuracy compared to support vector machines, enhancing urban impervious surface extraction [27].
The extraction of impervious water information can be used to analyze the urban development form [28]. Zhang et al. extracted the impervious water surface information of Zhoushan City by using the impervious water surface index and analyzed its time series changes [29]. Wang et al. selected impervious water surface data of Chongqing’s main urban area in different periods from 1995 to 2020 and studied the spatiotemporal variation characteristics and driving factors of impervious water surface based on methods such as extended change measurement index, quadrant analysis, landscape pattern index and geographic detector [30].
The unique location advantage of the Bay area makes it an important urban agglomeration area. Jiaozhou Bay is home to a major port with significant capacity, around which an industrial cluster has formed, driving the economic, social, and cultural advancements in Qingdao. Since the initiation of economic reforms, the development of coastal areas near Jiaozhou Bay has accelerated, underscoring the importance of extracting and analyzing impervious surfaces in these regions. However, research on impervious surfaces in this region has predominantly centered on their extraction and spatiotemporal evolution [16,31], with limited discussion on the driving factors behind their expansion. Considering that the Jiaozhou Bay area is located in the temperate monsoon area, the warm and rainy climate keeps drying and warming in the monsoon season (June–September) [32], thus affecting the change of land cover and the extraction of impervious surface. Therefore, this paper selects Landsat images with dense vegetation and good quality from June to September to extract impervious water surface information in the coastal area of Jiaozhou Bay in the recent 40 years by using the random forest method and focuses on exploring its spatiotemporal variation characteristics and driving mechanism. This research provides essential monitoring indicators for Qingdao’s urbanization and ecological development and serves as a reference for “sponge city” planning, crucial for protecting the marine environment and sustaining regional development around Jiaozhou Bay. Section 2 describes the study area, data sources, and methodologies for data processing and analysis; Section 3 addresses the extraction and analysis of the spatiotemporal characteristics of impervious surfaces; Section 4 delves into the driving mechanisms of impervious surface evolution; the conclusion comprises the final section. The research flowchart for this study is depicted in Figure 1.

2. Materials and Methods

2.1. Overview of the Study Area

Jiaozhou Bay, situated in the central Yellow Sea along the southern shore of the Shandong Peninsula in China, is a semi-enclosed bay with an eastern outlet, characterized by its trumpet-like shape, positioned from 120°04′ to 120°23′ E longitude and 35°18′ to 36°18′ N latitude. Jiaozhou Bay is entirely administered by Qingdao in Shandong Province, encompassing Huangdao District, Jiaozhou City, Jimo District, Chengyang District, Laoshan District, Licang District, Shibei District, and Shinan District (refer to Figure 2). The terrain of the region rises on the northern and southern flanks while being depressed in the center, predominantly comprising mountainous and plain areas. Situated in the northern temperate monsoon zone, Qingdao experiences a temperate monsoon climate, moderated by the marine environment, and is marked by distinct maritime climatic features, including humid air, abundant rainfall, moderate temperatures, and well-defined seasons [16]. In 2016, Qingdao was designated as a pilot for China’s “Sponge City” initiative, actively advancing the development of sponge city infrastructure. Qingdao, as the most economically advanced city in Shandong Province and a central hub within the Bohai Economic Rim, has experienced rapid urbanization, especially in the coastal areas of Jiaozhou Bay, driven by supportive policies and economic factors.

2.2. Data Sources

This study primarily utilizes Landsat remote sensing satellite imagery from the Jiaozhou Bay area, sourced from China’s Geospatial Data Cloud (https://www.gscloud.cn/, accessed on 2 June 2023) and the United States Geological Survey (https://earthexplorer.usgs.gov/, accessed on 3 June 2023). A total of 8 years of remote sensing image data were collected in 1986, 1991, 1995, 2000, 2005, 2011, 2017, and 2022. The datasets from 1986, 1991, 1995, 2000, 2005, and 2011 consist of Landsat 5 TM imagery, while those from 2017 and 2022 are derived from Landsat 8 OLI imagery. In order to minimize interference from atmospheric conditions and bare soil in extracting impervious surfaces, imagery with cloud cover less than 10% and relatively dense vegetation from June to October was selected. Detailed parameters are listed in Table 1. In addition, the topographic data used came from the China Geospatial Data Cloud, and the socio-economic data came from the Qingdao Statistical Yearbook data.

2.3. Research Methods

This study primarily utilizes Landsat remote sensing imagery, comparing three extraction methods to optimally extract impervious surface information for spatiotemporal analysis.

2.3.1. Extraction Method

Index Method

  • Built-Up Area Index Method (BUAI)
When pixels associated with construction land represent impervious surfaces, their spectral features display a positive Normalized Difference Built-up Index (NDBI) and a negative Normalized Difference Vegetation Index (NDVI). The difference between these indices enhances the construction land information, facilitating impervious surface extraction. Li et al. considered the relationship between NDBI and NDVI for impervious surfaces and developed a new model for their extraction, the Urban Built-Up Area Index (BUAI) [33]:
N D B I = M i r N i r M i r + N i r ,
N D V I = N i r R e d N i r + R e d ,  
B U A I = N D B I N D V I ,
where M i r represents mid-infrared band reflectance, and N i r represents near-infrared band reflectance.
To mitigate confusion between water bodies and impervious surfaces, water bodies are pre-masked using the Modified Normalized Difference Water Index (MNDWI) before calculations. The formula is M N D W I = G r e e n     M i r G r e e n   +   M i r , where G r e e n denotes green light band reflectance.
2.
Biophysical Composite Index Method (BCI)
Deng et al. introduced the Biophysical Composite Index (BCI) for the extraction of impervious surfaces, designed to effectively represent the primary biophysical components within urban environments, adhering to Ridd’s conceptual V-I-S triangle model [34]. The index comprises three components derived from tassel cap transformation, calculated using the formula:
I B = T 1   +   T 3 2 T 2 T 1   +   T 3 2 + T 2 ,
Here, T 1 , T 2 , and T 3 correspond to the brightness, greenness, and wetness components, respectively, in the tassel cap transformation.
The BCI is formulated on the principle that brightly colored impervious surfaces exhibit high T 1 values, darkly colored impervious surfaces show high T 3 values, and vegetation displays high T 2 values. Owing to the potential confusion between dark-colored impervious surfaces and water bodies, it is necessary to exclude aquatic areas from the imagery prior to calculation. Within the BCI, impervious surfaces are indicated by higher positive values, vegetation by lower negative values to differentiate it from other land cover types, and bare soil appears with values close to zero, facilitating its separation from impervious surfaces.

Random Forest Classification Method (RF)

The Random Forest (RF) classification is a machine learning approach developed by Breiman L [35], incorporating his Bagging ensemble learning theory [36] and Ho T K’s concept of random subspaces [37]. The Random Forest classification method effectively addresses overfitting, requires fewer model parameters, and achieves high classification accuracy. It is extensively applied in areas such as remote sensing image classification, regression analysis, impervious surface extraction, and mapping of surface water bodies [38,39,40]. The methodology proceeds as follows:
  • Training Sample Selection. Utilize visual interpretation to select 200 impervious and 250 non-impervious surface samples for training the Random Forest model. Continually refine the training set to maintain representativeness without excessive sampling.
  • Configuration of Model Parameters. Establish key parameters for the Random Forest model, including the number of decision trees (K) and features per split node (m). Based on the Out-of-Bag (OOB) error theory, increasing the number of decision trees enhances classification accuracy at the expense of greater computational time and memory. This study adopts K = 100 and m = 1 after extensive testing.
  • Single-temporal Impervious Surface Extraction. Input single-temporal remote sensing imagery into the trained Random Forest model to extract impervious surface data.

2.3.2. Change Analysis Methods

Spatial Changes

The Mean Center and the Standard Deviational Ellipse (SDE) are effective indicators for assessing the overall spatial expansion direction of impervious surfaces within the study area [41]. The Mean Center quantifies central tendency, identifies the density center of geographic features, and facilitates the analysis of distribution changes and comparisons among different types of feature distributions. The formula for the Mean Center is expressed as:
X ¯ = i = 1 n X i n ,   Y ¯ = i = 1 n Y i n ,
Here, X i and Y i represent the coordinates of feature i , and n denotes the number of features.
The Standard Deviational Ellipse, introduced by D. Welty Lefever in 1926, measures the distribution direction of geographic features. It employs parameters such as the deflection angle and the radii of the major and minor axes to characterize the spatial distribution of geographic features. The standard deviations along the X and Y axes are calculated using the Mean Center as the origin, defining the axes of the ellipse. The formula for the center of the ellipse is:
S D E X = i = 1 n ( X i X ¯ ) 2 n ,   S D E Y = i = 1 n ( Y i Y ¯ ) 2 n ,
Here, X ¯ and Y ¯ denote the coordinates of the Mean Center, with n representing the number of features.

Temporal Changes

Temporal changes in the impervious surfaces within the study area can be quantitatively analyzed using metrics such as the coverage ratio C I S , rate of change V , and the intensity of change A G R .
The coverage ratio C I S represents the proportion of the impervious surface area in a given year relative to the total regional area, with the formula:
C I S = X i Y ,
Here, X i refers to the impervious surface area in the i th year, and Y represents the total area of the region.
The rate of change V is defined as the average change in impervious surface area over n years; the intensity of change A G R is the ratio of this rate V to the impervious surface area in the base year, calculated using:
V = X n + i X i n ,   A G R = X n + i X i n X i × 100 % ,
Here, X n + i and X i correspond to the impervious surface areas in the ( n + i ) th and i th years, respectively.

2.3.3. Accuracy Assessment Model

Within the study area, 300 sample points are randomly generated; their attributes are determined through visual interpretation, and a confusion matrix is calculated. Accuracy is measured using overall accuracy O A , user accuracy U A , producer accuracy P A , F 1 score, and the K a p p a coefficient [42].
O A = i = 1 2 N i i N ,
U A = N 11 j = 1 2 N 1 j ,
P A = N 11 i = 1 2 N i 1 ,
F 1 = 2 × U A × P A U A + P A ,
K a p p a = O A P e 1 P e ,
P e = i = 1 2 a i × b i N × N ,
Here, N i i represents the number of correctly classified samples, N denotes the total sample count, N 11 indicates the number of samples where both the true and predicted classifications are impervious surfaces, j = 1 2 N 1 j represents the number of predicted impervious surface samples, i = 1 2 N i 1 denotes the number of true impervious surface samples, a i is the count of true samples for each class, and b i is the count of predicted samples for each class.

3. Results

3.1. Evaluation of Results and Accuracy for the Three Extraction Methods

To achieve optimal monitoring results of impervious surfaces across the entire study area, Huangdao District on the western coast of Jiaozhou Bay was initially selected as the experimental site. Based on the images of 2017, three typical classification methods, BUAI, BCI, and Random Forest, were used to extract impervious surface information, and regions such as village (Figure 3a), bare land (Figure 3b), and urban area (Figure 3c) were selected for detailed comparison. In Figure 3a, yellow polygons represent small, scattered villages, while black polygons represent larger villages and surrounding exposed farmland. BUAI and BCI failed to accurately differentiate between village buildings and surrounding farmland, classifying them all as impervious surfaces. In contrast, the Random Forest method accurately identified impervious surfaces within villages and classified farmland as pervious surfaces (Figure 3a-1–a-3). In Figure 4b, yellow polygons denote exposed bedrock, and black polygons denote exposed farmland. BUAI and BCI incorrectly classified some of these areas as impervious surfaces (Figure 3b-1,b-2), while the Random Forest method correctly identified them as non-impervious surfaces (Figure 3b-3). In Figure 3c, yellow polygons represent urban streets, and black polygons represent urban buildings. The Random Forest method was the most effective in extracting urban streets, while the BUAI method performed poorly in road extraction. The BCI method misclassified streets and surrounding non-impervious areas as impervious surfaces. Both BUAI and Random Forest methods performed better than the BCI method in extracting urban buildings (Figure 3c-1–c-3). Overall, the Random Forest method outperformed both BUAI and BCI methods in extracting impervious surfaces.
To advance the quantitative analysis of extraction accuracy among three methodologies, this study employs the Kappa coefficient, overall accuracy (OA), producer’s accuracy (PA), user’s accuracy (UA), and the F1 score as metrics for accuracy verification (refer to Table 2). The overall accuracy of each of the three methods surpasses 80%, notably, the BCI index method and the Random Forest classification method exhibit overall accuracies greater than 90%. Nevertheless, there is a substantial variance in Kappa coefficients: the BUAI index method records a Kappa coefficient of merely 56.30%, whereas the Random Forest classification method achieves the highest at 87.73%. A comprehensive comparison of visual interpretation and quantitative evaluation results for the three methods indicated that the Random Forest method exhibited the highest extraction accuracy. This is likely because the index methods experience more severe confusion between impervious surfaces and bare soil. Consequently, this study selects the Random Forest classification method for time series extraction of impervious surface information.

3.2. Analysis of Spatiotemporal Characteristics and Changes in Impervious Surfaces

Utilizing eight Landsat remote sensing satellite images from 1986 to 2022, detailed in Section 2.2, this study first conducted data preprocessing tasks including radiometric correction, atmospheric correction, image fusion, and cropping. Subsequently, the Random Forest classification method was employed to extract the time series information of impervious surfaces along the Jiaozhou Bay coastline. The overall extraction results and changes in spatiotemporal distribution are illustrated in Figure 4. Examination of the extraction results indicates that in areas free from clouds and with abundant vegetation, the Random Forest classification method performs effectively, optimally capturing the spatiotemporal distribution and evolutionary patterns of impervious surfaces.
Spatially, impervious surfaces are predominantly located around the coastal regions of Jiaozhou Bay. Areas such as the Southern and Northern Districts in the east-central region, Licang and Chengyang Districts in the central region, and Huangdao District in the south exhibit extensive distributions of impervious surfaces. Conversely, Laoshan District in the east, Jimo District in the north, and the southwestern areas of Huangdao District—farther from the Jiaozhou Bay coastline—feature less extensive distributions of impervious surfaces. Temporally, in 1986, impervious surfaces in the study area were relatively scarce, with some presence in central regions such as the Southern and Northern Districts, and a concentration in urban centers. Over time, by 2022, there was a notable increase in impervious surfaces, with extensive distributions near the shores of Jiaozhou Bay and in other urban centers.

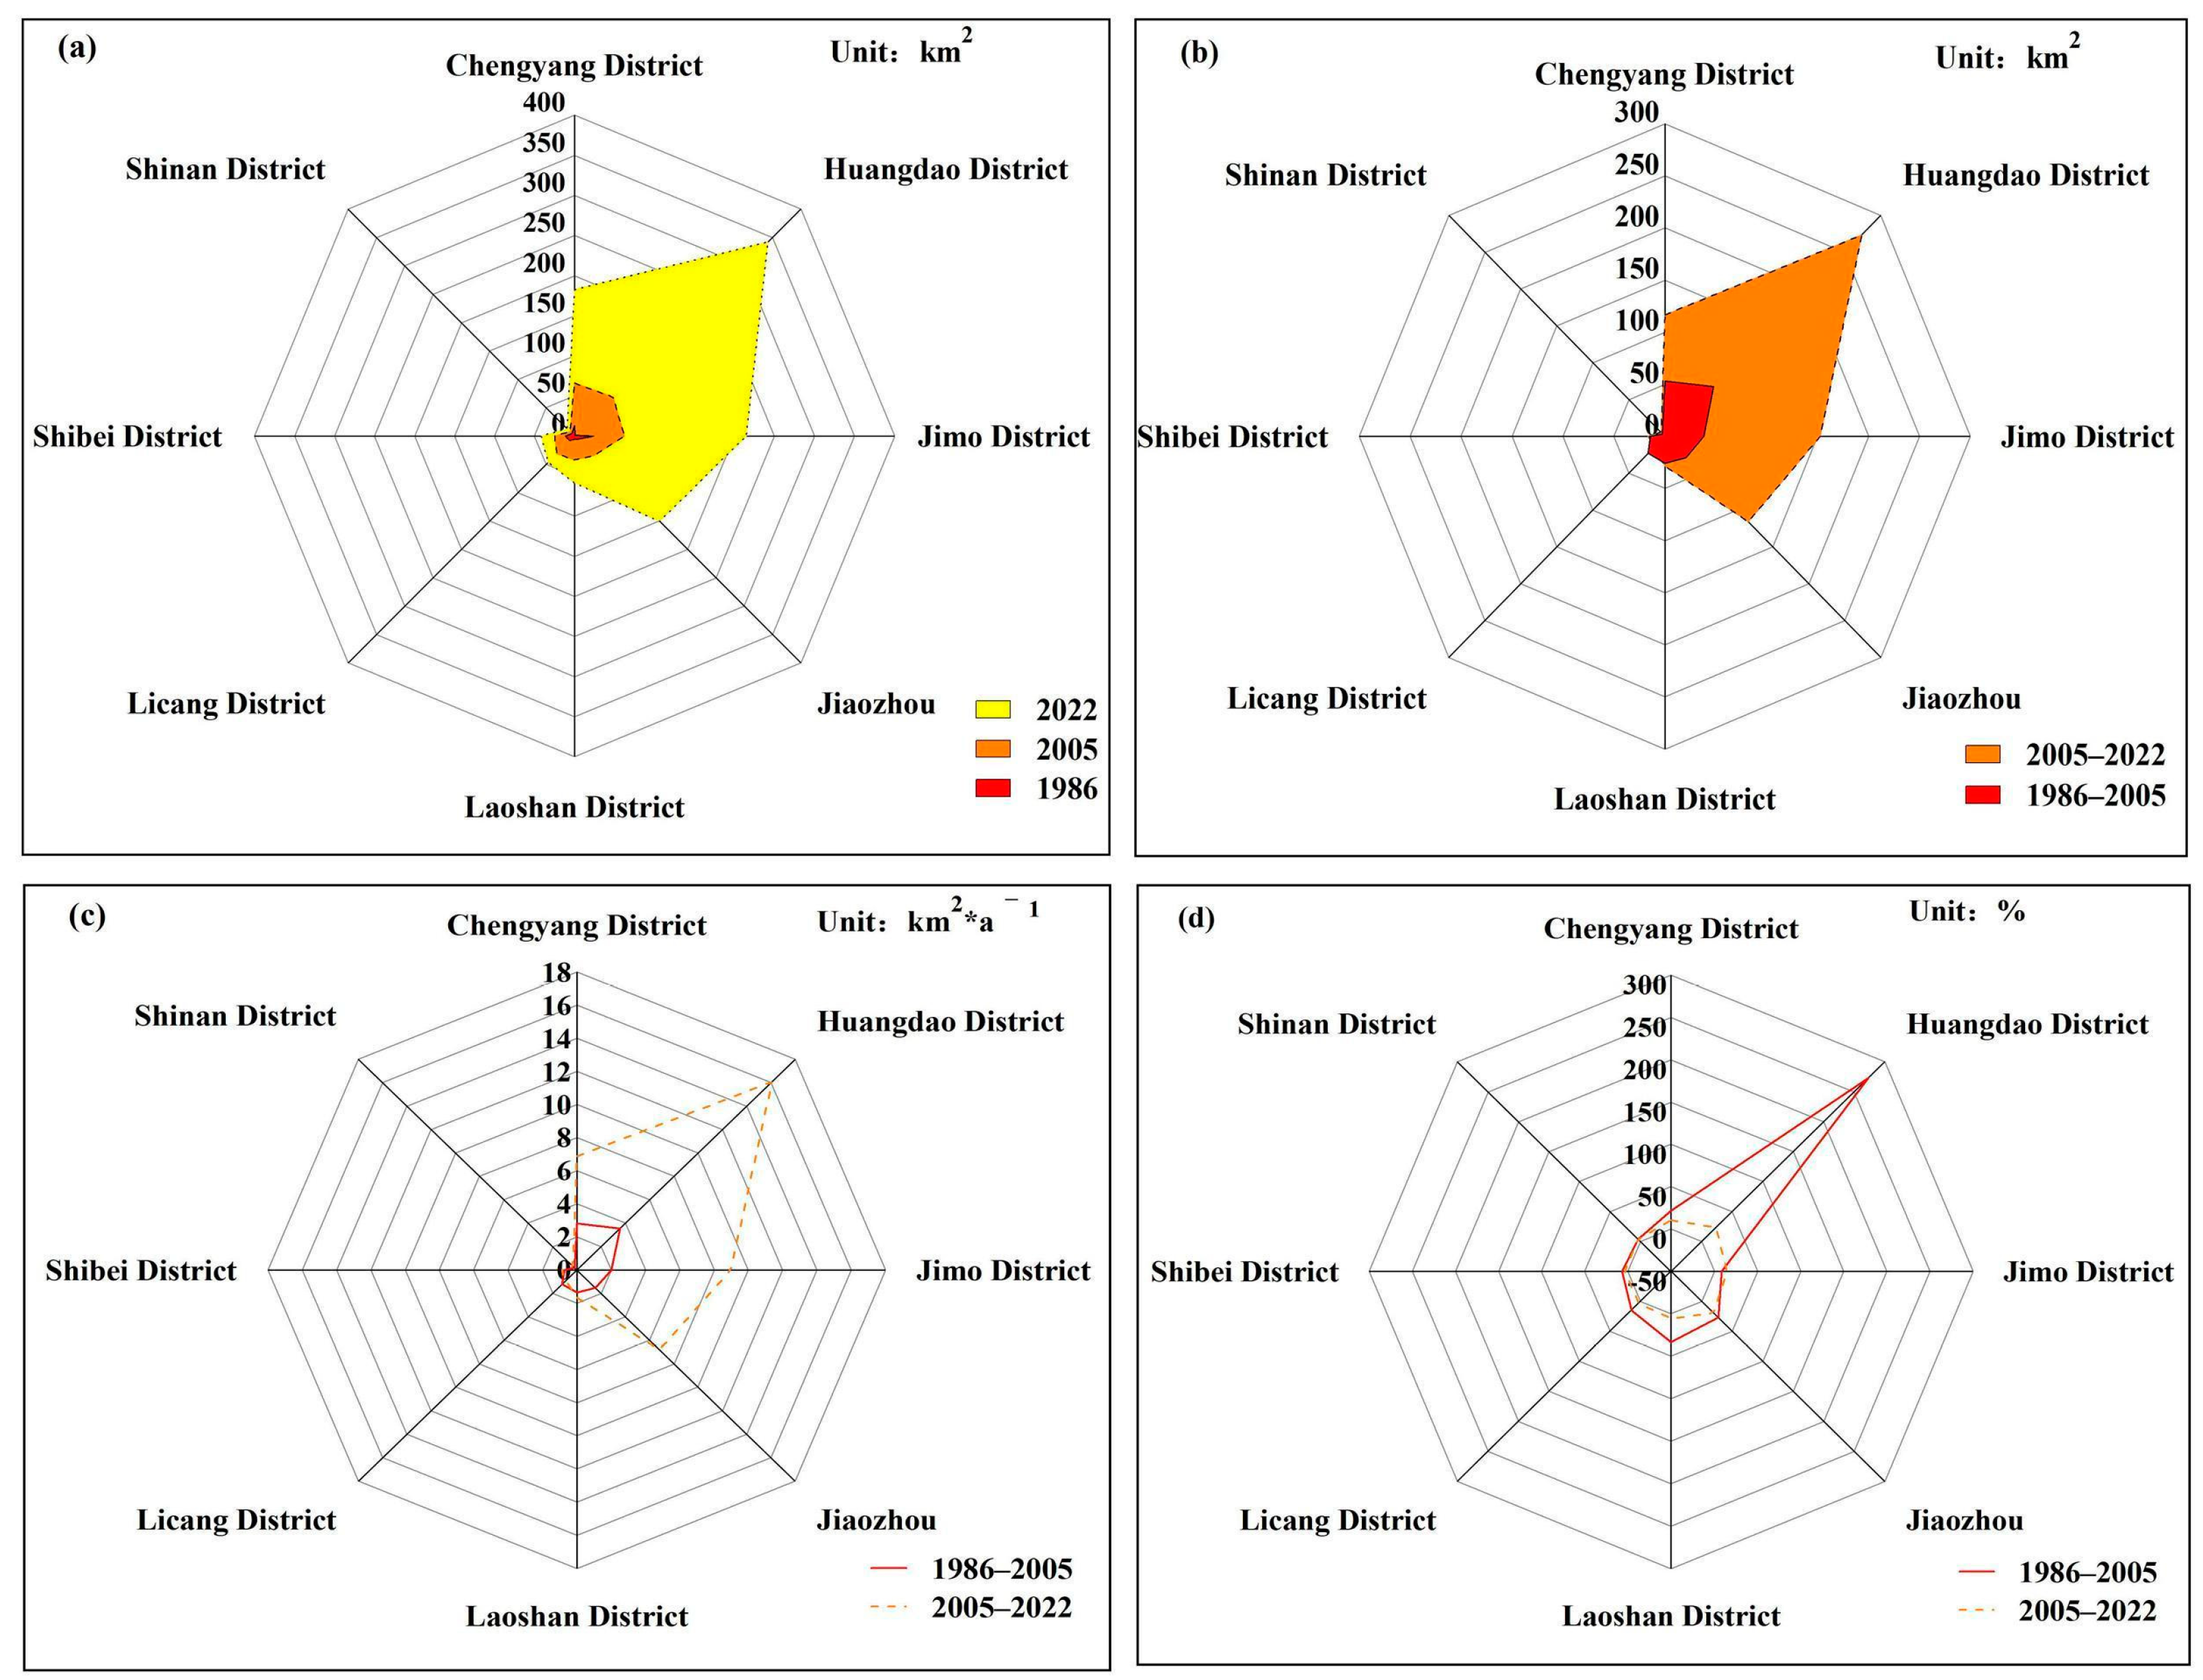
3.2.1. Spatial Variations in Impervious Surfaces

To investigate the spatial changes of impervious surfaces in the study area over the last 40 years, the average center and standard deviation ellipses of impervious surface distribution were calculated using the formulas presented in Section 2.3.3 As depicted in Figure 5 and Table 3, in 2017, the standard deviation ellipse for the study area exhibited maximum flatness, reflecting a concentrated and directionally pronounced distribution of impervious surfaces, primarily around the coastal region of Jiaozhou Bay. Between 1986 and 2022, both the average center and the standard deviation ellipse predominantly shifted in a southwestward direction, with impervious surfaces expanding towards Huangdao District. Particularly in the last decade, the marked migration of the ellipse indicates rapid development in Huangdao District and swift expansion of impervious surfaces. The shorter axes of the ellipses in 1995, 2000, and 2005 were more extensive, suggesting a dispersed distribution of impervious surfaces.
From 1986 to 2000, the gradual increase in the ellipse’s short axis indicated a dispersal trend in impervious surface distribution. Post-2000, the short axis progressively decreased, reaching its minimum in 2022, which signifies a strong centripetal consolidation of impervious surface distribution. Over the past 40 years, the short axis of the standard deviation ellipse for impervious surfaces has been notably small, demonstrating a strong centripetal trend in the data. This suggests a concentrated distribution of impervious surfaces primarily along the Jiaozhou Bay coast, which has been the focal area for urban development.
From 1986 to 2022, the expansion of impervious surfaces was principally centered around the Southern District, Northern District, Licang District, Chengyang District, and Huangdao District along the Jiaozhou Bay coast, gradually extending to adjacent towns; in the central-southern Jiaozhou area, impervious surfaces spread from the urban centers to the outlying towns. The overall trend of impervious surface expansion in the coastal areas of Jiaozhou Bay is characterized by a movement from coastal to inland areas and from central to peripheral regions, predominantly following an outward expansion model supplemented by infill processes (Figure 4 and Figure 5).

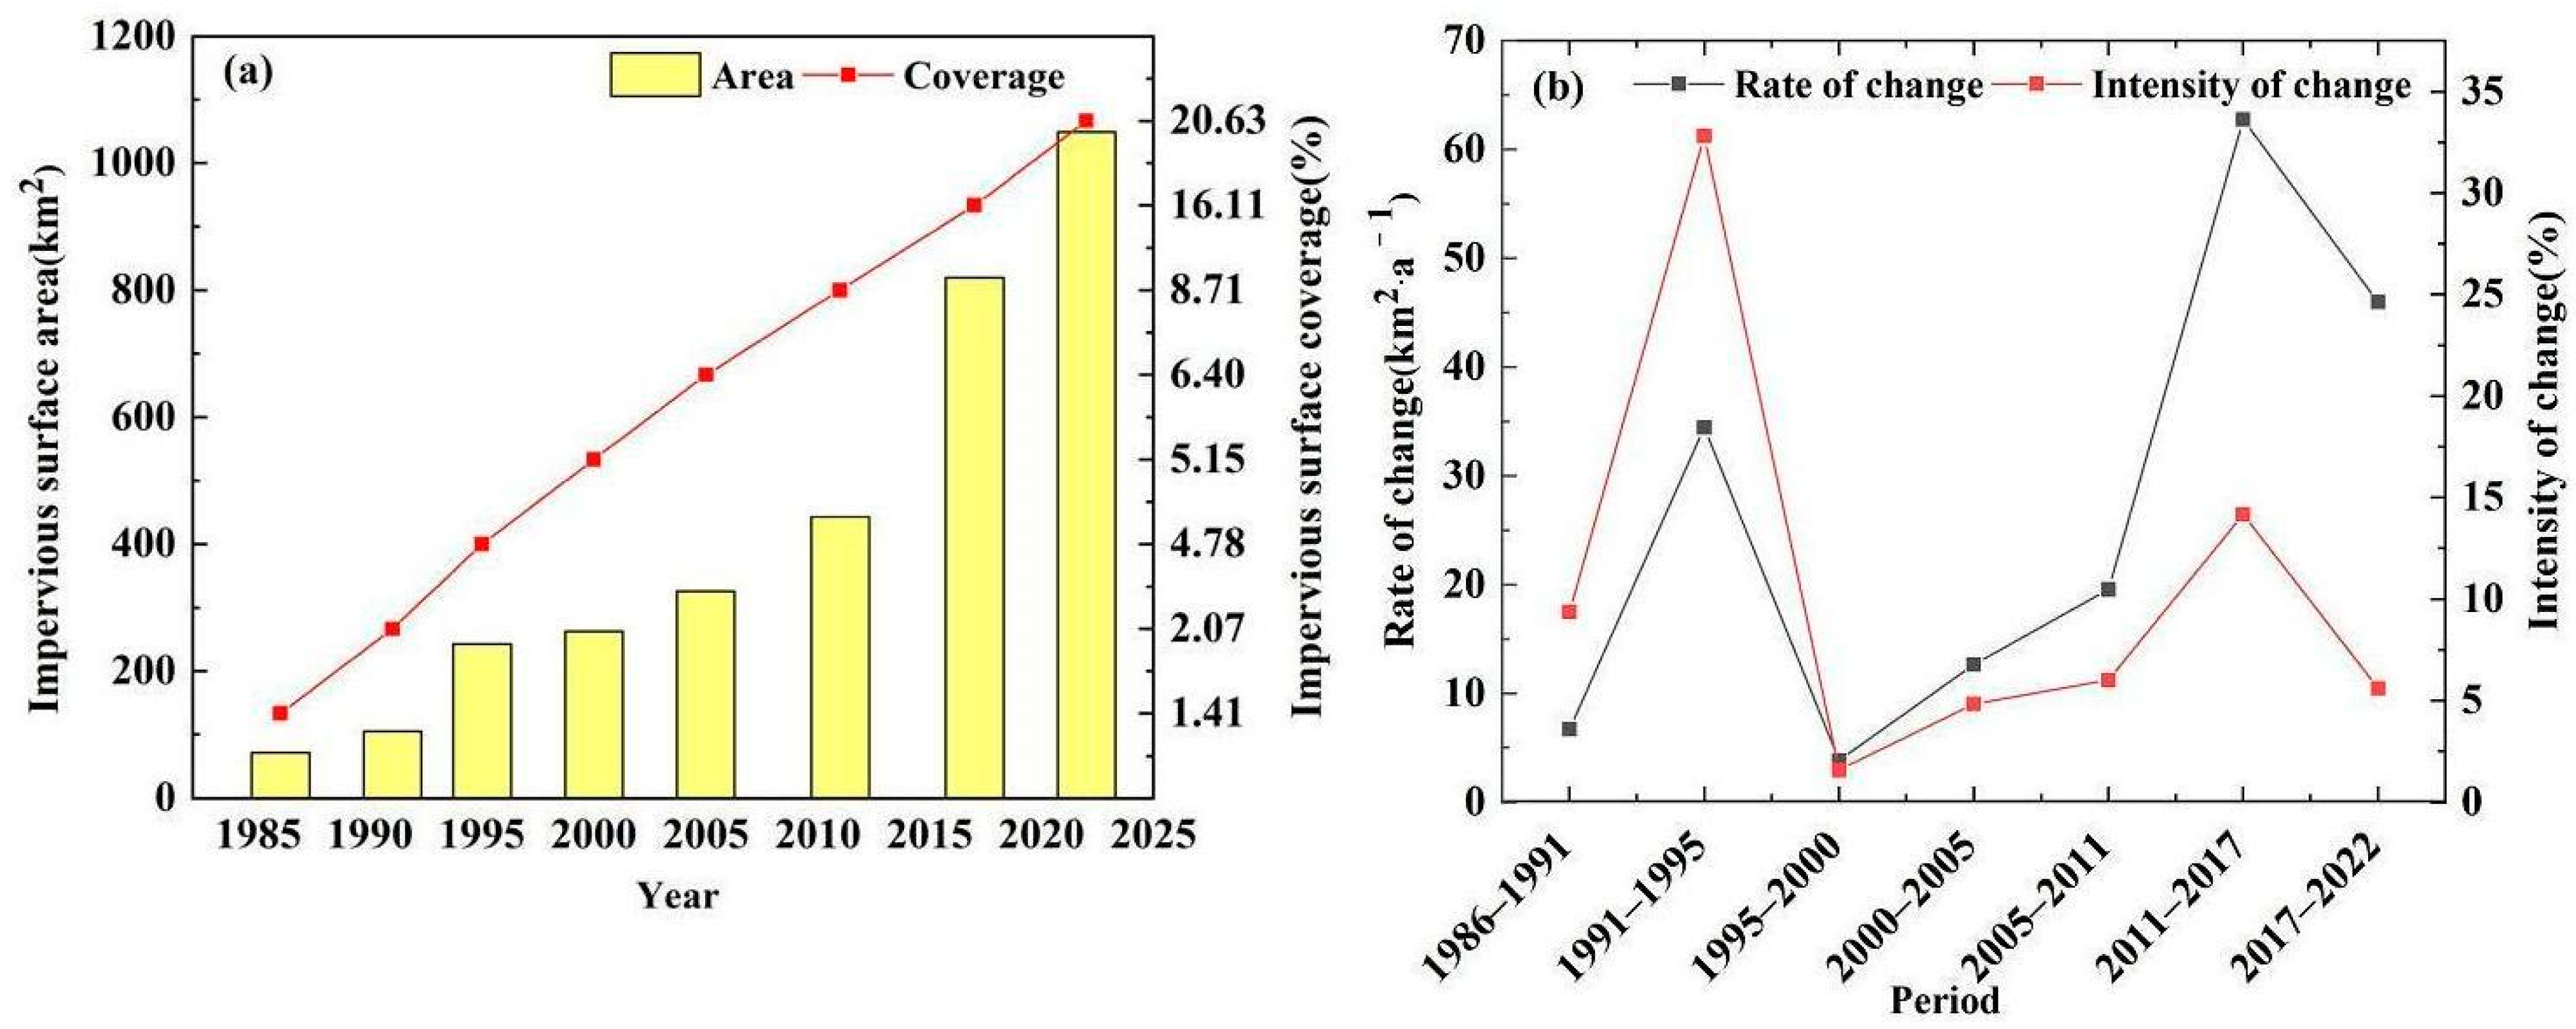
3.2.2. Temporal Dynamics of Impervious Surfaces

With urbanization progressing, the built-up areas along the Jiaozhou Bay coast have increased annually. This trend necessitates a time series analysis based on the monitoring of impervious surfaces from 1986 to 2022. The changes in area and coverage of impervious surfaces along the Jiaozhou Bay coast over the past 40 years are documented in Figure 6 and Table 4. The area of impervious surfaces along the Jiaozhou Bay coast expanded from 71.53 km2 in 1986 to 1049.16 km2 in 2022, increasing by 977.63 km2, a net growth of 13.67-fold. The coverage rate of impervious surfaces grew from 1.41% in 1986 to 20.63% in 2022. The period from 2011 to 2017 saw the fastest growth, rising from 8.71% to 16.11%, while in other periods, the rate of increase was more gradual.
Between 2011 and 2017, the change rate of impervious surfaces along the Jiaozhou Bay coast was notably high at 62.76 km2/year, compared to a much slower rate of 3.84 km2/year between 1995 and 2000. Generally, the change rate exceeded 10 km2/year in most periods, indicating rapid growth. From 1986 to 2022, the impervious surface area annually increased by an average of 27.16 km2, with an annual growth rate of 37.97%. The increased impervious surface area constituted 19.22% of the total area of the seven urban districts around Jiaozhou Bay. Notably, the period from 1991 to 1995 experienced the most significant intensity of change at 32.80% (Table 4). Overall, there has been an increasing trend in the proportion of impervious surfaces over the last 40 years.

4. Discussion

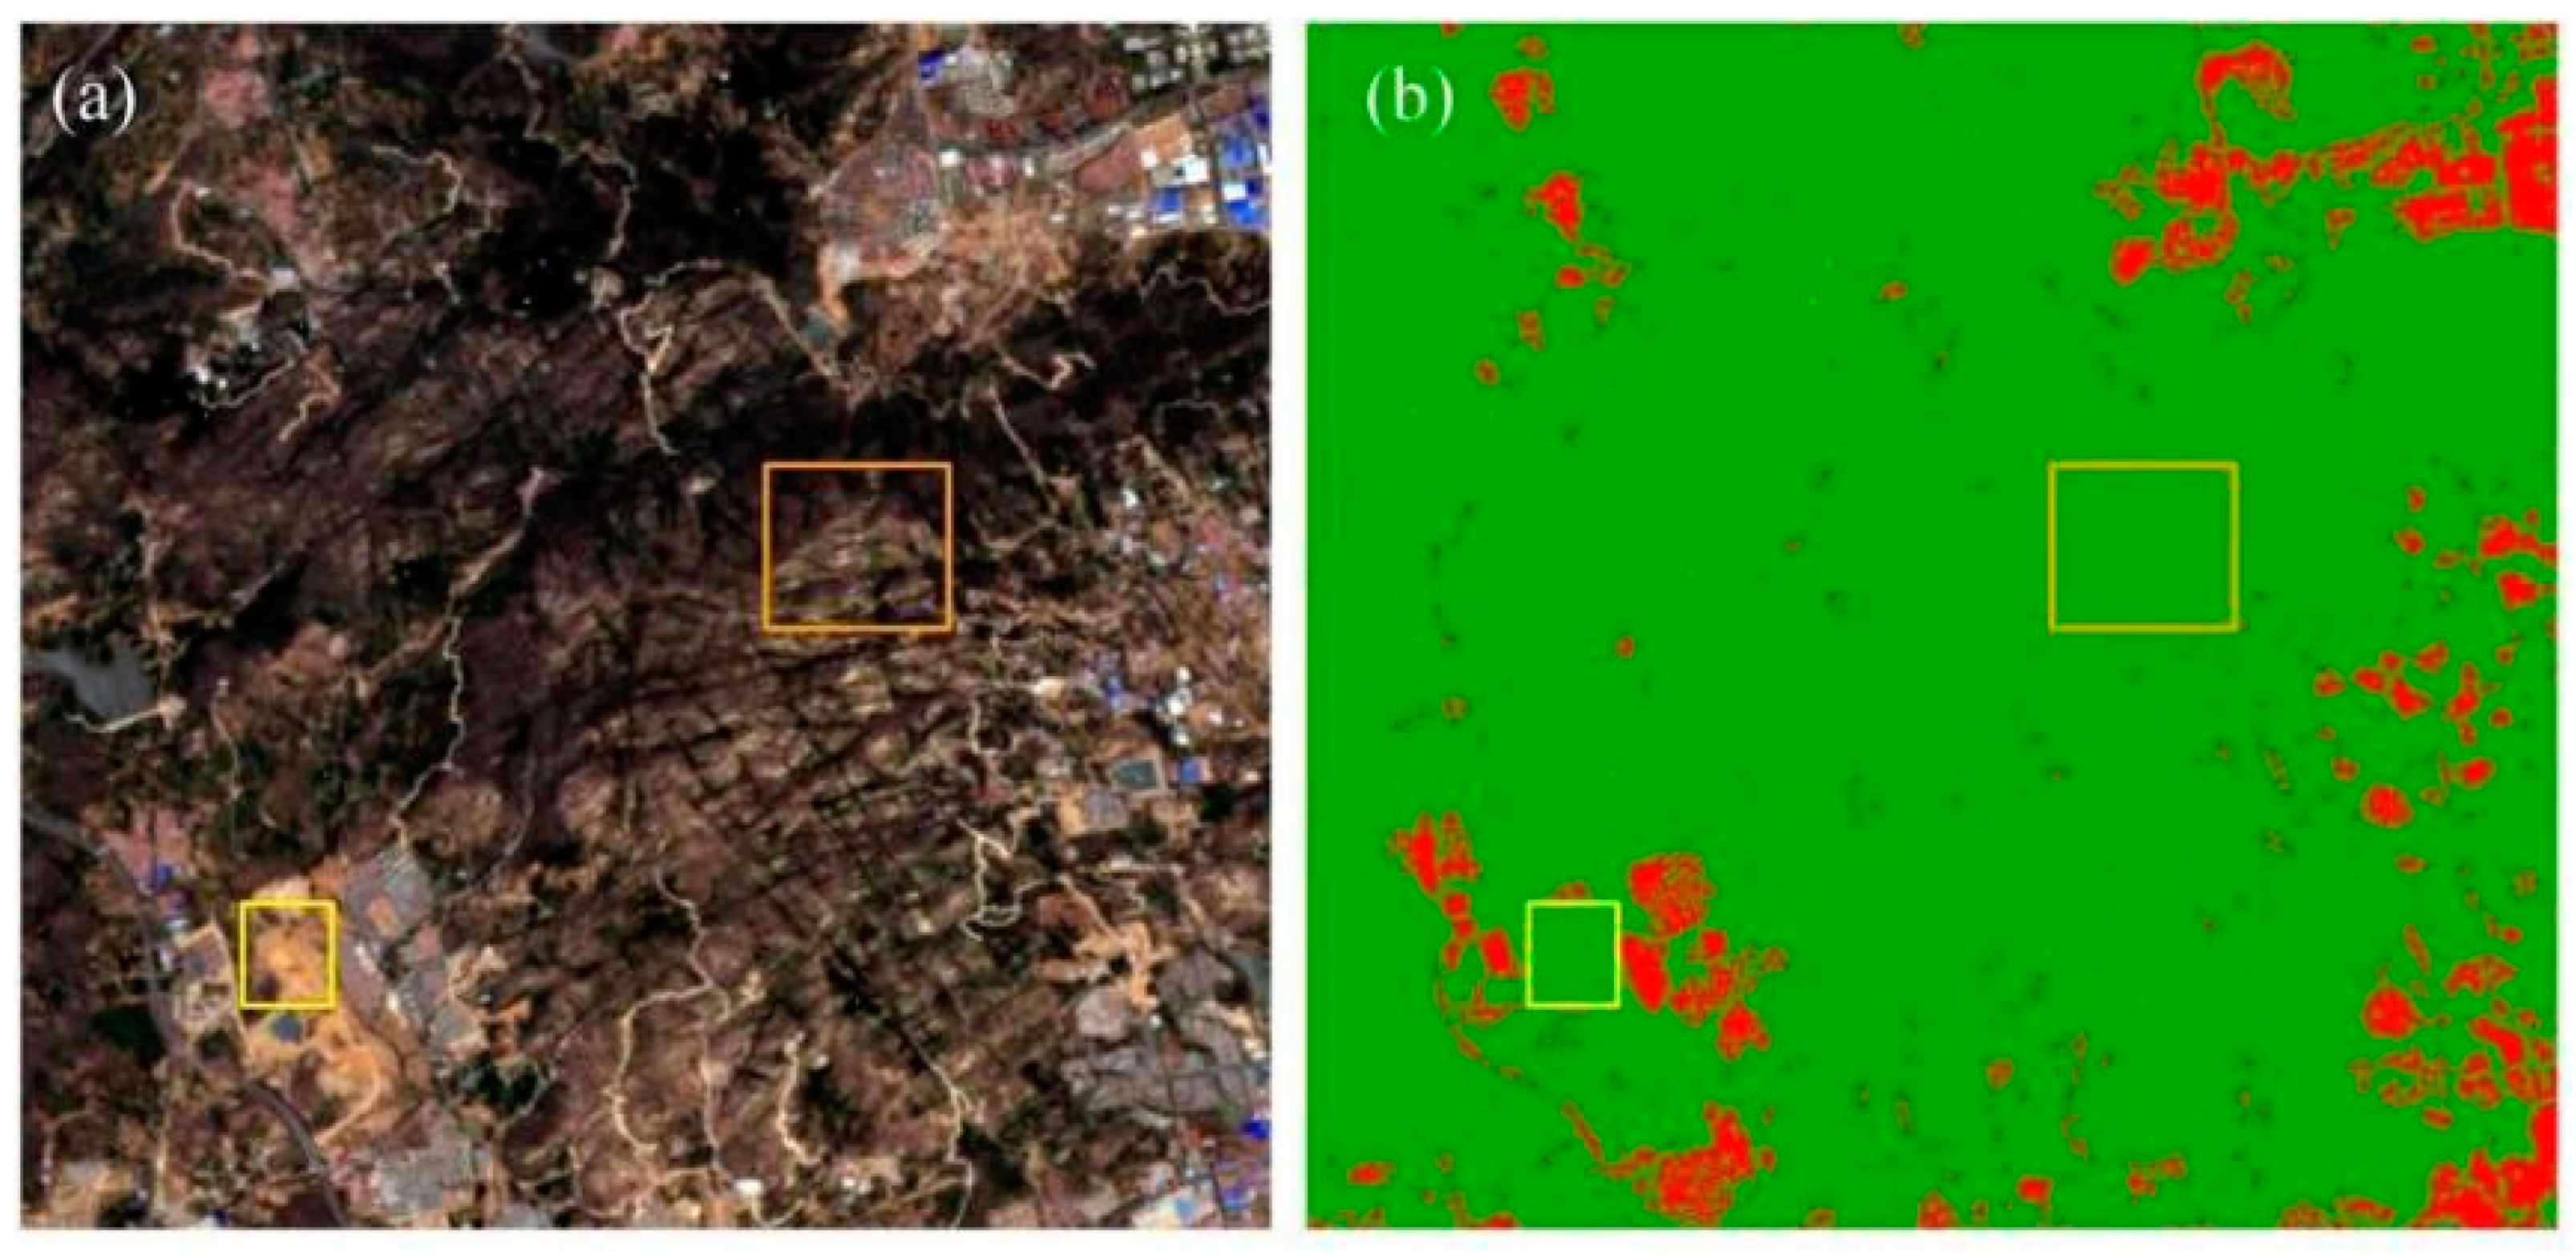
4.1. Influence of Bare Soil on the Extraction of Impervious Surfaces

Bare soil is categorized into natural and anthropogenic types. Natural bare soil primarily consists of exposed bedrock and uncultivated farmland, while anthropogenic bare soil includes construction sites and lands deliberately abandoned. Bare soil and low-albedo impervious surfaces share similar spectral characteristics, complicating their differentiation during the extraction process [43]. The spectral reflectance of bare soil varies with vegetation coverage and seasonal changes. Utilizing time series remote sensing imagery can effectively mitigate the impact of bare soil on the extraction of impervious surface information [44,45].
Different band combinations of remote sensing images will also affect the recognition of impervious surface and other ground objects. RGB321 true- and false-color images can be used for local class recognition. RGB432 simulates standard false-color images, rich feature images, bright, good level, vegetation shows red, used for vegetation classification, water recognition; RGB743 simulates true-color images, which is conducive to the identification of residential places. In order to obtain higher-quality results of impervious surface extraction, remote sensing images in summer or early autumn when vegetation is relatively lush from June to October were mainly used in this study. With the aid of image recognition in different bands such as RGB432 and RGB743, the impervious surface extraction analysis was carried out on the true- and false-color images of RGB321. The Random Forest classification method, compared to index-based methods, can adaptively modify training samples according to the distinct color and texture features of bare soil and other impervious surfaces. This facilitates the refinement of the classification model to effectively distinguish between bare soil and impervious surfaces, thereby enhancing the extraction of impervious surface information. Through our field verification, Figure 7a yellow polygon is artificial abandoned land in residential areas, and orange polygon is exposed bedrock. These bare soils are easily confused areas with impervious surfaces. It can be seen from Figure 7b that the random forest classification method can well classify these two types of bare soil into permeable water surface and successfully distinguish bare soil from impervious water surface. Consequently, the Random Forest classification method is particularly effective for extracting impervious surfaces from remote sensing images captured between June and October.

4.2. Overall Trends in Impervious Surface Changes

Over the past 40 years, the urban districts along the coast of Jiaozhou Bay have experienced significant changes in impervious surfaces. Chengyang District, Huangdao District, Jimo District, and Jiaozhou City have extensive areas of impervious surfaces that have expanded rapidly. Conversely, central city areas like Laoshan District, Licang District, Northern District, and Southern District have smaller areas of impervious surfaces with slower expansion rates. The area of impervious surfaces in each district has increased over time (Figure 8a). From 2005 to 2022, impervious surfaces along the Jiaozhou Bay coast expanded rapidly, with Huangdao District alone expanding by 273.30 km2. Certain areas saw annual growth rates exceeding 6 km2, indicative of rapid expansion (Figure 8b,c). From 1986 to 2005, Chengyang District, Huangdao District, Jimo District, and Jiaozhou City witnessed significant intensities in impervious surface changes, especially in Huangdao District, where the change intensity reached 273.02% (Figure 8d). From 2005 to 2022, the area of impervious surfaces in each district increased rapidly. Excluding the city center, all other areas experienced growth exceeding 100 km2, with annual change rates surpassing 5 km2/year (Table 5).
From 1986 to 2022, with ongoing urbanization, a substantial labor force migrated from rural to urban areas. Suburban regions, once abundant in vegetation like farmland, villages, and forests, were progressively replaced by impervious structures such as buildings and roads, leading to an expansion of urban areas. Human activities such as the construction of aquaculture ponds, salt fields, and land reclamation have prompted continual seaward expansion of the coastal regions of Jiaozhou Bay. The subsequent establishment of factories and industrial parks has further expanded the area of impervious surfaces along the coast. The extensive coverage by impervious surfaces has intensified the speed and volume of urban runoff, consequently exerting substantial pressure on municipal drainage systems and flood control measures. High-density impervious layers diminish the infiltration capacity of precipitation, thereby impacting groundwater recharge. The coverage, distribution, and changes of these surfaces exert both direct and indirect effects on various ecological and environmental factors.

4.3. Relationship between Impervious Surface Changes and Natural Factors

Natural factors significantly influence the spatial distribution and expansion of impervious surfaces. Favorable natural conditions facilitate the development of impervious surfaces, whereas unfavorable conditions constrain their distribution and expansion [46]. The coastal region of Jiaozhou Bay, adjacent to the ocean and hosting Shandong’s largest port, Qingdao Port, functions as a crucial international trade port and transit hub along the Yellow Sea basin and the western Pacific Rim [47]. The region’s flat terrain and accessible water and land transport networks support the aggregation and inland expansion of impervious surfaces.
Figure 9 illustrates that in the coastal area of Jiaozhou Bay, impervious surfaces predominantly occur on slopes between 0 and 5°, with over 80% situated on slopes under 10°, and lesser occurrences on slopes ≥15°. Generally, a higher slope corresponds to a smaller proportion of impervious surfaces. Areas with gentler coastal slopes form the foundation for higher densities and clustered distributions of impervious surfaces. In contrast, steeper slopes inhibit the expansion of impervious surfaces, leading to lower densities and fewer occurrences in areas with steep slopes. Thus, topography is the primary factor influencing the spatial distribution patterns of impervious surfaces in the coastal regions of Jiaozhou Bay.
Constrained by the terrain, impervious surfaces in the coastal areas of Jiaozhou Bay are primarily distributed in flat nearshore bay regions. Land reclamation activities such as salt field construction, bay filling and land creation, aquaculture pond enclosure, port construction, road development, and industrial expansion have led to the continuous expansion of impervious surface while significantly reducing the total area of the bay and tidal flats. The area of tidal wetlands has decreased from 96 km2 in 1986 to 58.97 km2 in 2010 [48]. The expansion of impervious surface has resulted in ongoing shrinkage of various natural wetlands along the coast of Jiaozhou Bay, causing detrimental effects on its ecological environment.

4.4. The Relationship between Impervious Surface Changes and Policy Factors

National policies that drive urban development and construction are crucial in influencing urbanization processes and are significant drivers of impervious surface expansion.
In 1994, Qingdao underwent a new round of administrative reorganization, significantly increasing the city’s urban area. This directly facilitated rapid development in the eastern urban districts, establishing an “eastward expansion, northward advancement, and westward crossing” urban spatial pattern. This pattern was a crucial driver behind the rapid expansion of impervious surfaces from 105.07 km2 to 242.92 km2 between 1991 and 1995. In 2012, the merger of the old Huangdao and Jiaonan cities into Huangdao District spurred rapid economic growth, population concentration, and urban construction. This development significantly influenced the expansion of impervious surfaces in the coastal areas of Jiaozhou Bay, particularly in Huangdao District, where the area increased from 442.68 km2 to 819.24 km2 between 2011 and 2017—an almost twofold increase. In 2017, the reorganization of Jimo from a city to a district enhanced its integration with the main urban area, resulting in a more seamless and increasingly dense interconnection of impervious surfaces between Jimo District and the main urban area. Overall, the spatiotemporal evolution of impervious surfaces in the coastal regions of Jiaozhou Bay aligns with the policy planning framework, highlighting the significant influence of policy factors on the expansion of impervious surfaces.

4.5. The Relationship between Impervious Surface Changes and Socio-Economic Factors

Economic development accelerates urbanization, serving as a crucial driving factor for the expansion of impervious surfaces. According to Figure 10a, the total GDP of the Jiaozhou Bay coastal area in 1986 was 11.85 billion yuan, which increased to 43.151 billion yuan by 1991, representing an annual growth rate of 6.26 billion yuan. In 1986, the total population of the Jiaozhou Bay coastal area was approximately 4.5588 million, increasing to about 4.6866 million by 1991, an annual increase of approximately 25,600 people. Between 1986 and 1991, the population and economic growth in the Jiaozhou Bay coastal area was relatively slow. During this period, the area of impervious surfaces expanded by 33.54 km2, with a modest annual growth rate of 9.38 km2. From 1991 to 2000, both population and economic growth accelerated, and the area of impervious surfaces significantly increased at a rate of 17.45 km2 per year. From 2000 to 2011, the total GDP of the Jiaozhou Bay coastal area surged from 95.113 billion yuan to 575.322 billion yuan, with an annual growth rate of 43.655 billion yuan. During this period, the area of impervious surfaces expanded from 242.92 km2 to 442.68 km2, nearly doubling, fueled by rapid economic development. From 2011 to 2022, both the population and economy of the Jiaozhou Bay coastal area experienced rapid growth, with the population rising from approximately 5.5511 million to 8.4397 million, and GDP increasing from 5753.22 billion yuan to 13409.19 billion yuan. Concurrently, the area of impervious surfaces expanded markedly from 442.68 km2 to 1049.16 km2, an increase of 606.48 km2—more than doubling at an annual growth rate of 55.13 km2.
From 1986 to 2022, the expansion of impervious surfaces in the Jiaozhou Bay coastal area was closely correlated with GDP and population growth, with a correlation coefficient (R2) exceeding 0.95, indicating a highly significant relationship. This demonstrates that economic and population growth significantly influenced the expansion of impervious surfaces in the area (Figure 10b,c). Over the past 40 years, the population in the Jiaozhou Bay coastal area has grown by approximately 3.881 million, an average annual growth rate of 2.4%. The GDP rose by 13,290.69 billion yuan, averaging an annual increase of 369.19 billion yuan. The area of impervious surfaces expanded by 977.63 km2, with an average annual increment of 27.16 km2. As an outward-facing gateway, the Jiaozhou Bay coastal region has attracted significant foreign investment and a substantial influx of labor to urban areas. The establishment of universities and innovative industrial parks has not only spurred rapid economic development but also increased the demand for green and construction lands, significantly enhancing the extent of impervious surfaces. The development of coastal cities and industries, the expansion of aquaculture ponds, and the intensification of agricultural production have led to a significant increase in impervious surfaces. Frequent human activities have resulted in the discharge of large amounts of wastewater into the coastal wetlands of Jiaozhou Bay, causing soil and water pollution in the wetlands. This has led to degradation of wetland vegetation, changes in the wetland landscape pattern, as well as exacerbating marine eutrophication and harmful algal blooms in nearshore wetlands [49].

5. Conclusions

This research concentrates on the coastal regions of Jiaozhou Bay, utilizing Landsat remote sensing imagery from the years 1986, 1991, 1995, 2000, 2005, 2011, 2017, and 2022. It integrates Geographic Information Systems (GISs) and remote sensing techniques to investigate the spatiotemporal dynamics and underlying drivers of impervious surface expansion.
The extraction accuracy of impervious surfaces was compared using the BUAI index, BCI index, and Random Forest classification method. The Random Forest approach demonstrated superior performance, achieving an overall accuracy of 95% and a Kappa coefficient of 87.73%, surpassing the other methodologies. The Random Forest classification method facilitates optimal extraction of time series data for impervious surfaces along the Jiaozhou Bay coast.
Over the last four decades, there has been a significant expansion of impervious surfaces in the coastal regions of Jiaozhou Bay. Initially, the distribution of impervious surface was concentrated along the coast of Jiaozhou Bay, and the urbanization development was mainly along the coast of Jiaozhou Bay. From 1986 to 2022, the impervious surface area in the coastal regions of Jiaozhou Bay expanded by 977.63 km2, indicating rapid growth. This expansion accelerated from 2011 to 2022, following a comparatively slower growth rate from 1986 to 2011.
Within the study area, both natural and socio-economic factors—including policy, economy, and demographics—play significant roles in influencing the expansion of impervious surfaces along the coast of Jiaozhou Bay. The spatial distribution and expansion of impervious water surface are mainly restricted by topography. The higher the slope, the less impervious the water surface proportion. At the same time, socio-economic factors will promote the development and expansion of impervious waters.

Author Contributions

Conceptualization, P.M. and Y.L. (Yilin Liu); methodology, P.M, Y.L. (Yilin Liu) and X.H.; software, P.M., Y.L. (Yun Liu) and R.H.; validation, X.G. and X.C.; formal analysis, X.H. and X.C.; investigation, P.M. and L.Z.; resources, X.H.; data curation, X.H.; writing—original draft preparation, P.M.; writing—review and editing, Y.L. (Yilin Liu) and X.H.; visualization, X.G. and Y.L. (Yun Liu); supervision, X.H. and X.C.; project administration, X.H. and X.C.; funding acquisition, Y.L. (Yilin Liu), X.H., X.C. and L.Z. All authors have read and agreed to the published version of the manuscript.

Funding

This work is funded by the Open Fund of the Key Laboratory of Marine Geology and Environment, Chinese Academy of Sciences (Grant No. MGE2022KG1), National Natural Science Foundation of China (Grant Nos. 41706092, 42307255, 52201400, and U2244222), Hebei Natural Science Foundation (Grant No. D2023402033), and Shandong Provincial Natural Science Foundation (Grant Nos. ZR2022QD087 and ZR2022QD043).

Data Availability Statement

The data presented in this study are available upon request from the corresponding author.

Acknowledgments

We sincerely thank the United States Geological Survey (USGS) and the National Aeronautics and Space Administration (NASA) for the acquisition, management, and free distribution of Landsat remote sensing satellite imagery datasets (https://earthexplorer.usgs.gov/, accessed on 3 June 2023) used in this work.

Conflicts of Interest

The authors declare no conflicts of interest.

References

  1. Slonecker, E.T.; Jennings, D.B.; Garofalo, D. Remote Sensing of Impervious Surfaces: A Review. Remote Sens. Rev. 2001, 20, 227–255. [Google Scholar] [CrossRef]
  2. Luo, Z.Y.; Wang, M.Z.; Chen, W.J. Urban Impervious Surface Extraction and Its Effect on Water Environment. J. Xinyang Norm. Univ. 2016, 29, 148–151, (In Chinese with English Abstract). [Google Scholar] [CrossRef]
  3. Nath, A.; Koley, B.; Choudhury, T.; Saraswati, S.; Ray, B.C.; Um, J.-S.; Sharma, A. Assessing Coastal Land-Use and Land-Cover Change Dynamics Using Geospatial Techniques. Sustainability 2023, 15, 7398. [Google Scholar] [CrossRef]
  4. Xing, L.Z.; Zhang, F.M.; Kuang, Y.Q. Impervious Surface and Thermal Environment Effects in Sanya City Based on Remote Sensing. J. Sub- Trop. Resour. Environ. 2020, 15, 78–84, (In Chinese with English Abstract). [Google Scholar] [CrossRef]
  5. Li, W.F.; Ouyang, Z.Y.; Chen, Q.W.; Mao, J.Q. Study on the Spatial Pattern of Impervious Surface Using Remote Sensing Data within the Urban Area of Beijing. J. Remote Sens. 2008, 12, 603–612, (In Chinese with English Abstract). [Google Scholar]
  6. Huang, X.; Zhang, L.P.; Li, P.X. Classification of High Spatial Resolution Remotely Sensed Imagery Based upon Fusion of Multiscale Features and SVM. J. Remote Sens. 2007, 11, 48–54, (In Chinese with English Abstract). [Google Scholar]
  7. Zhai, J.; Xiao, T.; Yang, M.; Sung, C.X. Characteristics of Impervious Surface Changes across Coastal China. Resour. Sci. 2016, 38, 814–824, (In Chinese with English Abstract). [Google Scholar] [CrossRef]
  8. Li, S.Q.; Fu, B.H. Analyzing Temporal-spatial Change of Urumqi Impervious Surface Using Linear Spectral Mixture Analysis. Remote Sens. Technol. Appl. 2020, 35, 962–974. [Google Scholar]
  9. Phinn, S.; Stanford, M.; Scarth, P.; Murray, A.T.; Shyy, P.T. Monitoring the composition of urban environments based on the vegetation-impervious surface-soil (VIS) model by subpixel analysis techniques. Int. J. Remote Sens. 2002, 23, 4131–4153. [Google Scholar] [CrossRef]
  10. Yang, L.Y.; Chen, Y.B. Information Extraction and Analysis on Temporal and Spatial Pattern Changes of Surfaces Impervious to Water in Shenzhen City during 1979-2020. Bull. Soil Water Conserv. 2021, 41, 198–205, (In Chinese with English Abstract). [Google Scholar] [CrossRef]
  11. Xu, H.Q.; Wang, M.Y. Remote Sensing-based Retrieval of Ground Impervious Surfaces. J. Remote Sens. 2016, 20, 1270–1289, (In Chinese with English Abstract). [Google Scholar] [CrossRef]
  12. Xu, H.Q. A New Remote Sensing Index for Fastly Extracting Impervious Surface Information. Geomat. Inf. Sci. Wuhan Univ. 2008, 33, 1150–1153, (In Chinese with English Abstract). [Google Scholar]
  13. Yan, X.; Zhu, D.M.; Yang, R.S. A visible-band remote sensing index for extracting impervious surfaces. Trans. Chin. Soc. Agric. Eng. (Trans. CSAE) 2020, 36, 127–134, (In Chinese with English Abstract). [Google Scholar] [CrossRef]
  14. Ren, P.F.; Gan, S.; Xie, X.Q. Dynamic Analysis of Mountain City Impervious Surface Based on ETM+ Fused Image. Bull. Soil Water Conserv. 2013, 33, 109–112, (In Chinese with English Abstract). [Google Scholar] [CrossRef]
  15. Xiang, C.; Zhu, X.; Hu, D.Y. Monitoring the Impervious Surface with Multi-resource Remote Sensing Images in Beijing-Tianjin-Tangshan Urban Agglomeration in the Past Two Decades. J. Geo-Inf. Sci. 2018, 20, 684–693, (In Chinese with English Abstract). [Google Scholar] [CrossRef]
  16. Wu, X.; Guo, B.; Chen, Z.S.; Bin, G.; Zhongsheng, C.; Wenjiao, S. Spatio-temporal Dynamic Characterization of Impervious Surface in the Jiaozhou Bay Based on Landsat Imagery. Resour. Sci. 2018, 40, 2260–2269, (In Chinese with English Abstract). [Google Scholar] [CrossRef]
  17. Bauer, M.E.; Loffelholz, B.C.; Wilson, B. Estimating and Mapping Impervious Surface Area by Regression Analysis of Landsat Imagery. In Remote Sensing of Impervious Surfaces; CRC Press: Boca Raton, FL, USA, 2007; pp. 31–48. [Google Scholar]
  18. Gillies, R.R.; Box, J.B.; Symanzik, J.; Rodemaker, E.J. Effects of Urbanization on the Aquatic Fauna of the Line Creek Watershed, Atlanta-a Satellite Perspective. Remote Sens. Environ. 2003, 86, 411–422. [Google Scholar] [CrossRef]
  19. Li, X.N.; Zhang, Y.J.; She, Y.J. Estimation of Impervious Surface Percentage of River Network Regions Using An Ensemble Leaning of CART Analysis. Remote Sens. Land Resour. 2013, 25, 174–179, (In Chinese with English Abstract). [Google Scholar] [CrossRef]
  20. Sebari, I.; He, D. Automatic Fuzzy Object-based Analysis of VHSR Images for Urban Objects Extraction. ISPRS J. Photogramm. Remote Sens. 2013, 79, 171–184. [Google Scholar] [CrossRef]
  21. Tang, Z.G.; Deng, G.; Li, S.W.; Li, C.; Chen, H.; Peng, H. Study on the Spatiotemporal Variation of Impervious Surface in Hunan Province foe Nearly 30 Years Based on Google Earth Engine. Geogr. Geo-Inf. Sci. 2020, 36, 41–46, (In Chinese with English Abstract). [Google Scholar]
  22. Dixit, M.; Chaurasia, K.; Mishra, V.K.; Singh, D.; Lee, H.-N. 6+: A Novel Approach for Building Extraction from a Medium Resolution Multi-Spectral Satellite. Sustainability 2022, 14, 1615. [Google Scholar] [CrossRef]
  23. Sun, G.Y.; Chen, X.L.; Ren, J.C.; Zhang, A.; Jia, X. Stratified Spectral Mixture Analysis of Medium Resolution Imagery for Impervious Surface Mapping. Int. J. Appl. Earth Obs. Geoinf. 2017, 60, 38–48. [Google Scholar] [CrossRef]
  24. Li, D.R.; Luo, H.; Shao, Z.F. Review of Impervious Surface Mapping Using Remote Sensing Technology and Its Application. Geomat. Inf. Sci. Wuhan Univ. 2016, 41, 569–577+703. [Google Scholar] [CrossRef]
  25. Zhang, Y.C.; Li, Q.; Zang, Y.P. Research on Coastline Impervious Surface Extraction Method Based on Random Forest Model. Geospat. Inf. 2022, 20, 13–18+55+6, (In Chinese with English Abstract). [Google Scholar] [CrossRef]
  26. Zhang, Q. Extraction of Urban Impervious Surface Supported by Multi-source Remote Sensing Data: A Case Study of Tianjin. Eng. Surv. Mapp. 2023, 32, 69–75, (In Chinese with English Abstract). [Google Scholar] [CrossRef]
  27. Gao, Y.F.; Li, J.M.; Liu, D.W. Research on Extraction of Urban Impervious Surface Based on Random Forest Model: A Case Study in Hohhot. J. Glaciol. Geocryol. 2018, 40, 828–836, (In Chinese with English Abstract). [Google Scholar]
  28. Li, Y.M.; Yang, S.T.; Wu, B.W.; Liang, Y.; Meng, Y. Spatiotemporal evolution of impervious surface and the driving factors in Chenggong District, Kunming City. Remote Sens. Nat. Resour. 2022, 34, 136–143. [Google Scholar]
  29. Zhang, X.P.; Lu, Y.; Zhang, H.G.; Li, C.K. Remote sensing analysis of impervious surface changes in Zhoushan Islands during 1990–2011. Remote Sens. Land Resour. 2018, 30, 178–185. [Google Scholar]
  30. Wang, K.X.; Zhou, R. Urban impervious surface changes in main urban areas of Chongqing, China and associated driving forces for the period of 1995–2020. Mt. Res. 2023, 41, 521–531. [Google Scholar]
  31. Liu, C.X. Research on the Method and Application of Impervious Surface Extraction Based on Deep Learning Supported by Spectral Library: Taking Qingdao as an Example; Shandong University of Science and Technology: Qingdao, China, 2020; (In Chinese with English Abstract). [Google Scholar]
  32. Ullah, I.; Zeng, X.M.; Mukherjee, S.; Aadhar, S.; Mishra, A.K.; Syed, S.; Ayugi, B.O.; Iyakaremye, V.; Lv, H. Future amplification of multivariate risk of compound drought and heatwave events on South ASIAN population. Earth’s Future, 2023; 11, e2023EF003688. [Google Scholar] [CrossRef]
  33. Li, W.N. Study on Extraction Methods of Impervious Surface Information Extraction from Urban Area Using Remote Sensing; North University of China: Taiyuan, China, 2013; (In Chinese with English Abstract). [Google Scholar]
  34. Deng, C.B.; Wu, C.S. BCI: A Biophysical Composition Index for Remote Sensing of Urban Environments. Remote Sens. Environ. 2012, 127, 247–259. [Google Scholar] [CrossRef]
  35. Breiman, L. Random Forests. Mach. Learn. 2001, 45, 5–32. [Google Scholar] [CrossRef]
  36. Breiman, L. Bagging Predictors. Mach. Learn. 1996, 24, 123–140. [Google Scholar] [CrossRef]
  37. Ho, T.K. The Random Subspace Method for Constructing Decision Forests. IEEE Trans. Pattern Anal. Mach. Intell. 1998, 20, 832–844. [Google Scholar] [CrossRef]
  38. Pan, X.; Zhu, X.; Yang, Y.B.; Cao, C.; Zhang, X.; Shan, L. Applicability of Downscaling Land Surface Temperature by Using Normalized Difference Sand Index. Sci. Rep. 2018, 8, 236–248. [Google Scholar] [CrossRef] [PubMed]
  39. Yang, Y.B.; Chen, C.; Pan, X.; Li, X.; Zhu, X. Downscaling Land Surface Temperature in an Arid Area by Using Multiple Remote Sensing Indices with Random Forest Regression. Remote Sens. 2017, 9, 789. [Google Scholar] [CrossRef]
  40. Wang, L.L.; Zhang, X.Y. Analysis of Temporal and Spatial Evolution of Impervious Surface in Yellow River Diversion and Receiving Areas of Henan Province Based on Google Earth Engine. Yellow River 2022, 44, 76–80+86, (In Chinese with English Abstract). [Google Scholar]
  41. Yao, Z.X.; Meng, Q.Y.; Sun, Z.H.; Liu, S.; Zhang, L. Temporal and Spatial Correlation Between Impervious Surface and Surface Runoff: A Case Study of the Main Urban Area of Hangzhou City. J. Remote Sens. 2020, 24, 182–198, (In Chinese with English Abstract). [Google Scholar]
  42. Guo, X.; Li, P. Mapping plastic materials in an urban area: Development of the normalized difference plastic index using WorldView-3 superspectral data. ISPRS J. Photogramm. Remote Sens. 2020, 169, 214–226. [Google Scholar] [CrossRef]
  43. Su, S.S.; Tian, J.; Dong, X.Y.; Tian, Q.; Wang, N.; Xi, Y. An Impervious Surface Spectral Index on Multispectral Imagery Using Visible and Near-Infrared Bands. Remote Sens. 2022, 14, 3391. [Google Scholar] [CrossRef]
  44. Song, X.P.; Joseph, O.S.; Huang, C.Q.; Channan, S.; Townshend, J.R. Characterizing the Magnitude, Timing and Duration of Urban Growth from Time Series of Landsat-based Estimates of Impervious Cover. Remote Sens. Environ. 2016, 175, 1–13. [Google Scholar] [CrossRef]
  45. Deng, C.B.; Zhu, Z. Continuous Subpixel Monitoring of Urban Impervious Surface Using Landsat Time Series. Remote Sens. Environ. 2020, 238, 1–21. [Google Scholar] [CrossRef]
  46. Feng, S.S.; Fan, F.L. Spatial-Temporal Changes of Impervious Surface in the Guangdong-Hong Kong-Macao Greater Bay Area during 2006-2016. Trop. Geogr. 2018, 38, 536–545, (In Chinese with English Abstract). [Google Scholar]
  47. Wang, Y.Q. Qingdao Port Today. Cross-Strait Relat. 1997, 6, 39, (In Chinese with English Abstract). [Google Scholar]
  48. Ma, Y.Y.; Li, G.X.; Liu, Y.; Shi, J.H. Monitoring Dynatic Change of Wetland of Jiaozhou Bay and Quality Evaluation Based on Remote Sensing; Ocean University of China: Qingdao, China, 2006. [Google Scholar]
  49. Zhang, X.L.; Zhang, C.H.; Xu, Z.J.; Xie, W.; Sui, Y.; Xi, M. Landscape Pattern Changes and Their Environmental Effects of Coastal Wetlands in Jiaozhou Bay. Geol. Rev. 2012, 58, 190–200. [Google Scholar]
Figure 1. Research flowchart.
Sustainability 16 05659 g001
Figure 2. Map of the study area location.
Sustainability 16 05659 g002
Figure 3. Detailed comparison of impervious surface extraction techniques. P1 represents a standard false-color basemap from Landsat 8; in P2–P4, green areas denote non-impervious surfaces, and red areas denote impervious surfaces; where, (a)-1, (b)-1, (c)-1 are the extraction results of BUAI index method; (a)-2, (b)-2, (c)-2 are the extraction results of BCI index; (a)-3, (b)-3, and (c)-3 are random forest extraction results.
Sustainability 16 05659 g003
Figure 4. Results of impervious surface extraction for the period 1986–2022. The red area in the figure is the impervious surface information of 8 years, including 1986 to 2022, where IS stand for impervious surface; The bottom map is a digital elevation map; the greener the color, the higher the altitude.
Sustainability 16 05659 g004
Figure 5. Average center points and standard deviation ellipses of impervious surfaces from 1986 to 2022. The bottom map is a digital elevation map; the darker the color, the higher the altitude; SDE is short for standard deviation ellipse.
Sustainability 16 05659 g005
Figure 6. Changes in impervious surfaces in the coastal areas of Jiaozhou Bay, 1986–2022: (a) Impervious surface area and coverage rates; (b) Change rates and intensities of impervious surfaces.
Sustainability 16 05659 g006
Figure 7. Diagram of bare soil extraction results: (a) Landsat 8 remote sensing image, yellow polygons are artificial abandoned land, orange polygon is exposed bedrock; (b) Impervious surface information extracted using the Random Forest classification method, where green areas represent pervious surfaces, and red areas represent impervious surfaces.
Sustainability 16 05659 g007
Figure 8. Radar charts of impervious surface statistics by region along the Jiaozhou Bay coast, 1986–2022: (a) Area of impervious surfaces; (b) Expansion area of impervious surfaces; (c) Rate of change in impervious surfaces; (d) Intensity of change in impervious surfaces.
Sustainability 16 05659 g008
Figure 9. Distribution of IS across different slope levels in the coastal areas of Jiaozhou bay. (ac) show the spatial distribution of IS at different slope levels for the years 1986, 2005, and 2022, respectively, with the base map being a digital elevation model where greener colors indicate higher elevations. (d) illustrates the changes in the area of IS at different slope levels.
Sustainability 16 05659 g009
Figure 10. The relationship between impervious surface area, GDP, and population: (a) Changes in population and GDP from 1986 to 2022; (b) Correlation between GDP and impervious surfaces from 1986 to 2022; (c) Correlation between population and impervious surfaces from 1986 to 2022.
Sustainability 16 05659 g010
Table 1. Landsat remote sensing imagery parameters.
No. DateSensorResolution/m Data Quality
118 September 1986Landsat 5 TM30/15 Low Cloud Coverage and High Quality
231 August 1991
327 September 1995Cloud-Free
and High Quality
48 September 2000
520 July 2005
623 September 2011
723 September 2017Landsat 8 OLI
81 June 2022
Table 2. Verification of extraction accuracy.
Method κ OAUAPAF1 Score
BUAI56.30%82.00%53.57%50.00%51.72%
BCI76.62%90.00%92.86%83.87%83.87%
RF87.73%95.00%92.86%89.66%91.23%
Note: Overall Accuracy—OA; Kappa Coefficient— κ ; Producer’s Accuracy—PA; User’s Accuracy—UA.
Table 3. Standard deviation ellipse parameters for impervious surfaces.
YearDeflection Angle (°)Major Axis Radius (km)Minor Axis Radius (km)Mean Center Coordinates
XY
198648.493.732.13259,103.614,017,458.74
199147.514.152.18256,911.444,013,142.65
199546.235.012.19249,928.464,010936.07
200046.014.572.25255,912.244,011,563.71
200544.884.352.22252,752.224,010,423.09
201145.284.662.13251,996.534,008,808.15
201746.935.002.18251,772.114,009,186.51
202246.885.502.09249,677.594,007,555.18
Table 4. Temporal statistics of impervious surface changes in the coastal regions of Jiaozhou Bay.
YearArea (km2)Coverage Rate (%)Time PeriodChange Rate (km2/Year)Change Intensity (%)
198671.531.411986–1991
1991–1995
1995–2000
2000–2005
2005–2011
2011–2017
2017–2022
6.71
34.46
3.84
12.65
19.55
62.76
45.98
9.38
32.80
1.58
4.83
6.01
14.18
5.61
1991105.072.07
1995242.924.78
2000262.125.15
2005325.396.40
2011442.688.71
2017819.2416.11
20221049.1620.63
Table 5. Regional changes in IS in the coastal areas of Jiaozhou bay.
Area1986–20052005–2022
Extended Area (km2)Rate of Change (km2∙a−1)Intensity of Change (%)Extended Area (km2)Rate of Change (km2∙a−1)Intensity of Change (%)
Chengyang District53.192.8021.79116.646.8610.39
Huangdao District67.353.54273.02273.3016.0823.42
Jimo District38.342.028.40152.418.9714.38
Jiaozhou28.961.5226.92115.876.8219.68
Laoshan District25.721.3533.4328.461.675.62
Licang District22.991.2115.0715.330.902.91
Shibei District13.950.736.5116.340.963.81
Disclaimer/Publisher’s Note: The statements, opinions and data contained in all publications are solely those of the individual author(s) and contributor(s) and not of MDPI and/or the editor(s). MDPI and/or the editor(s) disclaim responsibility for any injury to people or property resulting from any ideas, methods, instructions or products referred to in the content.

