
The Assessment of Biodiversity Changes and Sustainable Agricultural Development in The Beijing-Tianjin-Hebei Region of China


Abstract
:1. Introduction
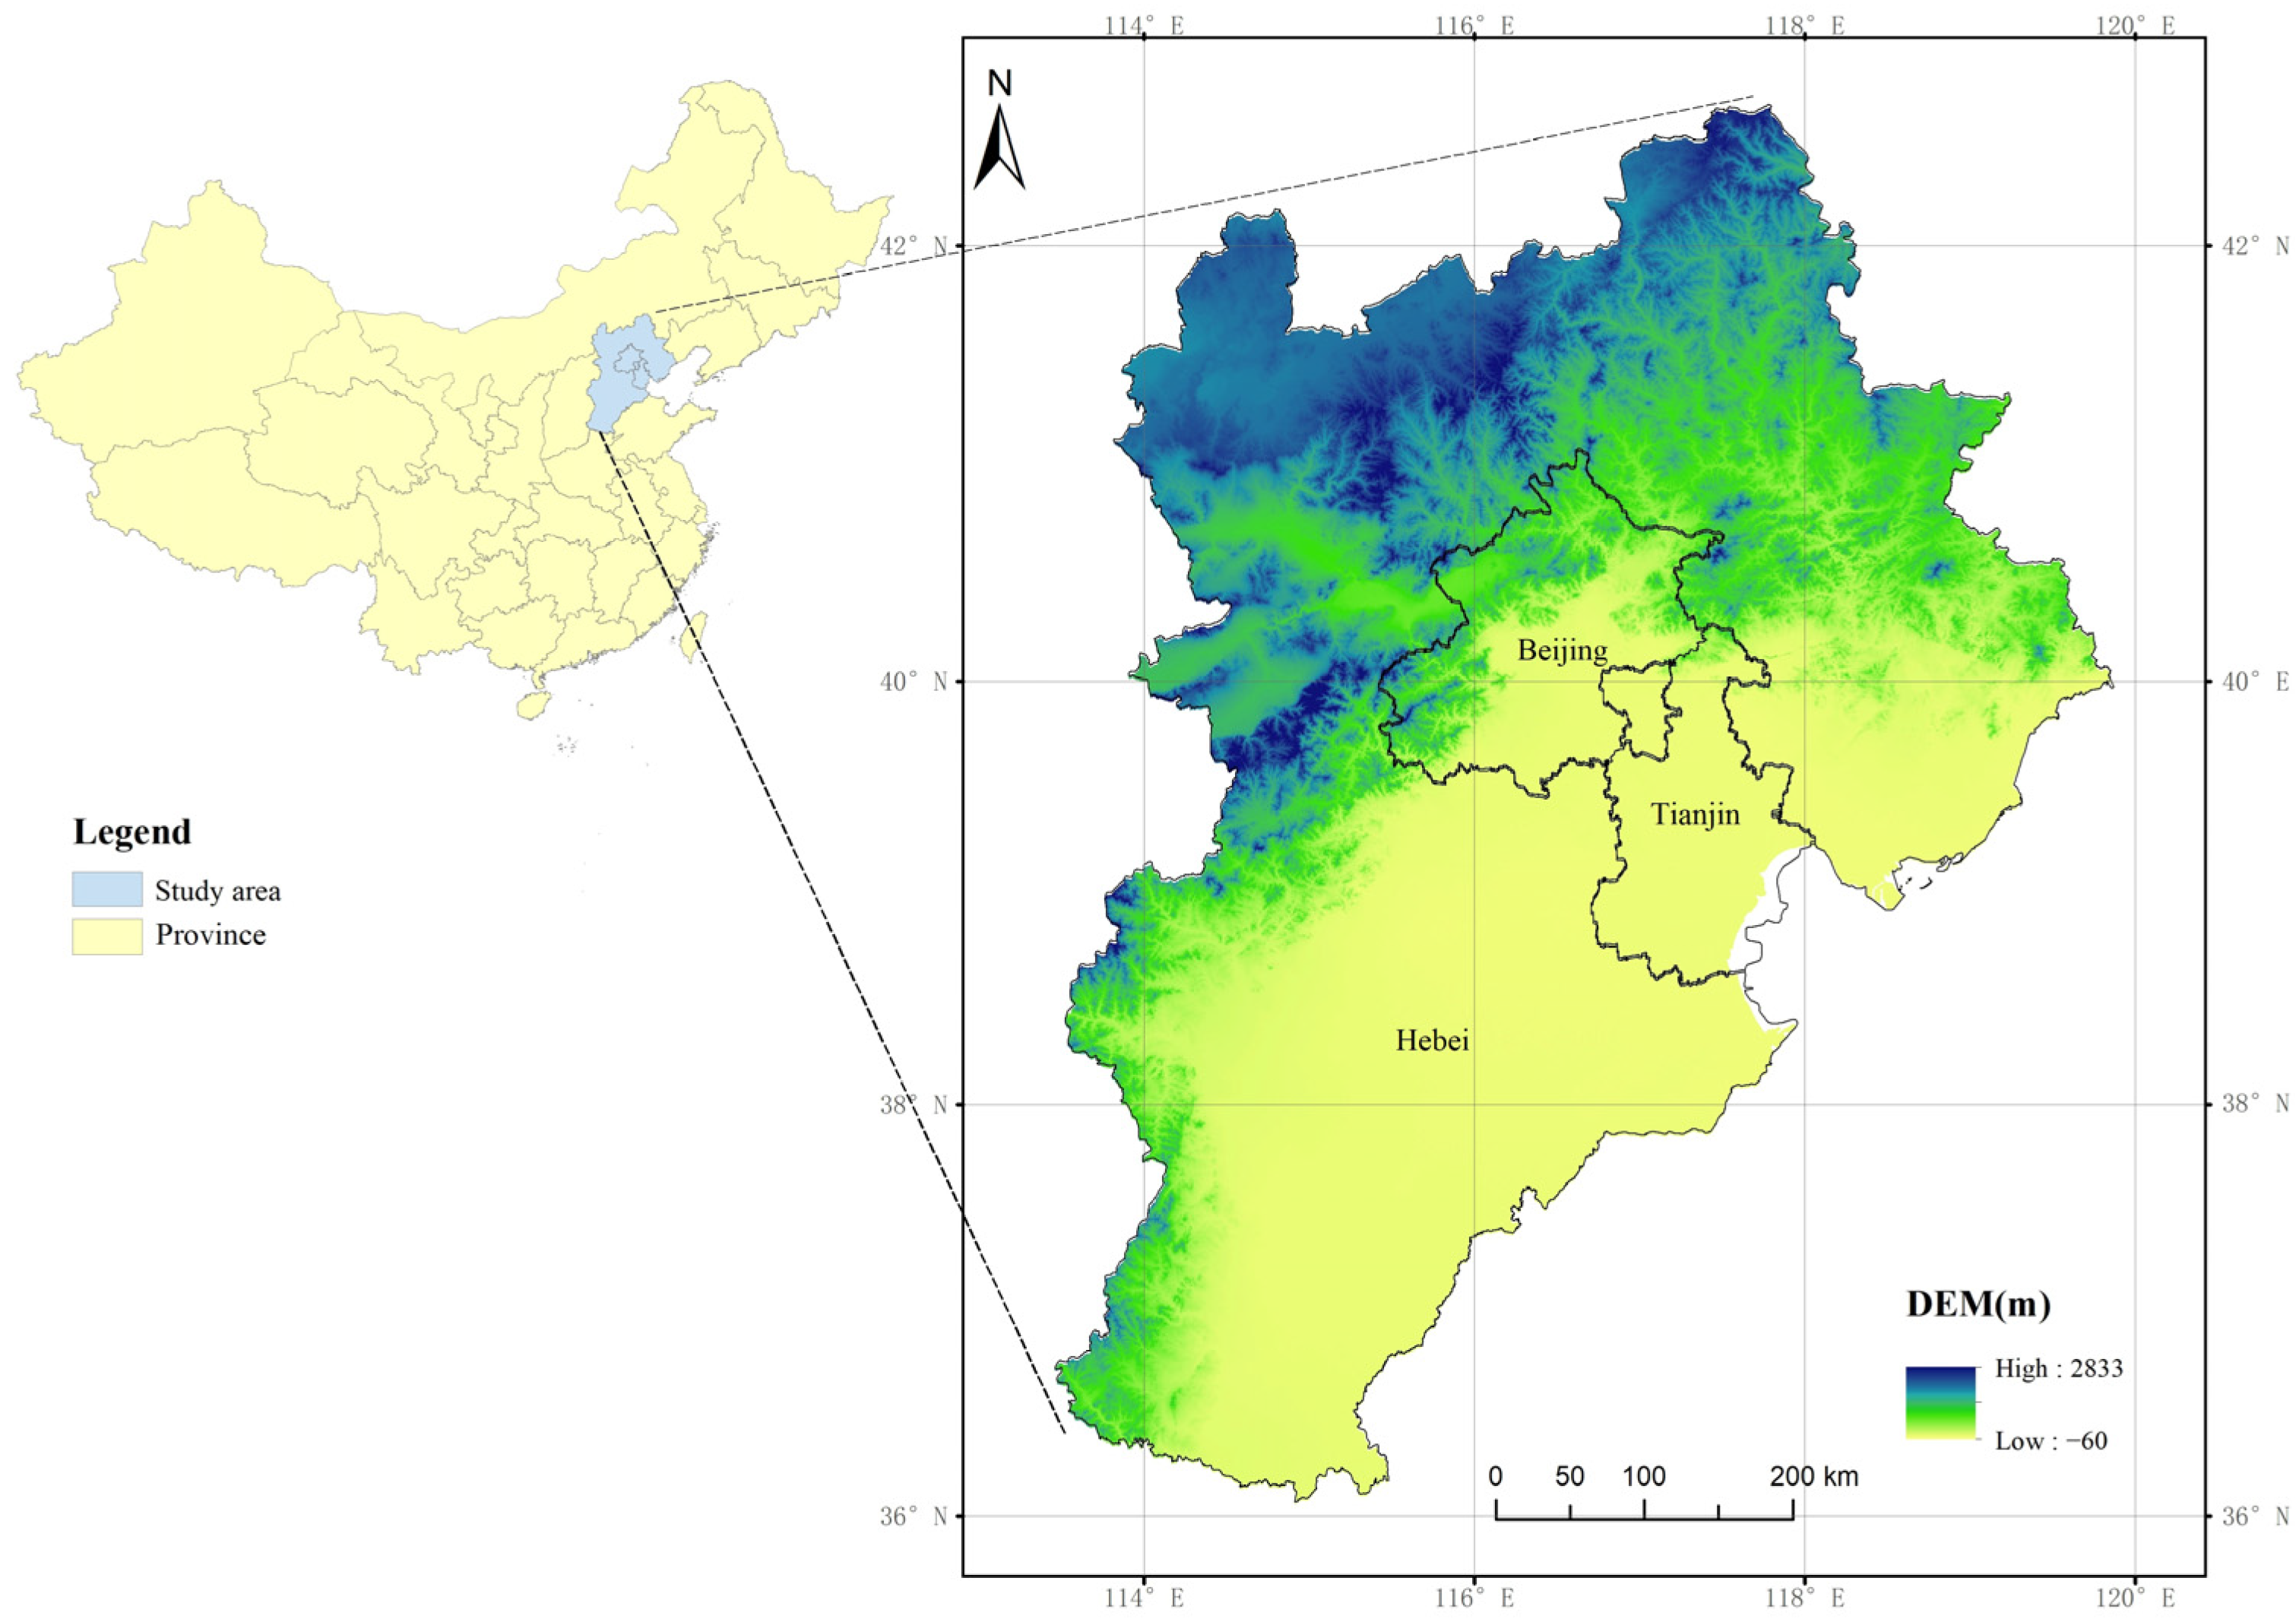
2. Study Area
3. Materials and Methods
3.1. The Software Used and Data Sources
- (1)
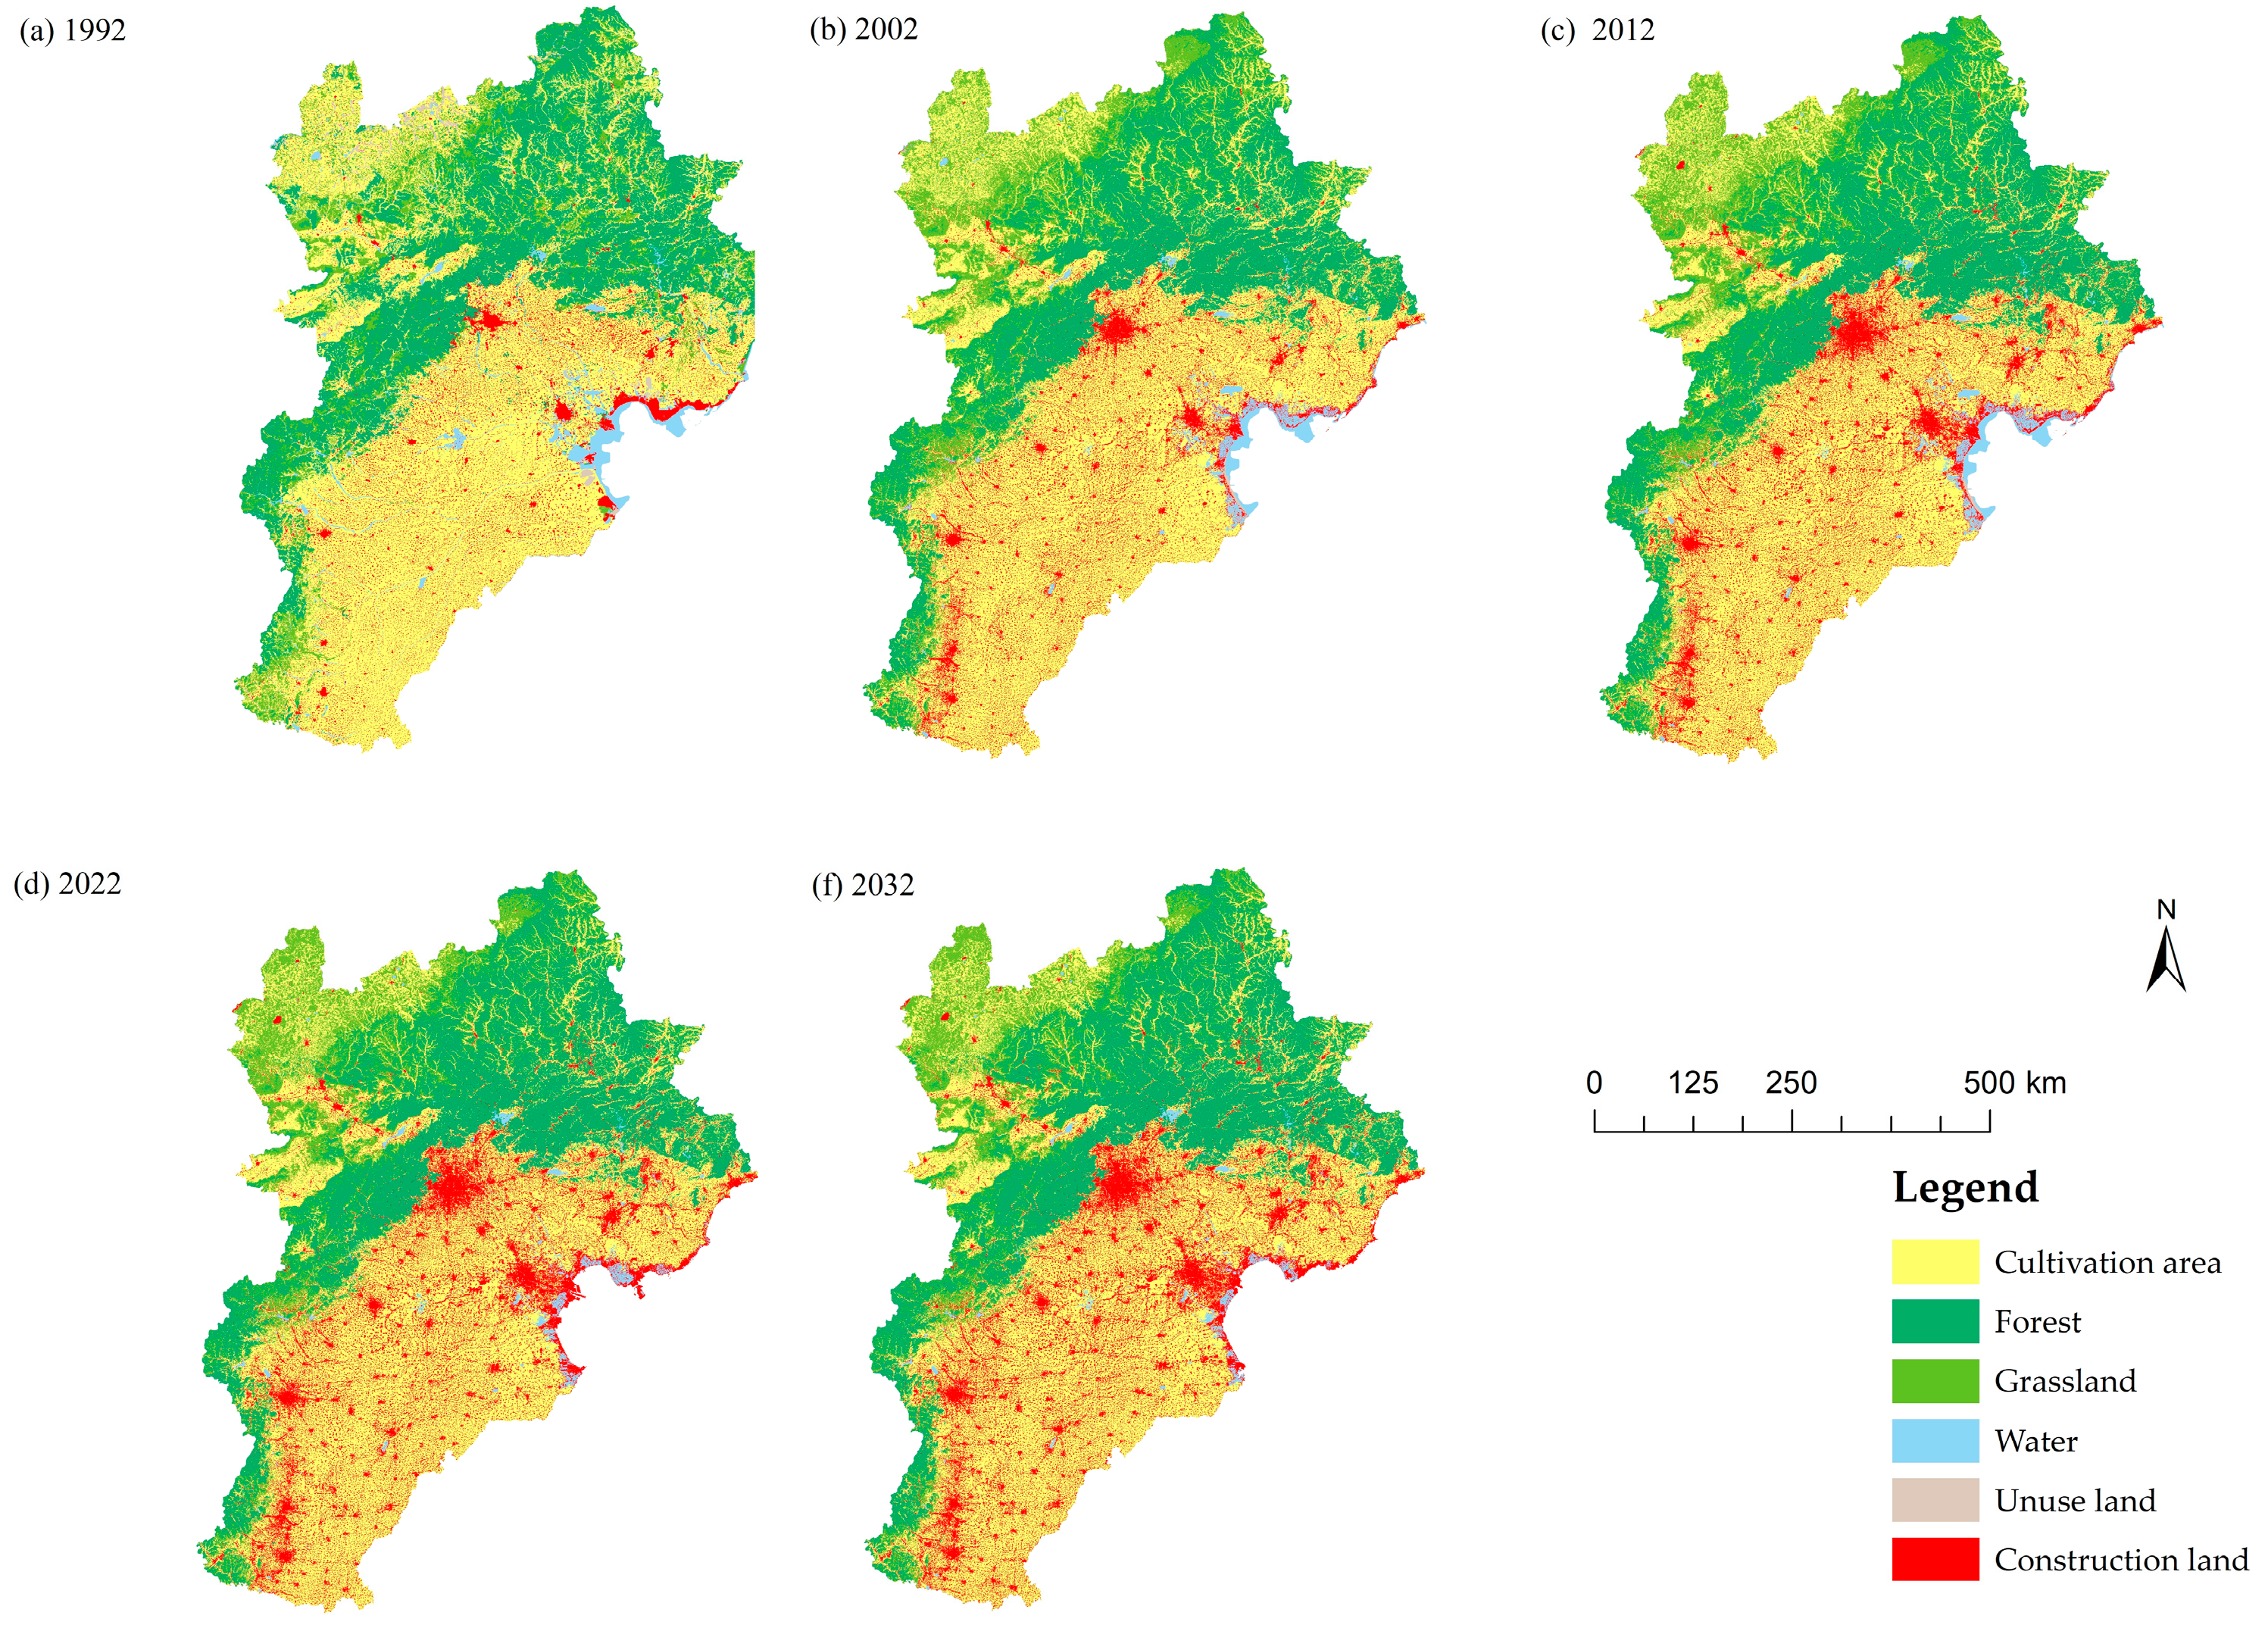
- Land use data: The land use data of Beijing-Tianjin-Hebei in 1992, 2002, 2012, and 2022 used in this study are from the year-by-year land use classification dataset of China from 1990 to 2022 at a resolution of 30 m, and the data were obtained from the National Glacial and Permafrost Desert Science Data Centre (http://www.ncdc.ac.cn (accessed on 23 June 2023)). In this study, the land use/land cover (LULC) types in Beijing-Tianjin-Hebei were reclassified into 13 land classes according to the research needs, which were construction land, unused land, paddy land, dry land, deciduous broadleaf forest, evergreen broadleaf forest, evergreen coniferous forest, deciduous coniferous forest, natural pasture, mixed forest, man-made farm, shrub from, and water.
- (2)
- Vegetation data: The normalized difference vegetation index (NDVI) was mainly used in this study. The NDVI for the Beijing-Tianjin-Hebei region is the annual maximum NDVI dataset at 30 m resolution for 1986–2023 in China, which was obtained from the Geo-Remote Sensing Ecological Network (GREN) Scientific Data Registration and Publication System (www.gisrs.cn (accessed on 16 June 2023)).
- (3)
- Digital Elevation Model (DEM) data: The digital elevation model (DEM) data used in this study were obtained from the Geospatial Data Cloud Platform (http://www.gscloud.cn (accessed on 16 February 2023)), ASTER GDEM, with a resolution of 30 m. The DEM data of the study area were obtained through splicing, projection conversion, cropping, and other processing, in which the slope data were based on the DEM data using the ArcGIS 10.8 software Slope tool.
- (4)
- Socio-economic data: The 2012 and 2022 POP and GDP spatial distribution kilometre grid datasets used in this study were obtained from the Resource Environment and Science Data Centre of the Chinese Academy of Sciences (http://www.resdc.cn/ (accessed on 17 June 2023)).
- (5)
- Basic geographic information data: The highway, railway, and river data of the Beijing-Tianjin-Hebei region used in this study were obtained from OSM (Open Street Map, https://openmaptiles.org/languages/zh/#0.33/0/0 (accessed on 16 February 2023)) and calculated with the help of the Euclidean distance method of ArcGIS10.8; the data raster size used in this study is 30 m × 30 m and the reference coordinate system is WGS_1984.
3.2. Fragstats
3.3. Markov Chain Model
3.4. Habitat Quality of the InVEST Model
3.5. InVEST Model GLOBIO
4. Results
4.1. Land Use Space and Landscape Pattern Changes
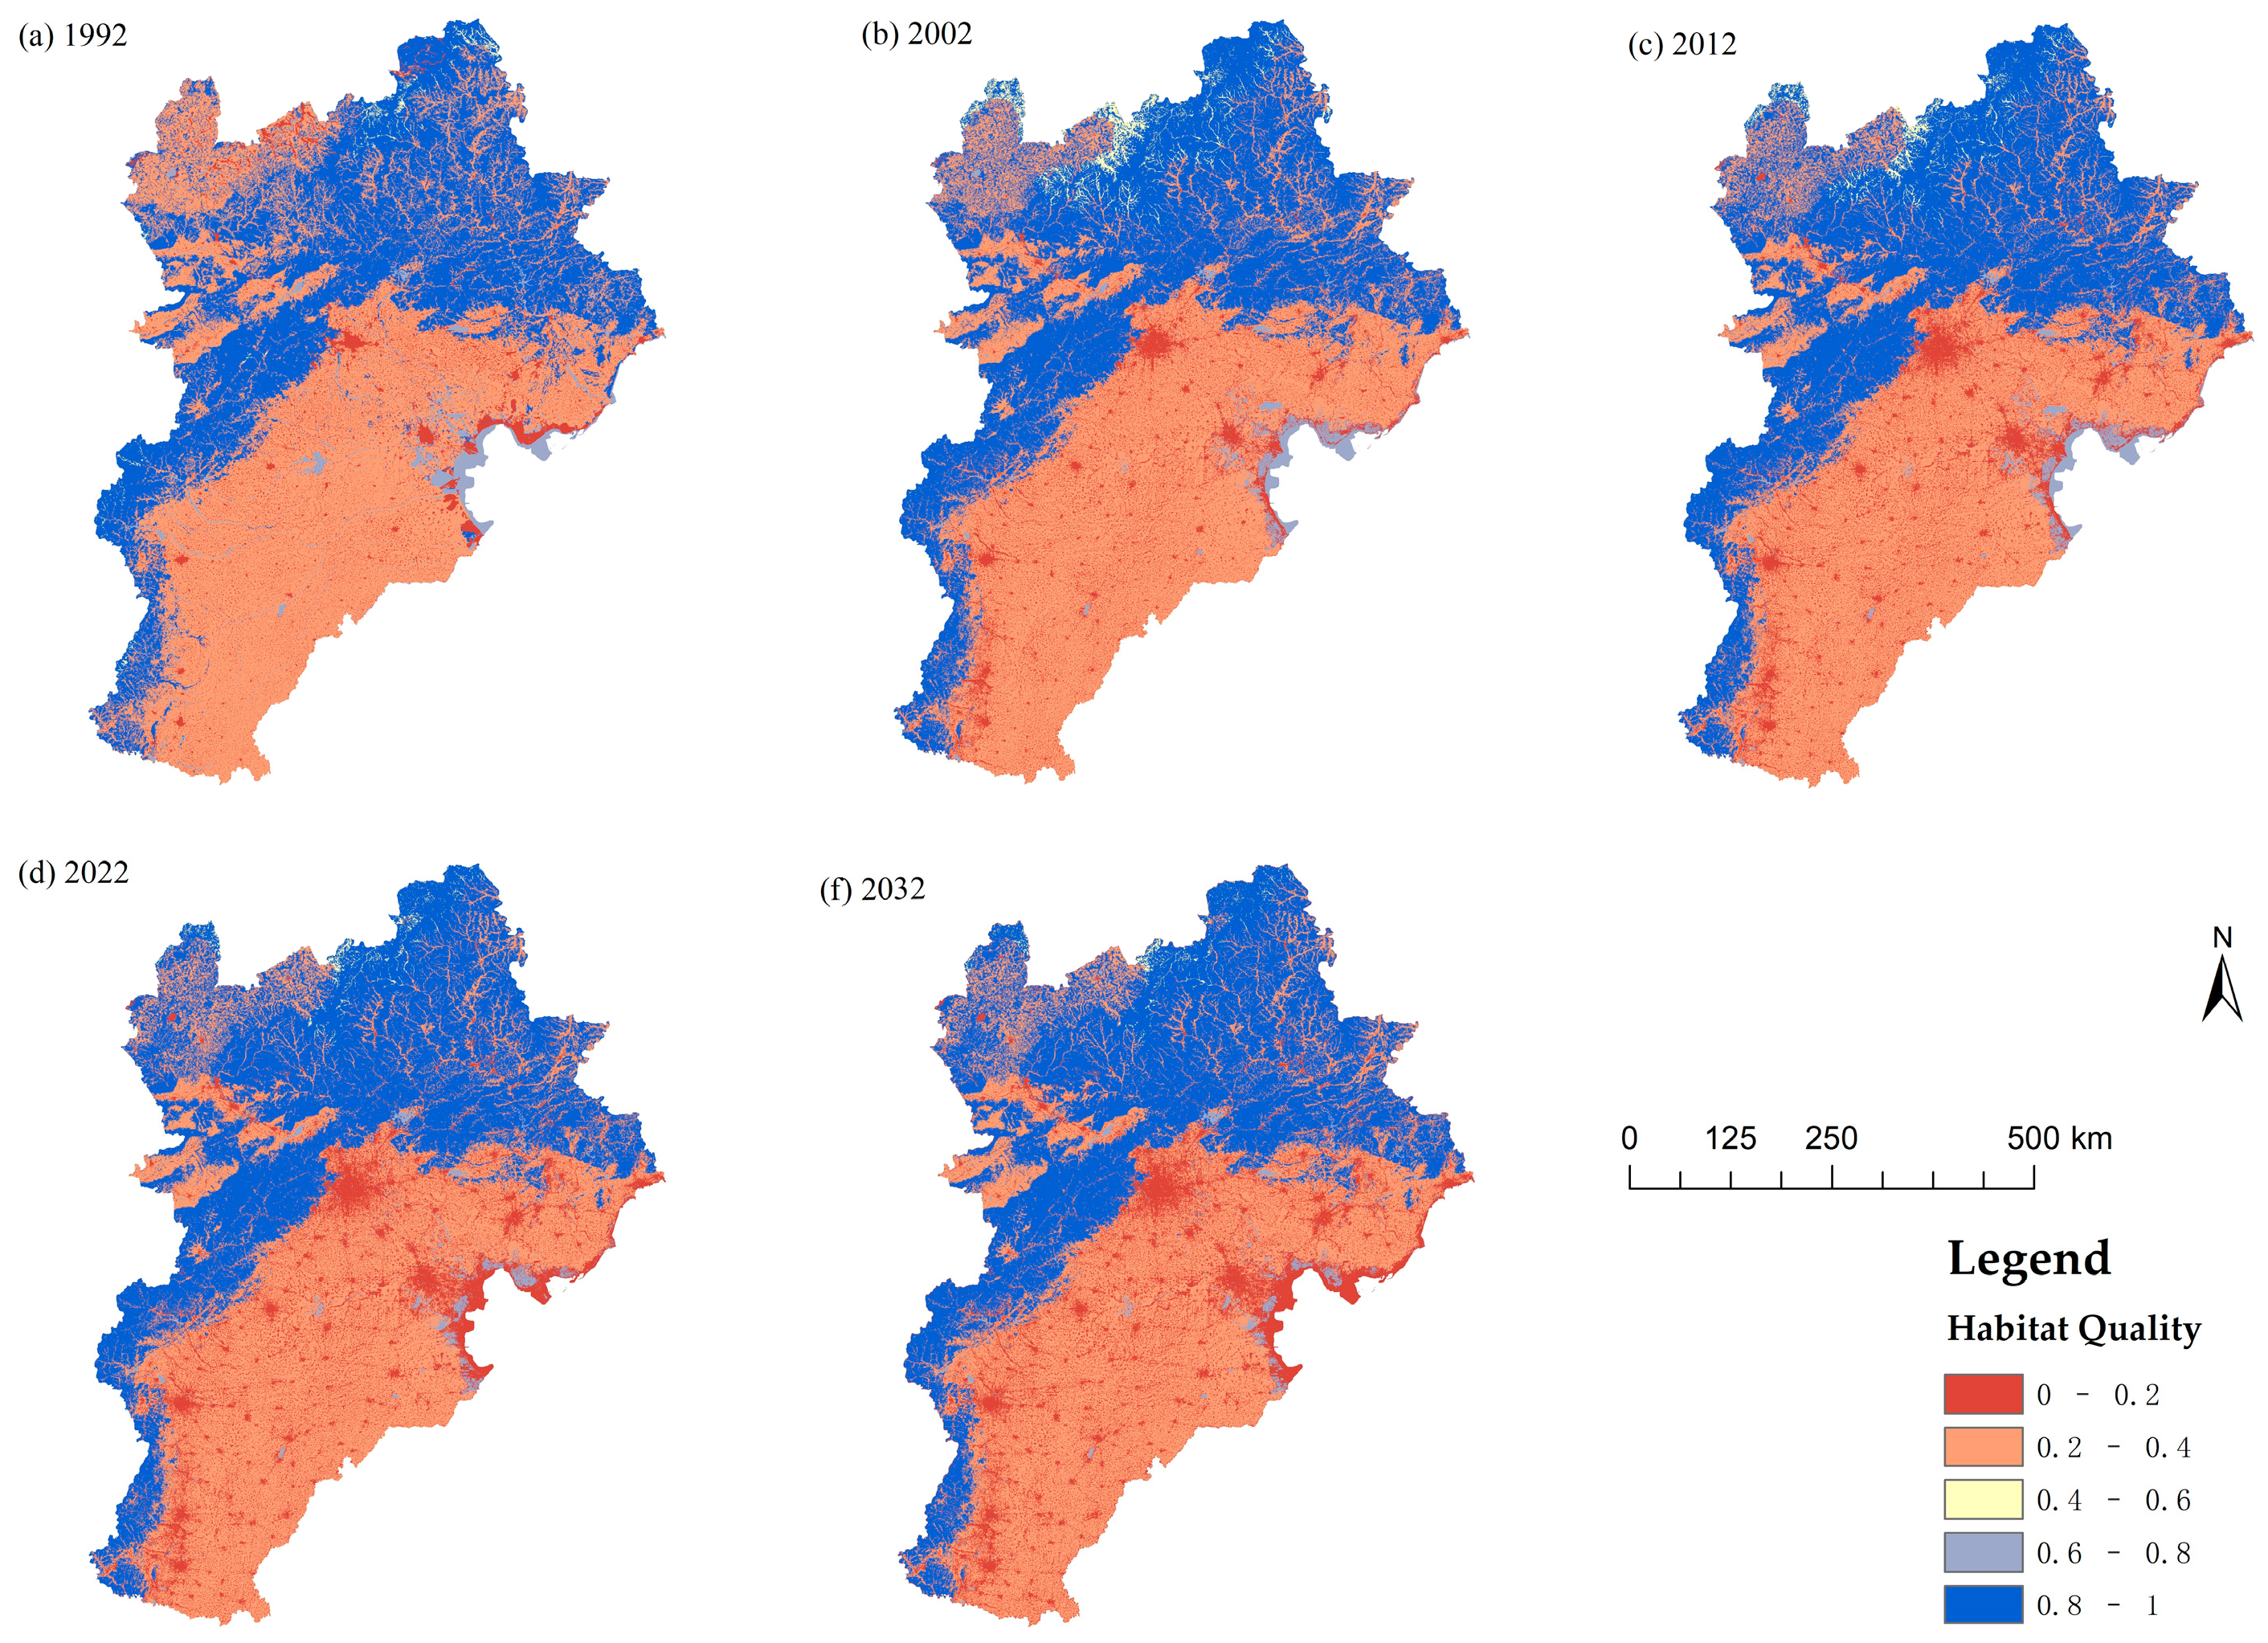
4.2. Analysis of Spatial Changes in Habitat Quality
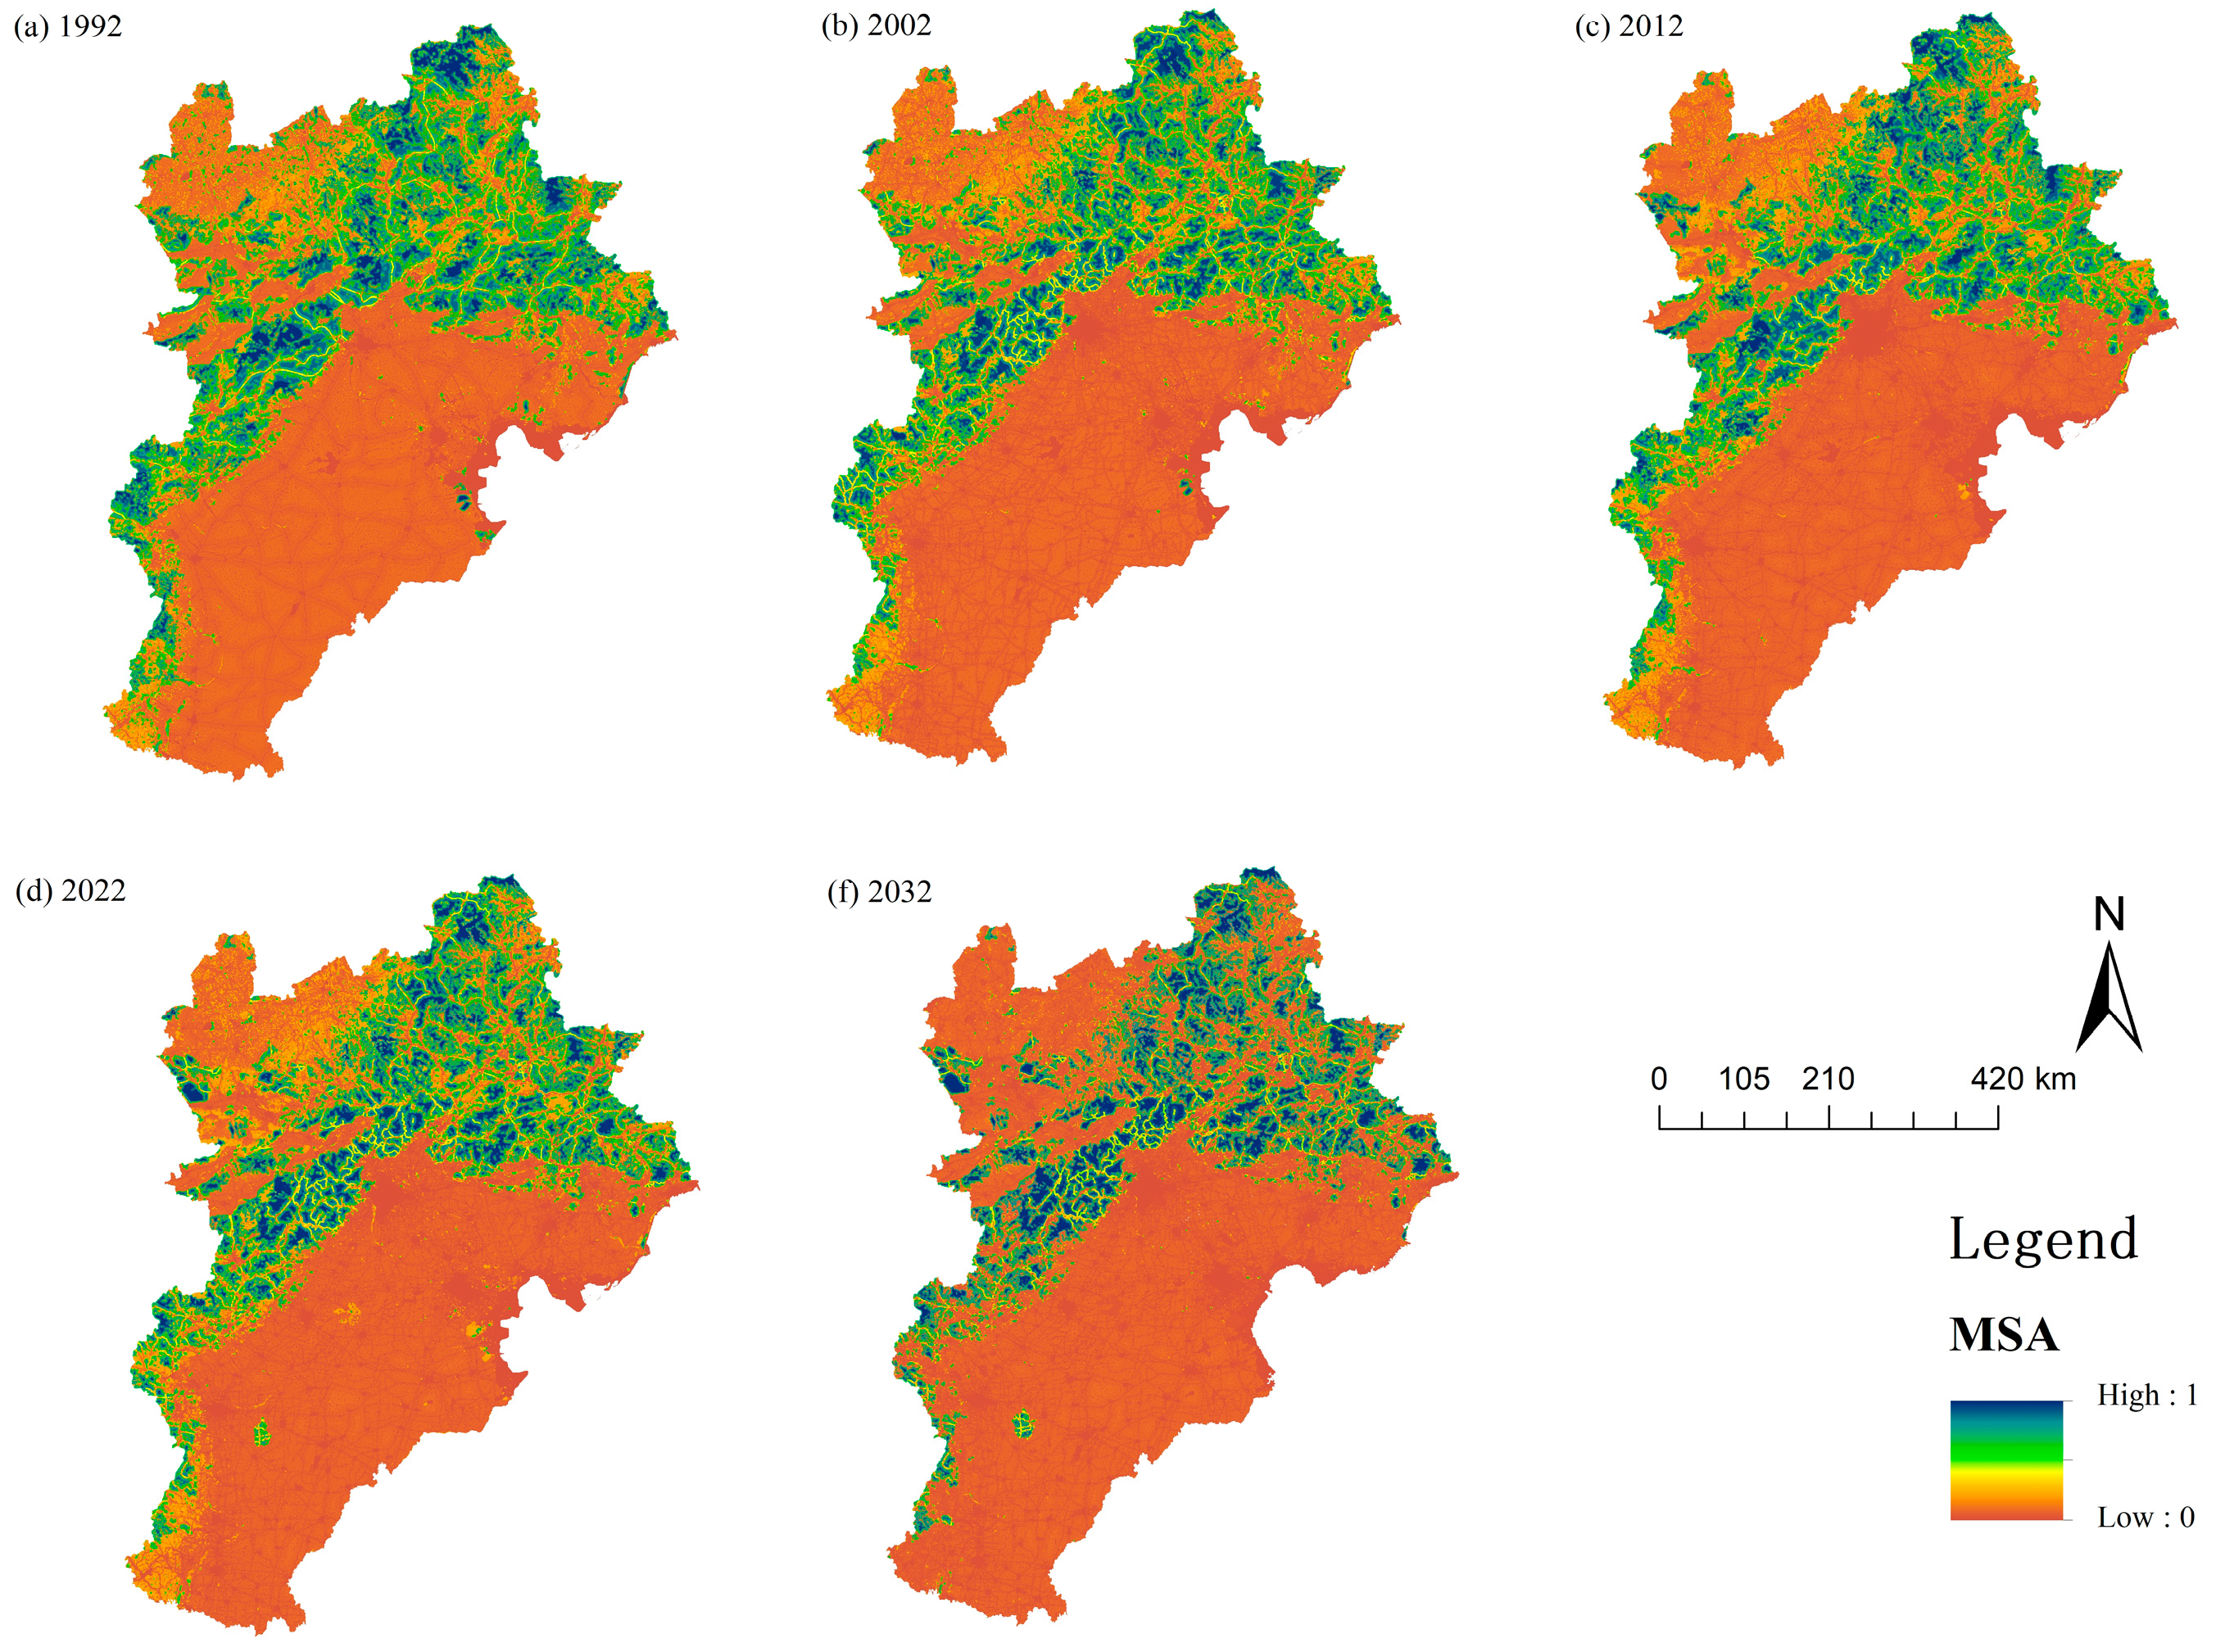
4.3. Analysis of Spatial Changes in MSA Values
5. Discussion
- (1)
- In this study, the methodology of biodiversity assessment has been explored in depth: Firstly, the Beijing-Tianjin-Hebei region, as a representative urban agglomeration of the Capital Economic Circle, can be a good place to explore the impact of urbanization development and environmental protection measures on biodiversity. Focusing on the assessment of biodiversity in the Beijing-Tianjin-Hebei region using the InVEST model, and in particular its GLOBIO component, this study fills an important gap in global biodiversity assessment practice. By providing clear results and selecting specific policy milestones to disaggregate and discuss observed changes, this study not only enhances our understanding of the impacts of policy on agrobiodiversity conservation, but also illustrates the critical role of targeted policy interventions. This approach provides new perspectives for integrating ecological modelling and policy analysis to address global biodiversity challenges, emphasizing the important contribution of informed decision-making to biodiversity conservation efforts.
- (2)
- Comparison of the findings of this study with those of similar studies: Firstly, the results of the habitat module runs in the InVEST model are broadly consistent with the trends of similar studies, with a continuing downward trend in ecosystem health and biodiversity over the last 30 years. Most studies on biodiversity assessment have indeed used habitat quality indices rather than biodiversity indices, as seen in the literature [51,54,55], with a predominant focus on habitat area within the InVEST-HQ model. Importantly, the assumption in this study was that all indigenous species and habitats within the study area were impacted by these threats while potentially ignoring threats from other biological factors. This study of ecosystem diversity in the Beijing-Tianjin-Hebei region explored how landscape area factors such as habitat quality and landscape pattern indices affect ecosystem diversity. Additionally, this study considered the average species richness, which integrates the impacts of different levels or intensities of each pressure on biodiversity to assess biodiversity at the site. This approach ensures objectivity and clarity in biodiversity assessment. In the future, it may be worthwhile to consider selecting data for the GLBIO section to update land cover data in greater detail, which would aid in the assessment of agrobiodiversity.
- (3)
- Policy recommendations related to enhancing the use of agricultural biodiversity to promote sustainable agricultural development in Beijing, Tianjin, and Hebei, and to ensure food and ecological security. Firstly, an evolutionary outlook for landscape fragmentation regional planning: The expansion of urbanization and construction in the Beijing-Tianjin-Hebei region, along with the increase in the proportion of intensive agriculture and the implementation of economic collaboration policies, has led to a reduction in landscape heterogeneity and an amplification of fragmentation. This has resulted in severe damage to biodiversity, especially in regions strategically significant for social and economic development. However, the shift from an agriculture-based economy and recent policies promoting ecological civilization, as well as the integration of sustainable development in the Beijing-Tianjin-Hebei region, have helped mitigate pressure on biodiversity in the study area. The aim is to balance economic and social development with biodiversity conservation. Conservation programs under the current policy focus on preserving forest coverage, designating additional protected areas, and rehabilitating degraded regions. However, the dilemma between social and economic development and environmental protection should be considered, and public awareness of sustainable development and market-based conservation programs can increase.
6. Conclusions
- (1)
- Landscape fragmentation and changes in Shannon’s diversity index: It was found that the urbanization process in the Beijing-Tianjin-Hebei region has significantly exacerbated the fragmentation of the landscape, in which the ED (edge density), DIVISION (Landscape Delineation Index), SHDI (Shannon’s Homogeneity Index), and SHEI (Shannon’s diversity index) showed a sustained upward trend during the period of 1992 to 2022, and especially in the decade after 1992, during which the rise sharply increased. The LPI (largest patch) is the opposite. This fragmentation is mainly due to changes in land use within the region, especially land conversion behaviour that connects or separates different types of patches, leading to a decrease in the biodiversity index. It is worth noting that the policy of “returning farmland to forests and grasslands” implemented since 2002, though aimed at ecological restoration, has increased the fragmentation and complexity of arable land to a certain extent, further affecting biodiversity. However, in the natural development scenario projected for 2032, these indicators stop rising and falling, and landscape fragmentation is reduced, thanks to the environmental protection policy measures implemented in recent years.
- (2)
- Correlation between habitat quality and landscape features: The correlation between habitat quality and landscape patterns in the Beijing-Tianjin-Hebei region was also explored based on data from 1992 to 2032. The analyses showed that most indicators were positively correlated with habitat quality, while the landscape patch index (LPI) was negatively correlated with it. Meanwhile, the spatial correlation between habitat quality and landscape pattern characteristics in the Beijing-Tianjin-Hebei region gradually weakened after 2002. This was due to the fact that although the landscape fragmentation in the Beijing-Tianjin-Hebei region had been mitigated, the fragmented landscapes were gradually converted from construction land to natural landscapes, and the fast-developing construction land was still threatening the surrounding habitats, which led to the gradual decrease in the spatial correlation between the habitat quality and the landscape pattern index (LPI).
- (3)
- Spatial distribution of habitat quality: This study also found that the spatial distribution of habitat quality in the Beijing-Tianjin-Hebei region has a close correlation with the topography and landscape and has shown a decreasing trend over the past 40 years, from 0.599 to 0.564 between 1992 and 2032. Overall, the quality of the habitats in the northwestern part of the region is high, and the quality of the habitats in the southeastern part of the region is low, which creates a clear spatial pattern. The formation of this pattern is closely related to the uneven rate of economic development in the region, and the acceleration of economic development is usually accompanied by the overexploitation of natural resources, leading to a decline in habitat quality. Urban expansion not only compresses the original habitat, but also weakens habitat connectivity and stability by fragmenting the habitat landscape.
- (4)
- Calculation of average species richness (MSA) and influencing factors: The results of the analysis show that the average species richness has been decreasing from 0.270 to 0.183 over the past 40 years, and the MSA value was calculated by defining the proportion of arable land under facility-based agriculture in order to estimate the proportion of intensive farming, taking into account the national conditions of China. The MSA value in the Beijing-Tianjin-Hebei region is significantly affected by infrastructure, especially road construction. As the road network continued to expand, the MSA values in the region generally showed a decreasing trend. In addition, the MSA values of grasslands in the northwestern part of the region are relatively average, while the higher-elevation Yanshan and Taihangshan regions and remote woodland regions have higher MSA values, indicating that the ecological environment in these regions is relatively favourable. The steep topography limits the range of human activities, thus protecting the local ecological environment to a certain extent.
Author Contributions
Funding
Institutional Review Board Statement
Informed Consent Statement
Data Availability Statement
Conflicts of Interest
References
- Huang, C.-W.; McDonald, R.I.; Seto, K.C. The Importance of Land Governance for Biodiversity Conservation in an Era of Global Urban Expansion. Landsc. Urban Plan. 2018, 173, 44–50. [Google Scholar] [CrossRef]
- Zhao, L.; Su, M.; Wang, X.; Li, X.; Chang, X.; Zhang, P. Spatial–Temporal Evolution and Prediction of Habitat Quality in Beijing–Tianjin–Hebei Region Based on Land Use Change. Land 2023, 12, 667. [Google Scholar] [CrossRef]
- He, Y.; Xia, C.; Shao, Z.; Zhao, J. The Spatiotemporal Evolution and Prediction of Carbon Storage: A Case Study of Urban Agglomeration in China’s Beijing-Tianjin-Hebei Region. Land 2022, 11, 858. [Google Scholar] [CrossRef]
- Wu, J.; Jin, X.; Feng, Z.; Chen, T.; Wang, C.; Feng, D.; Lv, J. Relationship of Ecosystem Services in the Beijing–Tianjin–Hebei Region Based on the Production Possibility Frontier. Land 2021, 10, 881. [Google Scholar] [CrossRef]
- Hu, S.; Yang, Y.; Li, A.; Liu, K.; Mi, C.; Shi, R. Integrating Ecosystem Services Into Assessments of Sustainable Development Goals: A Case Study of the Beijing-Tianjin-Hebei Region, China. Front. Environ. Sci. 2022, 10, 897792. [Google Scholar] [CrossRef]
- Lu, N.; Wei, H.; Fan, W.; Xu, Z.; Wang, X.; Xing, K.; Dong, X.; Viglia, S.; Ulgiati, S. Multiple Influences of Land Transfer in the Integration of Beijing-Tianjin-Hebei Region in China. Ecol. Indic. 2018, 90, 101–111. [Google Scholar] [CrossRef]
- Zhang, K.; Wen, Z. Review and Challenges of Policies of Environmental Protection and Sustainable Development in China. J. Environ. Manag. 2008, 88, 1249–1261. [Google Scholar] [CrossRef] [PubMed]
- Zhang, X.; Wu, L.; Zhang, R.; Deng, S.; Zhang, Y.; Wu, J.; Li, Y.; Lin, L.; Li, L.; Wang, Y.; et al. Evaluating the Relationships among Economic Growth, Energy Consumption, Air Emissions and Air Environmental Protection Investment in China. Renew. Sustain. Energy Rev. 2013, 18, 259–270. [Google Scholar] [CrossRef]
- Xie, Z. China’s Historical Evolution of Environmental Protection along with the Forty Years’ Reform and Opening-Up. Environ. Sci. Ecotechnology 2020, 1, 100001. [Google Scholar] [CrossRef]
- Zhong, Q.; Shi, G. Environmental Issues to Protection: The United States versus China. Environ. Conscious. China 2020, 1, 11–31. [Google Scholar] [CrossRef]
- Ma, W.; Jiang, G.; Chen, Y.; Qu, Y.; Zhou, T.; Li, W. How Feasible Is Regional Integration for Reconciling Land Use Conflicts across the Urban–Rural Interface? Evidence from Beijing–Tianjin–Hebei Metropolitan Region in China. Land Use Policy 2020, 92, 104433. [Google Scholar] [CrossRef]
- Luo, Y.; Yang, J.; Shi, Q.; Xu, Y.; Menenti, M.; Wong, M.S. Seasonal Cooling Effect of Vegetation and Albedo Applied to the LCZ Classification of Three Chinese Megacities. Remote Sens. 2023, 15, 5478. [Google Scholar] [CrossRef]
- Miao, Y.; Liu, S.; Zheng, Y.; Wang, S.; Chen, B. Numerical Study of the Effects of Topography and Urbanization on the Local Atmospheric Circulations over the Beijing-Tianjin-Hebei, China. Adv. Meteorol. 2015, 2015, e397070. [Google Scholar] [CrossRef]
- Mo, L.; Liu, J.; Chen, J.; Xie, Y. Quantifying Ecosystem Services of Dominate Forests in the Beijing Mountain Area. Env. Sci. Pollut. Res. 2020, 27, 27773–27785. [Google Scholar] [CrossRef]
- Yang, Y.; Bao, W.; Liu, Y. Scenario Simulation of Land System Change in the Beijing-Tianjin-Hebei Region. Land Use Policy 2020, 96, 104677. [Google Scholar] [CrossRef]
- Li, Y.; Zhang, Z.; Shi, M. What Should Be the Future Industrial Structure of the Beijing-Tianjin-Hebei City Region under Water Resource Constraint?An Inter-City Input-Output Analysis. J. Clean. Prod. 2019, 239, 118117. [Google Scholar] [CrossRef]
- National Bureau of Statistics of China National Bureau of Statistics of China >> Yearbook. Available online: https://www.stats.gov.cn/english/Statisticaldata/yearbook/ (accessed on 7 March 2024).
- Zhao, Z.; Bai, Y.; Wang, G.; Chen, J.; Yu, J.; Liu, W. Land Eco-Efficiency for New-Type Urbanization in the Beijing-Tianjin-Hebei Region. Technol. Forecast. Soc. Chang. 2018, 137, 19–26. [Google Scholar] [CrossRef]
- Farina, A. Landscape Evaluation. In Landscape Ecology in Action; Farina, A., Ed.; Springer Netherlands: Dordrecht, The Nederlands, 2000; pp. 107–192. ISBN 978-94-011-4082-9. [Google Scholar]
- Liao, W.; Deng, H.; Li, R.; Zheng, H. Spatial Patterns of Ecosystem Hydrological Regulation Services and Factors Affecting Them in the Yangtze River Basin: Sub-Watershed Scale Analysis. Acta Ecol. Sin. 2018, 38, 412–420. [Google Scholar] [CrossRef]
- Leemans, R.; Gaston, K.; Van Jaarsveld, A.; Dixon, J.; Harrison, J.; Cheatle, M.E. International Review of the Globio Model Version 3; Netherlands Environmental Assessment Agency (MNP): The Hague, The Nederlands, 2007. [Google Scholar]
- Kim, J.-H.; Gu, D.; Sohn, W.; Kil, S.-H.; Kim, H.; Lee, D.-K. Neighborhood Landscape Spatial Patterns and Land Surface Temperature: An Empirical Study on Single-Family Residential Areas in Austin, Texas. Int. J. Environ. Res. Public Health 2016, 13, 880. [Google Scholar] [CrossRef]
- Huang, B.-X.; Chiou, S.-C.; Li, W.-Y. Landscape Pattern and Ecological Network Structure in Urban Green Space Planning: A Case Study of Fuzhou City. Land 2021, 10, 769. [Google Scholar] [CrossRef]
- O’Neil, S.; Bump, J. Modeling Habitat Potential for Elk Expansion in Michigan, USA. Wildl. Biol. Pract. 2014, 10, 338. [Google Scholar] [CrossRef]
- Myint, S.W.; Wang, L. Multicriteria Decision Approach for Land Use Land Cover Change Using Markov Chain Analysis and a Cellular Automata Approach. Can. J. Remote Sens. 2006, 32, 390–404. [Google Scholar] [CrossRef]
- Holzkämper, A.; Lausch, A.; Seppelt, R. Optimizing Landscape Configuration to Enhance Habitat Suitability for Species with Contrasting Habitat Requirements. Ecol. Model. 2006, 198, 277–292. [Google Scholar] [CrossRef]
- Cheng, F.; Liu, S.; Hou, X.; Wu, X.; Dong, S.; Coxixo, A. The Effects of Urbanization on Ecosystem Services for Biodiversity Conservation in Southernmost Yunnan Province, Southwest China. J. Geogr. Sci. 2019, 29, 1159–1178. [Google Scholar] [CrossRef]
- Asadolahi, Z.; Salmanmahiny, A.; Sakieh, Y.; Mirkarimi, S.H.; Baral, H.; Azimi, M. Dynamic Trade-off Analysis of Multiple Ecosystem Services under Land Use Change Scenarios: Towards Putting Ecosystem Services into Planning in Iran. Ecol. Complex. 2018, 36, 250–260. [Google Scholar] [CrossRef]
- Chu, L.; Sun, T.; Wang, T.; Li, Z.; Cai, C. Evolution and Prediction of Landscape Pattern and Habitat Quality Based on CA-Markov and InVEST Model in Hubei Section of Three Gorges Reservoir Area (TGRA). Sustainability 2018, 10, 3854. [Google Scholar] [CrossRef]
- Almpanidou, V.; Mazaris, A.D.; Mertzanis, Y.; Avraam, I.; Antoniou, I.; Pantis, J.D.; Sgardelis, S.P. Providing Insights on Habitat Connectivity for Male Brown Bears: A Combination of Habitat Suitability and Landscape Graph-Based Models. Ecol. Model. 2014, 286, 37–44. [Google Scholar] [CrossRef]
- Feng, Z.; Jin, X.; Chen, T.; Wu, J. Understanding Trade-Offs and Synergies of Ecosystem Services to Support the Decision-Making in the Beijing–Tianjin–Hebei Region. Land Use Policy 2021, 106, 105446. [Google Scholar] [CrossRef]
- Sharp, R.; Douglass, J.; Wolny, S. InVEST User Guide—InVEST 3.9.0 Documentation. Available online: https://storage.googleapis.com/releases.naturalcapitalproject.org/invest/3.9.0/userguide/index.html (accessed on 7 March 2024).
- Zhang, Z.; Liu, Y.; Wang, Y.; Liu, Y.; Zhang, Y.; Zhang, Y. What Factors Affect the Synergy and Tradeoff between Ecosystem Services, and How, from a Geospatial Perspective? J. Clean. Prod. 2020, 257, 120454. [Google Scholar] [CrossRef]
- Alkemade, R.; van Oorschot, M.; Miles, L.; Nellemann, C.; Bakkenes, M.; ten Brink, B. GLOBIO3: A Framework to Investigate Options for Reducing Global Terrestrial Biodiversity Loss. Ecosystems 2009, 12, 374–390. [Google Scholar] [CrossRef]
- Schipper, A.M.; Hilbers, J.P.; Meijer, J.R.; Antão, L.H.; Benítez-López, A.; de Jonge, M.M.J.; Leemans, L.H.; Scheper, E.; Alkemade, R.; Doelman, J.C.; et al. Projecting Terrestrial Biodiversity Intactness with GLOBIO 4. Glob. Chang. Biol. 2020, 26, 760–771. [Google Scholar] [CrossRef]
- Parra-Paitan, C.; Verburg, P.H. Accounting for Land Use Changes beyond the Farm-Level in Sustainability Assessments: The Impact of Cocoa Production. Sci. Total Environ. 2022, 825, 154032. [Google Scholar] [CrossRef]
- Purevdorj, T.S.; Tateishi, R.; Ishiyama, T.; Honda, Y. Relationships between Percent Vegetation Cover and Vegetation Indices. Int. J. Remote Sens. 1998, 19, 3519–3535. [Google Scholar] [CrossRef]
- Serrano, J.; Shahidian, S.; Paixão, L.; Marques da Silva, J.; Morais, T.; Teixeira, R.; Domingos, T. Spatiotemporal Patterns of Pasture Quality Based on NDVI Time-Series in Mediterranean Montado Ecosystem. Remote Sens. 2021, 13, 3820. [Google Scholar] [CrossRef]
- Huang, Y.; Chen, G.; Huang, Y.; Liu, B.; Xiong, L.; Gan, G.; Xie, L. Overview of the Development of Facility Agriculture. Agric. Biotechnol. 2020, 9, 151–154. [Google Scholar]
- Narmada, K. Landscape Metrics to Analyze the Forest Fragmentation of Chitteri Hills in Eastern Ghats, Tamil Nadu. J. Civ. Eng. Env. Sci. 2021, 7, 001–007. [Google Scholar] [CrossRef]
- Fan, S.; Pardey, P.G. Agricultural Research in China: Its Institutional Development and Impact; International Service for National Agricultural Research: The Hague, The Netherlands, 1992; ISBN 978-92-9118-007-3. [Google Scholar]
- Zhou, X. Ecological Civilization in China: Challenges and Strategies. Capital. Nat. Social. 2021, 32, 84–99. [Google Scholar] [CrossRef]
- Du, Y.; Qin, W.; Sun, J.; Wang, X.; Gu, H. Spatial Pattern and Influencing Factors of Regional Ecological Civilisation Construction in China. Chin. Geogr. Sci. 2020, 30, 776–790. [Google Scholar] [CrossRef]
- Li, X.; Wei, Y. Collaborated Development of the Beijing-Tianjin-Hebei Region to Improve Regional Environmental Quality. In WIT Transactions on the Built Environment; Brebbia, C.A., Ed.; WIT Press: Cambridge, MA, USA, 2015; Volume 1, pp. 335–345. ISBN 978-1-78466-157-1. [Google Scholar]
- Pian, F.; Jiang, Y.P.; Luan, W.X. Research on the Equipment Manufacturing Industry’s Interregional Industrial Linkages in the Bohai Sea Region. Adv. Mater. Res. 2013, 712–715, 3133–3138. [Google Scholar] [CrossRef]
- Xu, K.; Chi, Y.; Wang, J.; Ge, R.; Wang, X. Analysis of the Spatial Characteristics and Driving Forces Determining Ecosystem Quality of the Beijing–Tianjin–Hebei Region. Env. Sci. Pollut. Res. 2021, 28, 12555–12565. [Google Scholar] [CrossRef]
- Jia, M.; Zhang, H.; Yang, Z. Compactness or Sprawl: Multi-Dimensional Approach to Understanding the Urban Growth Patterns in Beijing-Tianjin-Hebei Region, China. Ecol. Indic. 2022, 138, 108816. [Google Scholar] [CrossRef]
- Yang, Z.; Yang, H.; Wang, H. Evaluating Urban Sustainability under Different Development Pathways: A Case Study of the Beijing-Tianjin-Hebei Region. Sustain. Cities Soc. 2020, 61, 102226. [Google Scholar] [CrossRef]
- Li, Q.; Jin, T.; Peng, Q.; Lin, J.; Zhang, D.; Huang, J.; Liu, B. Identifying the Extent of the Spatial Expression of Landscape Fragmentation Based on Scale Effect Analysis in Southwest China. Ecol. Indic. 2022, 141, 109120. [Google Scholar] [CrossRef]
- Tang, M.; Fujita, N. Ecosystem-Based Disaster Risk Reduction Interpretation of Landscape Pattern Changes Based on Land Use Changes in Tokyo and Shanghai. In Proceedings of the 2022 3rd International Conference on Geology, Mapping and Remote Sensing (ICGMRS), Zhoushan, China, 22–24 April 2022; pp. 319–322. [Google Scholar]
- Wang, N.; Hao, J.; Zhang, L.; Duan, W.; Shi, Y.; Zhang, J.; Wusimanjiang, P. Basic Farmland Protection System in China: Changes, Conflicts and Prospects. Agronomy 2023, 13, 651. [Google Scholar] [CrossRef]
- Wu, L.; Sun, C.; Fan, F. Estimating the Characteristic Spatiotemporal Variation in Habitat Quality Using the InVEST Model—A Case Study from Guangdong–Hong Kong–Macao Greater Bay Area. Remote Sens. 2021, 13, 1008. [Google Scholar] [CrossRef]
- Hu, N.; Xu, D.; Zou, N.; Fan, S.; Wang, P.; Li, Y. Multi-Scenario Simulations of Land Use and Habitat Quality Based on a PLUS-InVEST Model: A Case Study of Baoding, China. Sustainability 2023, 15, 557. [Google Scholar] [CrossRef]
- Zhang, L.; Li, J. Identifying Priority Areas for Biodiversity Conservation Based on Marxan and InVEST Model. Landsc. Ecol. 2022, 37, 3043–3058. [Google Scholar] [CrossRef]
- Gong, J.; Xie, Y.; Cao, E.; Huang, Q.; Li, H. Integration of InVEST-Habitat Quality Model with Landscape Pattern Indexes to Assess Mountain Plant Biodiversity Change: A Case Study of Bailongjiang Watershed in Gansu Province. J. Geogr. Sci. 2019, 29, 1193–1210. [Google Scholar] [CrossRef]

| Index | Expression | Ecological Meaning |
|---|---|---|
| Edge density (ED) | Describes the ratio of the total length of edges in a patch to the area of the landscape. | |
| Landscape division index (DIVISION) | Describes the degree of dispersion of spatial distribution between individuals of different patches in the landscape; the larger the value, the more dispersed the patches are and the higher the degree of fragmentation. | |
| Largest patch index (LPI) | Describes the dominance of the landscape. | |
| Shannon’s evenness index (SHEI) | Describes the degree of patch area uniformity used to characterize different types of patches in the landscape. | |
| Shannon’s diversity index (SHDI) | Describes the diversity of patches. |
| Habitat Type | Habitat Suitability | Cultivated Land | Construction Land | Unused Land | Railroad | Freeway | First Grade Highway | Second Grade Highway |
|---|---|---|---|---|---|---|---|---|
| Cultivated land | 0.4 | 0 | 0.7 | 0.2 | 0.1 | 0.2 | 0.1 | 0.1 |
| Forest | 1 | 0.6 | 0.8 | 0.3 | 0.6 | 0.7 | 0.6 | 0.4 |
| Grassland | 0.9 | 0.5 | 0.6 | 0.4 | 0.3 | 0.5 | 0.4 | 0.2 |
| Water | 0.75 | 0.5 | 0.65 | 0.3 | 0.5 | 0.6 | 0.4 | |
| Unused land | 0.1 | 0.1 | 0.2 | 0 | 0.1 | 0.2 | 0.1 | 0.1 |
| Construction land | 0 | 0 | 0 | 0 | 0 | 0 | 0 | 0 |
| THREAT | MAX_DIST | WEIGHT | DECAY |
|---|---|---|---|
| Cultivated land | 8 | 0.6 | linear |
| Construction land | 10 | 1 | exponential |
| Unused land | 6 | 0.3 | linear |
| Railroad | 6 | 0.5 | linear |
| Freeway | 8 | 0.6 | linear |
| Roads1 | 7 | 0.5 | linear |
| Roads2 | 5 | 0.4 | linear |
| LDD LU/LC Class | GLOBIO LU/LC Classes | MSALU |
|---|---|---|
| Construction land | Built-up areas | 0.5 |
| Unused land | Primary vegetation | 1 |
| Paddy field | All agriculture (Intensive agriculture) | 0.1 |
| Dryland | All agriculture (Low-input agriculture) | 0.3 |
| Deciduous broadleaf forest | Primary vegetation | 1 |
| Evergreen broadleaf forest | Primary vegetation | 1 |
| Evergreen needleleaf forest | Primary vegetation | 1 |
| Deciduous needleleaf forest | Primary vegetation | 1 |
| Natural rangeland | Livestock grazing | 0.7 |
| Mixed forest | Secondary forest | 0.5 |
| Artificial pasture | Man-made pastures | 0.1 |
| Shrublands | Primary vegetation | 1 |
| Water | N/A | N/A |
| Year | Index | Mean | Standard Deviation | Correlation Coefficient | Significance |
|---|---|---|---|---|---|
| 1992 | ED | 14.35938144 | 8.954525214 | 0.361 ** | 0.00 |
| DIVISION | 0.264707311 | 0.136499919 | 0.263 ** | 0.00 | |
| LPI | 80.77653105 | 10.57623656 | −0.282 ** | 0.00 | |
| SHDI | 0.391552075 | 0.19740407 | 0.238 ** | 0.00 | |
| SHEI | 0.466639465 | 0.193177471 | 0.160 ** | 0.00 | |
| 2002 | ED | 26.77697357 | 14.53832237 | 0.435 ** | 0.00 |
| DIVISION | 0.327418713 | 0.148856045 | 0.289 ** | 0.00 | |
| LPI | 76.93705207 | 11.43965846 | −0.286 ** | 0.00 | |
| SHDI | 0.480559341 | 0.207449064 | 0.307 ** | 0.00 | |
| SHEI | 0.538625453 | 0.180570009 | 0.085 ** | 0.00 | |
| 2012 | ED | 27.19431639 | 13.72559616 | 0.357 ** | 0.00 |
| DIVISION | 0.335529341 | 0.142936431 | 0.189 ** | 0.00 | |
| LPI | 76.31449417 | 11.01591754 | −0.185 ** | 0.00 | |
| SHDI | 0.491221455 | 0.200768398 | 0.220 ** | 0.00 | |
| SHEI | 0.55372941 | 0.177987466 | −0.029 ** | 0.00 | |
| 2022 | ED | 27.43567592 | 13.22122537 | 0.303 ** | 0.00 |
| DIVISION | 0.343426979 | 0.140323342 | 0.138 ** | 0.00 | |
| LPI | 75.73118869 | 10.82098927 | −0.134 ** | 0.00 | |
| SHDI | 0.503521907 | 0.199098943 | 0.188 ** | 0.00 | |
| SHEI | 0.562945778 | 0.175130039 | −0.109 ** | 0.00 | |
| 2032 | ED | 27.03093668 | 12.67919913 | 0.263 ** | 0.00 |
| DIVISION | 0.342712214 | 0.139643878 | 0.096 ** | 0.00 | |
| LPI | 75.78397998 | 10.74031103 | −0.089 ** | 0.00 | |
| SHDI | 0.502271679 | 0.199143176 | 0.161 ** | 0.00 | |
| SHEI | 0.567104514 | 0.180149811 | −0.156 ** | 0.00 |
| Year | MSAmax | MSAmean | MSAstddev |
|---|---|---|---|
| 1992 | 1 | 0.270 | 0.300 |
| 2002 | 1 | 0.237 | 0.278 |
| 2012 | 1 | 0.243 | 0.291 |
| 2022 | 1 | 0.223 | 0.276 |
| 2032 | 1 | 0.183 | 0.265 |
Disclaimer/Publisher’s Note: The statements, opinions and data contained in all publications are solely those of the individual author(s) and contributor(s) and not of MDPI and/or the editor(s). MDPI and/or the editor(s) disclaim responsibility for any injury to people or property resulting from any ideas, methods, instructions or products referred to in the content. |
© 2024 by the authors. Licensee MDPI, Basel, Switzerland. This article is an open access article distributed under the terms and conditions of the Creative Commons Attribution (CC BY) license (https://creativecommons.org/licenses/by/4.0/).
Share and Cite
Liao, M.; Zhang, Z.; Yan, R.; Bai, K. The Assessment of Biodiversity Changes and Sustainable Agricultural Development in The Beijing-Tianjin-Hebei Region of China. Sustainability 2024, 16, 5678. https://doi.org/10.3390/su16135678
Liao M, Zhang Z, Yan R, Bai K. The Assessment of Biodiversity Changes and Sustainable Agricultural Development in The Beijing-Tianjin-Hebei Region of China. Sustainability. 2024; 16(13):5678. https://doi.org/10.3390/su16135678
Chicago/Turabian StyleLiao, Meizhe, Zongwen Zhang, Ruirui Yan, and Keyu Bai. 2024. "The Assessment of Biodiversity Changes and Sustainable Agricultural Development in The Beijing-Tianjin-Hebei Region of China" Sustainability 16, no. 13: 5678. https://doi.org/10.3390/su16135678