Article

Assessment and Driving Factors of Embodied Carbon Emissions in the Construction Sector: Evidence from 2005 to 2021 in Northeast China

1
College of Civil and Architectural Engineering, Heilongjiang Institute of Technology, Harbin 150050, China
2
School of Civil & Environmental Engineering and Geography Science, Ningbo University, Ningbo 315211, China
*
Author to whom correspondence should be addressed.
Sustainability 2024, 16(13), 5681; https://doi.org/10.3390/su16135681
Submission received: 2 April 2024 / Revised: 1 July 2024 / Accepted: 2 July 2024 / Published: 3 July 2024
(This article belongs to the Section Air, Climate Change and Sustainability)

Abstract

:
Reducing embodied carbon emissions in the construction sector is pivotal for achieving sustainable development goals, mainly those related to health and well-being, sustainable cities and communities, and climate action. Hence, it is crucial to delve into the trends and influencing factors of construction-embodied carbon, especially in countries like China, where extensive construction projects are underway. Previous studies have investigated carbon emissions at both national and regional levels, whereas research specific to the construction sector in Northeast China remains limited. This study assessed the embodied carbon of the construction sector in Northeast China from 2005 to 2021. The results indicated that embodied carbon initially rose before declining, peaking at 278.9 MtCO2e in 2012. Based on the Logistic Mean Divided Index (LMDI) approach, the variations in embodied carbon were decomposed into seven driving factors, including emission source structure, embodied carbon intensity, construction mechanization, machinery requirement, industrial structure, economic development, and population scale. While construction mechanization and economic development were identified as primary drivers of the changes in embodied carbon, carbon emission intensity and population scale exerted inhibiting effects on the rise. Moreover, potential strategies for mitigating construction-embodied carbon in Northeast China were delineated, underscoring the regionality across different provinces. The results and suggestions can help foster a low-carbon construction industry from a provincial perspective.

1. Introduction

Fostering a sustainable built environment is a crucial factor for attaining carbon peaking and neutrality goals worldwide [1]. As a cornerstone of the economy, the building and construction sector is responsible for approximately 40% of global carbon emissions [2], with China’s national carbon emissions deriving over 50% from this sector [3]. With advancements in building energy efficiency [4,5] and the promotion of renewable energy utilization [6], the carbon emission intensity associated with the operation of existing buildings has been effectively controlled and continues to decrease. However, as a developing nation with a population exceeding 1.4 billion, China is promoting urbanization, improving the living environment, and elevating design standards in tandem with ongoing efforts in economic development. As a result, China’s construction sector has experienced significant expansion recently. According to statistics from the China Statistical Yearbook [7], the annual figures for newly constructed and completed building areas nationwide have averaged approximately 15 billion and 4 billion square meters, respectively, over the past three years. Extensive construction projects have fueled the consumption of building materials. For instance, in 2021 alone, the construction sector consumed over 1.09 billion tons of steel and 2.38 billion tons of cement [8], leading to substantial carbon emissions. In this context, it is imperative to address embodied carbon within the construction sector to implement the vision of a low-carbon economy and society.

1.1. Approaches and Models for Assessing Carbon Emissions

Multiple approaches have been adopted to assess carbon emissions in regard to the building and construction sector from national, regional, and municipal perspectives. While earlier studies primarily concentrated on building operational carbon emissions stemming from energy use [9], recent research has emphasized both embodied and operational carbon emissions throughout the entire supply chain of the sector. At the national level, Onat et al. [10] adopted an input−output analysis to assess carbon emissions in the U.S. residential and commercial building sectors. Zhang and Wang [11] proposed a hybrid approach for conducting the time-series carbon emission assessment in China’s building sector. They compared the contributions of various emission sources to propose carbon reduction strategies. Zhang et al. [12] and Tan et al. [13] developed models to evaluate embodied and operational carbon emissions within the building and construction sector using process-based approaches tailored to their respective focuses. At the regional level, Zhang and Wang [14] introduced a method to assess provincial carbon emissions within China’s building sector based on statistical data. They also proposed regression models for both embodied and operational carbon emissions. Geng et al. [15] assessed building carbon emissions and estimated the corresponding peaks in the Greater Bay Area in China. Khamchiangta and Yamagata [16] used petroleum product and electricity consumption data to map urban carbon emissions from the building sector in Bangkok, Thailand. At the municipal level, Huang et al. [17] conducted a comparative analysis of building operational carbon emissions across 34 Chinese cities and developed predictive models using machine learning algorithms. Luo et al. [18] integrated a geographic information system (GIS) with artificial neural networks to formulate a model for assessing carbon emissions associated with land use in Xi’an, China.

1.2. Logarithmic Mean Divisia Index (LMDI)

Based on the assessment of historical carbon emissions within the building and construction sector, their driving factors were further analyzed to propose potential pathways for promoting carbon reduction. Kaya identity [19], IPAT (Impact = Population × Affluence × Technology) [20], STIRPAT (stochastic impact regression based on IPAT) [21], and the Logarithmic mean Divisia index (LMDI) [22] are commonly used methods for analyzing the influences of various factors. Among them, LMDI decomposition has gained wide usage in evaluating the driving factors of carbon emissions in the building and construction sector. Its popularity stems from its strong interpretability, simple computation, and high flexibility [23]. For instance, Lu et al. [24] utilized LMDI decomposition to analyze the driving factors of energy-related construction-embodied carbon in China’s building industry and proposed carbon reduction policies accordingly. Chen et al. [25] combined kernel density with the LMDI to examine the driving mechanism of residential carbon emissions in China’s urban building sector. Zhang et al. [26] developed an LMDI-based model to analyze the influencing factors of operational carbon emissions, considering different types of public buildings in Xi’an, China. Additionally, they proposed regression models based on the STIRPAT method. Moreover, some studies also incorporated dynamic scenario analysis, sensitivity analysis, and weighted regression models to identify influencing factors [27,28], which integrated temporal and geographical features into the analysis.

1.3. Global Initiatives and Strategies for Carbon Emission Mitigation

The aforementioned studies at various geographical scales can offer valuable insights into the allocation of carbon emissions in the construction sector [29,30,31], and further analysis of influencing factors can be applied to predict carbon peaks and propose scenarios for mitigation strategies [32,33]. Significant international initiatives and agreements, such as the Paris Agreement, have spurred innovation in efforts to combat climate change [34]. Within the building and construction sector, various strategies, including policies, technologies, and management measures, have been proposed to reduce carbon emissions. Various countries worldwide have proposed policies and standards to promote decarbonization. For instance, China has introduced a series of policy documents that aim to foster innovation in enhancing green construction, leveraging clean energy, and promoting energy-saving standards to attain carbon neutrality goals in both residential and commercial buildings [35,36]. The European Union amended the Energy Performance of Buildings Directive to encourage high-energy efficiency and achieve the decarbonization of buildings by 2050 [37]. Australia launched a roadmap mandating a 10% carbon reduction in new buildings from 2020 onwards and incentivized the utilization of low-carbon products to offset embodied carbon [38]. The UK introduced the “Ten Point Plan” to realize a green revolution in the building sector [39] and released a design code to guide the selection of materials and techniques to reduce building-embodied carbon emissions. Some countries, such as the U.S., Sweden, and New Zealand, have proposed methods, standards, and tools for the assessment of both operational and embodied carbon emissions [40]. Moreover, scholars have delved into various technical and management strategies for reducing embodied carbon in the construction sector. Yu et al. [41] and Huang et al. [42] evaluated the carbon footprint of the construction sector globally. The results underlined that electricity and materials were two main contributors to embodied carbon emissions, which can be controlled through the adoption of renewable technologies, substitution of carbon-intensive materials, and promotion of recycling and reuse rates. Some studies [43,44] also emphasized the importance of databases and monitoring systems to decarbonize the built environment. Notably, carbon mitigation in the construction sector also requires collaboration with other sectors, such as transportation. Using local materials, optimizing transport routes, and improving vehicles [45,46] are significant measures for reducing carbon emissions that are relevant to the transportation of construction materials.
While previous studies have analyzed sectoral carbon emissions across various provinces in China, there is an absence of specific research underlining the carbon emissions of the construction sector in Northeast China (NE), which comprises the Heilongjiang (HL), Jilin (JL), and Liaoning (LN) provinces. In recent years, Northeast China has experienced substantial population outflow and is presently undergoing a critical phase of economic transformation. These circumstances have profoundly affected the regional construction sector. In this context, this study aims to evaluate the embodied carbon emissions of the construction sector in Northeast China and analyze their changes and driving forces based on LMDI decomposition. This study explores the dynamic characteristics of embodied carbon emissions within the construction sector in Northeast China. The analysis of driving factors and potential carbon reduction strategies can provide references for fostering a low-carbon construction industry. Moreover, the regional variations in embodied carbon across the construction sectors of different northeast provinces were considered, which can provide insights into policy implications specific to each province. The primary contributions of this study are outlined as follows. Firstly, the historical trajectories of embodied carbon from 2005 to 2021 were analyzed, which revealed the characteristics of the regional construction sector. Secondly, driving factors of embodied carbon were decomposed and compared for different provinces in Northeast China, considering multiple factors corresponding to the population, economy, and technology. Finally, potential strategies were proposed to foster low-carbon development in the construction sector, accounting for the regional differences of construction-embodied carbon. Accordingly, Section 2 introduces the method for embodied carbon assessment and develops an additive LMDI decomposition approach; Section 3 provides a detailed discussion of construction-embodied carbon, the influences of selected driving factors, and recommendations for carbon reduction; and Section 4 summarizes the key findings and potential limitations for future research.

2. Methodology

2.1. Embodied Carbon Assessment

While carbon emissions within the building and construction sector incorporate both embodied and operational carbon emissions, this study focused solely on assessing embodied carbon emissions based on regional statistical data in China. Accordingly, a cradle-to-site system boundary was established, considering the classification and specifics of relevant data. This system boundary encompasses three primary processes: material production, material transportation, and on-site construction [47]. Operational carbon emissions within a cradle-to-grave system boundary were not considered due to potential variations in characteristics and driving factors.
Notably, the embodied carbon of the construction sector was assessed using annual statistics, which were sourced from both ongoing and completed building projects within a certain year. This study defined an assessment period spanning from 2005 to 2021, encompassing embodied carbon emissions associated with the construction of all types of buildings. Moreover, it is essential to differentiate the adopted system boundary from that of an individual building. While embodied carbon emissions from the construction sector are assessed annually [48], the assessment of individual buildings involves the embodied carbon throughout their entire life cycle [49]. Based on the defined system boundary, construction-embodied carbon in Northeast China was calculated as
E ( t ) = j = 1 3 E j ( t ) = j = 1 3 [ E mat , j ( t ) + E tra , j ( t ) + E con , j ( t ) ]
where E(t) is the total embodied carbon of the construction sector in Northeast China of year t; Ej(t) represents embodied carbon of the construction sector in province j in year t; and Emat,j(t), Etra,j(t), and Econ,j(t) are embodied carbon from the production, transportation, and construction processes, respectively, in province j of year t.
Moreover, embodied carbon from the production, transportation, and construction processes can be assessed using a process-based approach as
E mat , j ( t ) = k Q mat , k j ( t ) F mat , k ( t )
E tra , j ( t ) = k Q mat , k j ( t ) γ mat , k F tra , j ( t )
E con , j ( t ) = l Q e , l j ( t ) F e , l j ( t )
where Qmat,kj(t) is the consumption of material k in province j of year t; Fmat,k(t) is the emission factor of material k of year t; γmat,k is the conversion coefficient of material k, which equals to the weight per unit quantity of material; Ftra,k(t) is the emission factor of transporting unit weight of material in province j, which can be estimated according to the transport distance; and Qe,lj(t) and Fe,lj(t) are the consumption and corresponding emission factor of energy l in province j of year t.
Notably, the above equations were proposed to analyze the embodied carbon emissions specified for the construction sector in Northeast China. Hence, emission factors of materials and energy required for embodied carbon assessment were determined based on previous studies [14,50], which were measured according to China’s statistics. This geographical consistency in both the sources of activity data and emission factors can enhance the accuracy and reliability of the assessment results.

2.2. Decomposition Model

As shown in Table 1, various methods and factors were adopted to decompose the carbon emissions related to the building and construction sector in previous studies. Among these methods, the interpretive structural model is a qualitative method which analyzes the relationship among different components of a system based on Boolean matrixes. However, this method is not applicable in the time-series analysis. Comparatively, the LMDI approach can break down the overall changes in construction-embodied carbon into several components which reflect the contributions of driving factors. Compared with traditional Kaya identity and IPAT-based models, the additive LMDI model can consider multiple influencing factors simultaneously, allow for greater flexibility in variable and factor selection, provide quantitative compassion of time-series differences among different factors, and have lower data requirements for analysis. While a more advanced generalized Divisia index method can eliminate the interdependence of adopted factors, it is more complex in terms of model structure and data treatment. Hence, this study adopts the widely used LMDI method in the decomposition analysis.
With respect to the driving factors, Table 1 shows that previous studies relevant to embodied carbon emissions [21,24,51] have considered a broad scope of parameters, which can be roughly classified into three categories encompassing population, economic, and technological factors. Moreover, while some of these studies considered only one aspect of building materials or construction energy use, this study incorporated both in the analysis. With a comprehensive consideration of the characteristics of construction-embodied carbon emissions and the availability of data, this study considered factors including building construction area, quantity of construction machinery, construction value added, regional gross domestic product, and population in the analysis. In this context, embodied carbon of the construction sector in Northeast China is decomposed as
E ( t ) = j i E i j ( t ) = j i E i j ( t ) E j ( t ) · E j ( t ) A j ( t ) · A j ( t ) M j ( t ) · M j ( t ) V j ( t ) · V j ( t ) G j ( t ) · G j ( t ) P j ( t ) · P j ( t )
where Eij(t) is the embodied carbon from source i in province j of year t; Aj(t) is the building construction area in province j of year t; Mj(t) is the quantity of construction machinery in province j of year t; Vj(t) is the construction value added in province j of year t; Gj(t) is the regional gross domestic product in province j of year t; and Pj(t) is the total population in province j of year t.
Moreover, Equation (5) shows that embodied carbon is decomposed using seven factors, which can be further expressed as
E ( t ) = j i E S i j ( t ) · E I j ( t ) · C M j ( t ) · M R j ( t ) · I S j ( t ) · E D j ( t ) · P j ( t )
where ESij(t) is the contribution of source i to the total embodied carbon in province j of year t, incorporating the emission source structure effect; EIj(t) is the embodied carbon per unit construction area in province j of year t, incorporating the carbon emission intensity effect; CMj(t) is the ratio of building construction area to the quantity of machinery in province j of year t, incorporating the construction mechanization effect; MRj(t) is the quantity of machinery required by unit construction value added in province j of year t, incorporating the machinery requirement effect; ISj(t) is the contribution of construction value added to the total gross domestic product in province j of year t, incorporating the industrial structure effect; EDj(t) is the gross domestic product per capita in province j of year t, incorporating the economic development effect; and Pj(t) represents the population scale effect.
Generally, LMDI decomposition can be implemented using either additive or multiplicative forms [23]. This study adopted the additive approach to examine the impacts of each driving factor, as defined in Equation (6). Notably, while this study focused on the construction-embodied carbon in Northeast China, the proposed LMDI approach can also be applied to construction-embodied carbon in other regions by incorporating their social, economic, and technical factors. Based on the concept of LMDI decomposition, the difference in embodied carbon between a specific year and the datum year can be decomposed as
Δ E = E ( t ) E ( t 0 ) = Δ E E S + Δ E E I + Δ E C M + Δ E M R + Δ E I S + Δ E E D + Δ E P
Δ E E S = j i W [ E i j ( t ) , E i j ( 0 ) ] ln E S i j ( t ) E S i j ( 0 )
Δ E E I = j i W [ E i j ( t ) , E i j ( 0 ) ] ln E I j ( t ) E I j ( 0 )
Δ E C M = j i W [ E i j ( t ) , E i j ( 0 ) ] ln C M j ( t ) C M j ( 0 )
Δ E M R = j i W [ E i j ( t ) , E i j ( 0 ) ] ln M R j ( t ) M R j ( 0 )
Δ E I S = j i W [ E i j ( t ) , E i j ( 0 ) ] ln I S j ( t ) I S j ( 0 )
Δ E E D = j i W [ E i j ( t ) , E i j ( 0 ) ] ln E D j ( t ) E D j ( 0 )
Δ E P = j i W [ E i j ( t ) , E i j ( 0 ) ] ln P j ( t ) P j ( 0 )
W [ E i j ( t ) , E i j ( 0 ) ] = E i j ( t ) E i j ( 0 ) ln E i j ( t ) ln E i j ( 0 )
where t0 represents the datum year; ΔE represents the difference in embodied carbon within the period from year t0 to t; and ΔEES, ΔEEI, ΔECM, ΔEMR, ΔEIS, ΔEED, and ΔEP are the differences in embodied carbon contributed by the emission source structure, carbon emission intensity, construction mechanization, machinery requirement, industrial structure, economic development, and population scale effects, respectively.

2.3. Data Collection

To analyze embodied carbon emissions and the corresponding driving factors of the construction sector in northeast provinces from 2005 to 2021, panel data on construction material and energy consumption, as well as values of selected factors, were collected from official published statistics. Specifically, data on the consumption of building materials was obtained from the China Statistical Yearbook on Construction [8]. Owing to the availability of relevant statistical data, only five types of primary materials, including steel, cement, aluminum, glass, and timber, were considered. Construction energy use was achieved from the China Energy Statistical Yearbook [53], which included twelve types of energy incorporating raw coal, cleaned coal, other washed coal, coke, gasoline, diesel, kerosene, fuel oil, liquefied petroleum gas, natural gas, purchased heating, and electricity. Data on building construction area, quantity of construction machinery, construction value added, regional domestic product, and population data were achieved from the China Statistical Yearbook [7]. Notably, as the data required for the assessment and decomposition of embodied carbon emissions within the construction sector were derived from statistical yearbooks, the uncertainty of the results depends on the variations and statistical errors in officially published statistics. Consequently, if the statistics undergo updates or refinements based on future economic censuses, potential changes may manifest in the results, as discussed in Section 3.

3. Results and Discussion

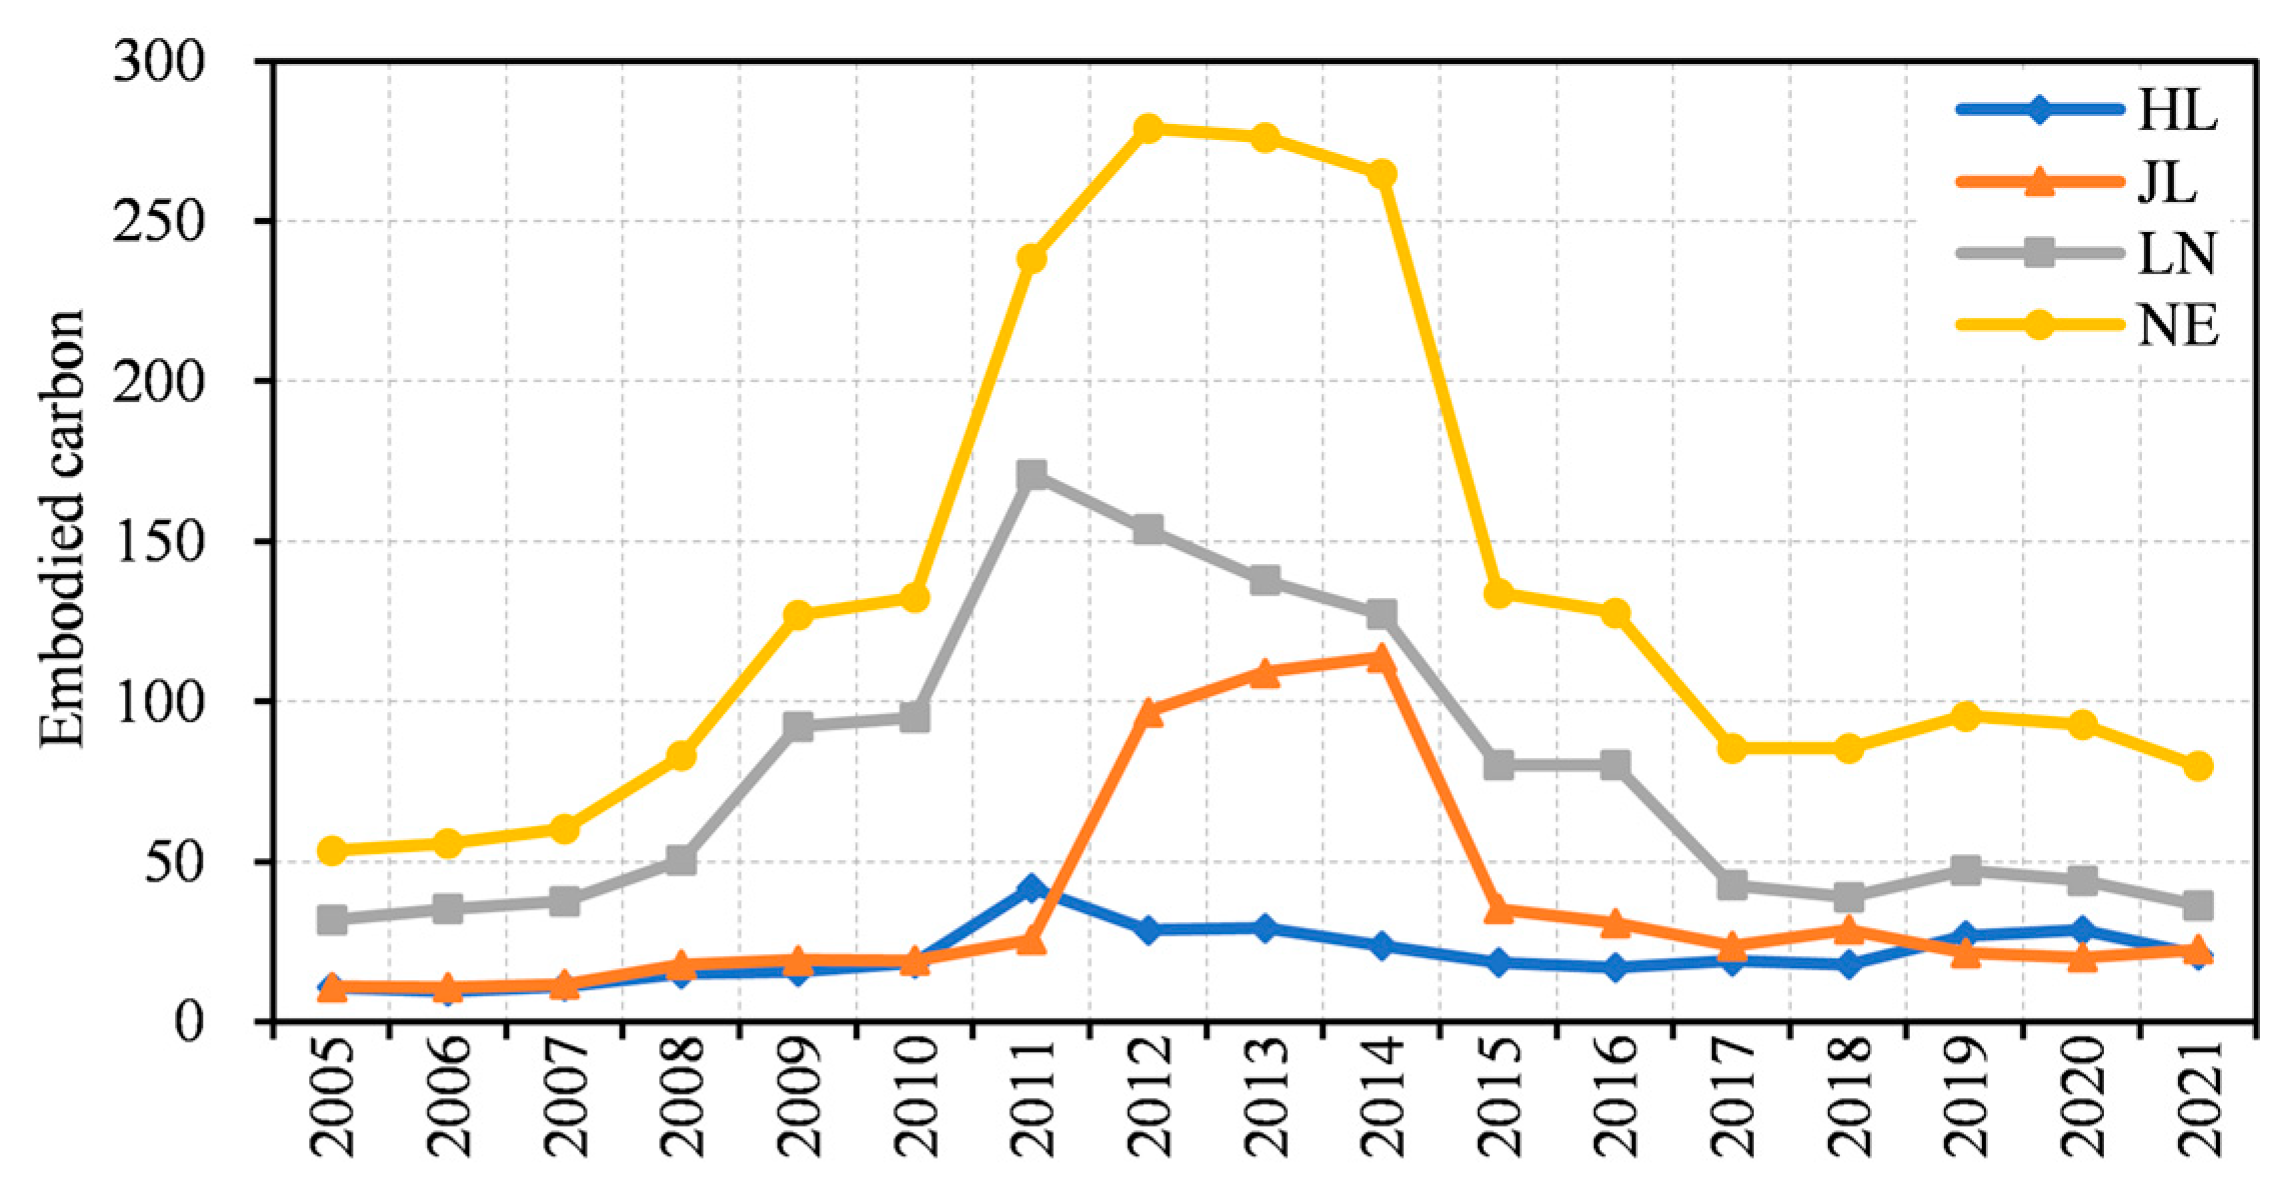
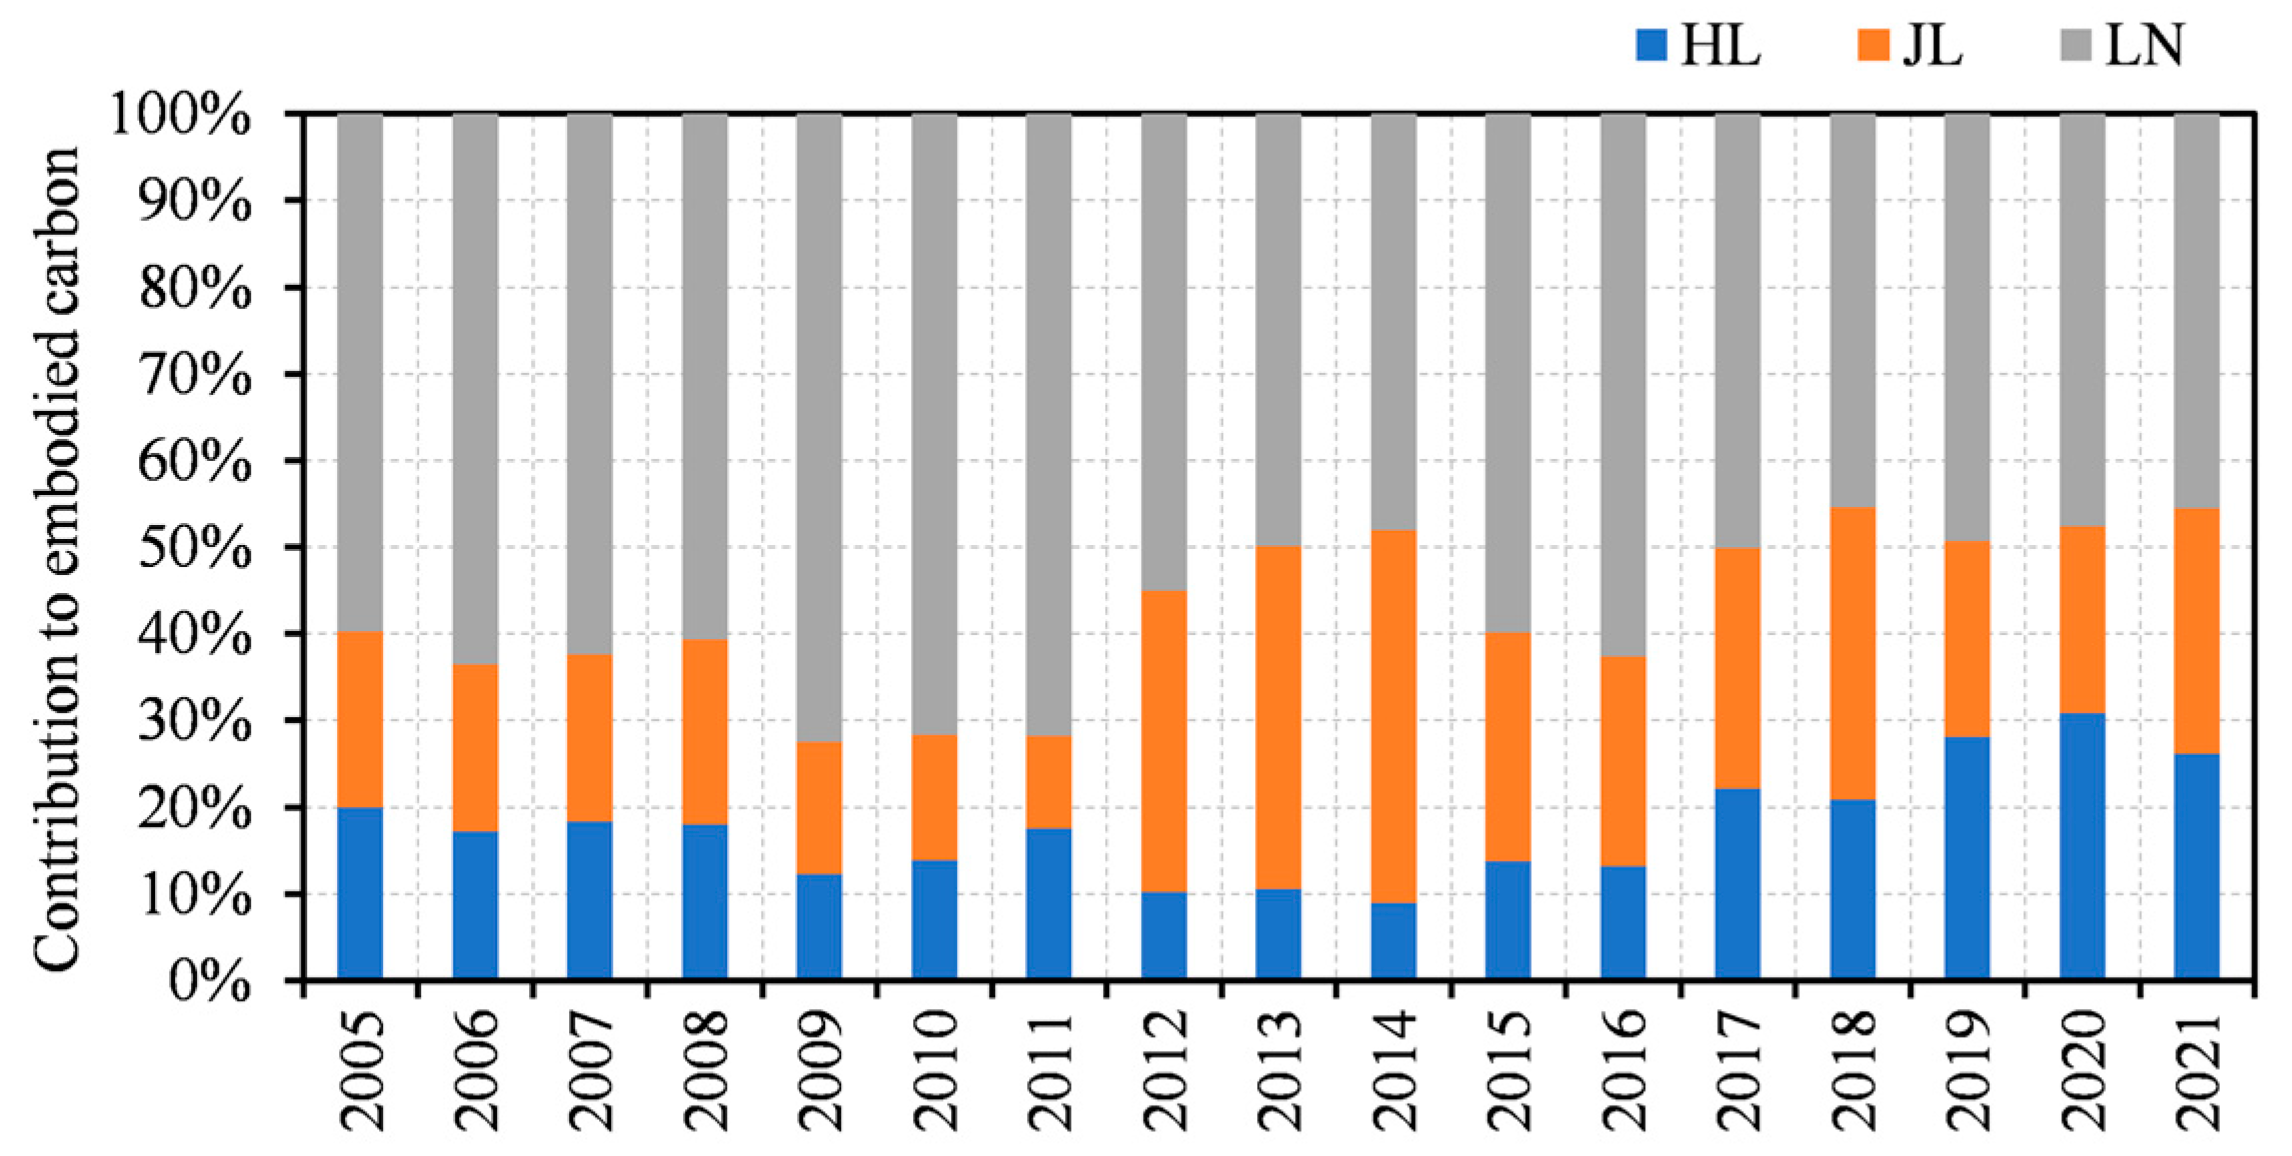
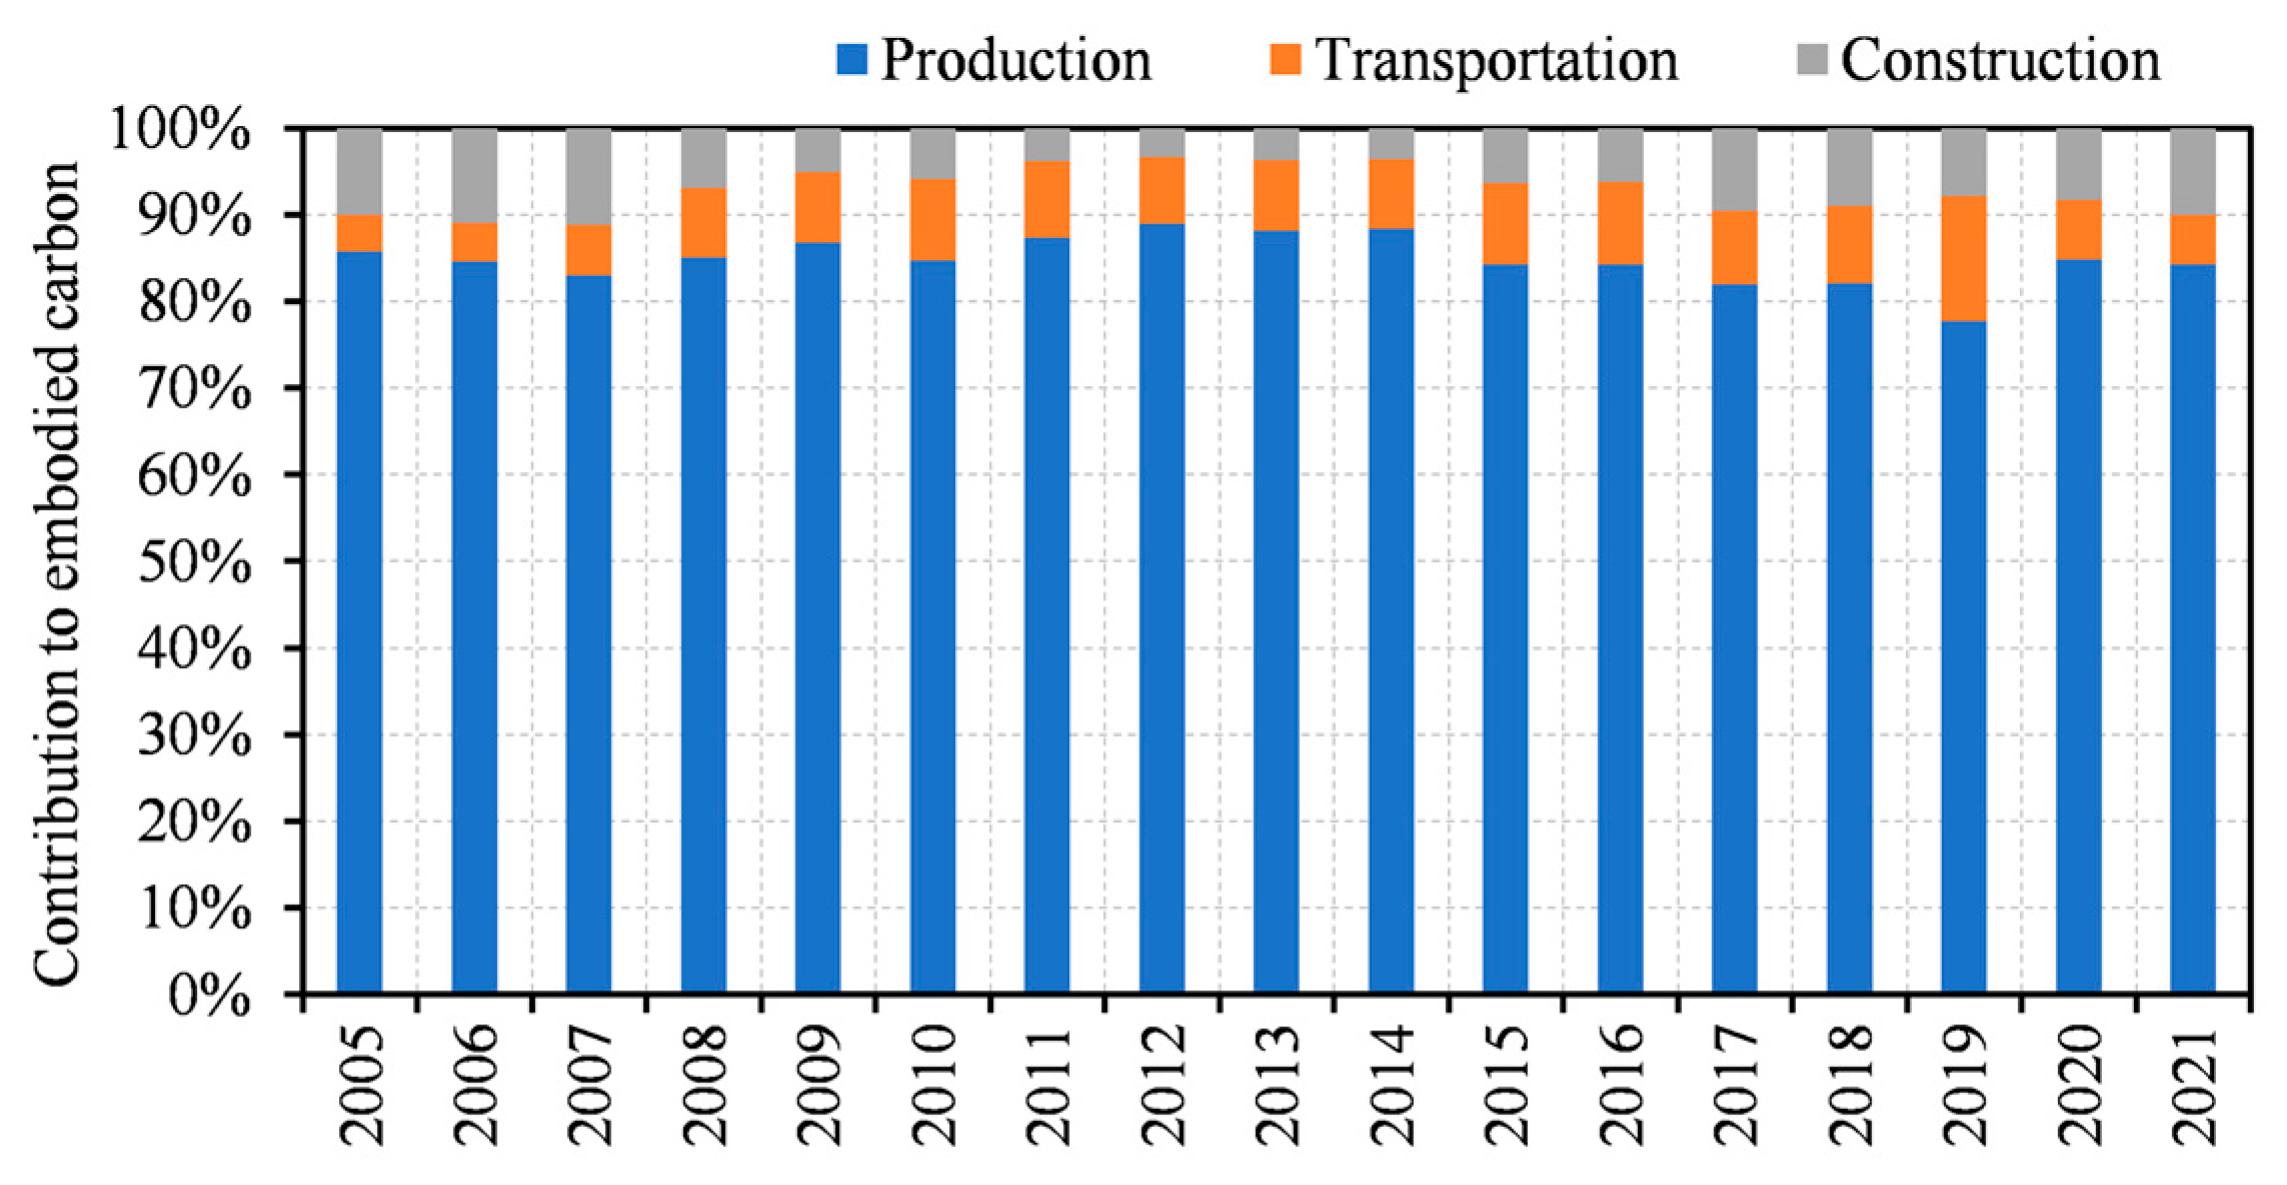
3.1. Embodied Carbon in the Construction Sector

Based on the proposed approach, embodied carbon emissions, encompassing production, transportation, and construction processes, were assessed for the construction sector in Northeast China from 2005 to 2021, and the results were illustrated in Figure 1. Considering the characteristics of carbon emission trajectories, the historical changes in embodied carbon can be divided into three stages. During the first stage, spanning from 2005 to 2010, embodied carbon experienced steady growth, increasing from 53.4 MtCO2e to 132.4 MtCO2e. The most rapid growth in embodied carbon occurred in the construction sector in the LN province among all provinces. During the second stage, spanning from 2010 to 2015, the embodied carbon first dramatically increased and then significantly decreased. Embodied carbon in the construction sector in the JL and LN provinces yielded peak values of 113.9 MtCO2e in 2014 and 171.0 MtCO2e in 2011, respectively. Comparatively, embodied carbon in the HL province changed smoothly with a local extremum of only 41.8 MtCO2e in 2011. As a result, the total embodied carbon of the construction sector in Northeast China peaked at 278.9 MtCO2e in 2012. During the third stage, spanning from 2015 to 2021, while embodied carbon fluctuated to some extent, it exhibited an overall downward trend, decreasing from 133.9 MtCO2e to 79.7 MtCO2e. Moreover, Table A1 summarizes detailed results of embodied carbon within the construction sector in Northeast China.
Based on the results in Table A1, the contributions of the HL, JL, and LN provinces to the total embodied carbon of the construction sector were calculated, and the results are demonstrated in Figure 2. The contribution of the LN province increased from 59.7% in 2005 to a peak value of 71.8% in 2011, whereas it decreased to 45.5% at the end of 2021. For the JL province, the contribution remained around 20% before 2009 and then decreased to a minimum of 10.7% in 2011. The highest contribution reached 43.0% in 2014 owing to a dramatic increase in the construction area. Subsequently, the contribution fluctuated to 28.3% in 2021. Comparatively, the contribution of the HL province decreased from 19.9% in 2005 to 8.9% in 2014 and then raised to 26.1% in 2021. While the LN province remained the most significant contributor with an average proportion of 57.4%, the structure of regional construction-embodied carbon has changed significantly during the assessment period. The results imply that dynamic strategies need to be considered to effectively control embodied carbon relevant to the construction sector in Northeast China.
Figure 3 illustrates the contributions of production, transportation, and construction processes to embodied carbon of the construction sector in Northeast China. The material production process emerged as the most influencing factor affecting sectoral embodied carbon, with its contribution ranging from 77.7% to 88.9% during the assessment period. The transportation and construction processes had similar impacts on embodied carbon, considering their average contributions of 8% and 7.2%, respectively. Moreover, the relevant time-series variabilities in embodied carbon for all processes were not significant (below 3%, as measured by the standard deviation of annual assessment results). For a further comparison of the three provinces, the production process was found to be the most dominant contributor to embodied carbon, with an average contribution assessed at 90.1%. In contrast, the transportation and construction processes played a more significant role in the JL and LN provinces, accounting for approximately 17% on average of the sectoral embodied carbon. Hence, regional variations in construction-embodied carbon should be underlined when developing carbon reduction strategies.
With respect to the largest contributor of embodied carbon as the material production process and its regional differences, Figure 4 further compares the contribution of different materials among the three provinces. As shown in Figure 4a, the average contribution of steel to material-embodied carbon is 45.6% for the entire construction sector in Northeast China. This proportion exhibits slight variations among the HL, JL, and LN provinces, standing at 46.6%, 41.8%, and 44.9%, respectively. The highest contribution of steel embodied carbon was 58.4% in 2009, followed by 57.3% in 2020. Moreover, while the contribution of steel has gradually increased in the HL province recently, this indicator did not show consistent temporal patterns in the other two provinces. Figure 4b shows the contribution of cement to embodied carbon. The average contribution of cement to the entire construction sector in Northeast China was assessed as 43.1%, which was similar to that of steel. However, the relevant contribution showed an overall decreasing trend during the assessment period of cement and reduced to only 37.5% in 2021. Moreover, there were significant differences in the contributions of cement among the HL, JL, and LN provinces, with percentages of 45.3%, 26.3%, and 34.4%, respectively, in 2021.
Based on Figure 4a,b, steel and cement were identified as the main drivers of embodied carbon in the production phase, with a combined contribution of more than 80% throughout the assessment period. Figure 4c shows the total contribution of aluminum, glass, and timber. Among these three types of materials, glass and timber had negligible contributions to the production-embodied carbon in the northeast provinces, and their collective contribution was lower than 2%. Comparatively, aluminum production contributed average proportions of 12.7%, 8.7%, and 10.3%, respectively, for the HL, JL, and LN provinces. The analysis of materials indicates that there is still great potential for utilizing low-carbon materials to reduce construction-embodied carbon corresponding to steel and cement consumption. This can be implemented by using high-performance steel, promoting the use of recycled materials, and seeking sustainable substitutes for cement.

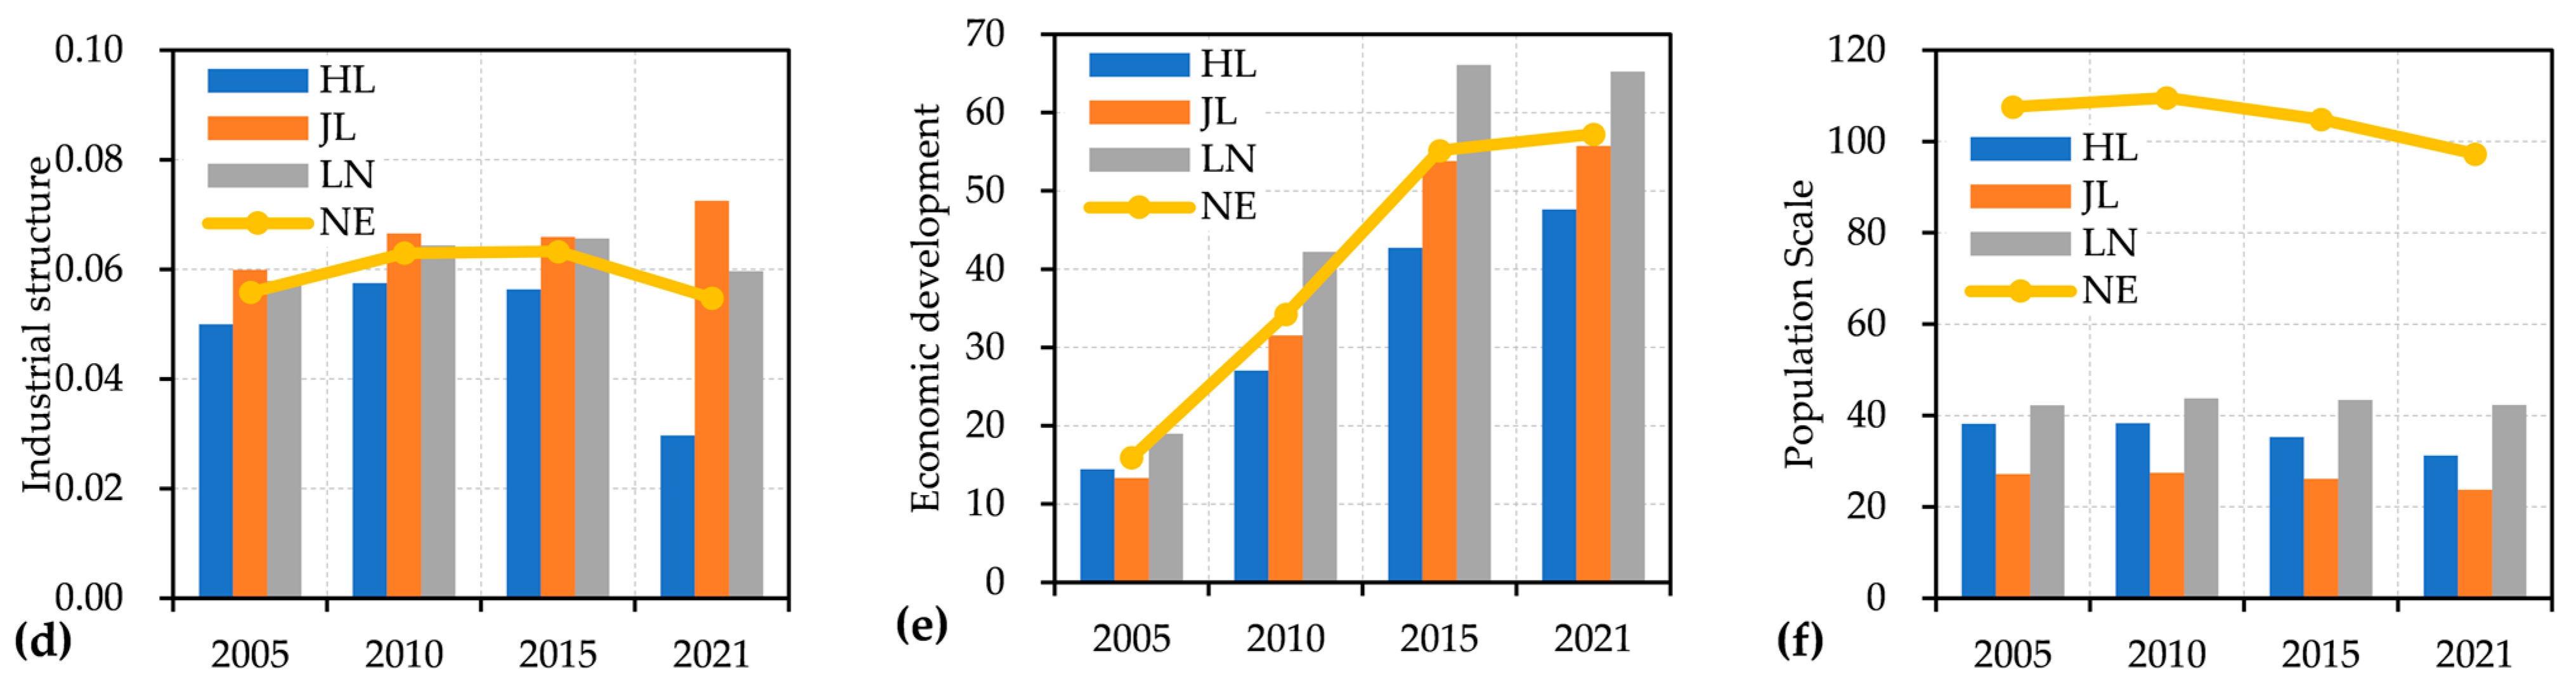
3.2. Driving Factor of Regional Construction-Embodied Carbon

Detailed results of decomposition for embodied carbon of the construction sector in Northeast China are shown in Table 2.
During the period from 2005 to 2012, construction-embodied carbon increased by 225.5 MtCO2e, which was more than four times the total embodied carbon in the datum year. This increase was primarily driven by construction mechanization and economic development effects, considering their contributions of 161.1 and 127.4 MtCO2e, respectively. Emission intensity and industrial structure effects were also considerable factors in the growth of embodied carbon, which were decomposed as 47.7 and 13.8 MtCO2e, respectively. Comparatively, the improvement in machinery efficiency was the only factor that inhibited the increase in construction-embodied carbon during this period. Subsequently, the difference in construction-embodied carbon gradually narrowed compared to the datum year. Considering the results in 2021, the total embodied carbon increase was assessed as 26.3 MtCO2e, which was significantly lower than the peak value. This minor increase was still mainly driven by the construction mechanization and economic development effects, amounting to 180.8 and 165.7 MtCO2e, respectively. However, the decrease in carbon emission intensity and the contraction of the population scale turned into positive factors for carbon reduction in the regional construction industry, especially after 2015.
Considering the regionality of construction-embodied carbon, an LMDI decomposition of driving factors in different regional provinces was conducted, as demonstrated in Figure 5. The assessment period was divided into three stages according to the historical trajectories of embodied carbon in provincial construction sectors, as shown in Figure 1. Years, including 2005, 2010, 2015, and 2021, were set as datum years in the decomposition analysis to explore the cumulative change in construction-embodied carbon between two adjacent datum years. As shown in Figure 5, the influences of the seven driving factors varied across different provinces and stages.
For the HL province (Figure 5a), the increases in construction-embodied carbon in the three stages were assessed as 7.7, 0.1, and 2.4 MtCO2e, respectively. In the first stage, from 2005 to 2010, all driving factors except for the machinery requirement effect contributed to the increase. Among them, construction mechanization and economic development were the two dominators of the increase in embodied carbon, while the effects of emission source structure, carbon emission intensity, and population scale were negligible. In the second stage, from 2010 to 2015, construction mechanization and population scale effects also became inhibiting factors for the increase in embodied carbon, although the cumulative change in this stage was not significant. In the third stage, from 2015 to 2021, the negative effect of population scale on construction-embodied carbon continued to amplify, while the increase in embodied carbon driven by economic development was effectively suppressed. A significant shift was also observed in the industrial structure effect, which emerged as a dominant inhibiting factor of construction-embodied carbon.
For the JN province (Figure 5b), construction-embodied carbon increased by 8.3 and 16.3 MtCO2e in the first two stages, respectively, while it decreased by 12.7 MtCO2e in the third stage. In the first stage, the major driving factors and their effects were consistent with the decomposition results in the HL province. In the second stage, construction mechanization and economic development exerted significant impacts on the growth of embodied carbon. Moreover, carbon emission intensity and machinery requirement showed negative influences on the changes. The population scale effect also slightly inhibited construction-embodied carbon across the last two stages. In the third stage, the increase in embodied carbon relevant to construction mechanization and economic development was significantly reduced. An approximately 36% decrease in embodied carbon was achieved, which was driven by the collaborative effects of improvements in machinery efficiency, decreases in carbon emission intensity and population scale, and changes in emission source structure.
For the LN province (Figure 5c), the changes in construction-embodied carbon during the three stages were assessed as 63.0, –14.8, and –43.8 MtCO2e. In the first stage, construction-embodied carbon increased more than twice that in the datum year, which was mainly driven by construction mechanization and economic development. The only significant inhibiting factor identified within this period was machinery requirement. In the second stage, while embodied carbon experienced dramatic fluctuations, construction mechanization and economic development remained the primary factors driving the increase in embodied carbon, whereas the effect of economic development was magnified. Moreover, carbon emission intensity also became a significant negative factor affecting embodied carbon. In the third stage, although changes in carbon emission intensity remained effective for controlling embodied carbon, economic development also became an inhibiting factor. With further narrowed effects of construction mechanization, construction-embodied carbon decreased by more than half.

3.3. Suggestions

As shown in Equations (5)–(15), embodied carbon emissions associated with the regional construction sector were decomposed into seven components. Among them, Figure 5 indicates that the emission source structure had a negligible impact on the results. In this context, Figure 6 delineates the changes in the remaining six influencing factors, encompassing carbon emission intensity, construction mechanization, machinery requirement, industrial structure, economic development, and population scale over the datum years. Based on the decomposition results of construction-embodied carbon and the corresponding shifts in influencing factors in Northeast China, the following suggestions were put forward for promoting low-carbon development in the regional building construction sector:
(1) The emission intensity decreased from 0.465 to 0.260 tCO2e per unit construction area (m2) between 2011 and 2021, resulting in a reduction of 59.0 tCO2e. Therefore, controlling emission intensity can serve as a crucial strategy for reducing embodied carbon in the construction sector, especially in the HL province. This can be implemented by minimizing material consumption through optimizing building design, utilizing low-carbon materials, and promoting material recycling and reuse. Moreover, Northeast China boasts a strong industrial foundation and abundant natural resources. The enhancements in production efficiency and the adoption of local products can also play a crucial role in reducing carbon emissions relevant to building materials. In this context, governments can incentivize industrial enterprises and constructors to collaborate on the production and utilization of low-carbon materials through both management and financial mechanisms.
(2) While construction mechanization and machinery efficiency may have contrasting effects on the changes in carbon emission, their combined effects lead to a reduction in embodied carbon by 80.2 tCO2e. Hence, while enhancing construction mechanization in modern construction practices, reducing the demands for machinery and promoting machinery efficiency can be potentially effective measures for carbon reduction. The replacement of fossil fuels with renewable energy and the application of artificial intelligence in construction management can be potential pathways to achieve the promotion of reducing machinery-related carbon emissions.
(3) Although the industrial structure had limited impacts on construction-embodied carbon throughout the entire assessment period, it has begun to contribute positively to carbon reduction since 2018, primarily due to the decrease in the proportion of construction value added to the regional gross domestic product. Continuously promoting adjustments to the industrial structure can be a beneficial factor in achieving emission reductions within the construction industry.
(4) The regional gross domestic product per capita increased from CNY 15.9 to 57.3 thousand from 2005 to 2021, leading to a significant increase in embodied carbon by 165.7 tCO2e. However, its impact has been successfully controlled in recent years. With the ongoing green economic transformation, it is anticipated that economic development will not impede carbon reduction efforts within the construction sector in Northeast China.
(5) The total population in Northeast China has steadily declined from 107.6 to 97.3 million people. This population outflow has led to a reduction in embodied carbon by 11.4 tCO2e. As the cumulative increase in construction-embodied carbon was evaluated as 26.3 tCO2e during the period from 2005 to 2021, the influence of the population should be considered for controlling embodied carbon within the construction sector. Notably, with the improvement in living standards, it becomes critical to strengthen public awareness of green development and encourage the acquisition and utilization of green buildings to foster a sustainable construction industry.
(6) Other potential strategies to reduce embodied carbon in the construction sector in Northeast China can be outlined as intensive use of civil land resources, reasonable building block planning, utilization of vacant buildings, renovation of old communities, and control of construction scales. These measures require joint efforts from the government, enterprises, and the public.
(7) Despite the geographical, social, and cultural similarities among the three northeast provinces, it is crucial to recognize the regionality of carbon reduction strategies within the construction sector based on the specific characteristics of embodied carbon and relevant influencing factors. For instance, while the effects of carbon emission intensity and machinery requirement should be better controlled in the HL province, industrial structure needs to be effectively adjusted in the JL and LN provinces.
The identified driving factors were also compared with previous studies aimed at other countries or regions to explore their unique characteristics. Zhu et al. [21] indicated that building construction area and emission intensity had significant influences on embodied carbon in the national construction sector in China. They suggested controlling the building scale and material supply as strategies for carbon reduction. Lu et al. [24] proposed that building material consumption led to an increase in China’s construction-embodied carbon emissions, while energy intensity and machinery efficiency had opposite effects. These results aligned with the findings of this study. Additionally, Wu et al. [51] underlined that promoting energy efficiency and decreasing emission factors were among the most effective factors in reducing building-embodied carbon emissions. Other studies on operational carbon emissions [22,25,26] have raised awareness of additional significant factors, including energy structure, economic development, and population size, which were also considered in this study. These studies have also revealed the significance of regional differences in carbon emission trajectories and carbon reduction pathways. Notably, recent studies [54,55,56] have identified other potential factors, such as the urbanization rate and policy effects, which can be further explored in regard to the construction sector in Northeast China in future research.

4. Conclusions

This study assessed embodied carbon emissions within the building construction sector in Northeast China from 2005 to 2021. The historical trajectories and characteristics of embodied carbon were compared across the HL, JL, and LN provinces, and relevant driving factors were analyzed based on an LMDI decomposition model. Moreover, suggestions were proposed for promoting low-carbon development in the regional construction sector. The main findings are summarized as follows:
(1) Although the trends of carbon emissions showed similarities across different provinces, the total construction-embodied carbon in Northeast China increased from 53.4 MtCO2e in 2005 to a peak value of 278.9 MtCO2e in 2012, followed by a decline to 79.7 MtCO2e in 2021. The LN province was identified as the major contributor to embodied carbon; however, the disparity in the contributions of the three provinces has recently diminished.
(2) The material production process was the most influencing factor of embodied carbon, with an average contribution of approximately 85% and a relevant standard deviation below 3%. Among the five types of materials, steel, and cement were identified as the main contributors to embodied carbon, which highlights the necessity for promoting the utilization of low-carbon materials.
(3) Construction mechanization, economic development, and machinery requirement effects were identified as significant factors influencing the changes in embodied carbon in Northeast China’s construction sector. However, the effects of carbon emission intensity and population scale showed dynamic fluctuations during the assessment period. Moreover, trajectories and changes in construction-embodied carbon showed significant provincial disparities, which should be underlined for customizing sustainable construction technologies and strategies.
(4) Based on the correlation analysis of changes in influencing factors and their respective contributions to carbon emissions, recommendations for carbon reduction in the construction sector were discussed. Potential measures were proposed, including minimizing material consumption, utilizing low-carbon materials, reducing machinery requirements, promoting machinery efficiency, adjusting the industrial structure, developing a green economy, and bolstering public awareness.
Notably, while this study offers insights into the characteristics and driving factors of building carbon emissions in Northeast China, the analysis has concentrated on embodied carbon associated with material production, transportation, and construction phases. Further research can investigate operational carbon emissions, which are also crucial in achieving a sustainable built environment. Additionally, this study considered factors such as building construction area, construction machinery, construction value added, gross domestic product, and population. Further examination and decoupling of other social, economic, technical, and policy factors can also prove beneficial for promoting sustainability within the regional building sector.

Author Contributions

Conceptualization, X.Z. and X.S.; data curation, X.S.; Funding acquisition, X.Z.; investigation, X.Z. and X.S.; methodology, X.Z.; supervision, X.Z.; validation, X.Z. and X.S.; visualization, X.Z. and X.S.; writing—original draft, X.Z. and X.S.; writing—review and editing, X.Z. and X.S. All authors have read and agreed to the published version of the manuscript.

Funding

This research was funded by the Zhejiang Provincial Natural Science Foundation of China (LQ22E080001), National Natural Science Foundation of China (52108152), and Natural Science Foundation of Ningbo (2023J073).

Institutional Review Board Statement

Not applicable.

Informed Consent Statement

Not applicable.

Data Availability Statement

Research data have been introduced in the published article. Further data can be accessed from the corresponding author on reasonable request.

Conflicts of Interest

The authors declare no conflicts of interest.

Nomenclature

Notations
E(t)Embodied carbon of the construction sector in Northeast China of year t
Ej(t)Embodied carbon of the construction sector in province j in year t
Emat,j(t)Embodied carbon from the production process in province j of year t
Etra,j(t)Embodied carbon from the transportation process in province j of year t
Econ,j(t)Embodied carbon from the construction process in province j of year t
Qmat,kj(t)Consumption of material k in province j of year t
Fmat,k(t)Emission factor of material k of year t
γmat,kConversion coefficient of material k
Ftra,k(t)Emission factor of transporting unit weight of material in province j
Qe,lj(t)Consumption of energy l in province j of year t
Fe,lj(t)Emission factor of energy l in province j of year t
Eij(t)Embodied carbon from source i in province j of year t
Aj(t)Building construction area in province j of year t
Mj(t)Quantity of construction machinery in province j of year t
Vj(t)Construction value added in province j of year t
Gj(t)Regional gross domestic product in province j of year t
Pj(t)Population in province j of year t
ESij(t)Contribution of source i to the total embodied carbon in province j of year t
EIj(t)Embodied carbon per unit construction area in province j of year t
CMj(t)Ratio of building construction area to the quantity of machinery in province j of year t
MRj(t)Quantity of machinery required by unit construction value added in province j of year t
ISj(t)Contribution of construction value added to the total gross domestic product in province j of year t
EDj(t)Gross domestic product per capita in province j of year t
Pj(t)Population scale effect
t0Datum year
ΔEDifference in embodied carbon within the period from year t0 to t
ΔEESDifference in embodied carbon contributed by the emission source structure effect
ΔEEIDifference in embodied carbon contributed by the carbon emission intensity effect
ΔECMDifference in embodied carbon contributed by the construction mechanization effect
ΔEMRDifference in embodied carbon contributed by the machinery requirement effect
ΔEISDifference in embodied carbon contributed by the industrial structure effect
ΔEEDDifference in embodied carbon contributed by the economic development effect
ΔEpDifference in embodied carbon contributed by the population scale effect
Abbreviations
LMDILogistic Mean Divided Index
GISGeographic information system
IPATImpact = Population × Affluence × Technology
STIRPATStochastic impact regression based on IPAT
NENortheast China
HLHeilongjiang Province
JLJilin Province
LNLiaoning Province

Appendix A

Table A1. Embodied carbon emissions (MtCO2e) in the construction sector in Northeast China.
YearHL ProvinceJL ProvinceLN Province
Emat,j(t)Etra,j(t)Econ,j(t)Emat,j(t)Etra,j(t)Econ,j(t)Emat,j(t)Etra,j(t)Econ,j(t)
200510.010.190.438.440.182.2627.351.842.69
20068.860.190.498.010.162.5430.092.153.02
200710.300.230.488.780.182.6530.913.143.56
200813.740.660.5115.310.891.5741.525.123.67
200914.280.680.6316.571.011.7479.308.624.09
201016.530.830.9616.121.002.0579.4610.674.79
201138.971.451.3821.981.242.27147.2318.225.55
201226.011.041.4890.633.602.55131.3117.045.25
201326.591.141.4899.216.343.50117.4415.195.23
201420.891.151.58103.816.573.49109.1113.684.42
201516.070.831.5529.912.063.3266.829.733.59
201614.460.821.5426.081.623.2167.099.773.15
201716.550.811.5218.981.193.5734.465.163.10
201815.360.891.4823.151.564.0431.445.112.18
201923.721.721.3916.311.214.0034.1810.792.15
202025.711.591.3714.761.074.1938.303.742.09
202118.361.111.3616.991.094.5031.772.392.13

References

  1. Mallapaty, S. How China could be carbon neutral by mid-century. Nature 2020, 586, 482–483. [Google Scholar] [CrossRef] [PubMed]
  2. Nwodo, M.N.; Anumba, C.J. A review of life cycle assessment of buildings using a systematic approach. Build. Environ. 2019, 162, 106290. [Google Scholar] [CrossRef]
  3. China Association of Building Energy Efficiency. 2022 Research Report on Carbon Emissions of China Urban and Rural Construction. 2023. Available online: https://www.cabee.org/upload/file/20230104/1672820934145324.pdf (accessed on 2 April 2024).
  4. Hashempour, N.; Taherkhani, R.; Mahdikhani, M. Energy performance optimization of existing buildings: A literature review. Sustain. Cities Soc. 2020, 72, 101967. [Google Scholar] [CrossRef]
  5. Rivera, M.L.; MacLean, H.L.; McCabe, B. Implications of passive energy efficiency measures on life cycle greenhouse gas emissions of high-rise residential building envelopes. Energy Build. 2021, 249, 111202. [Google Scholar] [CrossRef]
  6. Moran, P.; Goggins, J.; Hajdukiewicz, M. Super-insulate or use renewable technology? Life cycle cost, energy and global warming potential analysis of nearly zero energy buildings (NZEB) in a temperate oceanic climate. Energy Build. 2017, 139, 590–607. [Google Scholar] [CrossRef]
  7. National Bureau of Statistics. China Statistical Yearbook; China Statistics Press: Beijing, China, 2023. Available online: https://www.stats.gov.cn/sj/ndsj/2023/indexeh.htm (accessed on 2 April 2024).
  8. National Bureau of Statistics. China Statistical Yearbook on Construction; China Statistics Press: Beijing, China, 2022. (In Chinese)
  9. Swan, L.G.; Ugursal, V.I. Modeling of end-use energy consumption in the residential sector: A review of modeling techniques, Renew. Sustain. Energy Rev. 2009, 13, 1819–1835. [Google Scholar] [CrossRef]
  10. Onat, N.C.; Kucukvar, M.; Tatari, O. Scope-based carbon footprint analysis of U.S. residential and commercial buildings: An input-output hybrid life cycle assessment approach. Build. Environ. 2014, 72, 53–62. [Google Scholar] [CrossRef]
  11. Zhang, X.; Wang, F. Hybrid input-output analysis for life-cycle energy consumption and carbon emissions of China’s building sector. Build. Environ. 2016, 104, 188–197. [Google Scholar] [CrossRef]
  12. Zhang, Y.; Yan, D.; Hu, S.; Guo, S. Modelling of energy consumption and carbon emission from the building construction sector in China, a process-based LCA approach. Energy Policy 2019, 134, 110949. [Google Scholar] [CrossRef]
  13. Tan, X.; Lai, H.; Gu, B.; Zeng, Y.; Li, H. Carbon emission and abatement potential outlook in China’s building sector through 2050. Energy Policy 2018, 118, 429–439. [Google Scholar] [CrossRef]
  14. Zhang, X.; Sun, J.; Zhang, X.; Wang, F. Assessment and regression of carbon emissions from the building and construction sector in China: A provincial study using machine learning. J. Clean. Prod. 2024, 450, 141903. [Google Scholar] [CrossRef]
  15. Geng, J.; Wang, J.; Huang, J.; Zhou, D.; Bai, J.; Wang, J.; Zhang, H.; Duan, H.; Zhang, W. Quantification of the carbon emission of urban residential buildings: The case of the Greater Bay Area cities in China. Environ. Impact Assess. Rev. 2022, 95, 106775. [Google Scholar] [CrossRef]
  16. Khamchiangta, D.; Yamagata, Y. Mapping urban carbon emissions in relation to local climate zones: Case of the building sector in Bangkok Metropolitan Administration, Thailand. Energy Built Environ. 2024, 5, 337–347. [Google Scholar] [CrossRef]
  17. Huang, R.; Zhang, X.; Liu, K. Assessment of operational carbon emissions for residential buildings comparing different machine learning approaches: A study of 34 cities in China. Build. Environ. 2024, 250, 111176. [Google Scholar] [CrossRef]
  18. Luo, H.; Li, Y.; Gao, X.; Meng, X.; Yang, X.; Yan, J. Carbon emission prediction model of prefecture-level administrative region: A land-use-based case study of Xi’an city, China. Appl. Energy 2023, 348, 121488. [Google Scholar] [CrossRef]
  19. Wu, Y.; Shen, J.; Zhang, X.; Skitmore, M.; Lu, W. The impact of urbanization on carbon emissions in developing countries: A Chinese study based on the U-Kaya method. J. Clean. Prod. 2017, 135, 589–603. [Google Scholar] [CrossRef]
  20. Zou, C.; Ma, M.; Zhou, N.; Feng, W.; You, K.; Zhang, S. Toward carbon free by 2060: A decarbonization roadmap of operational residential buildings in China. Energy 2023, 277, 127689. [Google Scholar] [CrossRef]
  21. Zhu, C.; Chang, Y.; Li, X.; Shan, M. Factors influencing embodied carbon emissions of China’s building sector: An analysis based on extended STIRPAT modeling. Energy Build. 2022, 255, 111607. [Google Scholar] [CrossRef]
  22. Li, Y.; Wang, J.; Deng, B.; Liu, B.; Zhang, L.; Zhao, P. Emission reduction analysis of China’s building operations from provincial perspective: Factor decomposition and peak prediction. Energy Build. 2023, 296, 113366. [Google Scholar] [CrossRef]
  23. Ang, B.W. The LMDI approach to decomposition analysis: A practical guide. Energy Policy 2005, 33, 867–871. [Google Scholar] [CrossRef]
  24. Lu, Y.; Cui, P.; Li, D. Carbon emissions and policies in China’s building and construction industry: Evidence from 1994 to 2012. Build. Environ. 2016, 95, 94–103. [Google Scholar] [CrossRef]
  25. Chen, H.; Du, Q.; Huo, T.; Liu, P.; Cai, W.; Liu, B. Spatiotemporal patterns and driving mechanism of carbon emissions in China’s urban residential building sector. Energy 2023, 263, 126102. [Google Scholar] [CrossRef]
  26. Zhang, J.; Yan, Z.; Bi, W.; Ni, P.; Lei, F.; Yao, S.; Lang, J. Prediction and scenario simulation of the carbon emissions of public buildings in the operation stage based on an energy audit in Xi’an, China. Energy Policy 2023, 173, 113396. [Google Scholar] [CrossRef]
  27. Du, Z.; Liu, Y.; Zhang, Z. Spatiotemporal analysis of influencing factors of carbon emission in public buildings in China. Buildings 2022, 12, 424. [Google Scholar] [CrossRef]
  28. Huo, T.; Ma, Y.; Cai, W.; Liu, B.; Mu, L. Will the urbanization process influence the peak of carbon emissions in the building sector? A dynamic scenario simulation. Energy Build. 2021, 232, 110590. [Google Scholar] [CrossRef]
  29. Kong, Y.; Zhao, T.; Yuan, R.; Chen, C. Allocation of carbon emission quotas in Chinese provinces based on equality and efficiency principles. J. Clean. Prod. 2019, 211, 222–232. [Google Scholar] [CrossRef]
  30. Zhou, P.; Ang, B.W.; Wang, H. Energy and CO2 emission performance in electricity generation: A non-radial directional distance function approach. Eur. J. Oper. Res. 2012, 221, 625–635. [Google Scholar] [CrossRef]
  31. Feng, C.; Chu, F.; Ding, J.; Bi, G.; Liang, L. Carbon Emissions Abatement (CEA) allocation and compensation schemes based on DEA. Omega 2015, 53, 78–89. [Google Scholar] [CrossRef]
  32. Xin, L.; Li, S.; Rene, E.R.; Lun, X.; Zhang, P.; Ma, W. Prediction of carbon emissions peak and carbon neutrality based on life cycle CO2 emissions in megacity building sector: Dynamic scenario simulations of Beijing. Environ. Res. 2023, 238, 117160. [Google Scholar] [CrossRef]
  33. Zhu, C.; Li, X.; Zhu, W.; Gong, W. Embodied carbon emissions and mitigation potential in China’s building sector: An outlook to 2060. Energy Policy 2022, 170, 113222. [Google Scholar] [CrossRef]
  34. Filonchyk, M.; Peterson, M.; Zhang, L.; Hurynovich, V.; He, Y. Greenhouse gases emissions and global climate change: Examining the influence of CO2, CH4, and N2O. Sci. Total Environ. 2024, 935, 173359. [Google Scholar] [CrossRef] [PubMed]
  35. Ma, M.; Ma, X.; Cai, W.; Cai, W. Low carbon roadmap of residential building sector in China: Historical mitigation and prospective peak. Appl. Energy 2020, 273, 115247. [Google Scholar] [CrossRef]
  36. Lu, M.; Lai, J. Review on carbon emissions of commercial buildings. Renew. Sustain. Energy Rev. 2020, 119, 109545. [Google Scholar] [CrossRef]
  37. Ali, K.A.; Ahmad, M.I.; Yusup, Y. Issues, impacts, and mitigations of carbon dioxide emissions in the building sector. Sustainability 2020, 12, 7427. [Google Scholar] [CrossRef]
  38. Green Building Council Australia. A Carbon Positive Roadmap for Buildings. Available online: https://gbca-web.s3.amazonaws.com/media/documents/carbon-positive-roadmap-summary-paper-fa-web_onU8cXm.pdf (accessed on 10 June 2024).
  39. The UK Government. Net Zero Strategy: Build Back Greener. 2021. Available online: https://www.gov.uk/government/publications/net-zero-strategy (accessed on 10 June 2024).
  40. Le, A.; Rodrigo, N.; Domingo, N.; Senaratne, S. Policy Mapping for Net-Zero-Carbon Buildings: Insights from Leading Countries. Buildings 2023, 13, 2766. [Google Scholar] [CrossRef]
  41. Yu, M.; Wiedmann, T.; Crawford, R.; Tait, C. The carbon footprint of Australia’s construction sector. Procedia Eng. 2017, 180, 211–220. [Google Scholar] [CrossRef]
  42. Huang, L.; Krigsvoll, G.; Johansen, F.; Liu, Y.; Zhang, X. Carbon emission of global construction sector. Renew. Sustain. Energy Rev. 2018, 81, 1906–1916. [Google Scholar] [CrossRef]
  43. Clarke, J.; Littlewood, J.R.; Karani, G. Developing tools to enable the UK construction industry to adopt the active building concept for net zero carbon buildings. Buildings 2023, 13, 304. [Google Scholar] [CrossRef]
  44. Wilkinson, S.; Ghosh, S.; Quintana Vigiola, G. Decarbonising Australian housing: Policy, problems, profiles of current stock and progress. Hous. Financ. Int. 2021, XXXVI, 40–49. [Google Scholar]
  45. Zhang, X.; Li, Y.; Chen, H.; Yan, X.; Liu, K. Characteristics of embodied carbon emissions for high-rise building construction: A statistical study on 403 residential buildings in China. Resour. Conser. Recycl. 2023, 198, 107200. [Google Scholar] [CrossRef]
  46. Filonchyk, M.; Peterson, M. Analysis of air pollution from vehicle emissions for the contiguous United States. J. Geovis. Spat. Anal. 2024, 8, 16. [Google Scholar] [CrossRef]
  47. Malmqvist, T.; Nehasilova, M.; Moncaster, A.; Birgisdottir, H.; Rasmussen, F.N.; Wiberg, A.H.; Potting, J. Design and construction strategies for reducing embodied impacts from buildings—Case study analysis. Energy Build. 2018, 166, 35–47. [Google Scholar] [CrossRef]
  48. Sun, Y.; Hao, S.; Long, X. A study on the measurement and influencing factors of carbon emissions in China’s construction sector. Build. Environ. 2023, 229, 109912. [Google Scholar] [CrossRef]
  49. Karimpour, M.; Belusko, M.; Xing, K.; Bruno, F. Minimising the life cycle energy of buildings: Review and analysis. Build. Environ. 2014, 73, 106–114. [Google Scholar] [CrossRef]
  50. Zhang, X.; Zhu, Q.; Zhang, X. Carbon emission intensity of final electricity consumption: Assessment and decomposition of regional power grids in China from 2005 to 2020. Sustainability 2023, 15, 9946. [Google Scholar] [CrossRef]
  51. Wu, P.; Song, Y.; Zhu, J.; Chang, R. Analyzing the influence factors of the carbon emissions from China’s building and construction industry from 2000 to 2015. J. Clean. Prod. 2019, 221, 552–566. [Google Scholar] [CrossRef]
  52. Huo, T.; Cong, X.; Cheng, C.; Cai, W.; Zuo, J. What is the driving mechanism for the carbon emissions in the building sector? An integrated DEMATEL-ISM model. Energy 2023, 274, 127399. [Google Scholar] [CrossRef]
  53. National Bureau of Statistics. China Energy Statistical Yearbook; China Statistics Press: Beijing, China, 2022. (In Chinese)
  54. Azizalrahman, H.; Hasyimi, V. A model for urban sector drivers of carbon emissions. Sustain. Cities Soc. 2019, 44, 46–55. [Google Scholar] [CrossRef]
  55. Huang, Y.; Matsumoto, K. Drivers of the change in carbon dioxide emissions under the progress of urbanization in 30 provinces in China: A decomposition analysis. J. Clean. Prod. 2021, 322, 129000. [Google Scholar] [CrossRef]
  56. Zhang, Y.; Cheng, H. The impact mechanism of the ETS on CO2 emissions from the service sector: Evidence from Beijing and Shanghai. Technol. Forecast. Soc. Change 2021, 173, 121114. [Google Scholar] [CrossRef]
Figure 1. Embodied carbon (MtCO2e) in the construction sector in Northeast China from 2005 to 2021.
Sustainability 16 05681 g001
Figure 2. Contribution of different provinces to embodied carbon in the construction sector in Northeast China.
Sustainability 16 05681 g002
Figure 3. Contribution of different processes to embodied carbon in the construction sector in Northeast China.
Sustainability 16 05681 g003
Figure 4. Contribution of different materials to embodied carbon, relevant to the production process in the construction sector: (a) steel; (b) cement; and (c) aluminum, glass, and timber.
Sustainability 16 05681 g004
Figure 5. Decomposition for embodied carbon (MtCO2e) in the construction sector in: (a) the Heilongjiang province; (b) the Jinlin province; and (c) the Liaoning province.
Sustainability 16 05681 g005
Figure 6. Changes in the influencing factors in the construction sector in Northeast China: (a) embodied carbon intensity (tCO2e per 1 m2 construction area); (b) construction mechanization (m2 per unit machinery); (c) machinery requirement (machinery use per unit construction value added); (d) industrial structure; (e) economic development (CNY 1000 per capita); and (f) population scale (million people).
Sustainability 16 05681 g006aSustainability 16 05681 g006b
Table 1. Influencing factors of carbon emissions within the building and construction sector.
SourceScaleObjectiveMethodInfluencing Factor
Zhu et al. [21]NationalEmbodied carbon emissionsSTIRPATBuilding construction area, completed value of building area, indirect emission intensity, carbon emissions per unit energy consumed, energy intensity, and total factor productivity
Li et al. [22]ProvincialOperational carbon emissionsGeneralized
Divisia index method
Floor space, energy consumption, population scale, and disposable income
Lu et al. [24]NationalEmbodied carbon emissionsLMDIEnergy consumption, construction area, building equipment, building material, and construction output value
Chen et al. [25]ProvincialOperational carbon emissionsLMDIEnergy consumption, urban floor space, number of urban residents, and population
Zhang et al. [26]MunicipalOperational carbon emissionsLMDIEnergy consumption, energy structure, domestic gross product, and population size
Wu et al. [51]NationalEmbodied and operational carbon emissionsLMDIConstruction value added, energy consumption, floor area of completed buildings, floor area of in-use buildings, population, infrastructure development, and material structure
Huo et al. [52]-Operational carbon emissionsInterpretive structural modelIndustrial structure, clean energy proportion, policy factor, technical improvement, energy intensity, electrification rate, carbon emission factor, economic development, user behavior, awareness, urbanization rate, ownership of energy equipment, building energy efficiency, climate, population, building floor space, energy-efficient building floor space, number of households, household size, income, building form, energy consumption, and number of employees
Table 2. Decomposition for embodied carbon (MtCO2e) in the construction sector in Northeast China, considering the datum year as 2005.
YearΔEESΔEEIΔEALΔEMEΔEISΔEEDΔEPΔE
20060.0−5.82.9−4.11.47.30.42.1
20070.1−7.10.7−5.30.817.10.76.9
20080.47.311.8−21.10.030.40.929.6
20091.135.235.5−52.411.841.01.373.5
20101.2−0.288.3−87.810.964.52.179.0
20112.559.5120.7−110.913.097.82.4184.9
20124.447.7161.1−129.013.8127.40.1225.5
20134.539.4169.6−148.57.8151.8−1.8222.7
20144.36.1184.5−159.010.1168.8−3.5211.3
20152.9−58.4159.4−201.811.7171.9−5.280.5
20162.8−31.7152.3−229.131.5154.8−6.374.4
20172.6−55.6129.2−227.530.9159.7−7.332.0
20182.6−41.4137.2−217.7−5.2164.6−8.331.8
20192.8−32.5155.3−237.28.3154.7−9.342.1
20202.7−37.7154.9−236.48.9157.6−10.639.4
20212.6−59.1180.8−261.18.7165.7−11.426.3
Disclaimer/Publisher’s Note: The statements, opinions and data contained in all publications are solely those of the individual author(s) and contributor(s) and not of MDPI and/or the editor(s). MDPI and/or the editor(s) disclaim responsibility for any injury to people or property resulting from any ideas, methods, instructions or products referred to in the content.

