Abstract
Ninh Thuan is a coastal province in the central region of Vietnam and is characterized by a climate that is the hottest and driest in the country. Vietnam is also one of the top five countries most vulnerable to the effects of climate change worldwide. The objective of this study was a thorough evaluation of the quality of water supply sources and the impacts of water effluents from shrimp farms in Ninh Thuan province. The comprehensive evaluation was based on an understanding of the water–wastewater cycle employed in coastal shrimp cultivation. We combined qualitative and quantitative analyses in undertaking this study. Secondary data of groundwater and coastal water from the local periodic water quality monitoring program and national technical regulations were collected in the qualitative approach. We also integrated participatory rural appraisal techniques and field observations to understanding shrimp cultivation and the environmental and social impacts of shrimp farm effluents. The quantitative assessment consisted of measuring groundwater and wastewater contamination from shrimp ponds. As a result, four main reasons for water pollution issues were determined including extreme weather events, shrimp cultivation practices, degraded infrastructure, and mismanagement by local governance. Shrimp cultivation practices (feeding, using chemicals) have resulted in elevated levels of suspended solid (TSS, total Coliform), organic and carbon matter (BOD5, COD), and excessive nutrients (total Nitrogen, NO2-N, NO3-N, PO4-P). According to a local monitoring program, the coastal water and groundwater have experienced nutrient pollution. Groundwater sampling near the shrimp farms identified salinization elevated levels of Coliform from local domestic sewage sources. This study resulted in an integrated approach that evaluated the combined effects of extreme weather events and shrimp farming practices on the quality of coastal water. Also, the finding can be useful in recommending remedial water treatment technologies as a follow-on phase.
1. Introduction
1.1. Effects of Climate Change and Extreme Weather on Coastal Shrimp Farming
Extreme weather events happen when weather is significantly different from usual weather patterns or variability, and extreme events in weather increase both in intensity and frequency [1,2,3,4,5]. Aquaculture is often at risk from one or a combination of the following climatic parameters, including cyclones, droughts, floods, global warming, ocean acidification, abnormal rainfall variation, salinity levels, and sea level rise [3,6,7,8,9,10]. For instance, early or late rainfall with sudden intensity leads to a rapid increase in water volume. This subsequent dilution can dramatically lower the pH, alkalinity, and salinity of the pond water [11,12,13,14]. Additionally, the noise of raindrops causes shrimps to retreat to the pond bottom, which adversely exposes them to accumulated waste and pathogens. A decrease in temperature may cause shrimp to stop eating significantly and it has been reported that neither maturation nor spawning occurs when water temperatures are lower than 17 °C [15]. Temperature and salinity are the top two parameters that shrimp farmers consider as the most impactful as a result of climate change [16,17].
1.2. Optimal Water Parameters for Shrimp Farming
Water temperature is a critical environmental factor for shrimp farming due to its influence on the metabolism of the crustacean, their growth and survival, oxygen consumption and molting cycle, and immune response [18,19,20,21,22,23,24]. The optimum temperature for growth of juvenile Litopenaeus vannamei is 27 °C [22]. The optimal range of pH for maximizing growth of marine shrimp species is in the range of 6.0 to 9.0 [25]. Additionally, Ostrensky, et al. [26] reported that NO2-N concentration in shrimp cultivating water must be lower than 0.09 mg·L−1 to ensure healthy shrimp populations. Boyd and Green [27] suggested that PO4-P concentrations need to be within 0.001 and 0.1 mg·L−1 to avoid plankton blooms. According to Ferreira’s study, the allowable upper limit of total suspended solids for marine shrimp is 100 mg/L [28].
1.3. Pollution Caused by Shrimp Farming Activities
Shrimp farming activities in turn are also a source of water quality pollution in ponds and surrounding habitats. Indeed, in developing countries, shrimp farms are typically established spontaneously and are unplanned. Most farmers have only one to two ponds per household. Their farming area is small with no separate ponds for the settling of suspended solids or water treatment. Therefore, in the event of an outbreak of disease in the shrimp stock, farmers are unable to remove contaminated water for treatment separate to the supply and may circulate water sources that carry pathogens to the cultivating pond. Additionally, waste from shrimp ponds can come from their surplus feed and feces. Excessive feed results in the accumulation of organic and nutrient matters. A high concentration of those wastes is likely to cause eutrophication in the coastal aquatic environment [29].
Overall, the coastal water in shrimp farming areas is exposed to shrimp pond effluents. The situation becomes severe when farming areas do not have separate supply and drainage canals or have a concentrated treatment area. This may lead to water pollution issues in water supply sources for shrimp cultivation. Climate change stressors such as precipitation and temperature, among others, also bring about an increase in nutrients (nitrate, ammonia nitrogen, and phosphate) and persistent organic pollutants and pesticides, respectively, as seen in a review study [30]. Nevertheless, there are limited previous studies addressing the integrated effects of both shrimp cultivation and extreme events of precipitation and temperature on the quality of coastal water resources. These were keen on either shrimp pond’s pollution and risks, e.g., [31,32,33], water quality of the coastal environment, e.g., [29,34,35], or climate change adaptation, e.g., [17,36,37].
1.4. Typical Weather Characteristics of the Ninh Thuan Province
Vietnam has been identified as one of the most vulnerable countries to climate change [38,39,40], and its coastal central provinces including Ninh Thuan are not exempt [41,42]. Ninh Thuan province is a good case study with respect to shrimp farming and climate change interaction. The province has experienced the hottest average temperature and is the most drought prone region in the country. It receives the lowest average rainfall, while storms and floods regularly occur in October and November during the rainy season. The terrain intensifies the damaging impact of storms, characterized by heavy rains and floods, with destructive impacts on aquaculture ecosystems and production [43,44,45].
1.5. Research Objectives and Contributions
The present study aimed to evaluate the quality of water supply sources and water effluents from shrimp farms that are impacted by the combination of extreme weather events and shrimp farming practices. The evaluation relied on an understanding of the coastal water–wastewater cycle through farming practices to identify the main causes of the pollution. Qualitative and quantitative methods were combined to carry out this study. Secondary data on groundwater and coastal water from the local periodic water quality monitoring program and national technical regulations were collected together with field trips and dialogue workshops with stakeholders to understand their shrimp cultivation operation in the qualitative approach. Quantitative assessments of wastewater from shrimp ponds were also conducted by measurement of pH, temperature, ammonium, nitrite, nitrate, inorganic phosphorus, chemical oxygen demand, and biochemical oxygen demand.
The novelty of this study was to assess the water quality of main activities in a water cycle in coastal shrimp farming areas. The water quality was analyzed by integrating the impacts of extreme manifests of temperature and precipitation and shrimp cultivation. Addressing the intersection contributes to a better understanding of shrimp farming activities leading to water pollution and forms recommendations toward an integrated approach for sustainable shrimp aquaculture in the region. These could be applied in other areas which have similar conditions. Furthermore, the findings of this study would contribute useful insights for water treatment technology recommendations in the next phases.
This study sought to address the following questions: (1) What are the manifestations of extreme weather events which impact shrimp cultivation in the study area?; (2) What are the main causes of water pollution from shrimp cultivation in the coastal areas in the study area?; and (3) What parameters cause the current water pollution from shrimp farming in the study area?
2. Material and Methods
2.1. Study Area
Ninh Thuan province is located in the far south of central Vietnam, with coordinates of 11°18′14″ to 12°09′15″ north latitude and from 108°09′08″ to 109°14′25″ east longitude. It borders Khanh Hoa province to the north, Binh Thuan province to the south, Lam Dong province to the west, and the East Sea to the east. The province has a total area of 3358 km2, with 105 km of coastline. The geography is characterized by plains, mountains (with ranges surrounding the province), and coastal areas. The diversified terrain slopes eastward toward the coast.
Ninh Thuan province is one of the hottest and most drought-prone areas in the country. The Truong Son mountain range is situated such that it obstructs wind throughout the year. The province has the lowest average rainfall in the country from 1670 mm to 1827 mm per year, an air humidity from 71 to 75%, and great radiation energy of 9500–10,000 °C/year. Rainfall can reach 2200 mm/year in the upstream areas and is heaviest from September to December. The average temperature is about 27 °C and the highest temperature recorded is 40.5 °C. There are two seasons in the province: the dry season, from January to August, and the rainy season, from September to December.
The study area in this paper is within the An Hai and Phuoc Dinh communes from May to August 2017. An Hai is one of the coastal communes belonging to a coastal upwelling region rich in resources and diverse in seafood. Its salinity is high and stable, between 32 and 35 g·L−1. Shrimp cultivation density in the commune is very high, i.e., 201.7 ± 70.6 cell·m−2. The average area of each pond is 0.2029 ± 0.0963 hectares with 3 crops·year−1 on average. The cultivation period is approximately 90 days, and the average yield is 14.77 ± 4.43 tons·ha−1 [46].
According to local recommendations, shrimp farming in this area should take place from February to August. This is because the rainy season starts in September and flooding is likely to occur in October, having impacts on aquaculture, while the weather in January gets cold in spring. Therefore, we conducted this study from May to August, which is the main crop season for shrimp farming.
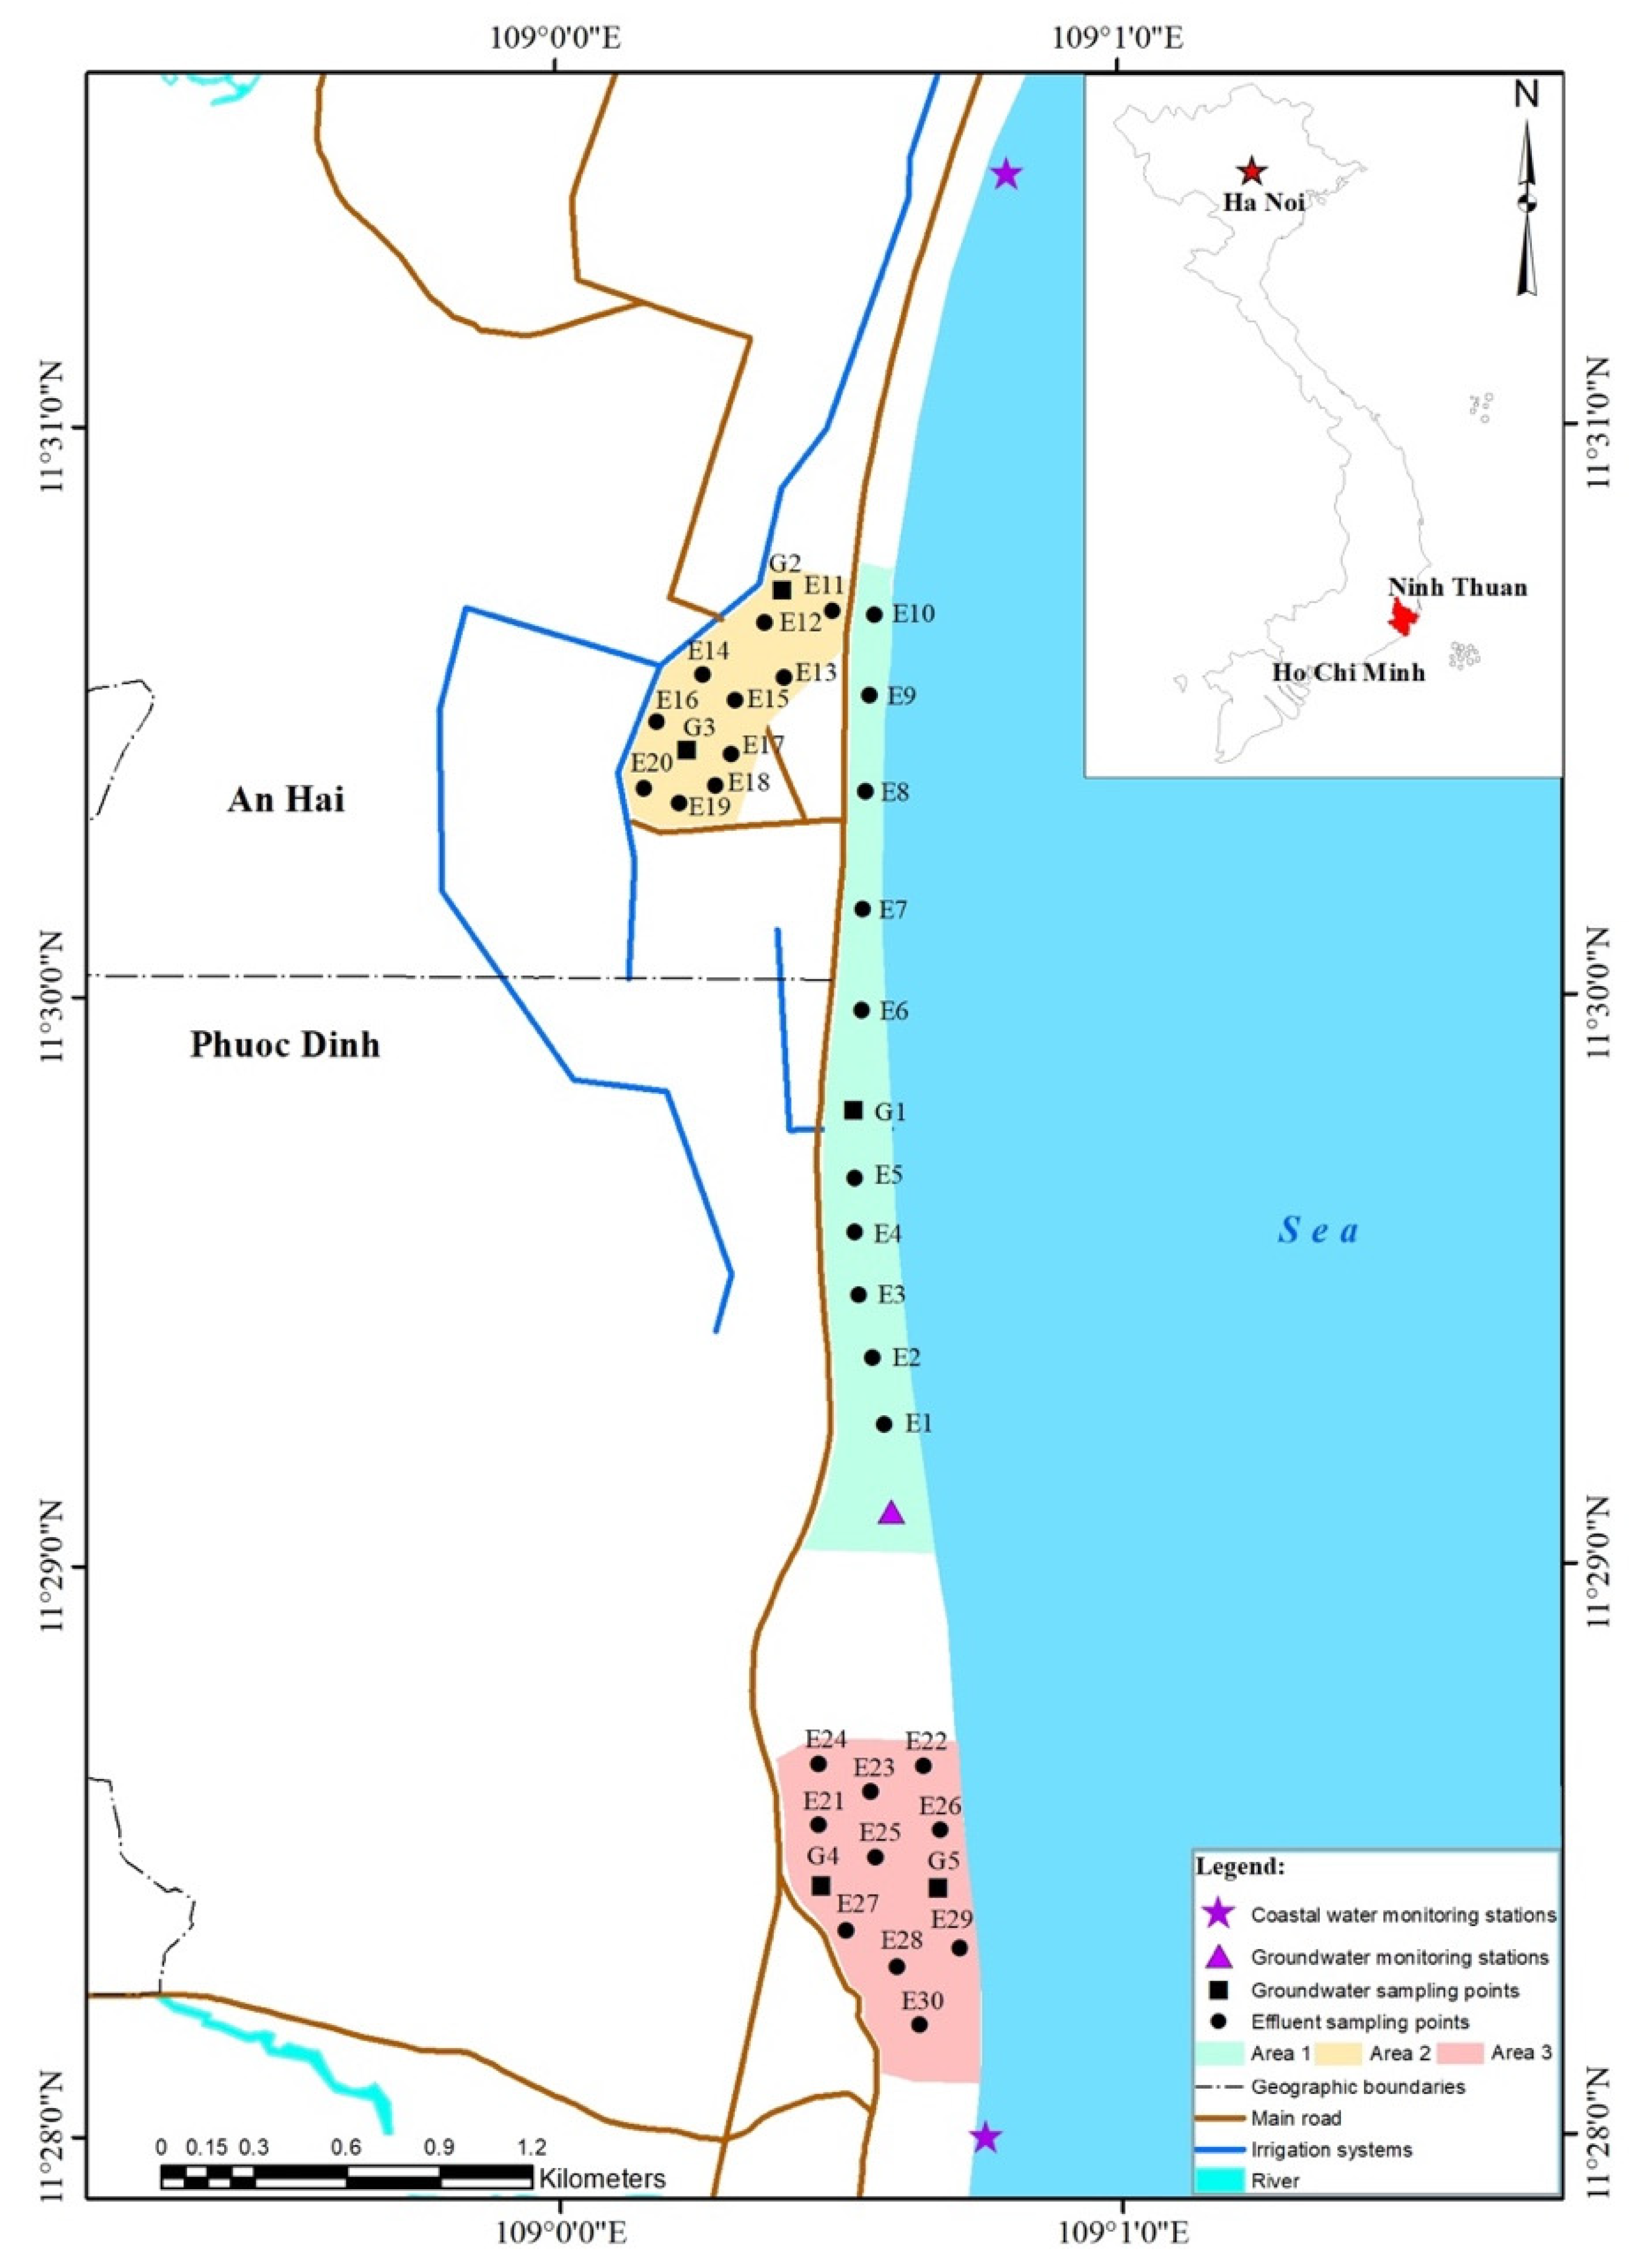
Most of the farming areas in the An Hai commune are cultivated by households, thereby the process of shrimp cultivation is mainly based on their personal experience. The sources of water used for shrimp cultivation are dependent on the location of the farm relative to the coast. We classified farms into three regions based on their location to the water supply sources, as described in Figure 1: (a) In the first classification, shrimp ponds are located close to the sea edge, less than around 10 km from the coast, and beside the coastal road. (b) The second area includes farms located more inland, farther from the coast (approximately 15 km away from the coast). (c) Finally, shrimp farms in the third area are located within residential areas. The Phuoc Dinh commune, meanwhile, is dominated by ancient coral reefs covered by green moss in the vicinity of the third area.
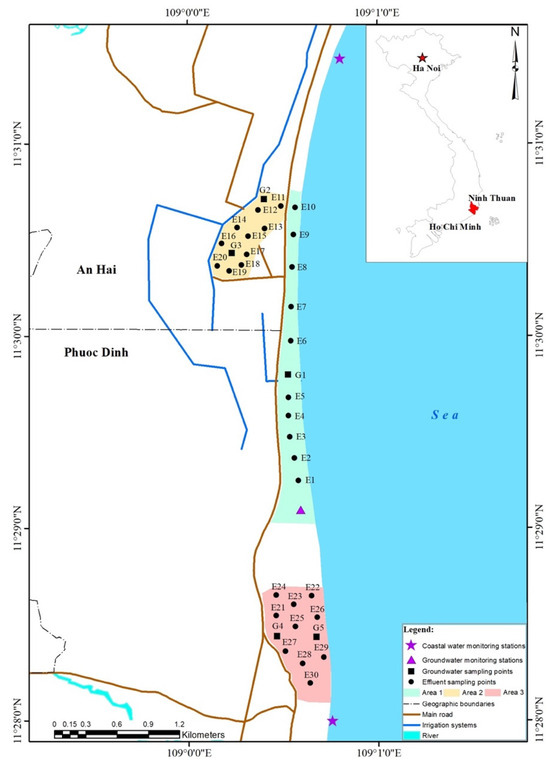
Figure 1.
Location of sampling points in the study area.
2.2. Methods
We adopted two approaches, i.e., qualitative and quantitative analyses, for identifying the comprehensive impacts of extreme events of rainfall and wide temperature variability as well as coastal shrimp cultivation upon water quality. The qualitative approach aimed to understand the water–wastewater cycle of shrimp farms, the causes and changes in water quality in the ponds, and environmental and social impacts of shrimp farm effluents. Meanwhile, the quantitative approach included a sample analysis of sourced well water and shrimp pond effluents to measure contaminant concentrations [47].
2.2.1. Qualitative Analysis
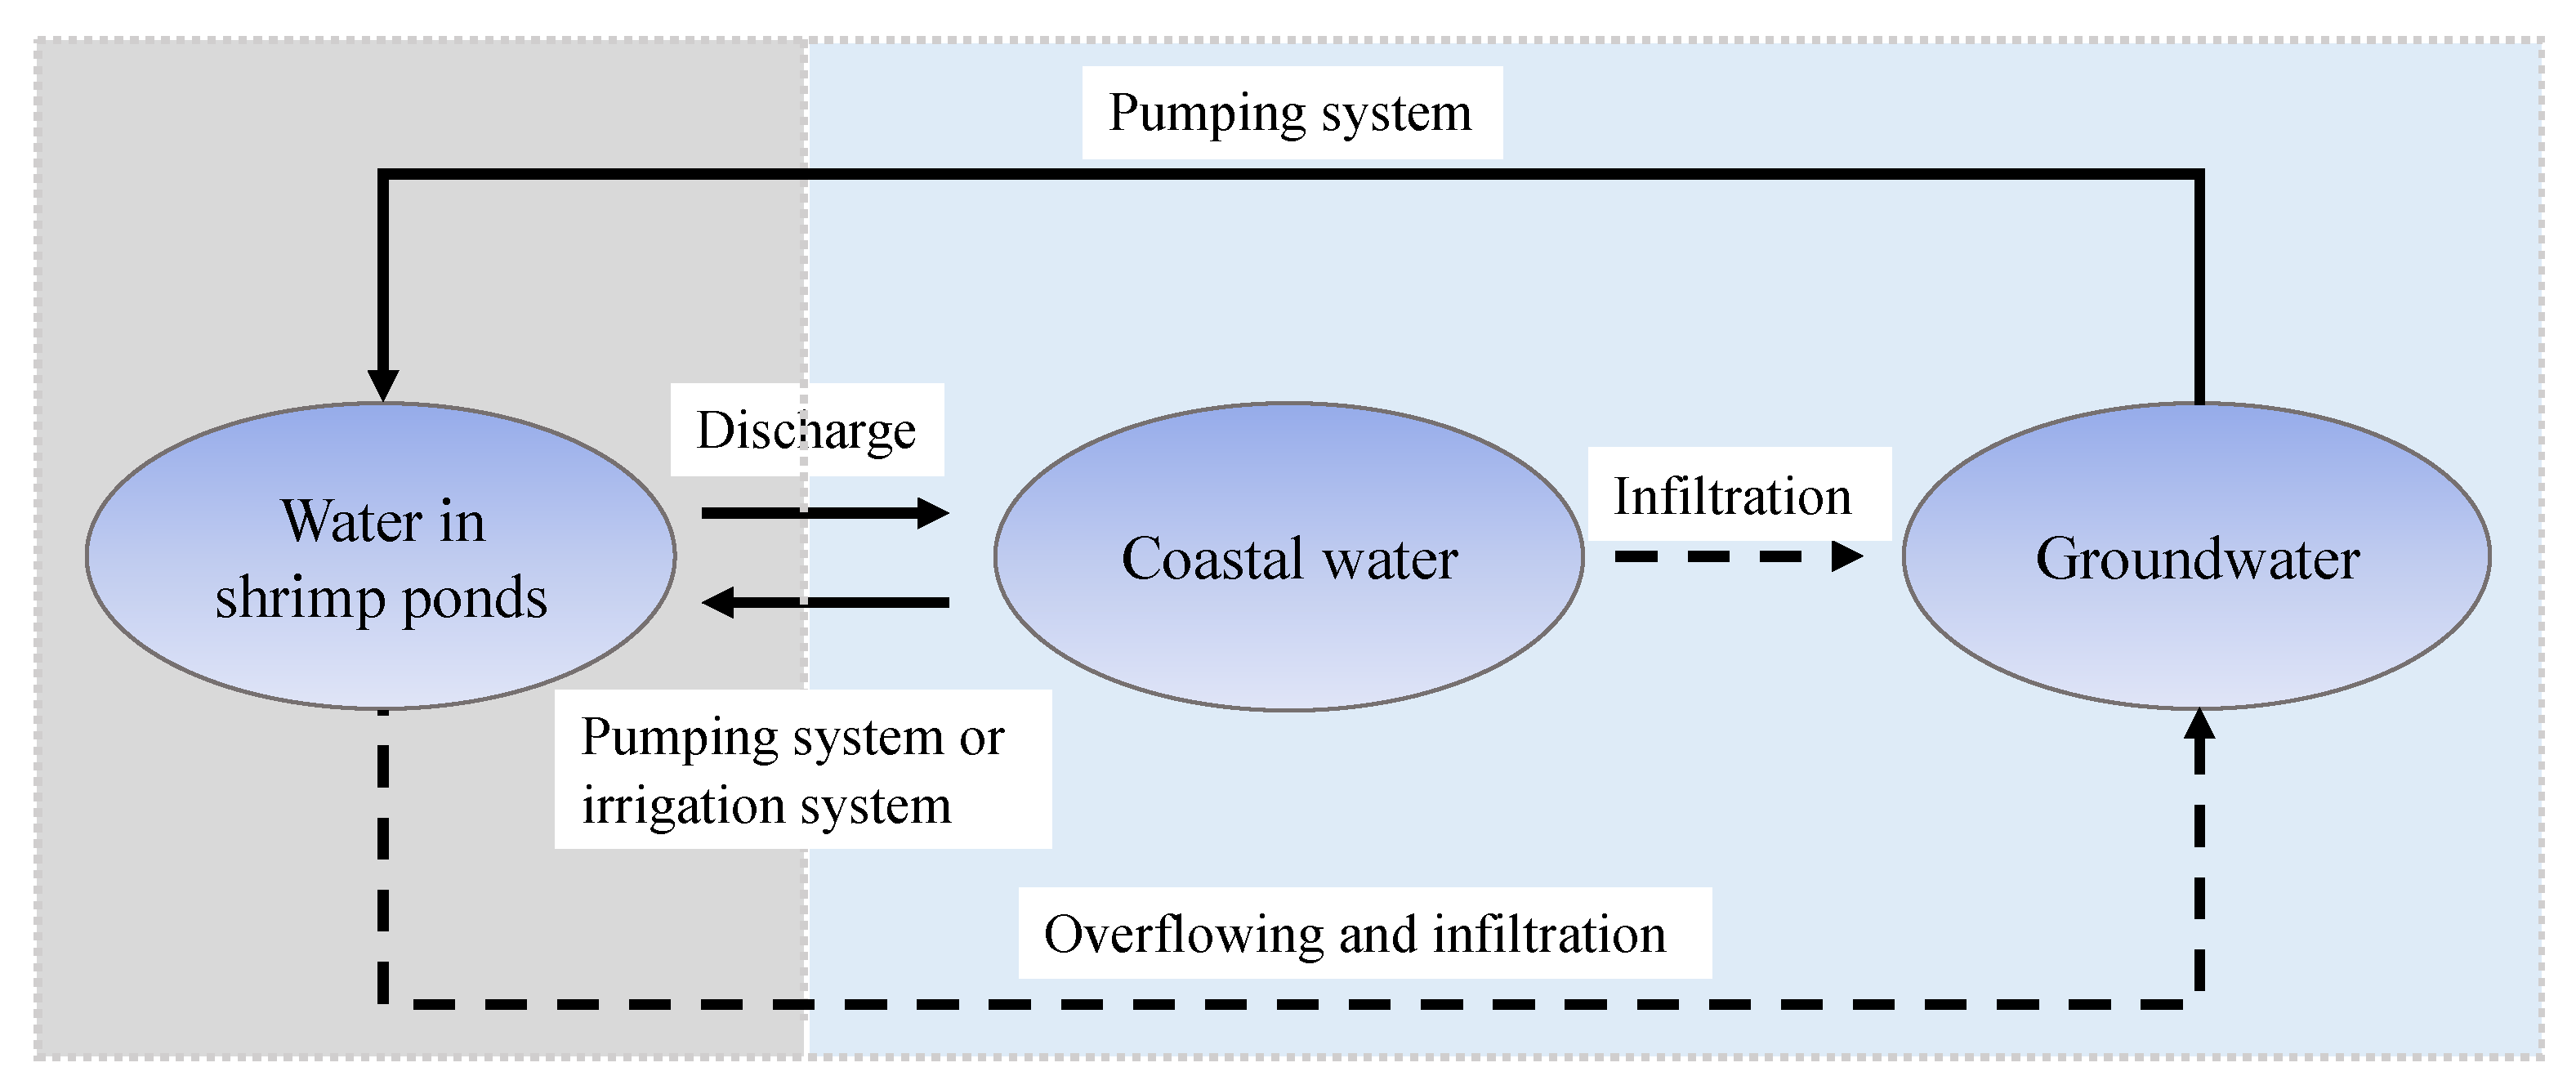
An understanding of the water cycle for shrimp cultivation was critical for qualitative analysis. The water cycle includes flows of water that enter and exit from shrimp ponds. Sources of water are either from groundwater via a direct pumping system or a mixture of coastal seawater and extracted groundwater which is fed into the system via pumping or irrigation (see Figure 2). The direct cycle includes supply water from groundwater, coastal surface water, and irrigation water entering the shrimp pond, and output water is discharged directly into waterways. The indirect cycle relates to the overflow and infiltration processes. This study will concentrate on direct flows.
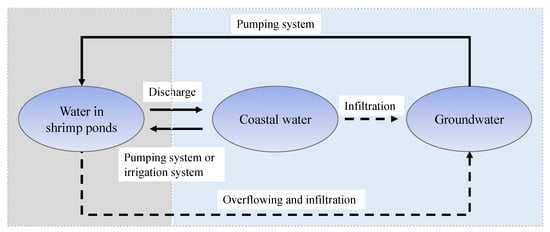
Figure 2.
The water cycle for shrimp cultivation: exchange water in three water sources, including shrimp cultivating water, sea coastal water, and groundwater. Water in shrimp ponds is taken directly either from the coastal area or from groundwater (displayed as a solid line). Indirectly, these three sources are exchanged more slowly via an indirect link (displayed as a dashed line).
In addition, we also gathered relevant local information and statistical data. These were relevant to weather conditions and climate change manifestations through the annual average temperature and precipitation from 1993 to 2019; the quality of groundwater and coastal water from its local monitoring programs; and national technical regulations which regulate limits of certain contaminant parameters. A literature review of the manifestation of extreme weather events and optimal values and ranges of shrimp pond’s water quality parameters were also conducted to support this study.
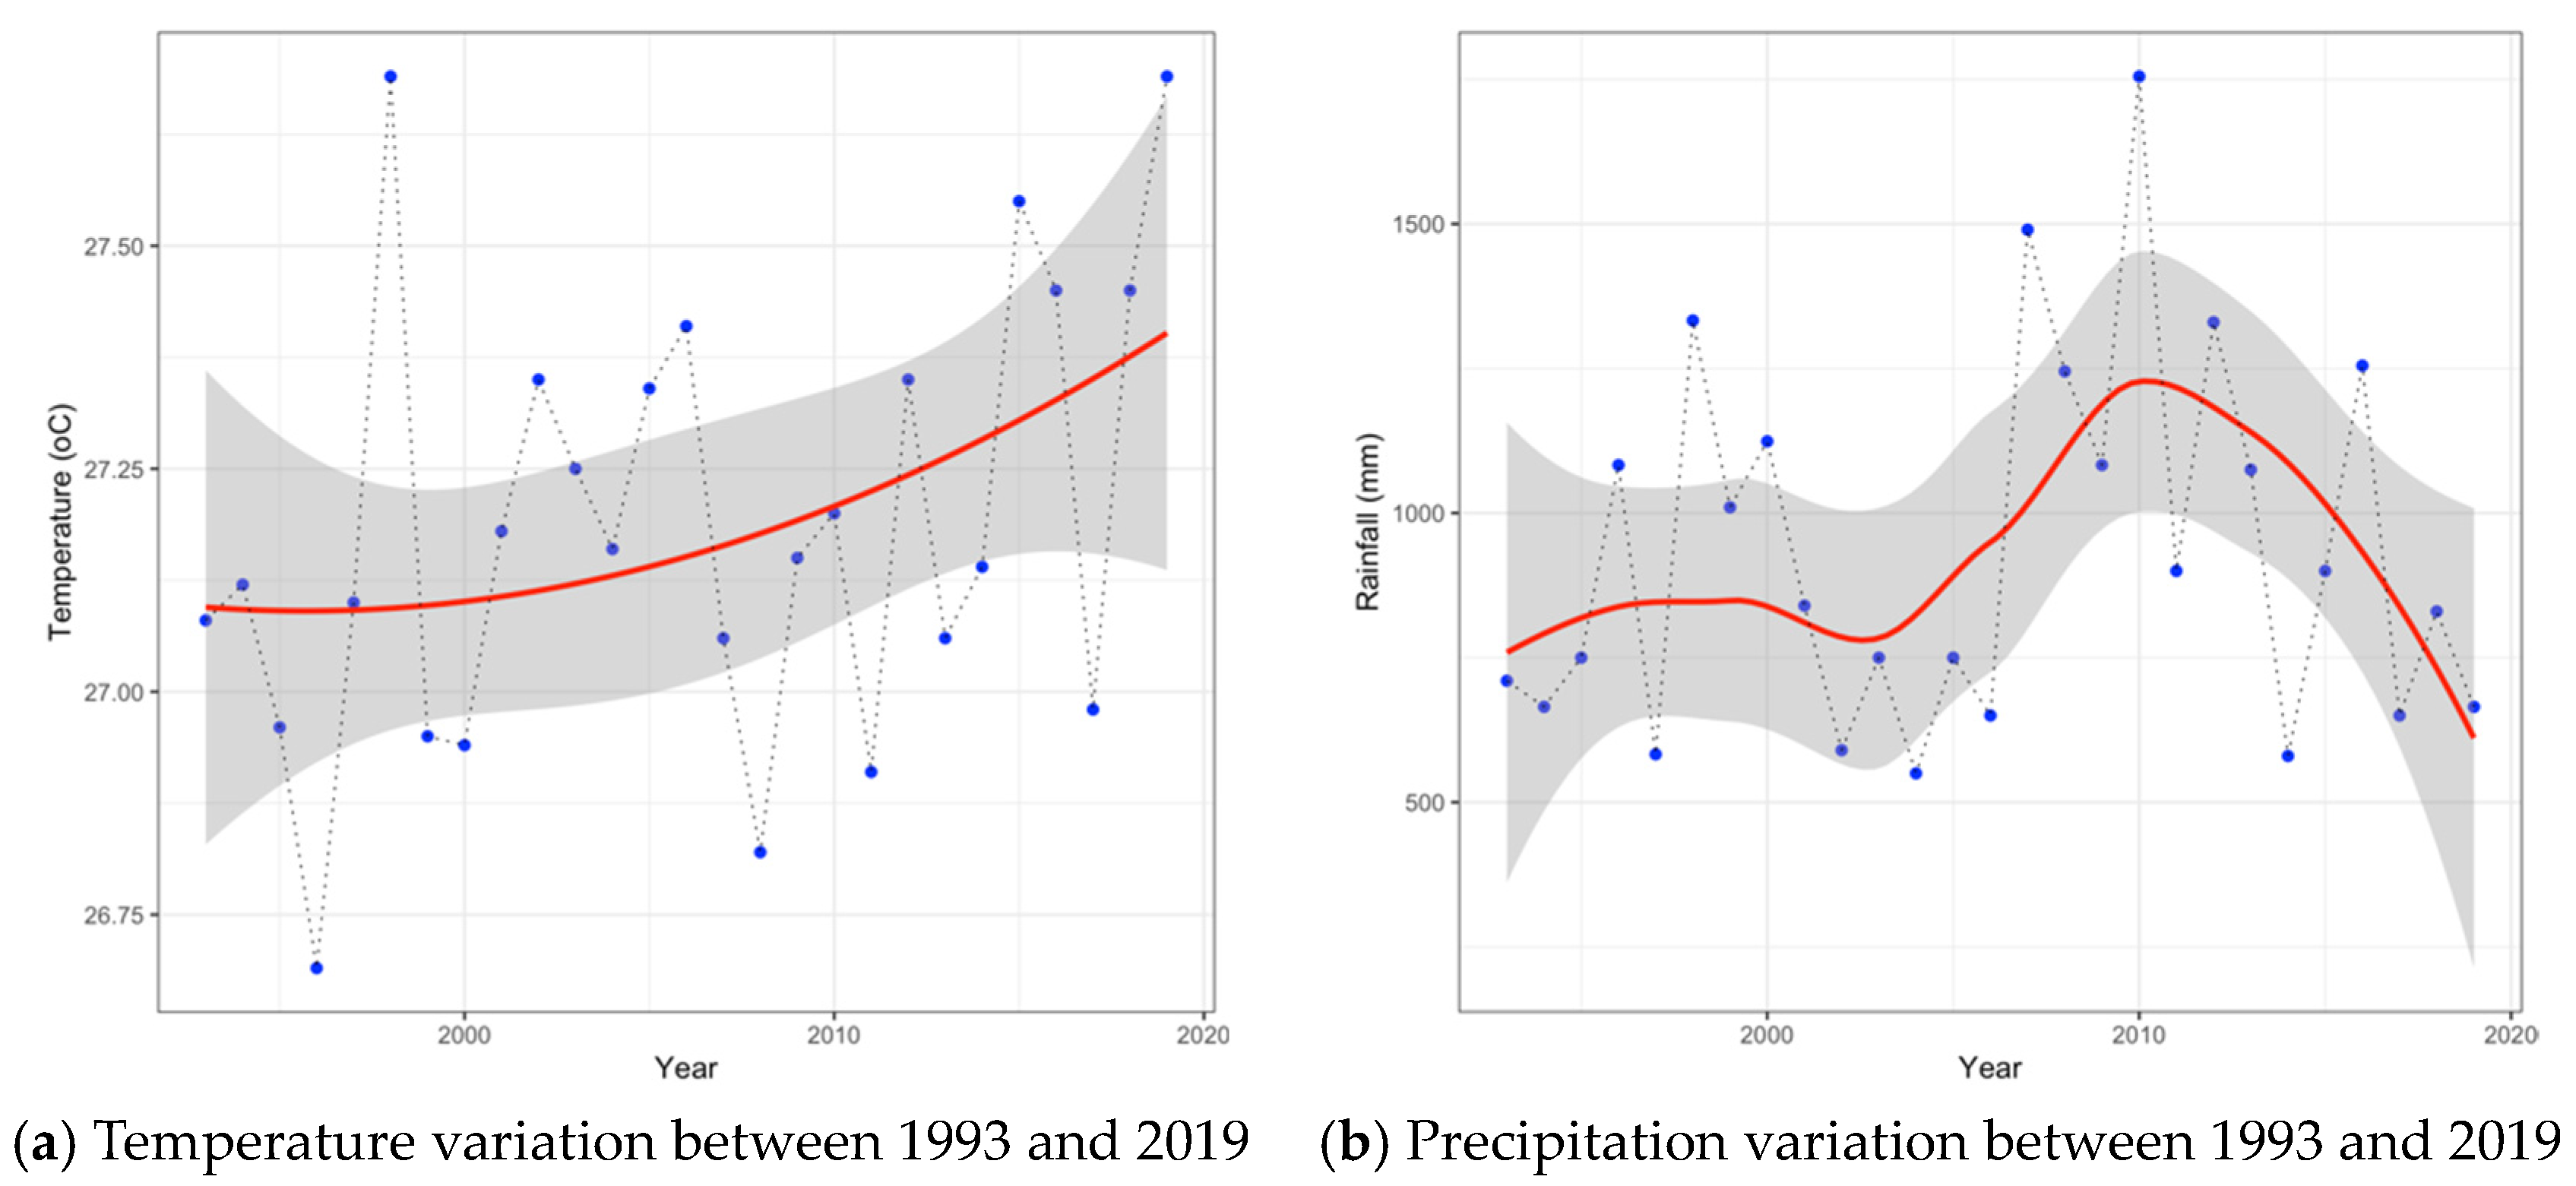
Ninh Thuan is a vulnerable region to climate change [48,49]. Manifestations of extreme weather through temperature and precipitation patterns are presented in Figure 3. In general, the average temperature between 1993 and 2019 tended to increase at a rate of 0.012 °C/year. The highest temperature value was 27.7 °C in 2019, while the lowest one was 26.7 °C in 1997. As for precipitation, it fluctuated during the period from 1993 to 2019. There was an upward trend in precipitation until 2010, then a sharp decline trend during about the last decade (2011–2019). The highest precipitation reached 1781.0 mm in 2010, while the lowest value of precipitation was 509.0 mm.
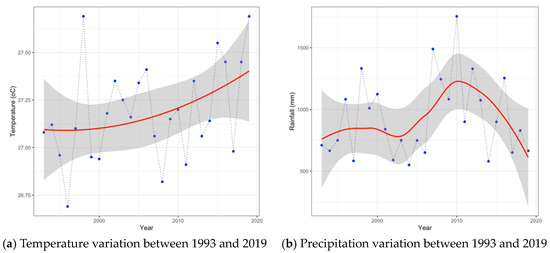
Figure 3.
Climate change manifestations through changes in (a) temperature and (b) precipitation from 1993 to 2019 in Ninh Thuan. Source: Ninh Thuan’s hydrometeorology station.
Furthermore, various participatory rural appraisal techniques with rural farmers were conducted to obtain insights into the operations of shrimp farms that utilize direct water cycles, the causes and changes in water quality in their ponds, and the environmental and social impacts of shrimp farm effluent. Those techniques included semi-structured questionnaire surveys, in-person meetings, focus-group discussions, and field observation trips. Interviews and focus-group discussions were conducted with the participation of commune leaders; authorities of provincial, district, and commune officials, officials from the Departments of Natural Resource and Environment, the Department of Agriculture and Rural Development, the Department of Water Resources the Department of Science and Technology, and the Department of Irrigation. The Level-1 Breeding Center, Branches of Fisheries and the Department of Meteorology and Hydrology were also consulted. Five workshops in total with the support of trained volunteers were successfully conducted to acquire field data. Individual interviews were conducted with officials of various departments and of different levels: provincial (representatives of the Provincial People’s Committee, the Department of Agriculture and Rural Development, the Department of Natural Resources and Environment, the Department of Science and Technology, and the Centre of Meteorology and Hydrology); district (representatives of the District People’s Committees and the Department of Economics and Agriculture); commune (representatives of the Commune People’s Committee, the Youth Union and Women’s Union, the Irrigation station Office, the 7G shrimp associated group, the Fisheries Office, and the Veterinary Branch); and finally, village level (representatives including Managing Board members of the village and households).
2.2.2. Quantitative Analysis
Samples of groundwater from wells near shrimp farms that supplied, either in part or entirely, water for shrimp ponds were first collected to assess its background concentrations. We collected the groundwater samples at five wells at a frequency of once every two weeks over a total span of 12 weeks. Water effluent samples discharging from these shrimp ponds were then obtained within a tight schedule: sampling was carried out from May to August 2017 within a fixed time between 09:00 and 10:00 after spinning paddle wheels were operated and the shrimp were fed. The samples were taken twice a week at a draining ditch into which the pond discharged effluent using two-liter plastic bottles and these were sent to an accredited laboratory within one hour after the sampling for analysis.
For groundwater quality, pH, DO, turbidity, salinity, and total dissolved solids (TDSs) were measured using an EXO2 Multiparameter Probe equipment (YSI, Yellow Springs, OH, USA). The total iron was determined by the colorimetric method (APHA, 2012) [50] on a UV-VIS instrument (Spectrophotometer, model 6305, Jenway, Essex, UK). The alkalinity parameter was measured using the titration method following APHA (1992) [51]. Meanwhile, the parameters of pH, salinity, and TDSs of effluent were measured by multiple meters HandyLab 680 (SI Analytics, Mainz, Germany). The alkalinity was tested by the titration method with a sulfuric acid solution (according to ISO 9963/1:1994 [52]). The total suspended solids (TSSs) were determined by the weight method using GF/C glass fiber filtration (TCVN 6625:2000 [53]).
Some parameters of both groundwater and wastewater have similar measurement methods, including total nitrogen (TN), nitrite nitrogen (NO2-N), nitrate nitrogen (NO3-N), dissolved orthophosphate (PO4-P), chemical oxygen demand (COD), and biochemical oxygen demand (BOD5). The total nitrogen was measured by the Kjeldahl method using Devarda’s alloy for destruction (ISO 5664:1984 [54]). NO2-N’s results were obtained by employing spectrophotometric determination with an Aminobenzenesulfonamide reagent (ISO 6777:1984 [55]), while NO3-N was determined by the spectrophotometric method with a sulfosalicylic acid reagent (ISO 7890/3:1988 [56]). PO4-P was measured using spectrophotometric determination with an ascorbic acid reagent (ISO 6878:2004 [57]). COD tests were determined using potassium dichromate (ISO 6060:1989 [58]). BOD5 measurement was determined based on dissolved oxygen concentration differences before and after incubation at 20 °C for five days (ISO 5815/1:2003 [59]). Finally, the hardness of water was tested using the EDTA titrimetric method (ISO 6059-1984 [60]), and the number of Coliform bacteria in 100 mL of water was measured according to ISO 9308-1:1990 [61].
2.2.3. Statistical Data Analysis
All sample analysis procedures were replicated three times, and then the values of the mean and standard deviation were calculated. ANOVA was used to determine difference levels among variables. The level of significance was 0.05. The data were analyzed and visualized using the R programming language version 4.3.1 and RStudio program 2023.12.1 Build 402.
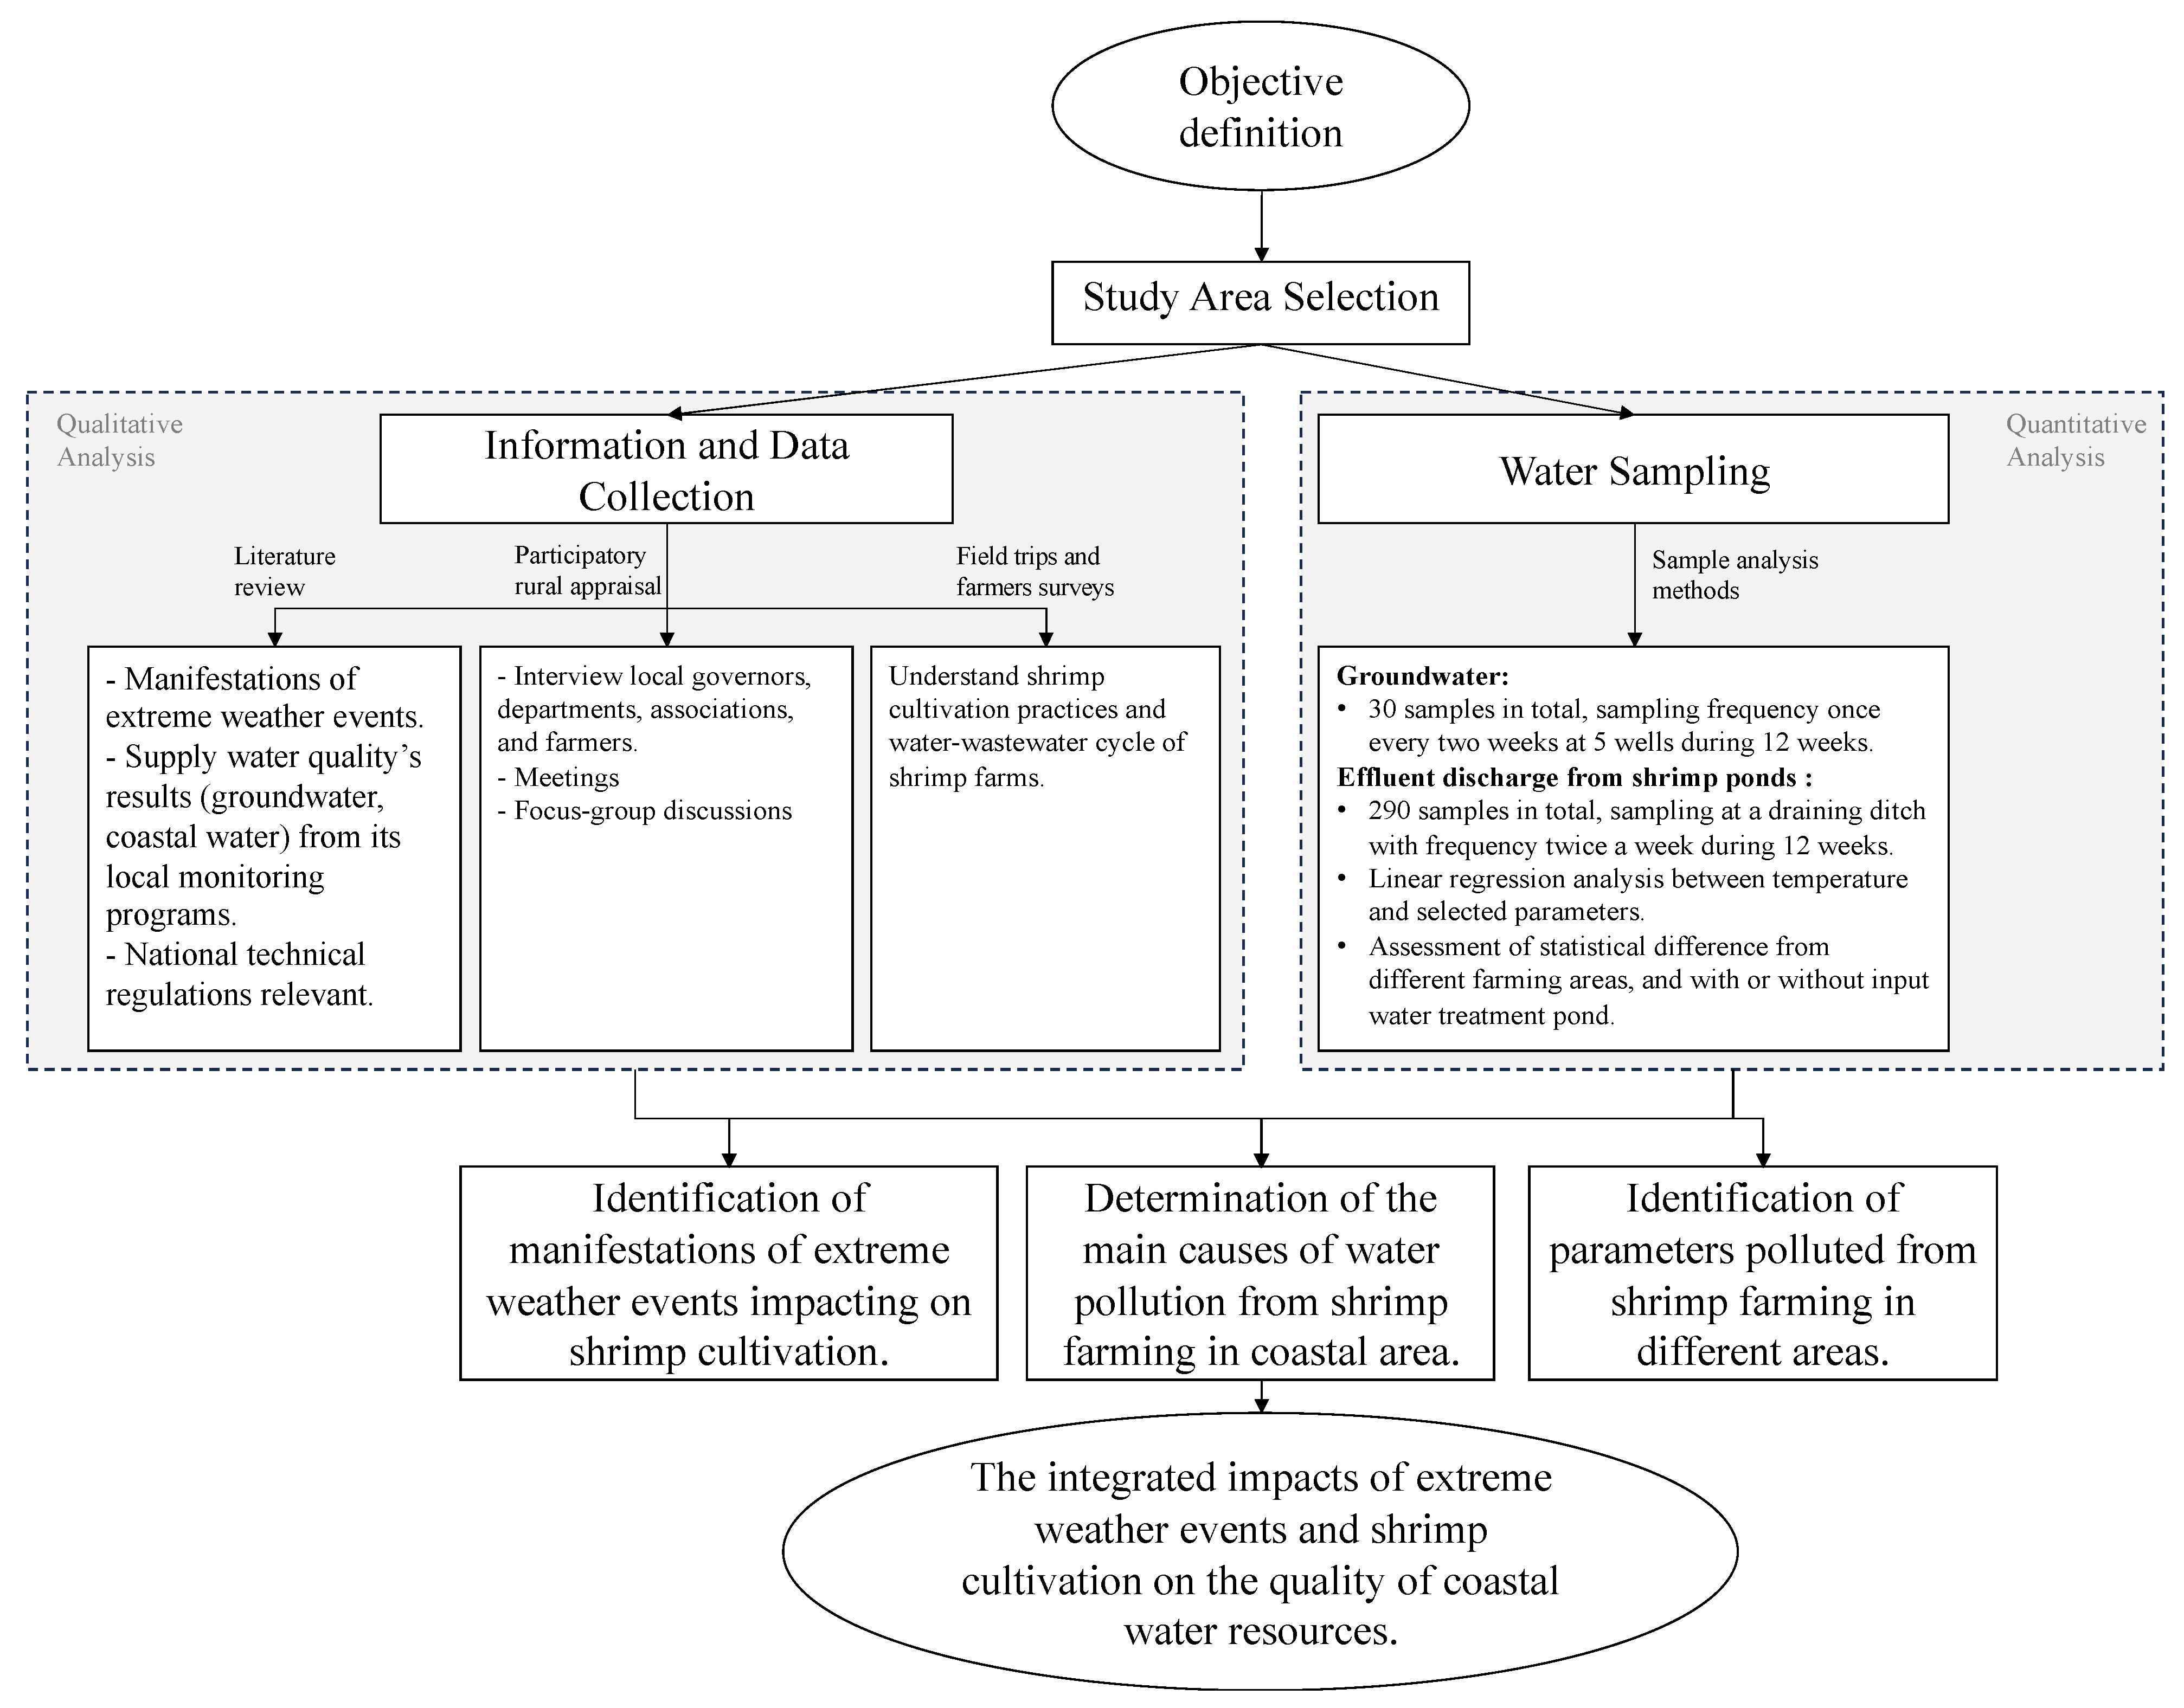
An overview of all processes in the present study is displayed in Figure 4.
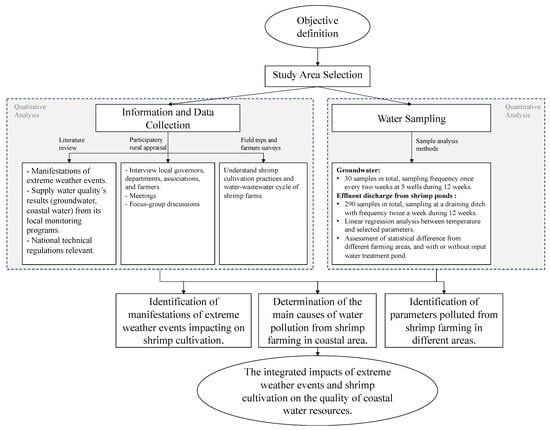
Figure 4.
Overview of research procedures.
3. Results
According to the qualitative and quantitative analysis above, some results are found and discussed as follows.
3.1. Local Weather Conditions
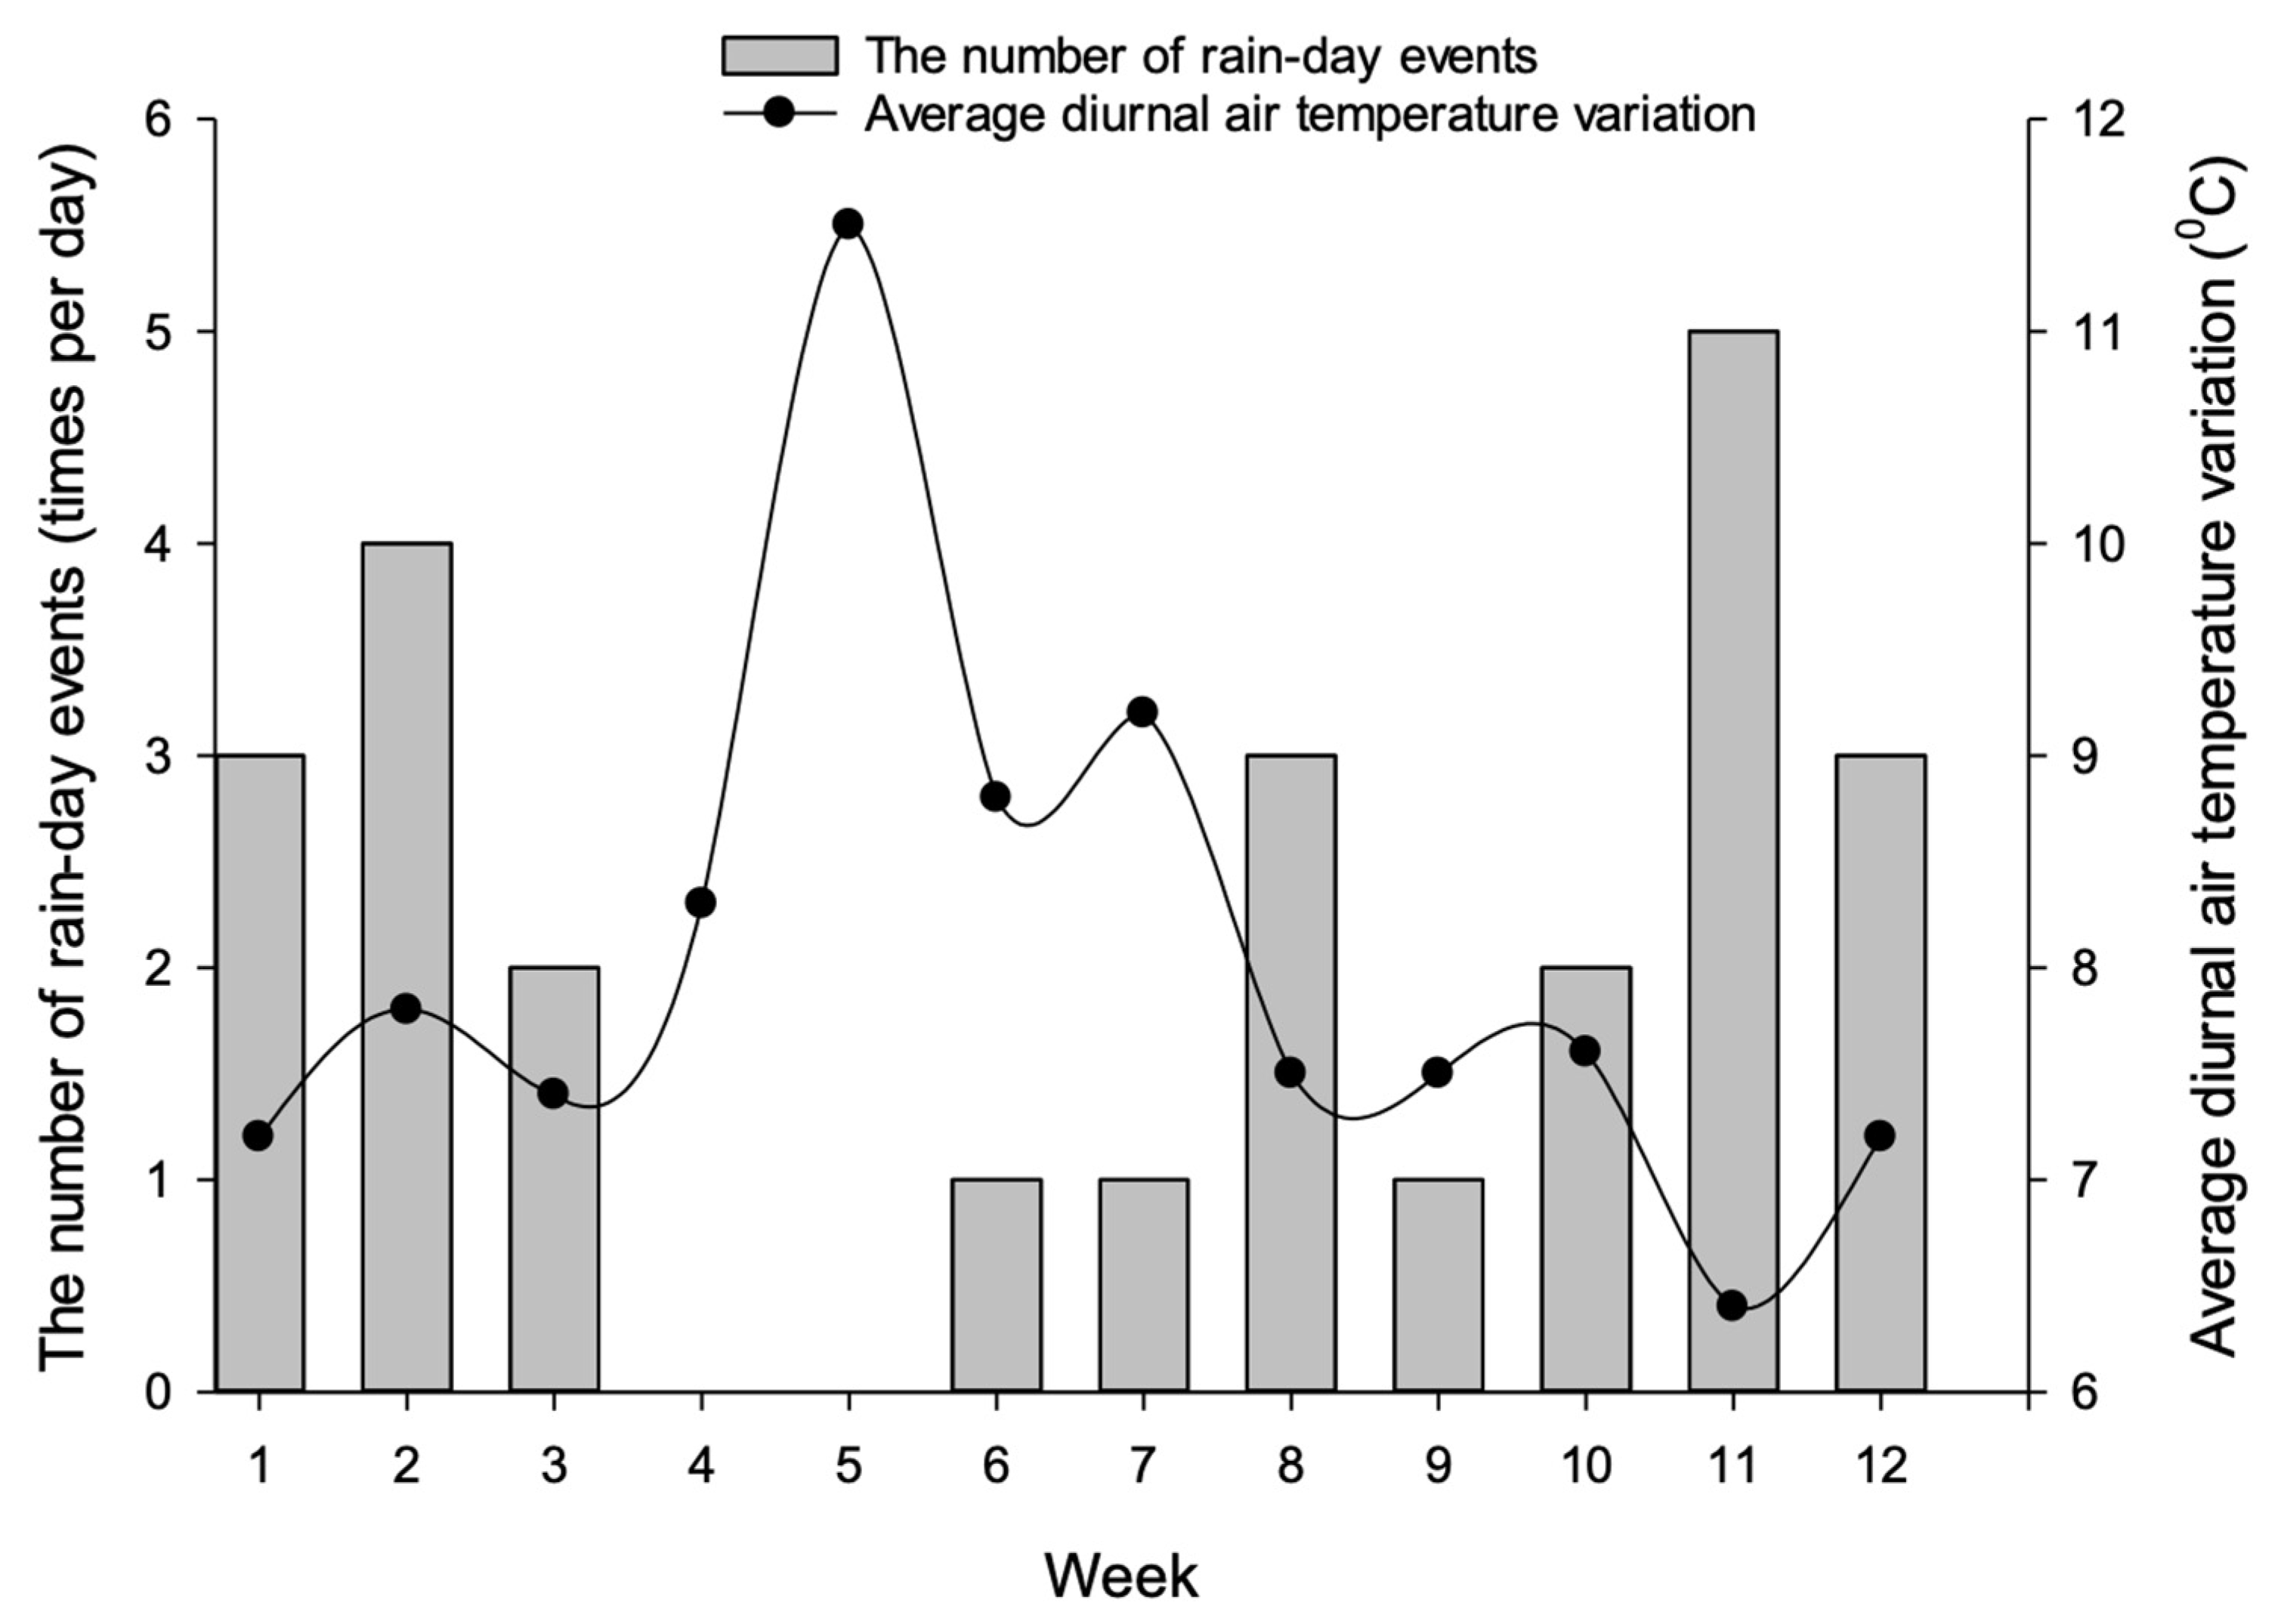
Precipitation and temperature data for twelve (12) consecutive weeks was collected from Ninh Thuan’s hydrometeorology station between 15 May and 7 August 2017, as described in Figure 5. The overall general trend was that the average diurnal air temperature variations were greater during periods of a lower frequency of rainy days. Specifically, in the first 3 weeks, it rained 2–4 times a day with the rainfall amount ranging from 1.6 to 76 mm. The average temperature was about 33.0 degrees Celsius, and the daytime temperature difference during the day was about 7.5 degrees Celsius. Over the next two weeks, the weather changed dramatically with intense sunshine and no rain. The temperature increased to 34.5 degrees Celsius and the difference in diurnal temperature also rose to 12 degrees Celsius. The rapid and drastic change in ambient temperature could be a critical reason for an increase in shrimp infection rate and mortality rate. The relationship between the occurrence of rainy days and the diurnal temperature difference was similar in the remaining 7 weeks.
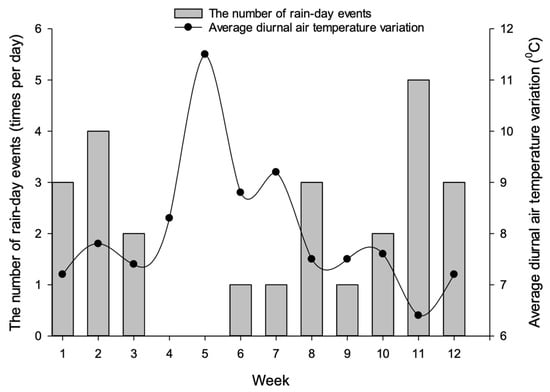
Figure 5.
Changes in rainfall and temperature for 12 consecutive weeks from 15 May to 7 August 2017 in Ninh Thuan. Source: Ninh Thuan’s hydrometeorology station.
3.2. Shrimp Farm Cultivation
As mentioned in Section 2.2.1, this study was keen on the direct flows from coastal seawater and groundwater via a pumping system and/or irrigation system. We found that some farmers’ practices during farm cultivation have the potential to seriously affect water quality inside and outside the ponds. For example, the farmers frequently did not comply with the local effluent discharge regulations which require farmers to treat wastewater from the shrimp ponds using a solid sedimentation process before discharging it to the local centralized treatment zone.
On the other hand, the supply water and its quality were unstable for shrimp cultivation. This is because the farmers equiped their own pumping system and also sought alternative sources of direct water supply that may yield cleaner water. The size and capacity of the pumping station were dependent on household economics and experience while pumping points and timing were dependent on farm location and the extent of tides. Some farmers with better economic status directly drilled wells within the farm area. These wells had a useful lifespan between 1–4 years. However, it is an ongoing challenge to locate clean sources of groundwater supply. Even though groundwater from wells below the coastal sand is of acceptable quality and quantity, whether or not this source can be accessed is dependent on the financial resources of the farmers.
Another key issue is the quality of supply water that comprises a mixture of groundwater, coastal water, and/or an irrigation system source. The flow rate and mixed salinity concentration depend entirely on farmers’ experience. Furthermore, the potential to spread disease between farms is high and the existing supply of water is suitable only for certain aquatic species (including fish, crabs, and oysters) with lower requirements in terms of water quality. For shrimp ponds, the farmers ideally should have a separate water treatment before supplying water for these ponds. In addition, as mentioned previously in Section 2.1, there are three regions classified according to their sources of water supply. Thereby, farmers’ shrimp cultivation practices in these areas vary. In the first area, farmers combine mostly seawater with fresh water in the early stage of rearing water preparation for shrimp ponds, and then exclusively use seawater for water exchange during the remainder of the cultivation period. In the meanwhile, using water obtained directly from the coastal seawater has been limited in the second area. Freshwater is extracted directly from wells or purchased from tap water offside. There are also difficulties in connecting irrigation water sources offered by the government. The vast majority of farms in the second area use groundwater from wells for shrimp cultivation. Lastly, in the third area, farmers use water directly from the irrigation system and also use groundwater, but in limited quantities since in the water from underground wells is mainly for domestic use.
3.3. Monitoring Supply Water Quality
3.3.1. Monitoring Groundwater Quality
Table 1 presents some key groundwater quality parameters for the coastal area of the An Hai commune recommended by Ninh Thuan’s Department of Fisheries and its monitoring results during the study period. We compared the monitoring results with ‘Control limit 1’, ‘Control limit 2’, and ‘Warning limit’. The control limits refer to the National Technical Regulations of Vietnam; for instance, herein, Control limit 1 corresponds to QCVN 09:2023/BTNMT [62] on groundwater quality. Control limit 2 was suggested as a reference in the present study due to a limitation of water quality sampling taken from shrimp ponds (both settlement ponds and shrimp cultivation ponds). Warning limits are recommendations or findings of relevant prior studies obtained during our literature review of the qualitative analysis processes aforementioned.

Table 1.
Key groundwater quality parameters for the coastal area in An Hai area.
As a result, the levels of pH, alkalinity, salinity, and concentrations of NH4-N, NO2-N, and PO4-P were within an acceptable range as stipulated within the technical regulations of QCVN 09:2023/BTNMT (hereinafter referred to as QCVN 09) and QCVN 02-19: 2014/BNNPTNT (hereinafter referred to as QCVN 02-19). However, Ostrensky, Marchiori and Poersch [26] reported that the NO2-N concentration in shrimp cultivating water should be lower than 0.09 mg·L−1 to ensure it is healthy. Hence, this suggests that the nitrite concentration in groundwater wells requires treatment before use in a shrimp pond. Moreover, Boyd and Green [27] suggested that PO4-P concentration should be range between 0.001 to 0.100 mg·L1 to avoid plankton blooms. This suggests that the average PO4-P concentration (0.44 ± 0.30 mg·L−1) of groundwater is four (4) times as high as the warning limit. Figure 6 details a description of the two concentrations.

Figure 6.
Monitoring concentrations of NO2−N and PO4−P of groundwater from five wells in An Hai. Water samples were taken in July 2017 by the Department of Fisheries. ▼ Upper warning limit.
3.3.2. Coastal Water Quality
Table 2 describes critical coastal water quality parameters as recommended by the local Department of Natural Resources and Environment. We adopted two control limits: “Control limit 1” from the regulation on marine water quality in coastal waters (QCVN 10:2023/BTNMT [65]) and “Control limit 2” from the regulation on brackish water shrimp culture farming (QCVN 02-19). The meaning of ‘Warning limit” is the same as the case of monitoring groundwater quality sections.

Table 2.
Key coastal water quality parameters in the An Hai area.
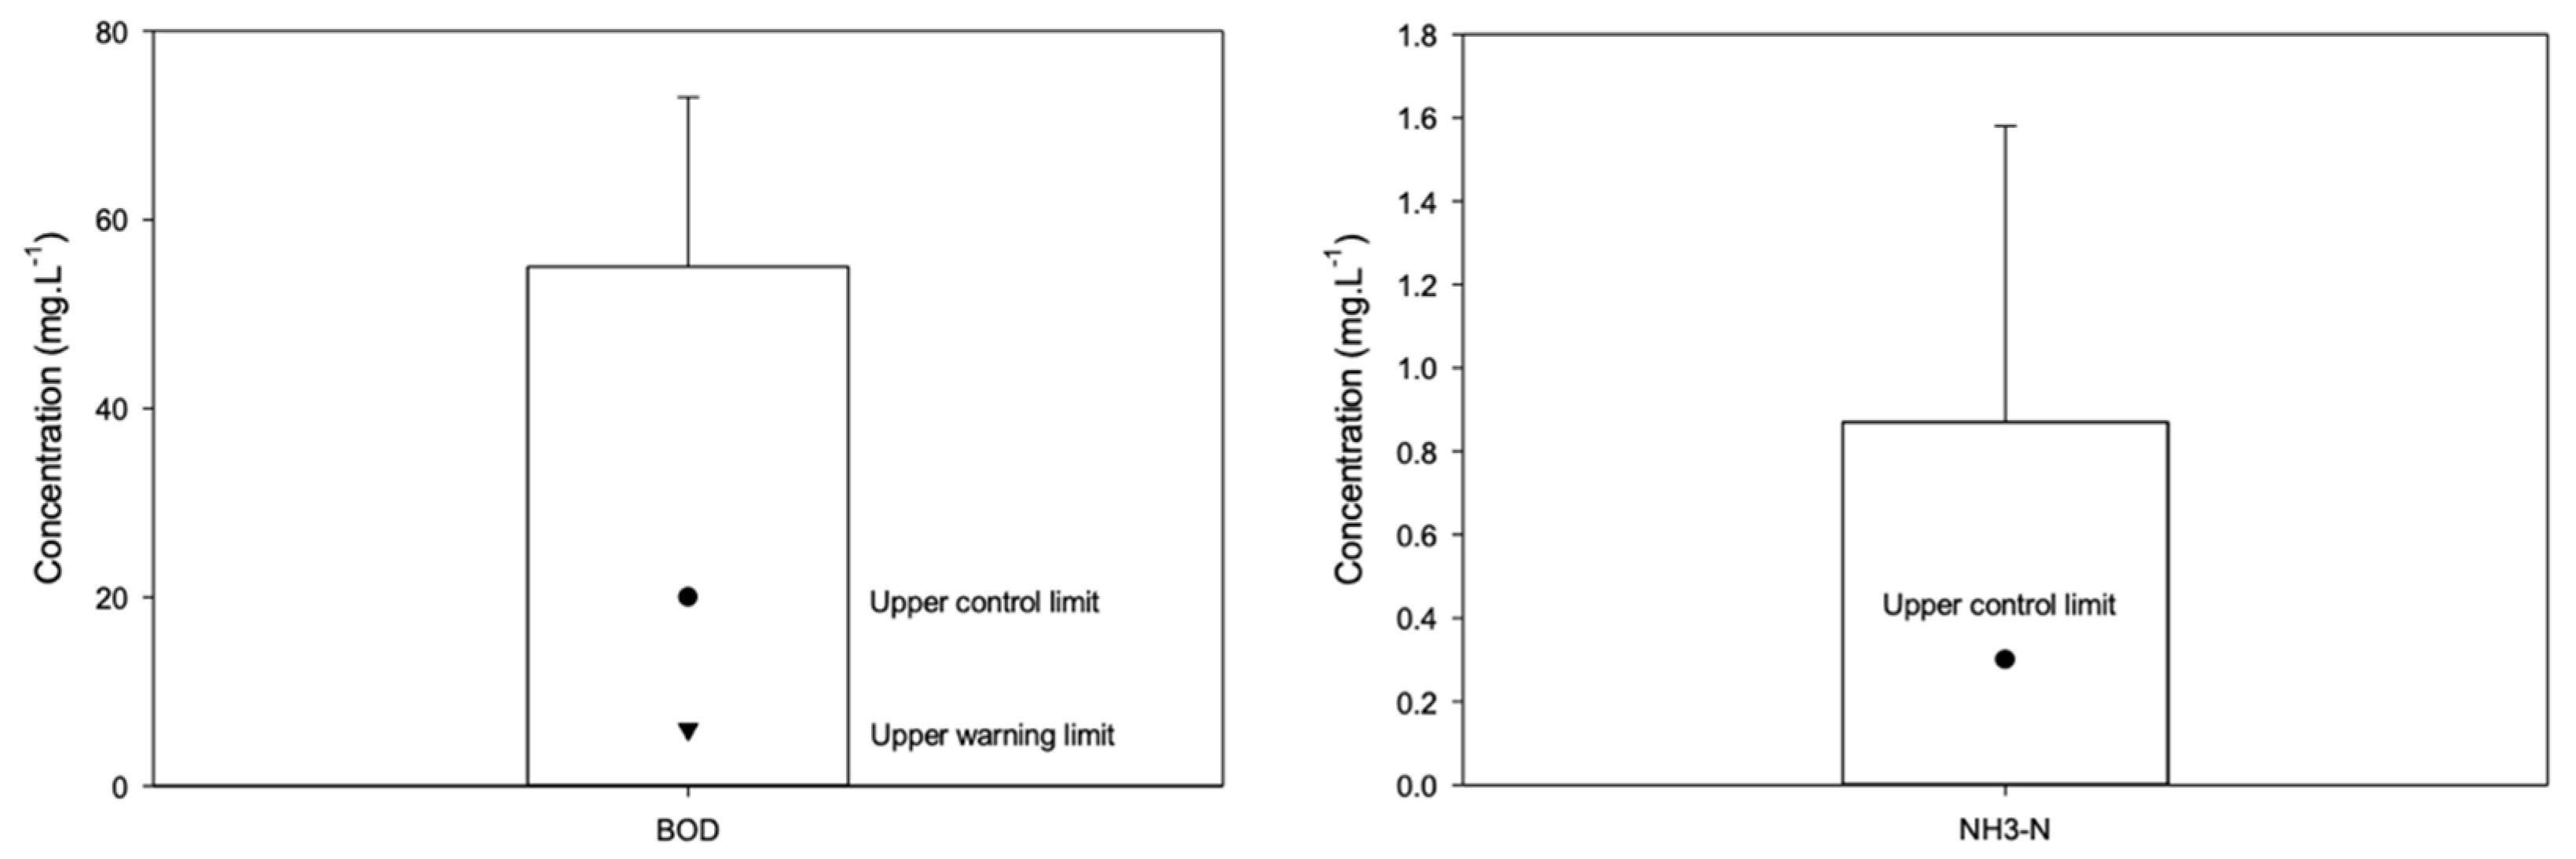
The results of most key parameters, including pH, TSS, NO2-N, NO3-N, and PO4-P, did not exceed both control limits as stipulated by QCVN 10:2023/BTNMT (hereinafter referred to as QCVN 10) and QCVN 02-19, and the results did not exceed the warning limits of the same parameters. However, the coastal water quality has issues with organic matter and nutrients (i.e., BOD5 and NH4-N parameters) when using this water to supply directly to shrimp ponds. Specifically, BOD5 and NH4-N had average concentrations of 55 mg·L−1 and 0.9 mg·L−1 which exceeded the upper control limit of 2.8 times and 3 times, respectively (see Table 2 and Figure 7).
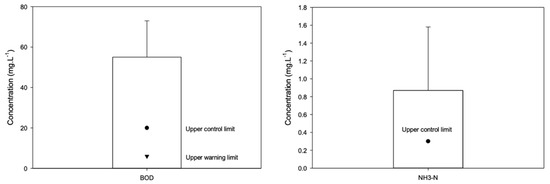
Figure 7.
Monitoring concentrations of BOD and NH4-N of coastal water at five inlet points in Ninh Thuan. Source: the Department of Natural Resources and Environment. ▼ Upper control limit, ● upper warning limit.
Next, we analyzed the current state of water pollution within the study areas through measurements of groundwater quality and water effluent from shrimp cultivation ponds. As mentioned previously, the sampling of water in treatment ponds and shrimp ponds was not allowed due to concerns about the potential spread of disease by farmers. Furthermore, water in shrimp ponds is either taken directly from seawater or a mixture of seawater and extracted groundwater (see Figure 2), therefore, we utilized three control limit values from the regulations, consisting of QCVN 09:2023, QCVN 02-19, and QCVN 10, to assess the quality of the groundwater samples. As for the water effluent from shrimp ponds, we employed linear regression analysis to evaluate the impact of local ambient temperature on some selected parameters. Also, comparisons of the wastewater quality parameters were conducted between shrimp farm regions and between the farms that either utilized or did not use treatment ponds.
3.4. Groundwater Quality Sampled
Analytical results of sampled groundwater against permissible concentrations of selected parameters are presented in Table 3. We first compared Control limit 1’s measured values against groundwater quality parameters. A serious pollution phenomenon of total Coliform was found in the groundwater samples. The total Coliform mean concentrations were 3333.3 times as large as the Control limit 1. In addition, although salinity was not regulated in Control limit 1 for groundwater quality, the average concentration of salinity results was slightly lower compared to the regulation for brackish water for shrimp cultivation under Control limit 2 (27.74 ± 7.23 g·L−1 vs. 5 ÷ 35 g·L−1). The DO concentration obtained was slightly lower than that in Control limits 2 and 3 but still meets the requirement of the Warning limit, i.e., it was greater than 2.0 mg O2·L−1.

Table 3.
Inlet groundwater quality measurement.
3.5. Analytical Results of Water Effluent Samples from Shrimp Ponds
3.5.1. Effects of Ambient Temperature on Shrimp Farming
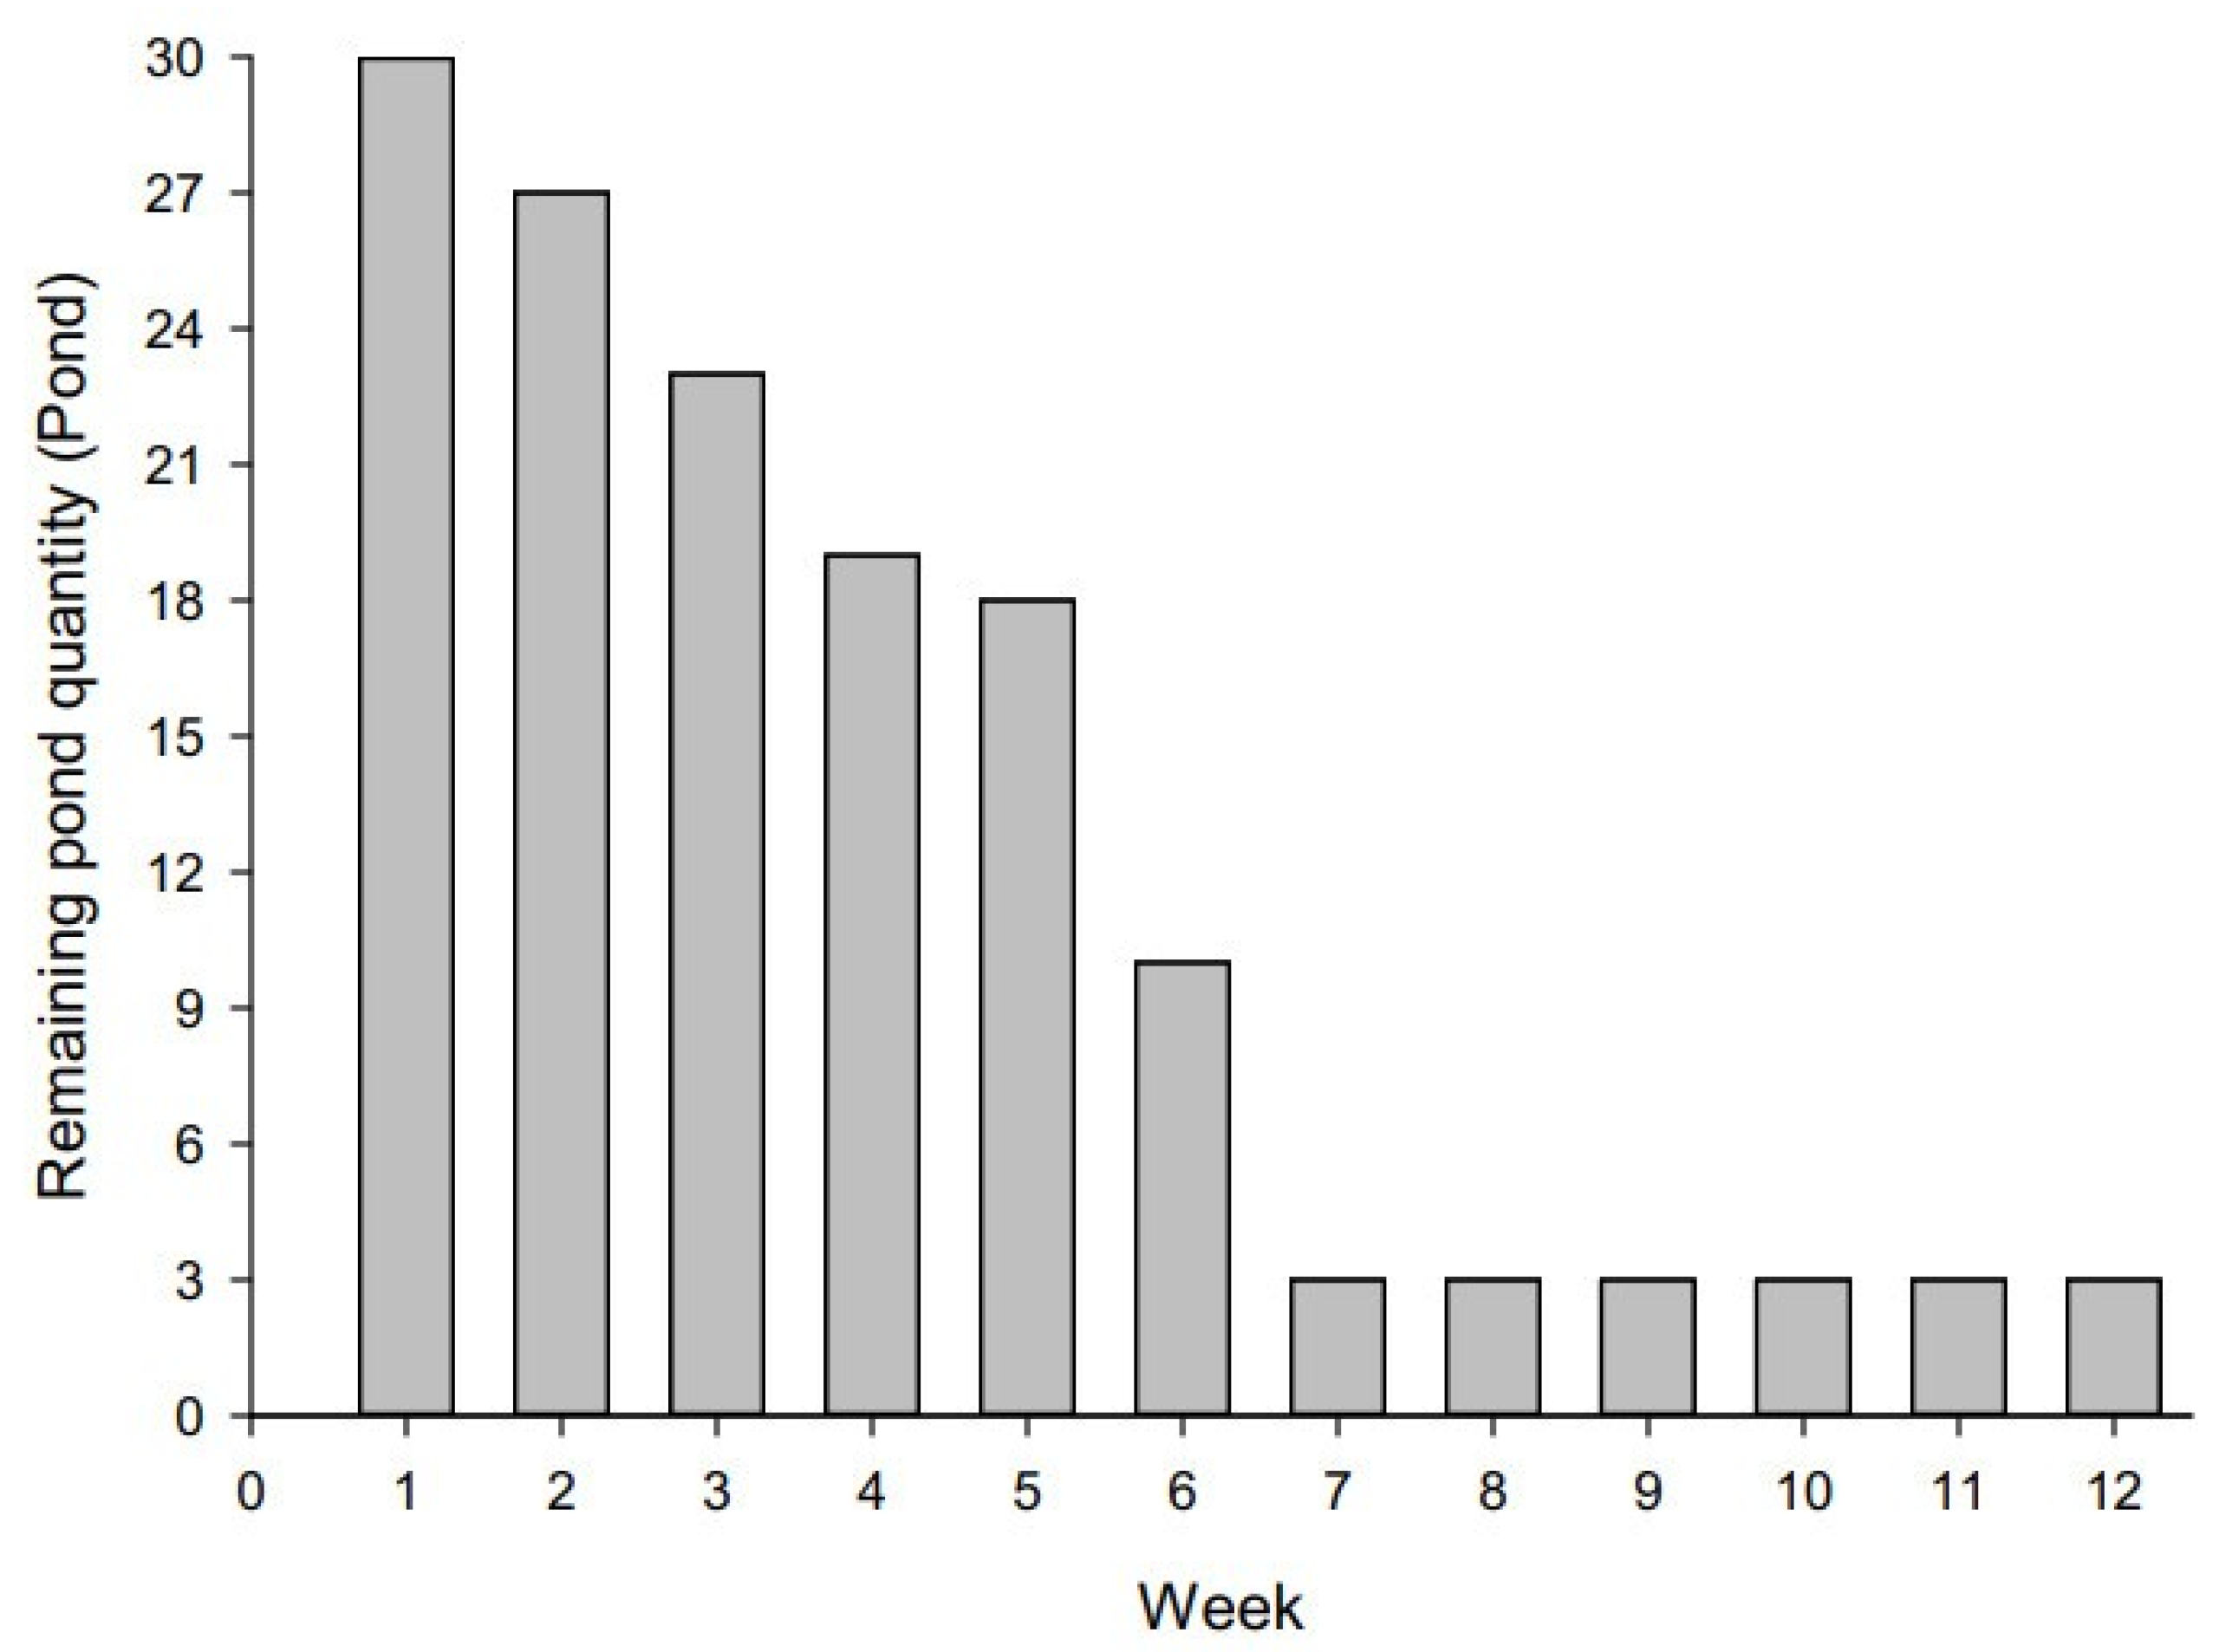
The number of shrimp farming ponds at the commencement of this survey was initially 30. However, over a 12-week period, the number of active shrimp ponds gradually decreased to three due to mortality in cultivated shrimp stocks, as seen in Figure 8. A total of 280 water effluent samples were collected during this study period.
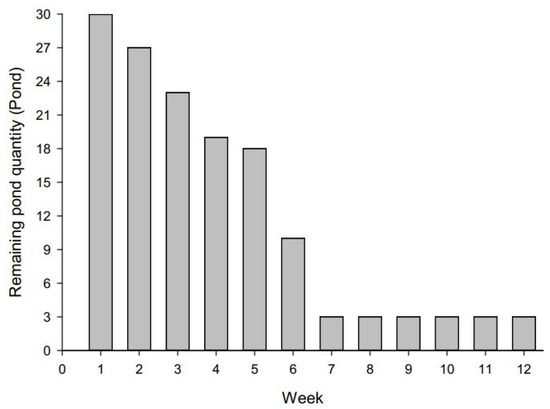
Figure 8.
The quantity of remaining shrimp ponds over 12 consecutive weeks from 15 May to 7 August 2017.
The measurements of effluent characteristics from the shrimp ponds are shown in Table 4. We herein adopted three references to create a comparison of the performance of these ponds. Akin to the above tables, the control limit was employed based on the Vietnamese regulation QCVN 02-19, while Ref. 1 and Ref. 2 were selected references due to similar farming conditions in terms of livestock, cultivation, and density. Indeed, TSS concentration is diverse in this study and the other references. All of the TSS concentrations are less than 100 mg·L−1 as regulated in the control limit; however, one in Ref. 1 is extremely low, in the range of 6.3 to 12.3 mg·L−1. TSS measured in this study was moderate (45.01 ± 28.67 mg·L−1). DO concentrations were quite low compared to the two references, while concentrations of nitrogen forms, phosphate, BOD5, and COD were higher than them, particularly for BOD5, and COD.

Table 4.
Measurements of effluent from shrimp ponds.
On the other hand, to choose water parameters for assessing the effect of ambient temperature on wastewater quality, we based the findings on results from qualitative surveys. In the survey results, the farmers commented that unusual weather phenomena included an increase in temperature difference during the day, prolonged intense sunlight, and unusually abrupt rainfall periods that spanned many days. Their comments were similar to the monitoring results of the local temperature conditions mentioned in Section 3.1. Some activities they employed to offset adverse impacts such as reducing the temperature influences consisted of adding fertilizer to control water quality, reducing the daily amount of shrimp food provided during each feeding, increasing the intensity and time of the paddle wheel for aeration as well as the bottom oxygen aerated system, and finally increasing the volume of daily water exchange. We therefore selected COD, NO3-N, and salinity parameter representatives to measure the effects of those practices.
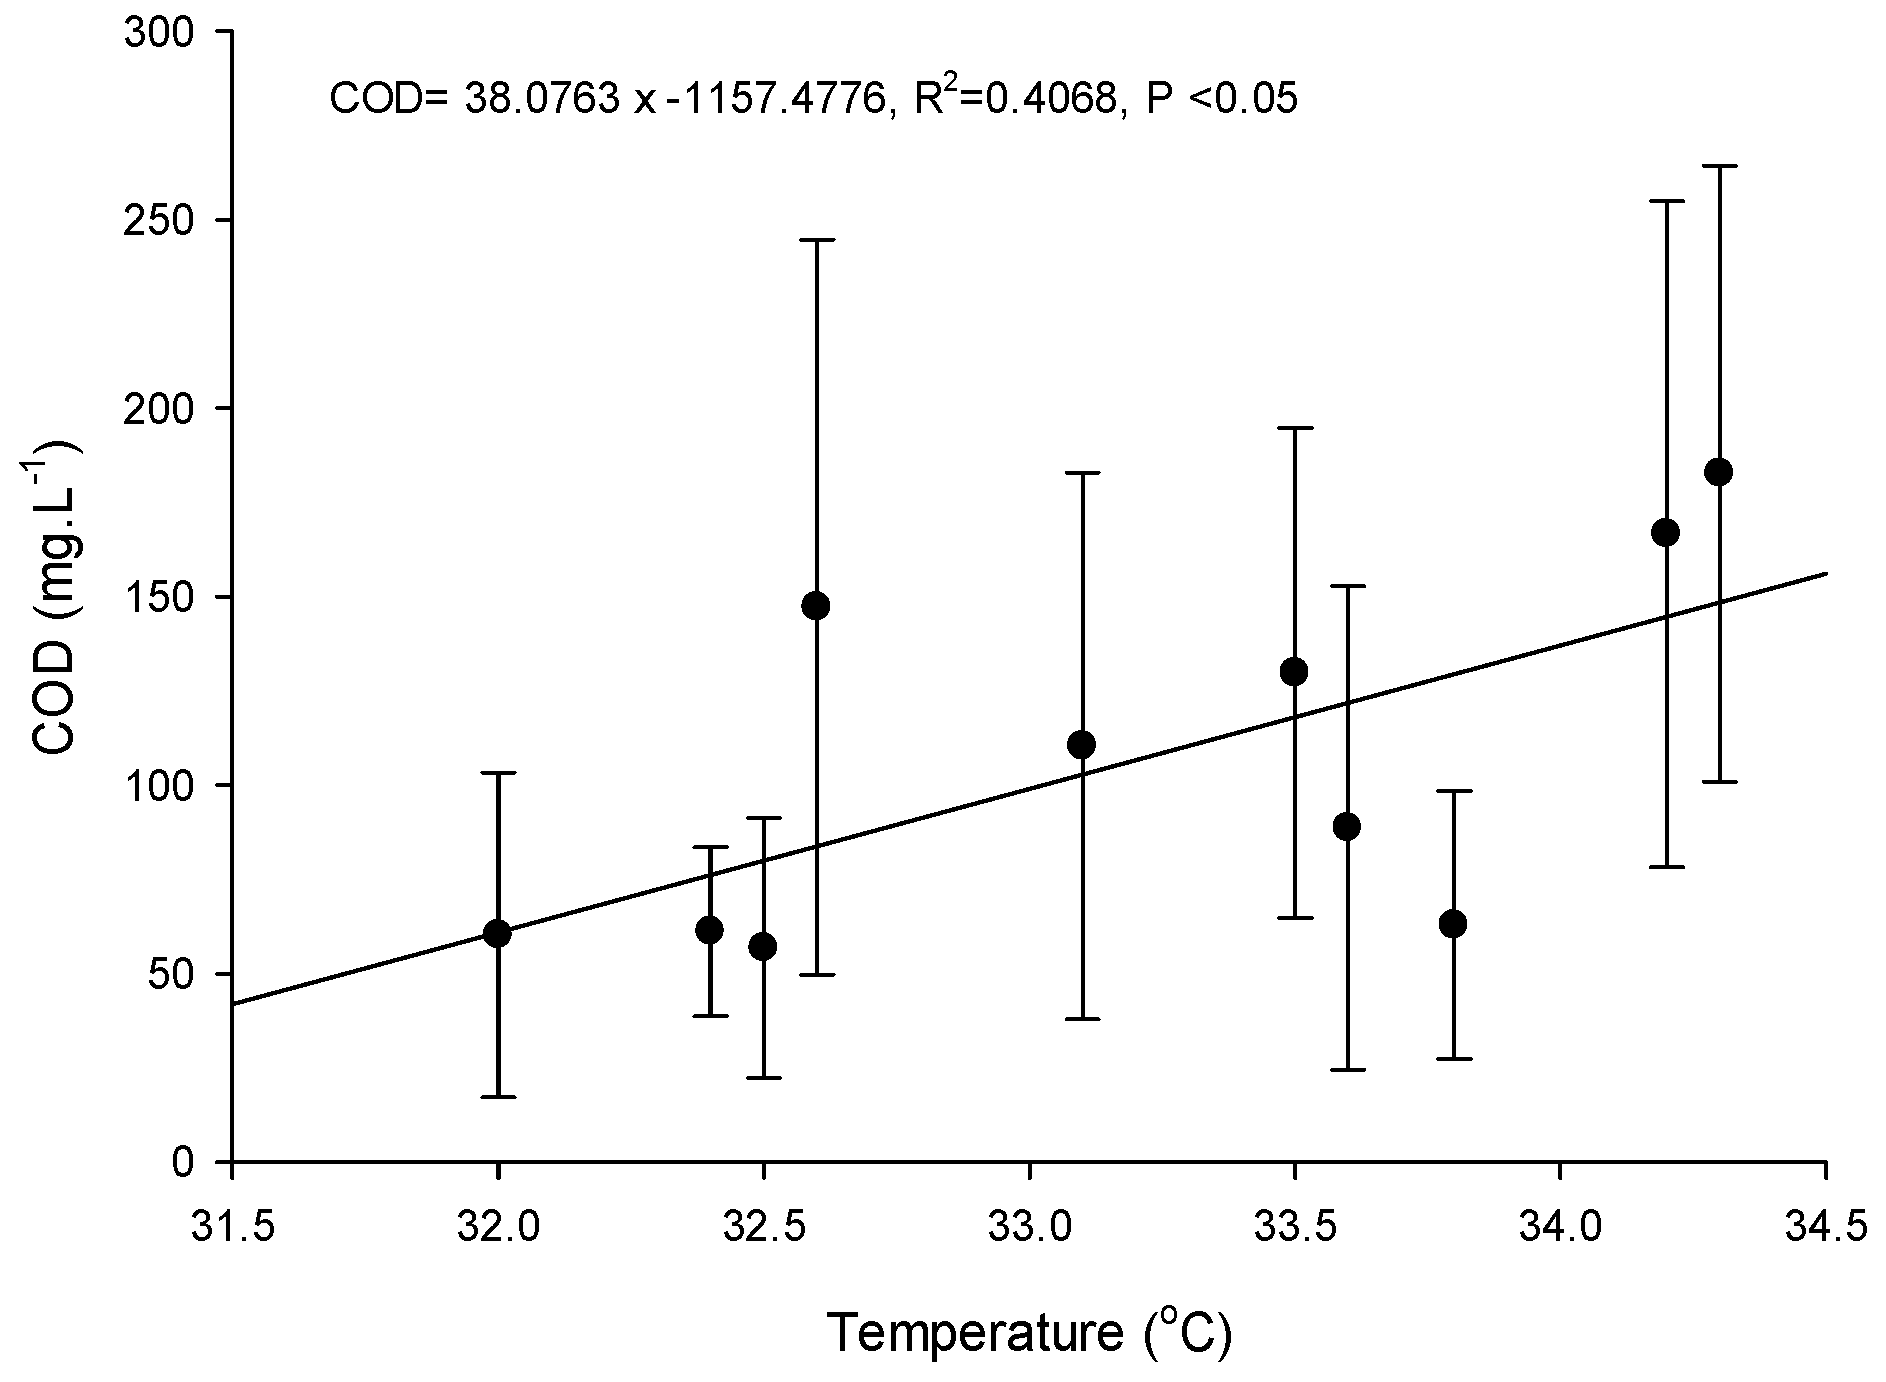
Figure 9 displays the relationship between the selected parameters of COD and the local average ambient temperature. Overall, there is a proportional correlation between COD concentration and temperature. Although the linear regression model does not explain well the variation of data (R2-value = 0.4068), it is statistically significant (p-value < 0.05). We also explored regression models between the other parameters (salinity, and NO3-N) and the average ambient temperature. However, there are no statistically significant models from these parameters.
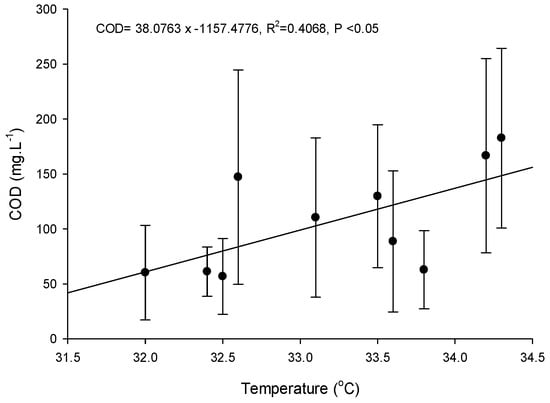
Figure 9.
Linear regressions between the local average ambient temperature and COD.
3.5.2. Comparison of Effluent Characteristics from Shrimp Pond with and without Inlet Water Treatment Ponds
Table 5 compares the characteristics of effluent water between two shrimp cultivation practices, one that includes an inlet water treatment pond (type 1), and the second that does not (type 2). Overall, the concentrations of nitrogen forms (NO3-N, TN), TSS, and salinity were reduced when the water is treated before flowing into the pond. However, there was a slight increase in pH, PO4-P, BOD5, and COD concentrations when using an inlet water treatment pond. A one-way ANOVA analysis was also adopted to assess the statistical difference between the two types. It was clear that NO2-N concentration remained unchanged, leading to an insignificant difference. Among the remaining parameters, the differences in BOD5 and PO4-P between the two treatments were also not statistically significant as indicated by the one-way ANOVA test.

Table 5.
Effluent characteristics from shrimp ponds. Type 1: with inlet water treatment pond; type 2: without inlet water treatment pond.
3.5.3. Comparison of Effluent from Different Shrimp Farming Areas
Similarly, Table 6 also uses a one-way ANOVA analysis to compare effluent water characteristics among three shrimp pond areas. As mentioned in Section 2.1, the source and quality of the water supply that is utilized are highly dependent on the relative location of the shrimp farms. For example, farms located in Area 2 which is deep inland (about 15 km away from the coast) had the highest levels measured in several parameters, including TSS, COD, and all three forms of nitrogen. Most of such parameters showed significant differences in the one-way ANOVA test, with the exception of TN. The second area had the lowest salinity and PO4-P concentrations among the three areas. In contrast, effluents from shrimp ponds in Area 3 were lowest in terms of COD, NO2-N, and TN. The ANOVA analysis of the first two parameters was statistically significant among the three areas. Ponds in Area 1 had the highest concentrations of BOD5 and PO4-P; however, only the difference in PO4-P was significant when comparing the three areas.

Table 6.
Effluent characteristics from shrimp ponds in three areas. Area 1: less than 10 km away from the coast; Area 2: less than 15 km away from the coast; Area 3: located inside the residential areas.
4. Discussion
From the finding results above, the water quality in the study area in particular, and in Ninh Thuan in general, has been highly affected by both local climate conditions and shrimp cultivation practices through the current state of water and effluent parameters that were monitored and sampled.
4.1. Effects of Local Natural Conditions and Extreme Weather Events
Ninh Thuan is a coastal province that has the hottest and driest climate in Vietnam. The coastline is characterized as having narrow strips of sandy topography. The province experiences the lowest average rainfall compared to the national average. Manifestations of extreme weather events were analyzed through temperature and rainfall parameters. During the study period between May and August 2017, the weather changed dramatically, i.e., at times there was infrequent rain but at a high intensity for the first three weeks, then followed by a total lack of rain over two weeks with intense sunshine. The rapid and drastic change in temperature adversely impacted shrimp cultivation. In fact, the number of remaining shrimp ponds that remained in operation dramatically decreased from 30 to three over a 12-week survey period, with the decrease most pronounced during the first seven weeks. Shrimp farming by small-scale households was likely the most vulnerable due to their financial constraints and limited knowledge of climate change adaptation. They have low capacity to adapt to the impacts of extreme weather. As a common practice, the farmers lessen the impacts of temperature fluctuations by adding fertilizer to control water quality, reducing the amount of shrimp food during each feeding, increasing the intensity and duration of aeration using paddle wheels in combination with using oxygen-aerated systems that are mounted on the bottom of the ponds, and increasing the daily water exchange volume. These activities, however, lead to adverse effects on the receiving environments if their cultivation processes are not operated and managed optimally. For instance, Figure 9 has demonstrated the models between COD and local temperature are significant.
4.2. Main Causes of Water Pollution from Shrimp Farming
In addition to natural conditions and local weather reasons, we conclude with the three main causes of water pollution from current shrimp farming practices in Ninh Thuan province. The first reason is the cultivation practices of the farmers. As mentioned in Section 3.2, they do not comply with local discharge regulations. For instance, only 20% of the ponds have an inlet water treatment pond. The farmers are knowledgeable about the requirements and effectiveness of treatment ponds; however, most farmers rent land, and the cost of renting increases if more land is rented to employ a treatment system. This is a negative financial incentive, as renting more land for treatment rather than strictly raising shrimp will yield a potential loss in revenue. Hence, chemicals for water treatment (e.g., potassium permanganate, chlorine, BKC, and iodine) and for the control of pH fluctuation (e.g., lime, zeolite, and dolomite) are directly added to the cultivation pond as a common practice based on their experience. Additionally, other chemicals are added into the shrimp feed to increase the shrimp’s resistance and boost nutrient absorption (e.g., ascorbic acid 10%, Sorbitol, Lysine, Methionine, Vitamin B, and a mixture of minerals and vitamins) or the feed is supplemented with probiotics including bacteria and enzymes (Proteases, Amylases, Celluloses, and Lipases). Through the survey, we found that over 80% of farmers use feed, fertilizers, and antibiotics on the advice of suppliers and give priority to a low price or pay after harvest. In addition to further exacerbating the problem, farmers prefer to buy fingerling stocks from the market rather than from reputable brand companies due to the price differences that can be up to 10 times more expensive [46]. Feed, fertilizers, and antibiotics are poor nutrients and may be of poor quality, and also the low disease resistance of certain shrimp species contributes to the failure of a given stock. This reveals a warning sign regarding the awareness of farmers. Furthermore, farms in the second and third areas which are deep inland have to exploit groundwater which is then used in combination with coastal water through an irrigation system to supply the shrimp ponds. The risk of spreading disease when using intake water from the irrigation system is relatively high. A similar risk happens when raising shrimp without settlement/treatment ponds.
Second, the existing local infrastructure also impacts the quality of cultivating water. The province has a centralized treatment pond with dimensions of 90 m by 65 m by 2.5 m in length, width, and depth, respectively. The designed storage capacity is 14,180 m3. Currently, some components of the wastewater treatment pond are degraded and damaged. Specifically, the two valves used to control the entry and/or release of inlet water and discharge water into the pond were damaged and unusable. The edge of the pond is eroded and there are no lining layers to prevent wastewater infiltration to adjacent areas outside of the treatment pond. Also, the end of the discharge pipe adjacent to the coastal side is often covered by sand, hindering the release of wastewater as needed. Of significant importance, the entire bottom of the pond is covered by a one-meter-thick layer of black-colored mud. Wastewater from intensive shrimp ponds is discharged directly into the centralized drainage system, which then flows into a treatment system and empties into the coast. Over the years, the constant deposition has resulted in the accumulation of mud in the centralized treatment pond. During the hot weather, the centralized treatment pond is a source of a foul odor, let alone being a main source of local water pollution. On the other hand, in terms of availability, public irrigation systems are the highest supply source. The irrigation canal systems have reached whole households located in the An Hai concentrated shrimp farming area. However, this source is contaminated by water movement in the canal and is also contaminated with household sanitary wastewater which is discreetly discharged into the canal.
Lastly, the mismanagement of the local authorities is also a contributor to water pollution in coastal shrimp farming. According to the surveys, the farmers reported that they are not getting much support from the governor to manage disease infection when it occurs. Additionally, the local government should be closely monitoring and managing water quality in the irrigation system to ensure an available water supply for shrimp farming. It is recommended that farmers have access to capital through financial lending so that they have the capacity to acquire the necessary equipment that would allow them, for example, to access quality groundwater and install an inlet water treatment pond, as well as purchase better quality shrimp stock and required water treatment chemicals.
4.3. Water Pollution from Coastal Shrimp Farming
Water pollution from coastal shrimp farming can be detected through the monitoring of coastal waters, groundwater, as well as effluent discharge from shrimp ponds. In general, three groups of water pollution were determined: suspended solid (consisting of TSS, the total Coliform parameters), organic and carbon matter (consisting of BOD5, COD parameters), and nutrient loading (including N-, P-form parameters). Through the water–wastewater cycle identified above (described in Figure 2), the water pollution from these sources was confirmed. Indeed, in the first phase, the shrimp cultivation practices (feeding, using chemicals) lead to the contamination of water resources by pollutants of all three categories, as seen in Table 4. Following this, was determined that the water effluent flows into the drainage ditches and empties into the coast and/or infiltrates groundwater. According to the local monitoring program, elevated nutrient parameters have been detected in coastal and groundwater, as seen in Table 2. In other words, the receiving water environments absorb organic and carbon matter while suspended solids are accumulating on the bottom while being transported in the water column. For groundwater sampled near the shrimp farms, high concentrations of salinity and Coliform were clearly identified (see Table 3), indicating the salinization phenomenon and effects of sewage from domestic activities in the study area.
4.4. Recommendations for Sustainable Shrimp Aquaculture in Ninh Thuan Province
In the context of the influence of geographical location, the resources of shrimp farming areas, and the shortage of a water treatment system to supply ponds, the most important thing is to effectively reallocate water resources. Priority needs to be determined in allocating water resources to users, including groundwater, surface water usage, and serving both domestic and production purposes. This is to prevent problems such as water shortages, water pollution, and saltwater intrusion during the dry season. At the same time, it is necessary to address the problem of pollution at its source, by encouraging people to set up wastewater treatment systems on their farms. For every two to three commercial shrimp ponds, it is recommended that there is a settling pond for water treatment to avoid directly supplying coastal water into the shrimp ponds, or discharging water effluent in the pond into the environment. This is an important step in shrimp cultivation, not only helping to protect the quality of the receiving water environment but also ensuring the quality of input water for the pond.
Based on the main causes of water pollution from shrimp farming discussed, to adapt to climate change, especially the phenomenon of abnormal temperature increases, toward a sustainable shrimp model, it is necessary to design and implement a comprehensive strategy. In particular, training farmer households to change traditional farming practices and cultivation habits (e.g., [17,70]) and helping to raise awareness about the impact of climate change on the environment and their livelihoods, such as discussed in [71], is the first step. Farmers need to change their way of thinking and there should be cooperation and unity in the farming process, especially for ponds located next to each other. Second, building an ecosystem of state management, business communities, and shrimp farmer communities helps people quickly grasp the abnormal situation, apply advanced farming technology (e.g., [72]), sustainable aquaculture models, and have a stable income. Next, the implementation of new shrimp farming techniques that reduce pollution and disease risks, allowing shrimps to adapt better to changing weather conditions, should be conducted. For instance, in a multi-phase shrimp farming model, shrimp will be cultured in different ponds depending on their stage of growth under roof cover, and moved to larger ponds with age. Lastly, the shrimp pond area should be reduced to make it easier to manage the water quality, rearing, treatment, and waste, as well as reduce investment costs.
5. Conclusions
The current study has shown the integrated impacts of extreme weather events, shrimp farming cultivation operations, degraded infrastructure, and the mismanagement of the local governor on the water quality in the coastal area of Ninh Thuan province. A comprehensive evaluation was performed based on an understanding of the water–wastewater cycle from coastal shrimp cultivation using qualitative and quantitative analyses.
However, a study on climatic impacts should be prolonged; hence, the present study can extend further solutions for waste prevention and minimization at the source, as well as for onsite treatment and the reuse of effluent in the future. Additional water sampling of the public irrigation system will contribute to a better understanding of the current state of water quality in the province. Nutrient pollution from coastal shrimp farming has been determined as a core issue of the province; thus, further studies are essential in delineating the breadth and depth of the issue as well as the socioeconomic challenges, thereby providing better information that would lead to an effective regional management plan.
Author Contributions
Conceptualization, G.E. and H.A.L.; methodology, G.E., H.A.L., K.L.P.N. and T.T.C.; investigation, G.E. and H.A.L.; resources, T.T.C.; writing—original draft, T.T.C.; writing—review and editing, G.E. and K.L.P.N.; visualization, K.L.P.N. and T.T.C.; supervision, G.E. and H.A.L. All authors have read and agreed to the published version of the manuscript.
Funding
This research supported by the Académie de Recherche et d’Enseignement Supérieur (ARES-CCD, Brussels, Belgium) in the frame of the RENEWABLE project (Removal of nutrients in wastewater treatments via microalgae and biofuel/biomass production for Environmental sustainability in Vietnam, PRD 2016–2022).
Institutional Review Board Statement
Not applicable.
Informed Consent Statement
Informed consent was obtained from all subjects involved in the study.
Data Availability Statement
The data that support the findings of this study are available upon reasonable request from the authors.
Acknowledgments
We are grateful to the Department of Meteorology and the Departments of Science and Technology, Natural Resources and Environment, and Agriculture of Ninh Thuận Province for providing essential data. We thank the People’s Committee of An Hải Commune, the Shrimp Breeding Association, local farmers, and the university students for their assistance during the study.
Conflicts of Interest
The authors declare no conflicts of interest.
References
- Skendžić, S.; Zovko, M.; Živković, I.P.; Lešić, V.; Lemić, D.J.I. The impact of climate change on agricultural insect pests. Insects 2021, 12, 440. [Google Scholar] [CrossRef]
- Freitas, T.R.; Santos, J.A.; Silva, A.P.; Fraga, H.J.A. Reviewing the adverse climate change impacts and adaptation measures on almond trees (Prunus dulcis). Agriculture 2023, 13, 1423. [Google Scholar] [CrossRef]
- Mehrim, A.I.; Refaey, M.M.J.S. An overview of the implication of climate change on fish farming in Egypt. Sustainability 2023, 15, 1679. [Google Scholar] [CrossRef]
- Porter, J.R.; Semenov, M.A. Crop responses to climatic variation. Philos. Trans. R. Soc. B Biol. Sci. 2005, 360, 2021–2035. [Google Scholar] [CrossRef]
- Ray, D.K.; Gerber, J.S.; MacDonald, G.K.; West, P.C. Climate variation explains a third of global crop yield variability. Nat. Commun. 2015, 6, 5989. [Google Scholar] [CrossRef]
- Thanh, P.N.; Le Van, T.; Minh, T.T.; Ngoc, T.H.; Lohpaisankrit, W.; Pham, Q.B.; Gagnon, A.S.; Deb, P.; Pham, N.T.; Anh, D.T.J.S. Adapting to climate-change-induced drought stress to improve water management in Southeast Vietnam. Sustainability 2023, 15, 9021. [Google Scholar] [CrossRef]
- Mitra, A.; Abdel-Gawad, F.K.; Bassem, S.; Barua, P.; Assisi, L.; Parisi, C.; Temraz, T.A.; Vangone, R.; Kajbaf, K.; Kumar, V.J.W. Climate change and reproductive biocomplexity in fishes: Innovative management approaches towards sustainability of fisheries and aquaculture. Water 2023, 15, 725. [Google Scholar] [CrossRef]
- Weatherdon, L.V.; Magnan, A.K.; Rogers, A.D.; Sumaila, U.R.; Cheung, W.W. Observed and projected impacts of climate change on marine fisheries, aquaculture, coastal tourism, and human health: An update. Front. Mar. Sci. 2016, 3, 48. [Google Scholar] [CrossRef]
- Intergovermental Panel on Climate Change. Climate Change 2007: Impacts, Adaptation and Vulnerability; IPCC: Geneva, Switzerland, 2001. [Google Scholar]
- Ahmed, N.; Thompson, S.; Glaser, M. Global aquaculture productivity, environmental sustainability, and climate change adaptability. Environ. Manag. 2019, 63, 159–172. [Google Scholar] [CrossRef]
- Wiranegara, P.; Sunardi, S.; Sumiarsa, D.; Juahir, H.J.W. Characteristics and Changes in Water Quality Based on Climate and Hydrology Effects in the Cirata Reservoir. Water 2023, 15, 3132. [Google Scholar] [CrossRef]
- Dey, S.; Botta, S.; Kallam, R.; Angadala, R.; Andugala, J.J.C.R.i.G.; Chemistry, S. Seasonal variation in water quality parameters of Gudlavalleru Engineering College pond. Curr. Res. Green Sustain. Chem. 2021, 4, 100058. [Google Scholar] [CrossRef]
- Wurts, W.A.; Durborow, R.M. Interactions of pH, Carbon Dioxide, Alkalinity and Hardness in Fish Ponds; SRAC Publication: Stoneville, MS, USA, 1992. [Google Scholar]
- Boyd, C.E.; Tucker, C.S.; Somridhivej, B. Alkalinity and hardness: Critical but elusive concepts in aquaculture. J. World Aquac. Soc. 2016, 47, 6–41. [Google Scholar] [CrossRef]
- Hoang, T.; Ho, H.C.; Le, N.P.T.; Bui, T.H.H.J.A. Effects of high temperature on survival and feed consumption of banana shrimp Penaeus merguiensis. Aquaculture 2020, 522, 735152. [Google Scholar] [CrossRef]
- Kim, C.W.; Lee, J.-W.; Kang, S.-W.; Kang, H.S.J.W. Study on Ferritin Gene Expression to Evaluate the Health of White Leg Shrimp (Lito Penaeus vannamei) Postlarvae Due to Changes in Water Temperature, Salinity, and pH. Water 2024, 16, 1477. [Google Scholar] [CrossRef]
- Islam, M.A.; Akber, M.A.; Ahmed, M.; Rahman, M.M.; Rahman, M.R. Climate change adaptations of shrimp farmers: A case study from southwest coastal Bangladesh. Clim. Dev. 2019, 11, 459–468. [Google Scholar] [CrossRef]
- Zhu, J.; Shi, W.; Zhao, R.; Gu, C.; Li, H.; Wang, L.; Wan, X.J.F. Effects of Cold Stress on the Hemolymph of the Pacific White Shrimp Penaeus vannamei. Fishes 2024, 9, 36. [Google Scholar] [CrossRef]
- Hoffling, F.B.; Marquezi, A.S.; Pinheiro, I.; Simon, C.; Rombenso, A.N.; Seiffert, W.Q.; Vieira, F.d.N.; Schleder, D.D.J.F. Aurantiochytrium sp. Meal as Feed Additive for Pacific White Shrimp Reared under Low Temperature and Challenged by WSSV in Association with Thermal Stress. Fishes 2024, 9, 108. [Google Scholar] [CrossRef]
- Barajas-Sandoval, D.R.; Escobedo-Fregoso, C.; Quiroz-Guzman, E.; Tovar-Ramírez, D.; Py, C.A.; Peña-Rodríguez, A.J.C.B.; Molecular, P.P.A.; Physiology, I. Effect of temporal thermal stress on Penaeus vannamei: Growth performance and physiological plasticity. Comp. Biochem. Physiol. Part A Mol. Integr. Physiol. 2024, 295, 111653. [Google Scholar] [CrossRef]
- Thanomchaisanit, P.; Koiwai, K.; Osawa, Y.; Kuwahara, D.; Nohara, S.; Kondo, H.; Hirono, I.J.F.S. Astaxanthin supplementation enhances low-temperature stress tolerance, immune-related genes, and resistance to Vibrio parahaemolyticus in Whiteleg Shrimp Penaeus vannamei. Fish. Sci. 2024, 1–13. [Google Scholar] [CrossRef]
- Wyban, J.; Walsh, W.A.; Godin, D.M. Temperature effects on growth, feeding rate and feed conversion of the Pacific white shrimp (Penaeus vannamei). Aquaculture 1995, 138, 267–279. [Google Scholar] [CrossRef]
- Cheng, W.; Wang, L.-U.; Chen, J.-C. Effect of water temperature on the immune response of white shrimp Litopenaeus vannamei to Vibrio alginolyticus. Aquaculture 2005, 250, 592–601. [Google Scholar] [CrossRef]
- Le Moullac, G.; Haffner, P. Environmental factors affecting immune responses in Crustacea. Aquaculture 2000, 191, 121–131. [Google Scholar] [CrossRef]
- Boyd, C.E. Water Quality in Warmwater Fish Ponds; Agricultural Experiment Station, Auburn University: Auburn, AL, USA, 1979. [Google Scholar]
- Ostrensky, A.; Marchiori, M.A.; Poersch, L.H. Toxicidade aguda da amônia no processo produtivo de pós-larvas de Penaeus paulensis, Pérez-Farfante, 1967. An. Acad. Bras. Ciências 1992, 64, 383–389. [Google Scholar]
- Boyd, C.E.; Green, B.W. Coastal water quality monitoring in shrimp farming areas, an example from Honduras. In Report Prepared under the World Bank, NACA, WWF and FAO Consortium Program on Shrimp Farming and the Environment. Work in Progress for Public Discussion; FAO Consortium: Rome, Italy, 2002; 29p. [Google Scholar]
- Ferreira, N.; Bonetti, C.; Seiffert, W. Hydrological and water quality indices as management tools in marine shrimp culture. Aquaculture 2011, 318, 425–433. [Google Scholar] [CrossRef]
- Zhang, X.; Zhang, Y.; Zhang, Q.; Liu, P.; Guo, R.; Jin, S.; Liu, J.; Chen, L.; Ma, Z.; Liu, Y. Evaluation and analysis of water quality of marine aquaculture area. Int. J. Environ. Res. Public Health 2020, 17, 1446. [Google Scholar] [CrossRef]
- Kibria, G.; Nugegoda, D.; Rose, G.; Haroon, A.Y. Climate change impacts on pollutants mobilization and interactive effects of climate change and pollutants on toxicity and bioaccumulation of pollutants in estuarine and marine biota and linkage to seafood security. Mar. Pollut. Bull. 2021, 167, 112364. [Google Scholar] [CrossRef]
- Jamal, M.R.; Kristiansen, P.; Kabir, M.J.; de Bruyn, L.L. Risks and adaptation dynamics in shrimp and prawn-based farming systems in southwest coastal Bangladesh. Aquaculture 2023, 562, 738819. [Google Scholar] [CrossRef]
- Li, T.; Zhang, B.; Zhu, C.; Su, J.; Li, J.; Chen, S.; Qin, J. Effects of an ex situ shrimp-rice aquaponic system on the water quality of aquaculture ponds in the Pearl River estuary, China. Aquaculture 2021, 545, 737179. [Google Scholar] [CrossRef]
- Drizo, A.; Shaikh, M.O. An assessment of approaches and techniques for estimating water pollution releases from aquaculture production facilities. Mar. Pollut. Bull. 2023, 196, 115661. [Google Scholar] [CrossRef]
- Mustafa, A.; Paena, M.; Athirah, A.; Ratnawati, E.; Asaf, R.; Suwoyo, H.S.; Sahabuddin, S.; Hendrajat, E.A.; Kamaruddin, K.; Septiningsih, E. Temporal and spatial analysis of coastal water quality to support application of whiteleg shrimp Litopenaeus vannamei intensive pond technology. Sustainability 2022, 14, 2659. [Google Scholar] [CrossRef]
- Bull, E.; Cunha, C.d.L.d.N.; Scudelari, A. Water quality impact from shrimp farming effluents in a tropical estuary. Water Sci. Technol. 2021, 83, 123–136. [Google Scholar] [CrossRef]
- Kais, S.M.; Islam, M.S. Impacts of and resilience to climate change at the bottom of the shrimp commodity chain in Bangladesh: A preliminary investigation. Aquaculture 2018, 493, 406–415. [Google Scholar] [CrossRef]
- Lebel, L.; Jutagate, T.; Thanh Phuong, N.; Akester, M.J.; Rangsiwiwat, A.; Lebel, P.; Phousavanh, P.; Navy, H.; Soe, K.M.; Lebel, B. Climate risk management practices of fish and shrimp farmers in the Mekong Region. Aquac. Econ. Manag. 2021, 25, 388–410. [Google Scholar] [CrossRef]
- Adger, W.N. Social vulnerability to climate change and extremes in coastal Vietnam. World Dev. 1999, 27, 249–269. [Google Scholar] [CrossRef]
- Cuesta, J.; Cai, L.; Madrigal, L.; Pecorari, N.J.S. Exposure to Climatic Risks and Social Sustainability in Vietnam. Sustainability 2023, 15, 3260. [Google Scholar] [CrossRef]
- Vien, T.D. Climate change and its impact on agriculture in Vietnam. J. Int. Soc. Southeast Asian Agric. Sci. 2011, 17, 17–21. [Google Scholar]
- Nguyen, M.-L.; Kim, M.-S.; Nguyen, N.-T.N.; Nguyen, X.-T.; Cao, V.-L.; Nguyen, X.-V.; Vieira, C.J.P. Marine floral biodiversity, threats, and conservation in Vietnam: An updated review. Plants 2023, 12, 1862. [Google Scholar] [CrossRef] [PubMed]
- Nhung, N.T.T.; Hoang, L.T.; Tuyet Hanh, T.T.; Toan, L.Q.; Thanh, N.D.; Truong, N.X.; Son, N.A.; Nhat, H.V.; Quyen, N.H.; Nhu, H.V. Effects of Heatwaves on Hospital Admissions for Cardiovascular and Respiratory Diseases, in Southern Vietnam, 2010–2018: Time Series Analysis. Int. J. Environ. Res. Public Health 2023, 20, 3908. [Google Scholar] [CrossRef] [PubMed]
- Brander, K.M. Global fish production and climate change. Proc. Natl. Acad. Sci. USA 2007, 104, 19709–19714. [Google Scholar] [CrossRef]
- Muruganandam, M.; Rajamanickam, S.; Sivarethinamohan, S.; Reddy, M.K.; Velusamy, P.; Gomathi, R.; Ravindiran, G.; Gurugubelli, T.R.; Munisamy, S.K. Impact of climate change and anthropogenic activities on aquatic ecosystem–A review. Environ. Res. 2023, 238, 117233. [Google Scholar]
- De Silva, S.S.; Soto, D. Climate change and aquaculture: Potential impacts, adaptation and mitigation. In Climate Change Implications for Fisheries and Aquaculture: Overview of Current Scientific Knowledge; FAO Fisheries and Aquaculture Technical Paper; FAO: Rome, Italy, 2009; Volume 530, pp. 151–212. [Google Scholar]
- Craeye, B. Analysis of the Aquaculture Sector in Ninh Thuan Province, Vietnam. Master’s Thesis, Université de Liège, Liège, Belgium, 2019. [Google Scholar]
- McIntosh, D.; Fitzsimmons, K. Characterization of effluent from an inland, low-salinity shrimp farm: What contribution could this water make if used for irrigation. Aquac. Eng. 2003, 27, 147–156. [Google Scholar] [CrossRef]
- Van, T.B.; Quang, T.T.; The, K.N. Climate Change Vulnerability of Urban Development in Phanrang-Thapcham (Ninh Thuan, Vietnam). In Global Changes and Sustainable Development in Asian Emerging Market Economies; Volume 2: Proceedings of EDESUS 2019; Springer: Cham, Switzerland, 2022; pp. 843–856. [Google Scholar]
- Tuan, N.H.; Canh, T.T. Analysis of trends in drought with the non-parametric approach in Vietnam: A case study in Ninh Thuan Province. Am. J. Clim. Chang. 2021, 10, 51. [Google Scholar] [CrossRef]
- Rice, E.W.; Baird, R.B.; Eaton, A.D.; Clesceri, L.S. (Eds.) Standard Methods for the Examination of Water and Wastewater, 22nd ed.; APHA/AWWA/WEF: Washington, DC, USA, 2012. [Google Scholar]
- APHA; AWWA; WPCE. Standard Methods for Examination of Water and Waste Water, 18th ed.; APHA/AWWA/WPCE: Washington, DC, USA, 1992. [Google Scholar]
- ISO 9963/1:1994; Water Quality—Determination of Alkalinity—Part 1: Determination of Total and Composite Alkalinity. ISO: Geneva, Switzerland, 1994.
- TCVN 6625:2000; Water Quality—Determination Suspended Solids by Filtration Through Glass-Fibre Filters. Ministry of Science, Technology and Environment: Hanoi, Vietnam, 2000; 11p.
- ISO 5664; Water Quality—Determination of Ammonium—Distillation and Titration Method. ISO: Geneva, Switzerland, 1984.
- ISO 6777:1984; Water Quality—Determination of Nitrite—Molecular Absorption Spectrometric Method. ISO: Geneva, Switzerland, 1984.
- ISO 7890-3:1988; Water Quality—Determination of Nitrate—Part 3: Spectrometric Method Using Sulfosalicylic Acid. ISO: Geneva, Switzerland, 1988.
- ISO 6878:2004; Water Quality—Determination of Phosphorus—Ammonium Molybdate Spectrometric Method. ISO: Geneva, Switzerland, 2004.
- ISO 6060:1989; Water Quality—Determination of the Chemical Oxygen Demand. ISO: Geneva, Switzerland, 1989.
- ISO 5815-1:2003; Water Quality: Determination of Biochemical Oxygen Demand after n Days (BODn), Part 1: Dilution and Seeding Method with Allylthiourea Addition. ISO: Geneva, Switzerland, 2003.
- ISO 6059-1984; Determination of Total Content of Calcium and Magnesium. Titration Method Using Ethylenedia-Minetetraacetic Acid. ISO: Geneva, Switzerland, 1984.
- ISO 9308-1:1990; Water Quality. Detection and Enumeration of Coliform Organisms, Thermotolerant Organisms and Presuntive Escherichia coli. Part 1: Membrane Filtration Method. ISO: Geneva, Switzerland, 1990.
- QCVN 09:2023/BTNMT; National Technical Regulation on Ground Water Quality. Ministry of Science and Technology: Hanoi, Vietnam, 2023.
- QCVN 02-19:2014/BNNPTNT; National Technical Regulation on Brackish Water Shrimp Farming—Conditions for Ensuring Veterinary Hygiene, Environmental Protection and Food Safety. Ministry of Science and Technology: Hanoi, Vietnam, 2014.
- Krenkel, P. Water Quality Management; Elsevier: Amsterdam, The Netherlands, 2012. [Google Scholar]
- QCVN 10:2023/BTNMT; National Technical Regulation on Marine Water Quality. Ministry of Science and Technology: Hanoi, Vietnam, 2023.
- Boyd, C.E. Guidelines for aquaculture effluent management at the farm-level. Aquaculture 2003, 226, 101–112. [Google Scholar] [CrossRef]
- Boyd, C.E. Water Quality for Pond Aquaculture; International Center for Aquaculture and Aquatic Environments, Alabama Agricultural Experiment Station, Auburn University: Auburn, AL, USA, 1998. [Google Scholar]
- Allan, G.L.; Maguire, G.B. Lethal levels of low dissolved oxygen and effects of short-term oxygen stress on subsequent growth of juvenile Penaeus monodon. Aquaculture 1991, 94, 27–37. [Google Scholar] [CrossRef]
- Samocha, T.M.; Lopez, I.; Jones, E.; Jackson, S.; Lawrence, A. Characterization of intake and effluent waters from intensive and semi-intensive shrimp farms in texas. Aquac. Res. 2004, 35, 321–339. [Google Scholar] [CrossRef]
- Dhar, A.R.; Uddin, M.T.; Roy, M.K. Assessment of organic shrimp farming sustainability from economic and environmental viewpoints in Bangladesh. Environ. Res. 2020, 180, 108879. [Google Scholar] [CrossRef]
- Jayasinghe, J.; Gamage, D.; Jayasinghe, J. Combating climate change impacts for shrimp aquaculture through adaptations: Sri Lankan perspective. In Sustainable Solutions for Food Security: Combating Climate Change by Adaptation; Springer: Cham, Switzerland, 2019; pp. 287–309. [Google Scholar]
- Didar-Ul Islam, S.; Bhuiyan, M.A.H. Impact scenarios of shrimp farming in coastal region of Bangladesh: An approach of an ecological model for sustainable management. Aquac. Int. 2016, 24, 1163–1190. [Google Scholar] [CrossRef]
Disclaimer/Publisher’s Note: The statements, opinions and data contained in all publications are solely those of the individual author(s) and contributor(s) and not of MDPI and/or the editor(s). MDPI and/or the editor(s) disclaim responsibility for any injury to people or property resulting from any ideas, methods, instructions or products referred to in the content. |
© 2024 by the authors. Licensee MDPI, Basel, Switzerland. This article is an open access article distributed under the terms and conditions of the Creative Commons Attribution (CC BY) license (https://creativecommons.org/licenses/by/4.0/).

