Abstract
The efficient and timely delivery of pharmaceuticals is critical, particularly in regions with dispersed populations and challenging logistics. Inclement weather often disrupts ground transport, complicating the consistent supply of essential medications. Advanced air mobility (AAM), particularly through the use of drones, presents a promising solution to these logistical challenges by enabling smaller, more frequent deliveries to low density populated places and bypassing traditional transport constraints. This study evaluates the potential benefits of AAM for pharmaceutical transport in North Dakota (ND). The authors developed a comprehensive GIS and optimization framework to identify optimal locations for logistical centers and routes for drone and truck transport. The study introduces a person-years-saved (PYS) metric to rank the potential for AAM deployments to foster healthcare improvements in underserved communities. Moreover, the study found that drone trips were significantly more cost-effective and efficient than truck trips, with trucks being 2.3 times more expensive and having a 2.8 times higher underutilization rate. The study concludes with recommendations for regulatory support and future research to validate and expand the application of AAM in pharmaceutical logistics, contributing to improved healthcare delivery and operational efficiency in often overlooked rural populations. These insights provide a foundation for the practical implementation of AAM technologies, emphasizing their potential to revolutionize pharmaceutical logistics in challenging environments.
1. Introduction
The efficient and timely delivery of pharmaceuticals is critical, particularly in regions with underserved and dispersed populations. Inclement weather in those areas can often disrupt ground transport, further complicating the consistent supply of essential medications. Ensuring daily transport of pharmaceuticals is necessary to maintain adequate stock levels, meet patient needs promptly, and manage the perishability and sensitive storage requirements of many drugs. Advanced air mobility (AAM) presents a promising solution to these logistical challenges for both middle-mile and first/last-mile deliveries. Drones, a key component of AAM, offer the ability to handle smaller, more frequent deliveries, bypassing the constraints of traditional truck transport. This flexibility not only enhances the efficiency of the supply chain but also contributes to environmental sustainability through reduced emissions.
Currently, drone deployment in pharmaceutical logistics is at an exploratory stage, with initial studies demonstrating their potential for rapid, on-demand delivery of small packages [1]. However, significant gaps remain in understanding the full potential of AAM on large-scale pharmaceutical distribution networks. Previous studies have often lacked a detailed consideration of large-scale implementations, including middle-mile logistics and integration into existing business operations [2], which this study aims to address. Additionally, limited data exist on the comparative efficiency of drones versus trucks, particularly in rural regions with pronounced logistical challenges.
The goal of this paper is to evaluate the potential benefits of deploying AAM for pharmaceutical transport, selecting North Dakota for a scenario study. Specifically, this research aims to address the question: “How can AAM, through the use of drones, enhance the efficiency and effectiveness of pharmaceutical logistics compared with traditional truck transport in a rural state like North Dakota?” To achieve this goal, the study will do the following:
Develop a scenario for AAM deployment centered around a multimodal logistical center (MLC) that leverages existing city and regional airport facilities, many of which are currently underutilized [3].
Compare optimized transport times to local demand centers using a GIS and optimization framework to identify the best location for the MLC.
Use hospitals as anchors of pharmaceutical demand centers and their nearby airports as local distribution hubs to streamline the multimodal delivery process.
This study offers several key contributions: First, it develops a GIS and optimization framework that provides a method to identify the best location for an underutilized airport to serve as an MLC to distribute pharmaceuticals trucked into the state. Second, it develops a metric, the person-years-saved (PYS), to rank demand centers for AAM deployments. Third, it compares the required daily drone trips and daily truck trips, based on estimates of the annual weight of pharmaceuticals forecasted to arrive in ND in 2030. By addressing these aspects, the authors aim to substantiate the viability of AAM in transforming pharmaceutical logistics, contributing to improved healthcare delivery and operational efficiency, especially in regions with challenging logistics.
The structure of this paper is as follows: Section 2 reviews recent developments in AAM and pharmaceutical logistics, identifying research gaps. Section 3 details the data sources and methodology. Section 4 presents the results, including freight flow estimates and route optimizations. Section 5 discusses the implications of the findings and future research directions. Section 6 concludes the study.
2. Literature Review
The application of AAM in logistics, particularly for pharmaceutical transport, is an emerging field that addresses critical challenges in supply chain management. This section explores the current state of research on AAM, highlighting key findings and gaps in existing research.
2.1. Advanced Air Mobility
AAM encompasses the use of drones in the form of electric or hybrid-electric vertical takeoff and landing (eVTOL) and short takeoff and landing (STOL) aircraft. These new types of aircraft offer innovative solutions for transporting goods [4] as well as people [5]. Their autonomous operation [6] in beyond visual line of sight (BVLOS) conditions [7] promise significant cost advantages, but these capabilities are still in their early stages of development, with commercial deployments anticipated by 2030. Meanwhile, retailers such as Amazon and Walmart have been demonstrating their capability to handle frequent deliveries of small packages [2]. Long et al. (2023) suggested that the success of cargo drone applications is highly dependent on demand [8]. Studies such as Zhao et al. (2024) highlight the potential of drones to improve the efficiency of last-mile deliveries by reducing transport times and costs compared with traditional ground transport [9]. Dulia et al. (2021) discussed the environmental benefits of drone logistics, emphasizing reduced emissions and energy consumption [10]. Commercial deployments of package delivery services that currently utilize small drones can carry tens of kilograms for tens of kilometers [2]. By contrast, emerging heavy-lift cargo drones will be capable of carrying hundreds of kilograms for more than 400 km (250 miles) while flying faster than 161 km per hour (100 miles per hour) [11]. Aside from technical issues, Sah et al. (2021) found that the most critical barriers to drone logistics are currently the lack of regulations and the potential for security and privacy threats [12].
Ensuring the security of drone communications is critical for the safe and effective deployment of AAM technologies in pharmaceutical transport. Drones rely on robust communication systems to navigate, communicate with control centers, and transmit real-time data [13]. Hence, several security measures are essential to protect these communications from potential threats. Implementing strong encryption protocols can safeguard the data transmitted between drones and ground stations, preventing unauthorized access and tampering. Continuous monitoring of drone communications can help detect and respond to security threats in real-time. Anomaly detection systems can identify unusual patterns of behavior that may indicate a security breach, allowing for prompt intervention and mitigation of potential risks.
2.2. Pharmaceutical Logistics
The pharmaceutical supply chain characteristically has stringent requirements for timely and secure deliveries, given the perishability and sensitive storage conditions of many medications [1]. In the healthcare supply chain, it is critically important to maintain consistent stock levels for promptly meeting patient needs [14]. However, studies contend that pharmaceutical supply chain management is still a niche area in sustainable logistics [15]. Traditional truck transport faces significant challenges, especially in rural and remote areas with limited infrastructure and potentially hazardous pathways [16]. Naor et al. (2024) highlighted that the disruption of ground transport due to inclement weather can further complicate these logistics [17]. Nalini (2024) found that many people who live in isolated places tend to lack access to basic healthcare, but drones can quickly bring medicines, vaccinations, and other life-saving products to those locations [18]. Gunaratne et al. (2022) emphasized that using drones for last-mile logistics can be especially beneficial in low-income countries [19]. Kamal et al. (2023) highlighted that drones can enable dependable medical delivery platforms for laboratory samples, emergency medical equipment, vaccines, and pharmaceuticals [20]. However, a gap found by Johannessen (2022) was that few studies have evaluated the potential time savings of using drones to transport biologic samples [21].
2.3. Case Studies
Causa et al. (2022) examined the issue of strategic and tactical path planning for urban air mobility, considering real-world use cases [22]. Naor et al. (2024) presented a case study of the benefits realized by delivering small parcels to hospitals in Israel via hydrogen-powered VTOL aircraft [17]. Similarly, Ramos and Vigo (2023) discussed using drones to achieve same-day medicine delivery in rural areas of Portugal [23]. Beck et al. (2020) studied the feasibility of using drones to rapidly deliver adrenaline auto-injectors for anaphylaxis [24]. Nedelea et al. (2022) evaluated using drones in field rescue operations and found that a key advantage is the shorter travel time to patients, particularly in remote or difficult-to-reach places [25]. Silvestri et al. (2022) evaluated the use of drones for hospital internal transport of urgent pharmaceuticals [26]. Similarly, Maheswari et al. (2021) suggested using drones to avoid human intervention during the global pandemic by dispensing medicines to designated patient locations within and across hospital facilities [27].
2.4. Existing Gaps and Research Contributions
Despite the potential benefits, significant gaps remain in understanding the full impact of AAM on pharmaceutical logistics. Existing research primarily focuses on small-scale or hypothetical scenarios without considering the complexities of large-scale implementations or integration into business operations [2]. The existing studies often limit the methods to isolated case evaluations or theoretical models. Additionally, the body of literature has limited comparative analysis of drone efficiency versus traditional trucks, particularly in rural regions with pronounced logistical challenges. Consequently, there is a need for comprehensive, real-world applications that evaluate the broader impact of AAM on large-scale pharmaceutical distribution networks.
This study aims to address these gaps by providing a comprehensive evaluation of AAM for pharmaceutical transport in ND. In so doing, this research contributes to the growing body of literature on the practical applications of AAM in logistics. It aims to substantiate the viability of drones in transforming pharmaceutical supply chains, offering insights that can inform policy and guide future research and implementation efforts.
3. Methodology
The authors selected ND for this case study due to its rural characteristics and its unique status as the only state approved by the Federal Communications Commission (FCC) for evaluating BVLOS drone operations across the entire state. Furthermore, this research considered all public use airports in ND as candidates for AAM deployments, leveraging existing infrastructure for multimodal freight transfers. A NASA study further justified this strategy by reporting that only 0.6% of airport hubs service 70% of domestic air travel, leaving most of the smaller airports underutilized [3].
3.1. Data Sources
Table 1 provides the details of the datasets utilized in this study.

Table 1.
Dataset details.
The geometric data of roads from the Highway Performance Monitoring System (HPMS) represent the extent of U.S. roadways [28]. The airport database provided the location of all official U.S. operational aerodromes [29]. The places dataset provided a polygon representation of all the populated places identified by the U.S. Census Bureau [30]. The hospitals dataset from the U.S. Homeland Infrastructure Foundation-Level Data (HIFLD) provided the location and type of all major U.S. hospitals [31]. The commodities dataset from version 5.6 of the United States Department of Transportation, Bureau of Transportation Statistics (BTS), freight analysis framework (FAF) provided origin-destination (OD) data about the multimodal movement of various freight commodities, including pharmaceuticals [33].
3.2. GIS and Optimization
The following is an overview of the steps employed to develop the GIS-based optimization framework:
Data sources: The framework utilized the various datasets described in the previous section, including road networks from the Highway Performance Monitoring System (HPMS), airport locations from the U.S. Department of Transportation Bureau of Transportation Statistics (BTS), populated places from the ESRI USA Census Populated Places database, and hospitals from the Homeland Infrastructure Foundation-Level Data (HIFLD).
Data processing: The GIS processed road network data by combining linear road objects with the same route identifier using a spatial dissolve procedure, followed by a spatial snapping procedure to remove overlapping segments and reconnect road intersections. The GIS mapped hospital and airport locations and snapped them to the road network representation. Additional procedures identified population centroids and snapped them to the road network.
Optimization algorithms: After computing origin-destination (OD) matrices, optimization procedures identified the shortest paths between all combinations of places, hospitals, and airports. The optimization framework minimized the overall drive time between these points using binary decision variables to assign each hospital to exactly one airport. The framework then merged these distance-optimized links with the original OD links to display the optimized routes on a map.
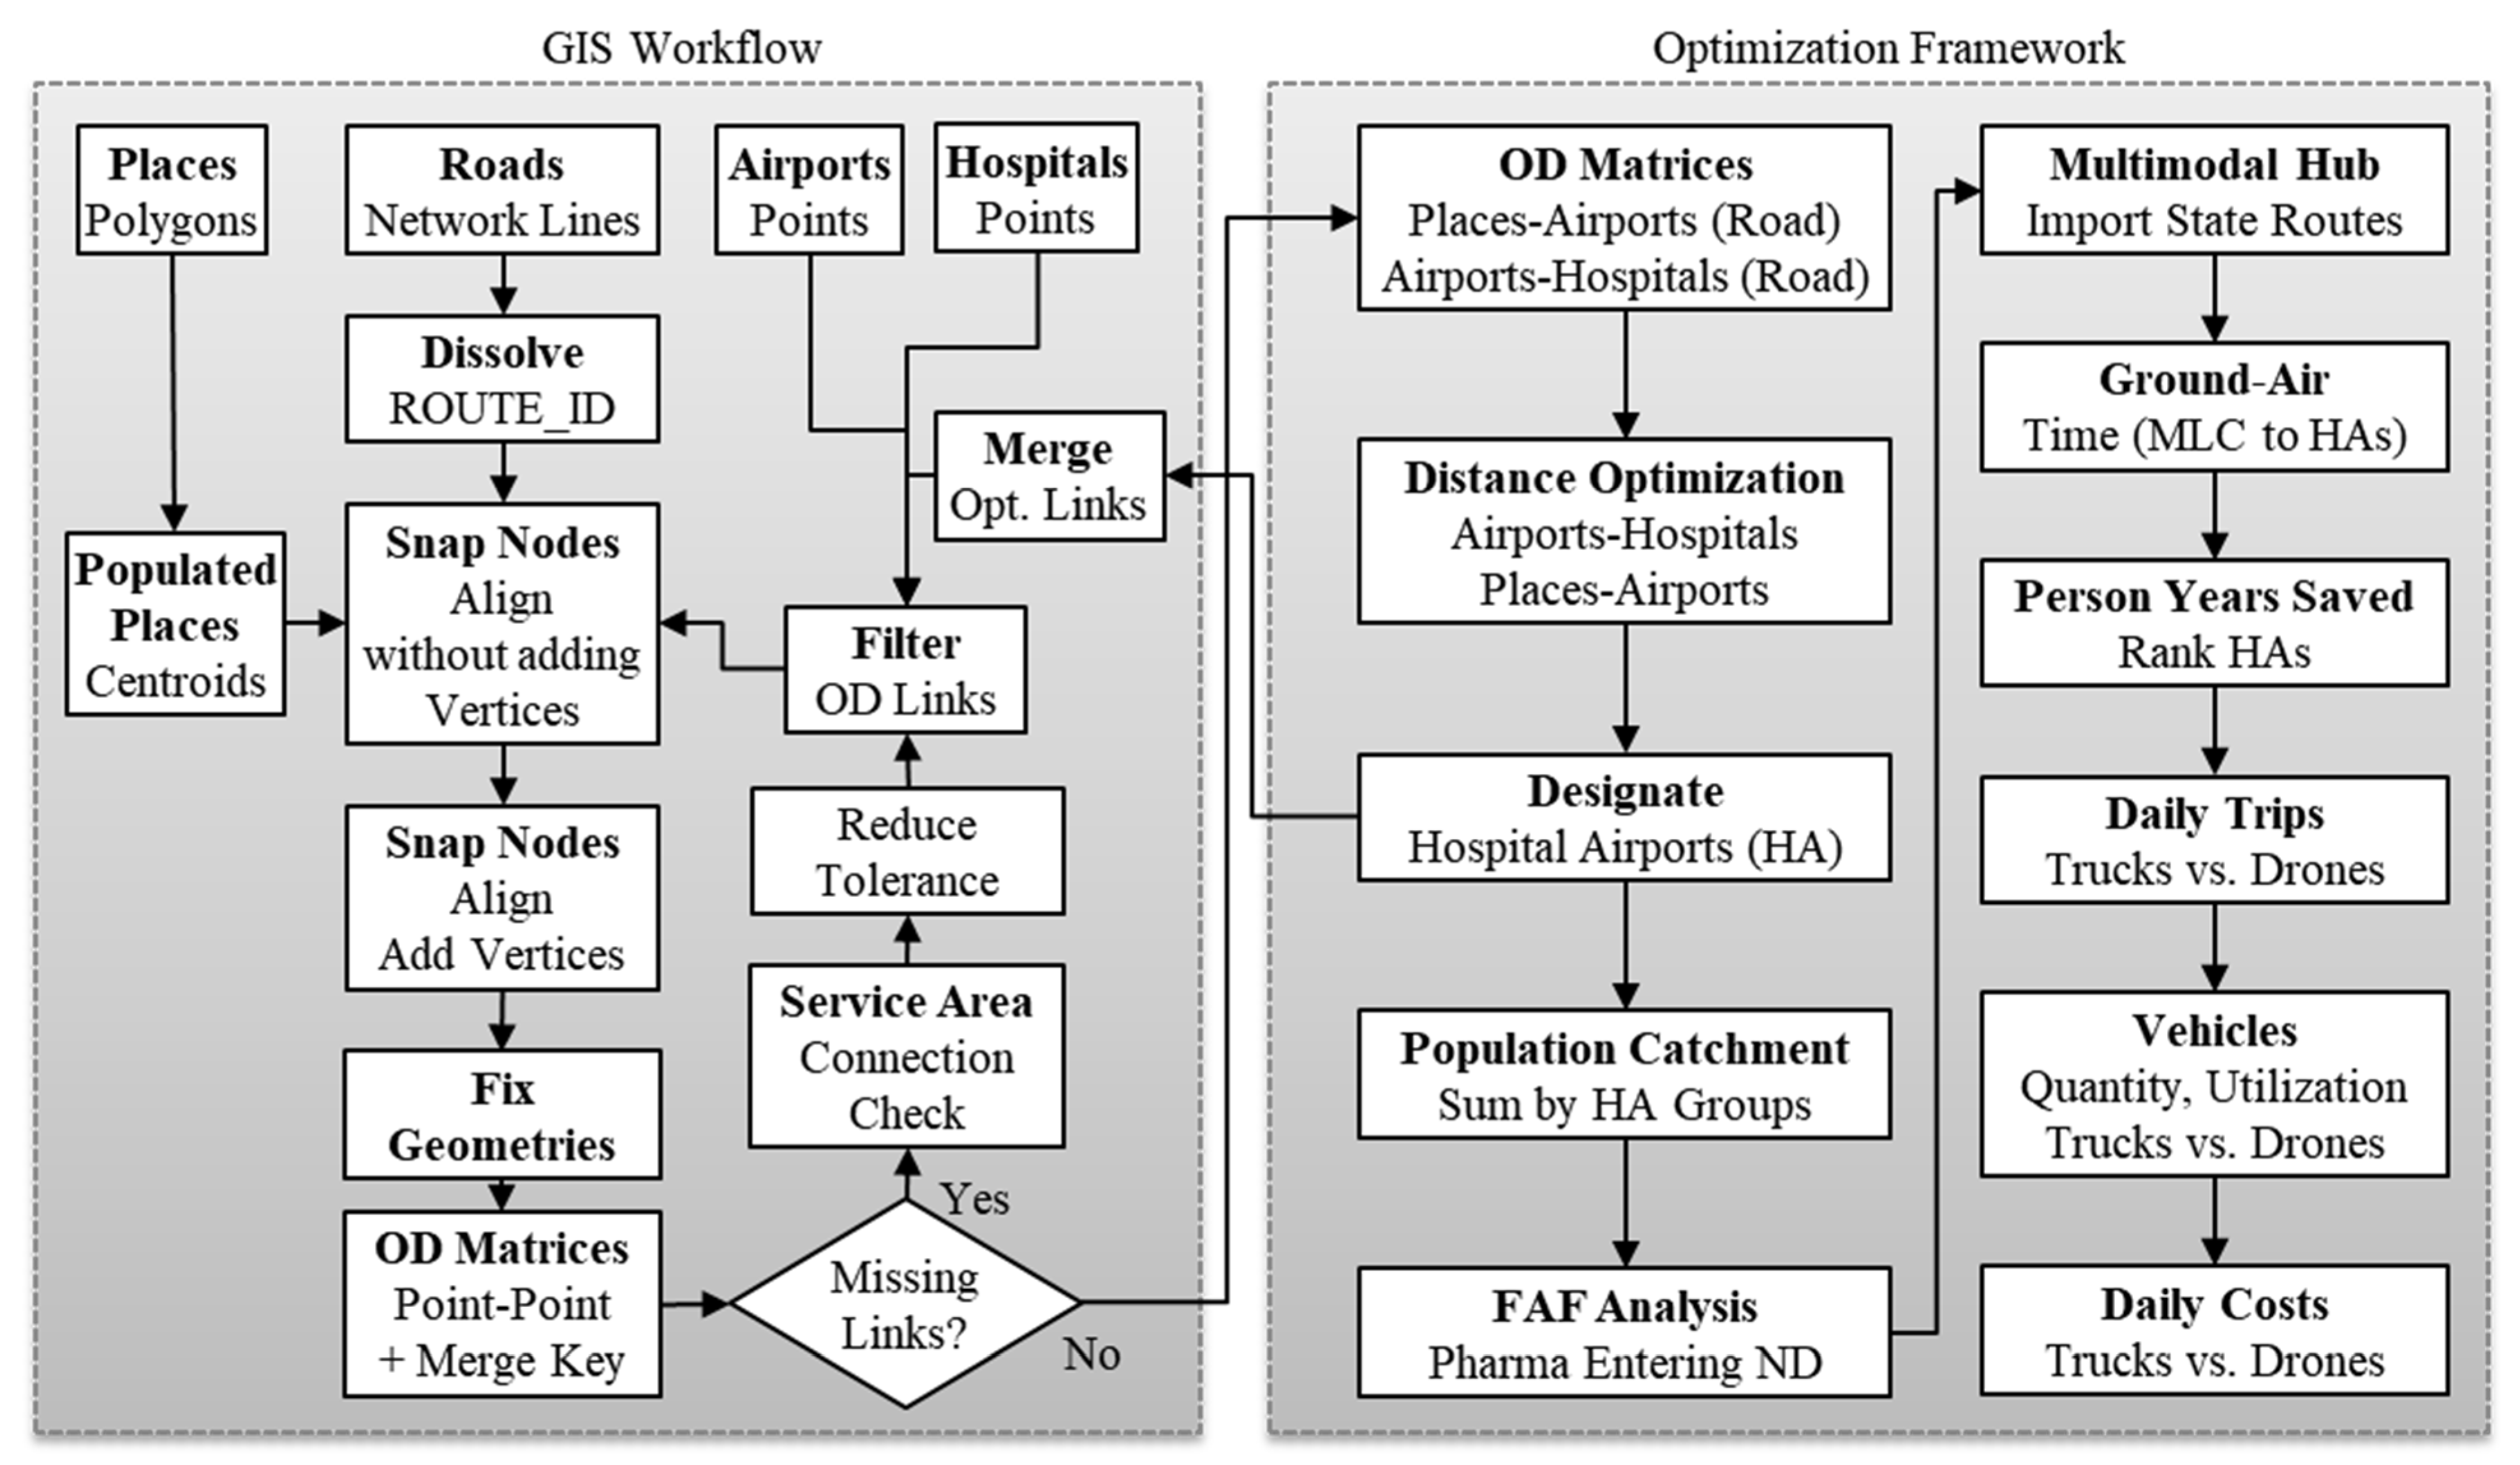
Figure 1 shows the procedures of the GIS workflow and optimization framework developed in this study. The GIS workflow employed version 3.36.6 of the open-source QGIS software [34]. The workflow extracted the ND road network data from the HPMS database.

Figure 1.
The GIS workflow and optimization framework.
To reduce the data size, the framework employed a spatial dissolve procedure to combine linear road objects with the same route identifier, resulting in a factor of 15 reduction in the number of spatial objects to process. The workflow then used a GIS spatial snapping procedure to remove any overlapping line segments from the dissolved segments and to add vertices that reconnected road intersection representations that the dissolve feature had disconnected. The workflow imported the hospital points dataset into a GIS layer to map the location of all 44 hospitals, and then spatially snapped those locations to the road network representation. Similarly, the workflow imported the airport points dataset into a GIS layer and snapped the location of all 89 airports to the road network representation. Additionally, the workflow imported the populated places polygon dataset, identified the centroid of the 406 populated ND places, and snapped those centroids to the road network representation.
After creating the GIS representation consisting of places, hospitals, and airports on the road network, there was no guarantee that a shortest path algorithm would find all traceable routes that connect them. The strategy to assure full network connectivity was to create shortest path OD matrices between all combinations of points representing places, hospital, and airports while evaluating their routes for missing connections. The OD matrix calculation employed the QNEAT3 plugin of QGIS to calculate the shortest path between all point combinations, ignoring spatial gaps of a specified length tolerance. When the condition check for missing links identified inaccessible points, a GIS service area calculation from these points identified the specific location on the network containing a gap that disconnected the road network representation. Subsequently, adjusting the gap tolerance struck a balance between ignoring short gaps and closely following the linear segments to accurately calculate distances along the shortest paths.
The analytical framework portion of the workflow employed one OD matrix between airports and hospitals and another between places and airports. These were inputs to an optimizer that minimized the overall drive time between those points. The formulation for the first optimization was as follows:
- I: set of hospitals, indexed by i
- J: set of airports, indexed by j
- cij: total cost (road network distance) of assigning hospital i to airport j
- xij: binary decision variable that equals 1 if the optimizer assigns hospital i to airport j, and 0 otherwise
Hence the optimization problem was to minimize the total network assignment cost (distance) as follows:
Minimize:
Subject to:
The constraint indicated after “Subject to:” ensured that the optimizer assigned each hospital to exactly one airport. The “Designate” procedure identified those airports as hospital airports (HAs) and the remainder as non-hospital airports (NHAs). The optimizer output was a list of the OD links that minimized the total assignment cost. The “Merge Opt. Links” function merged these distance-optimized links with the original OD links of the GIS workflow, removing those not merged to display the optimized routes on a map. A unique identifier added to each row of the OD matrices served as a key to facilitate the merge operation using the “join by field” GIS procedure.
The second route optimization minimized the total network distance from each populated place to an HA, ensuring that only one HA served each place. This part of the methodology aimed to identify (a) the population catchment (PC) for a hospital and its nearby healthcare facilities and (b) the distribution of distances for last-mile deliveries between the HA and population centers. This study further developed a metric—person years saved (PYS)—to rank the potential impact of replacing traditional truck routes with air cargo routes. PYS is the product of the PC and the time difference between truck and drone transport.
3.3. Logistical Center Placement
This study proposed establishing a multimodal logistical center (MLC) to transfer cargo entering the state between trucks and drones for middle-mile delivery to the identified HAs that represent pharmaceutical demand centers. The following is an overview of the steps used to determine the optimal locations for logistical centers and transport routes:
Logistical center identification: Following the data collection, GIS model preparation, and the optimization framework involving OD matrices, the workflow identified potential locations for multimodal logistical centers (MLCs) by analyzing the freight flow estimates and the proximity to key entry points for pharmaceutical shipments. The authors selected the closest airport to these entry points as the optimal location for the MLC, leveraging existing infrastructure to enhance logistical efficiency.
Route optimization: The GIS generated optimized routes by merging distance-optimized links with the original OD links, ensuring the use of the shortest paths for transport. The analysis then evaluated these routes based on travel time and cost to determine the most effective transport strategies.
PYS metric: To rank the potential impact of drone deployments, the study developed a PYS metric, which calculated the time saved by replacing traditional truck routes with drone transport. This metric helped prioritize the implementation of AAM technologies in regions with the highest potential for healthcare improvements.
The freight flow method identified the quantity of pharmaceuticals entering the state by extracting from the FAF dataset the 2030 forecast for truckloads of the commodity arriving in ND. Subsequently, estimating the quantity of pharmaceuticals to transport from the MLC to each HA was based on a weight equal to its PC proportion of the state’s total population.
The framework then ranked the state origins of these pharmaceuticals by weight, identifying the top origins to assess their primary direction of arrival into the state. Subsequently, the GIS analysis identified the closest airport to those entry points as an ideal location to establish the MLC. One scenario previously suggested was that by 2030, carriers can use autonomous trucks to bring products to the MLC. Handlers can then then use automated yard equipment to transfer cargo from the autonomous trucks to appropriately sized drone cargo pods for air transport to each HA [35]. Subsequently, last-mile delivery options can be either via drones or trucks to their final destination at population centers, hospitals, or nearby healthcare facilities.
Table 2 provides a summary of the specific parameters used in the optimization framework, with detailed justifications and derivations. The optimization framework calculated the shortest truck and air routes from the MLC to each HA. Air routes specified the shortest geodesic flight paths, which are often shorter than routes along the roadways. The estimated time for road trips utilized the average speed limit of 40 miles per hour, derived from the HPMS, for traversals along the shortest path truck routes. This speed is also consistent with the average truck speed of 40.33 miles per hour reported by the American Transportation Research Institute (ATRI) [36]. The estimated number of daily truck trips (DTT) was based on the 8000-pound capacity of a small, refrigerated box truck that is suitable for pharmaceutical transport [36]. The operator shown in the calculation for DTT in Table 2 is the ceiling function that rounds up a decimal to its nearest integer. That is, the ceiling function produced a full vehicle trip when PWD/TC or PWD/DC was fractional.
Table 2.
Logistical indicators of the analysis.
The estimated flight time was based on a common heavy-lift cargo drone specification of 100 miles per hour, carrying a maximum payload of 0.5 ton [37]. The estimated flight time included any intermediate stops required to charge a battery when using a fully electric aircraft such as an eVTOL. The framework also calculated the required number of vehicles (truck or drone) and the number of daily trips required. Finally, the framework calculated the annual utilization per drone for comparison with the average annual utilization of small cargo aircraft utilized for regional transport.
4. Results
The subsections that follow discuss the results of the freight flow estimates, the GIS optimization for the shortest truck and air routes, the PYS, the estimated transport cost comparison, and the aircraft average annual utilization rate.
4.1. Freight Flow Estimates
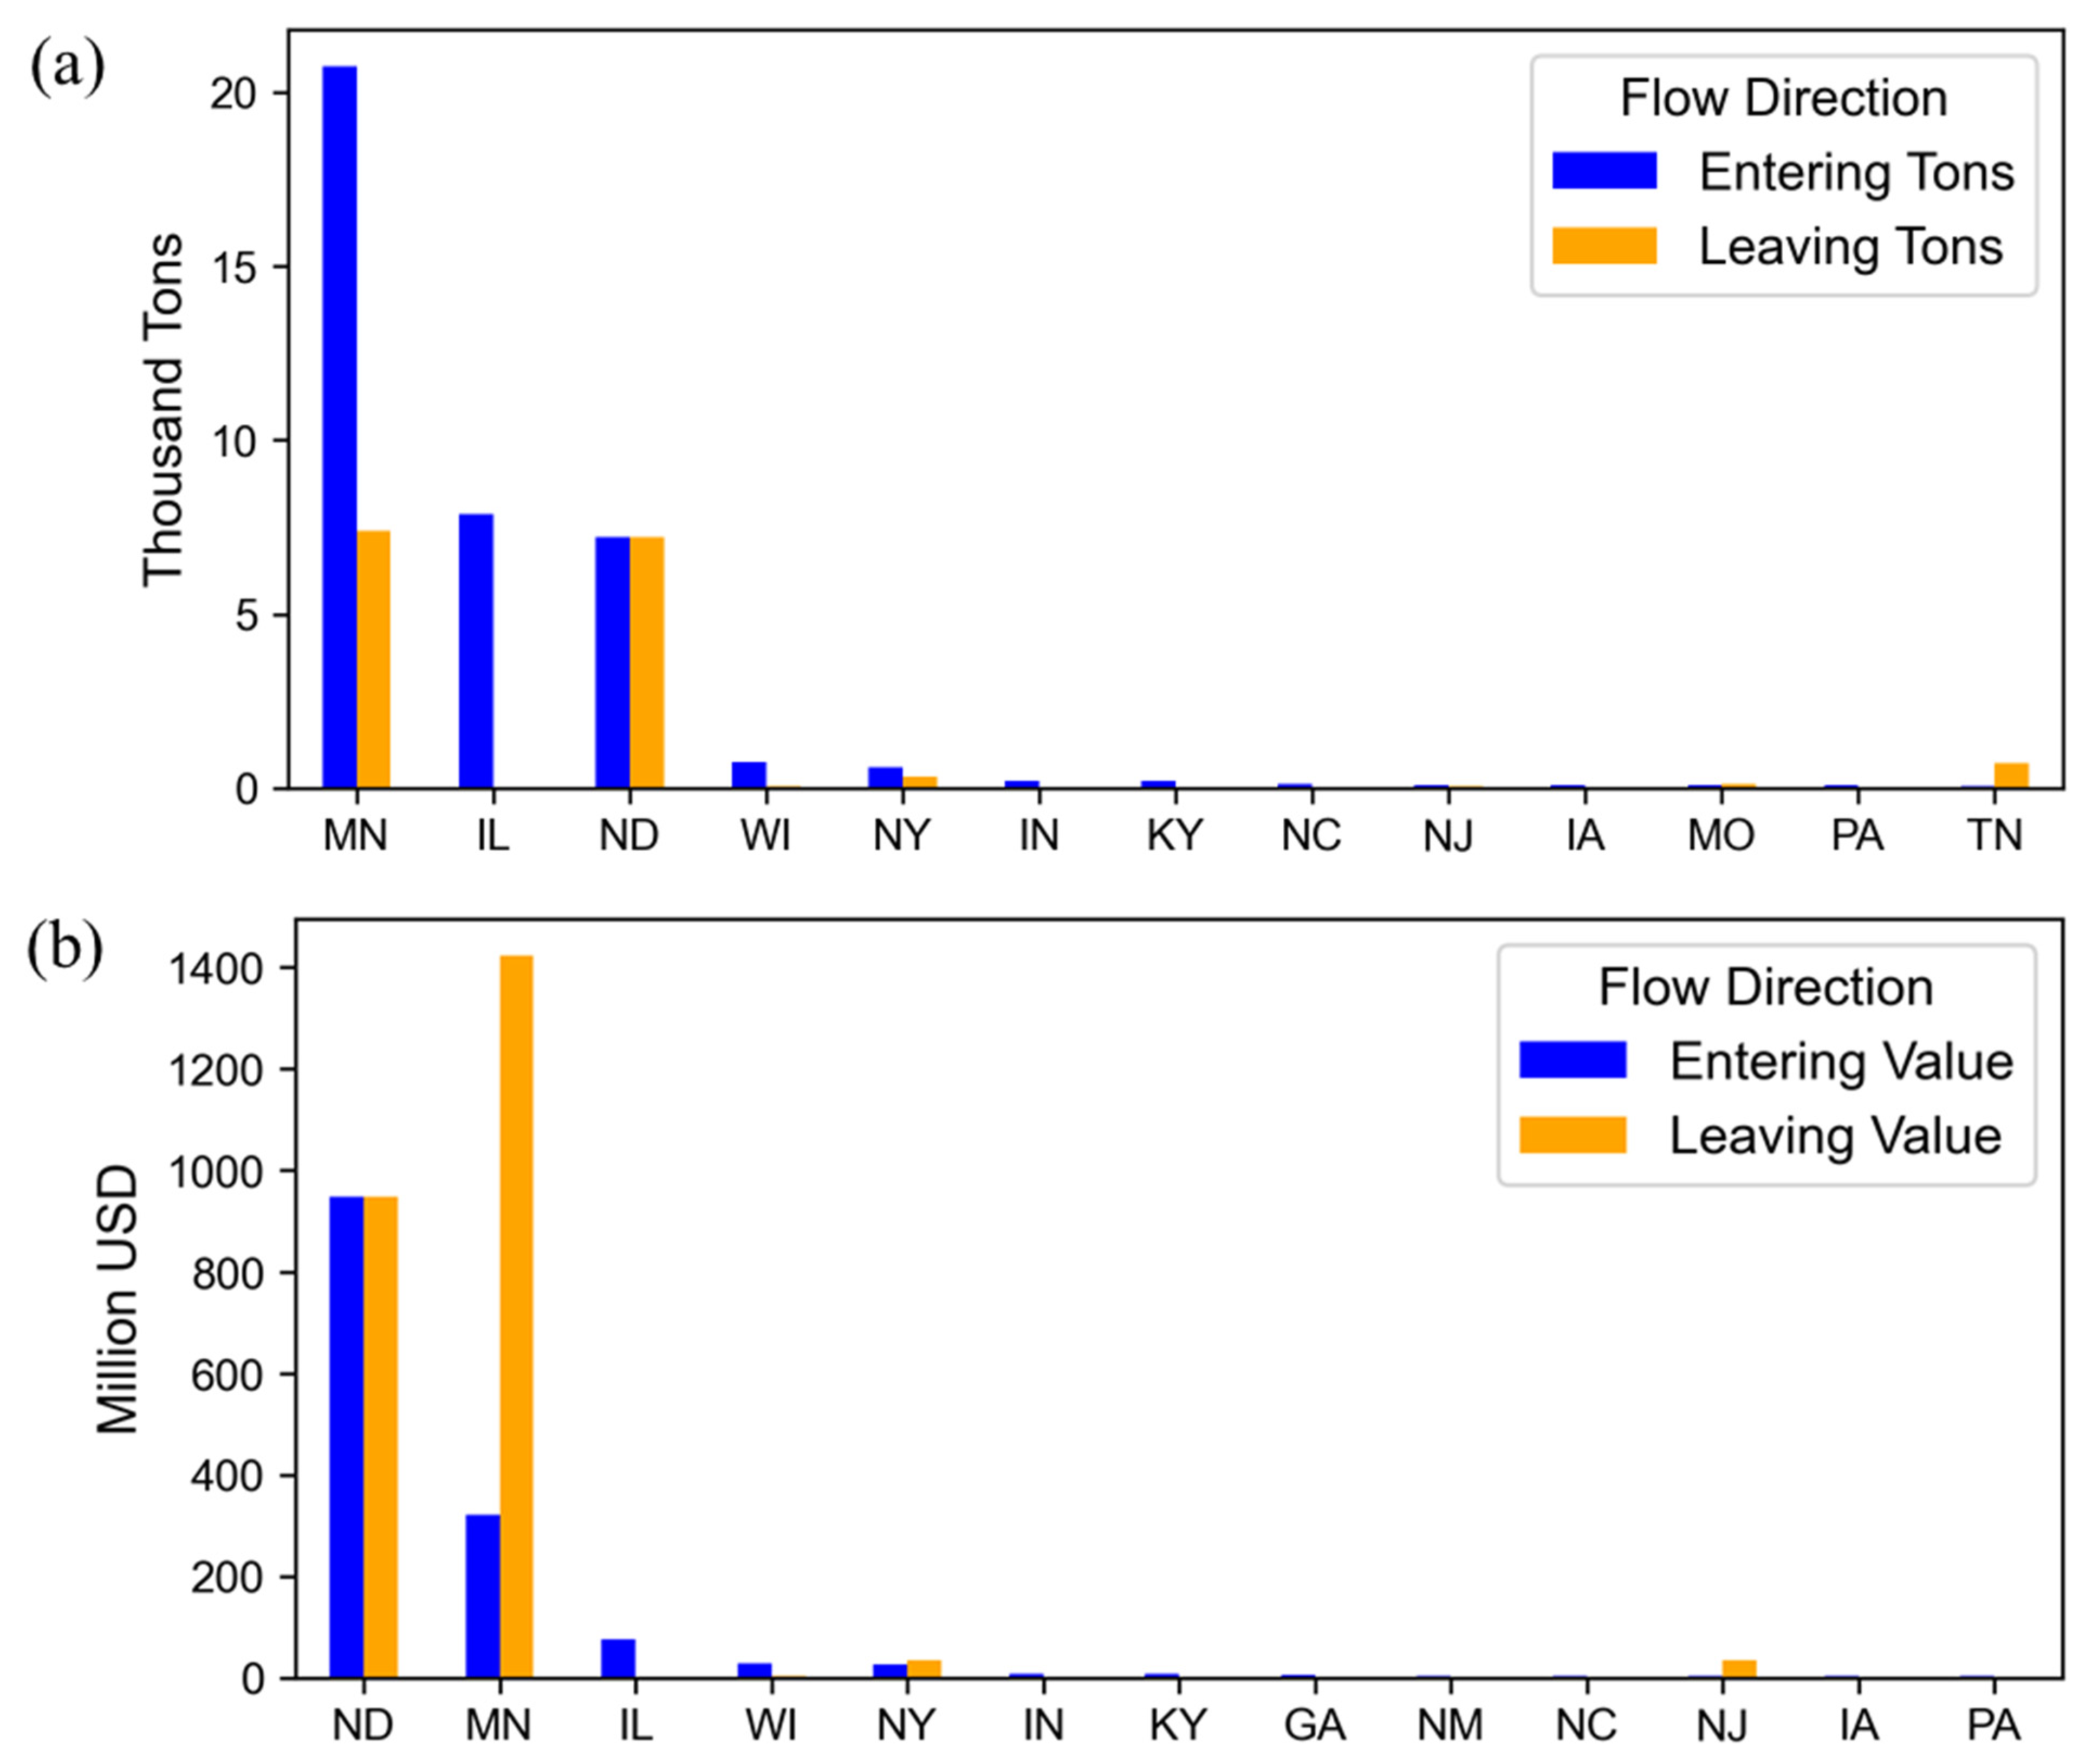
Table 3 summarizes the top 10 origin states by weight in tons and associated value in millions of U.S. dollars of pharmaceuticals forecasted to enter ND in 2030. Figure 2 visualizes the data in Table 3, which shows that freight flows from Minnesota and Illinois will dominate. The GIS analysis indicated that arrivals from those states would be via truck routes east of ND, with an entry point near Wahpeton, ND. The closest airport to that location was Harry Stern Airport, representing an ideal location to establish the MLC. The table entry shown for ND as both the origin and destination represent interstate-only transport. Hence, the total weight and value of pharmaceuticals estimated to enter ND in 2030 is 31.1 thousand tons and $506.1 million, respectively. In contrast, the total weight and value of pharmaceuticals estimated to leave ND in 2030 is 8.9 thousand tons and $1.9 billion, respectively. Hence, even though the weight estimated to leave is 71% less than the weight estimated to enter, the estimated value is 3.8 times higher. This suggests that ND will add value to the imported pharmaceuticals before exporting them. Additional evidence of a value-add operation is that even though the weight of interstate movements will be 23% that of the weight estimated to enter and 81% that of the weight estimated to leave, the value of the interstate movements was 1.9 times more than the value estimated to enter. This suggests that much of the interstate transport would consist of value-added or transformed pharmaceuticals. The estimate that the value of interstate movements will be 49% that of the estimated value leaving also supports the value-add observation. These observations align with the fact that ND hosts several companies that provide manufacturing services for the biotechnology industry, where the final products have much more value than their imported raw materials [38].
Table 3.
Weight and value by origin and destination states.
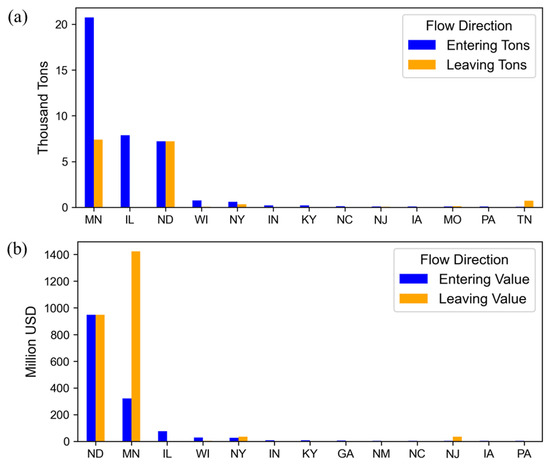
Figure 2.
Pharmaceuticals entering and leaving ND by (a) weight and (b) value.
4.2. GIS Route Optimization
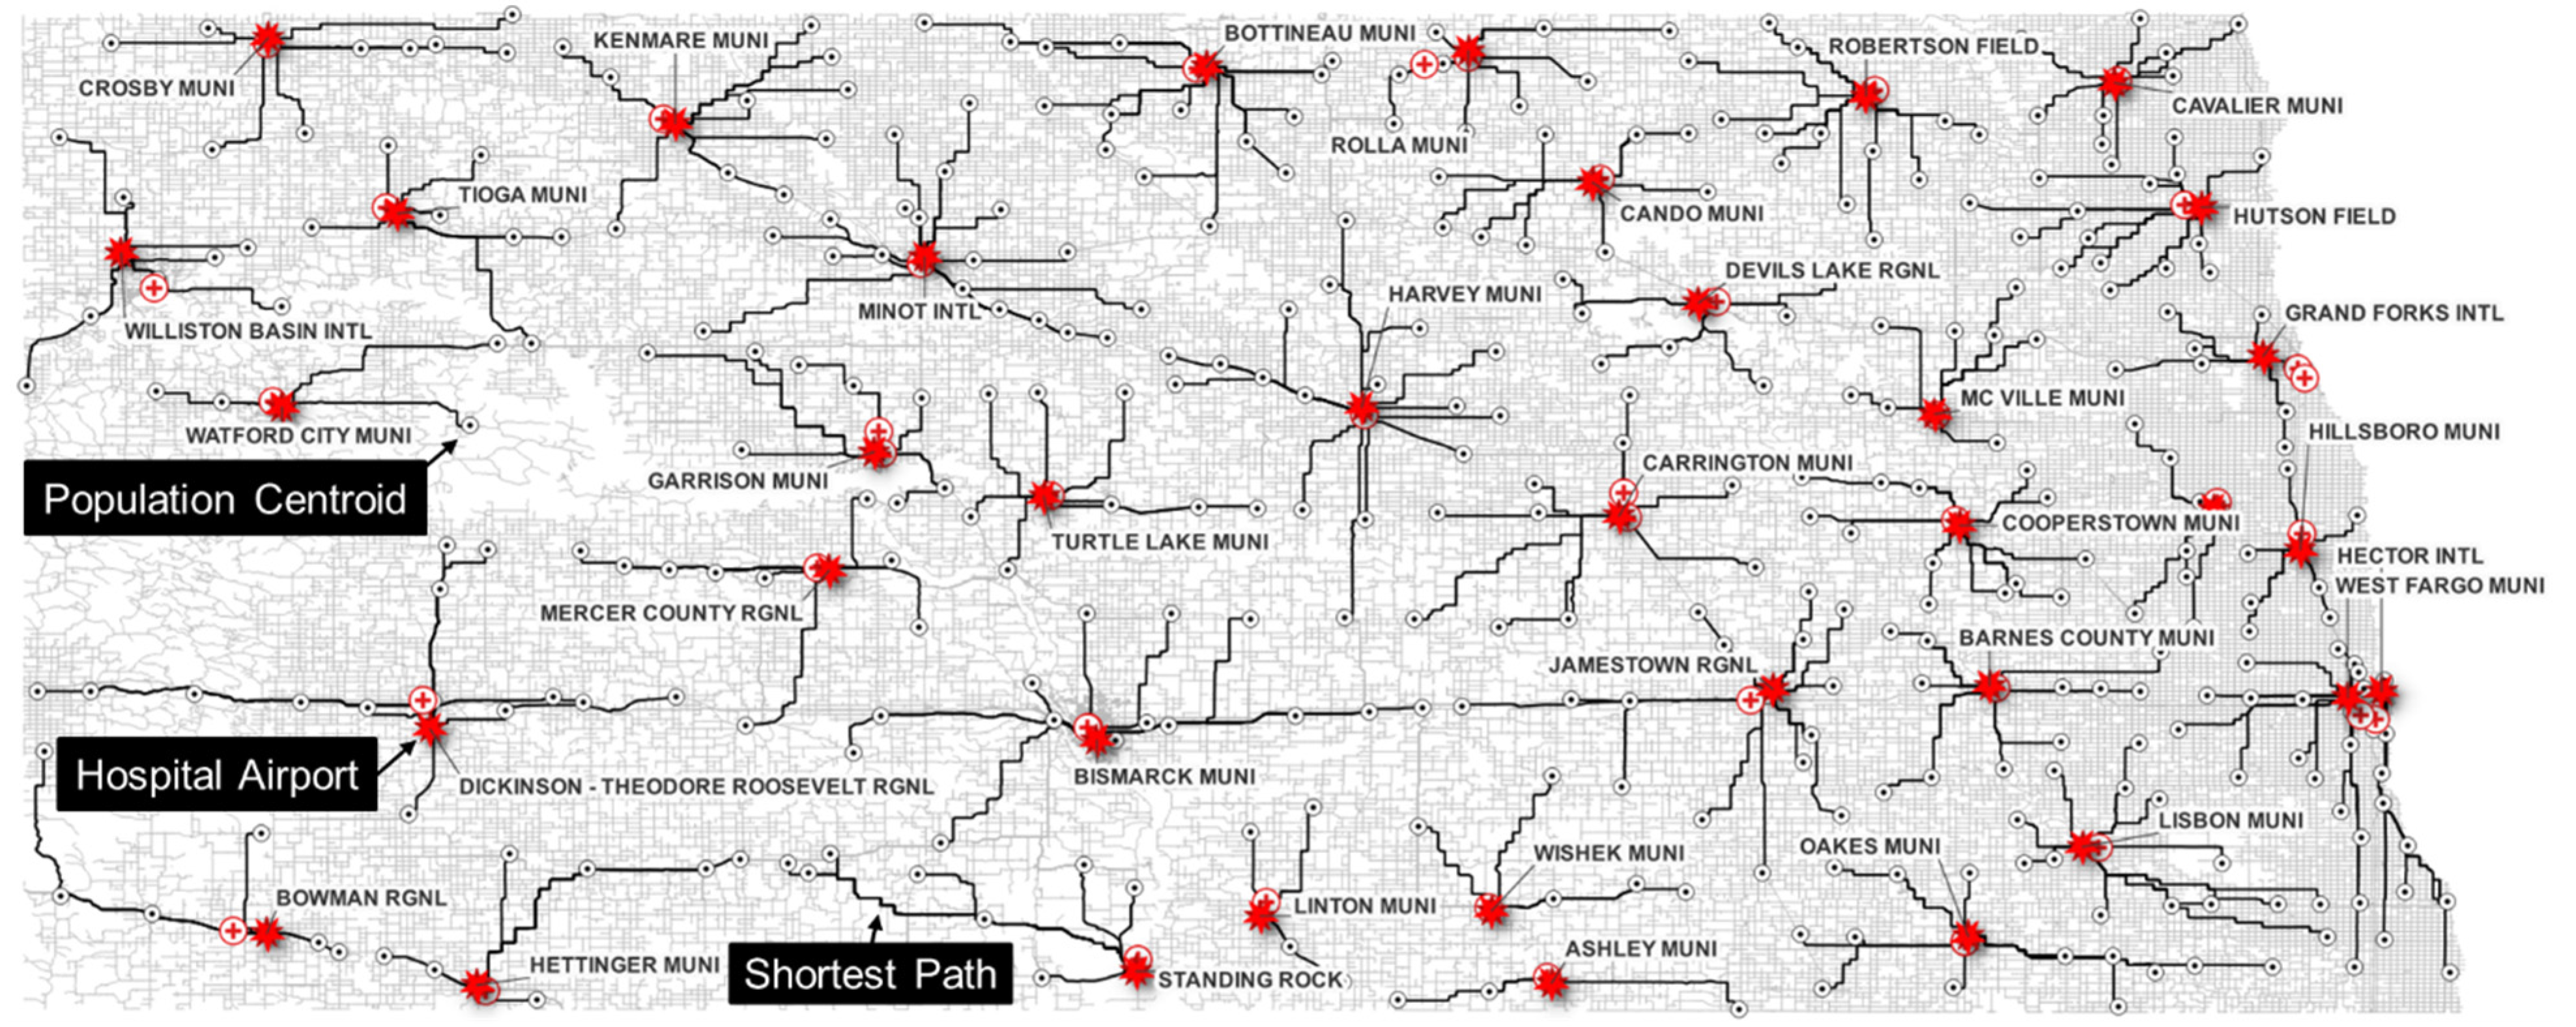
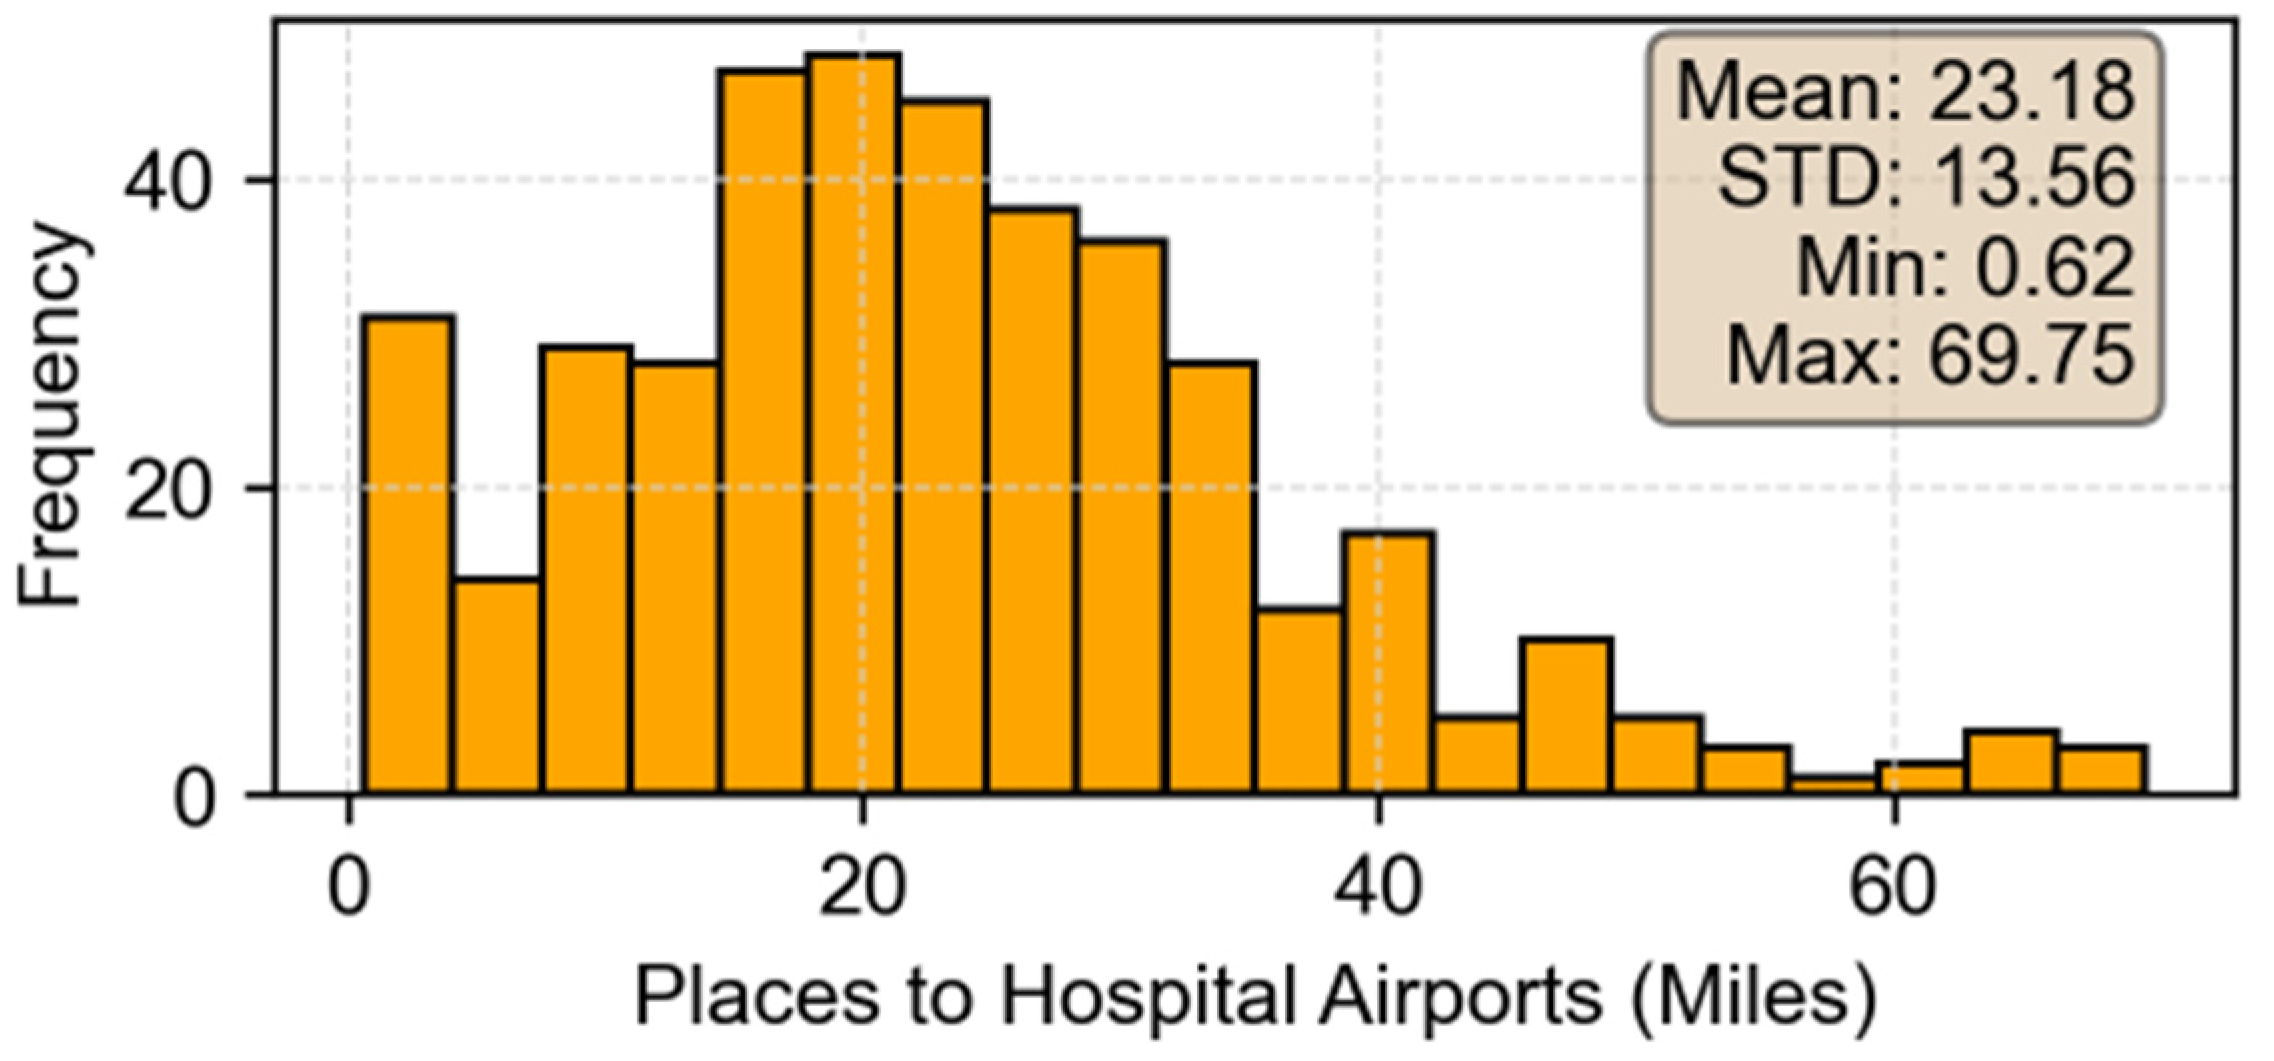
Figure 3 shows the shortest paths (dark lines) between population centroids and hospital airports on the road network. The lighter lines represent the remainder of the ND road network. The labels indicate the name of the designated HAs. The plus signs next to HAs are the hospital locations. Visualizing the routes on a map affirms that they constitute the shortest paths between HAs and their assigned population centroids. Last-mile package delivery trucks may take these paths, while last-mile package delivery drones will take more direct flight routes. Figure 4 shows the corresponding distance distribution for these routes. The mean distance is 23.18 miles with a standard deviation (STD) of 13.56 miles. The mean distance is well within the round-trip capability of large package delivery drones currently in development [2]. The distance spread from less than one mile (0.62 mile) to approximately 70 miles (69.75 miles) is characteristic of the state’s mostly rural setting.
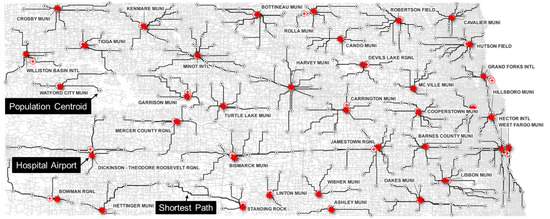
Figure 3.
Shortest paths between population centroids and hospital airports.

Figure 4.
Distribution shortest path road distances between population centroids and HAs.
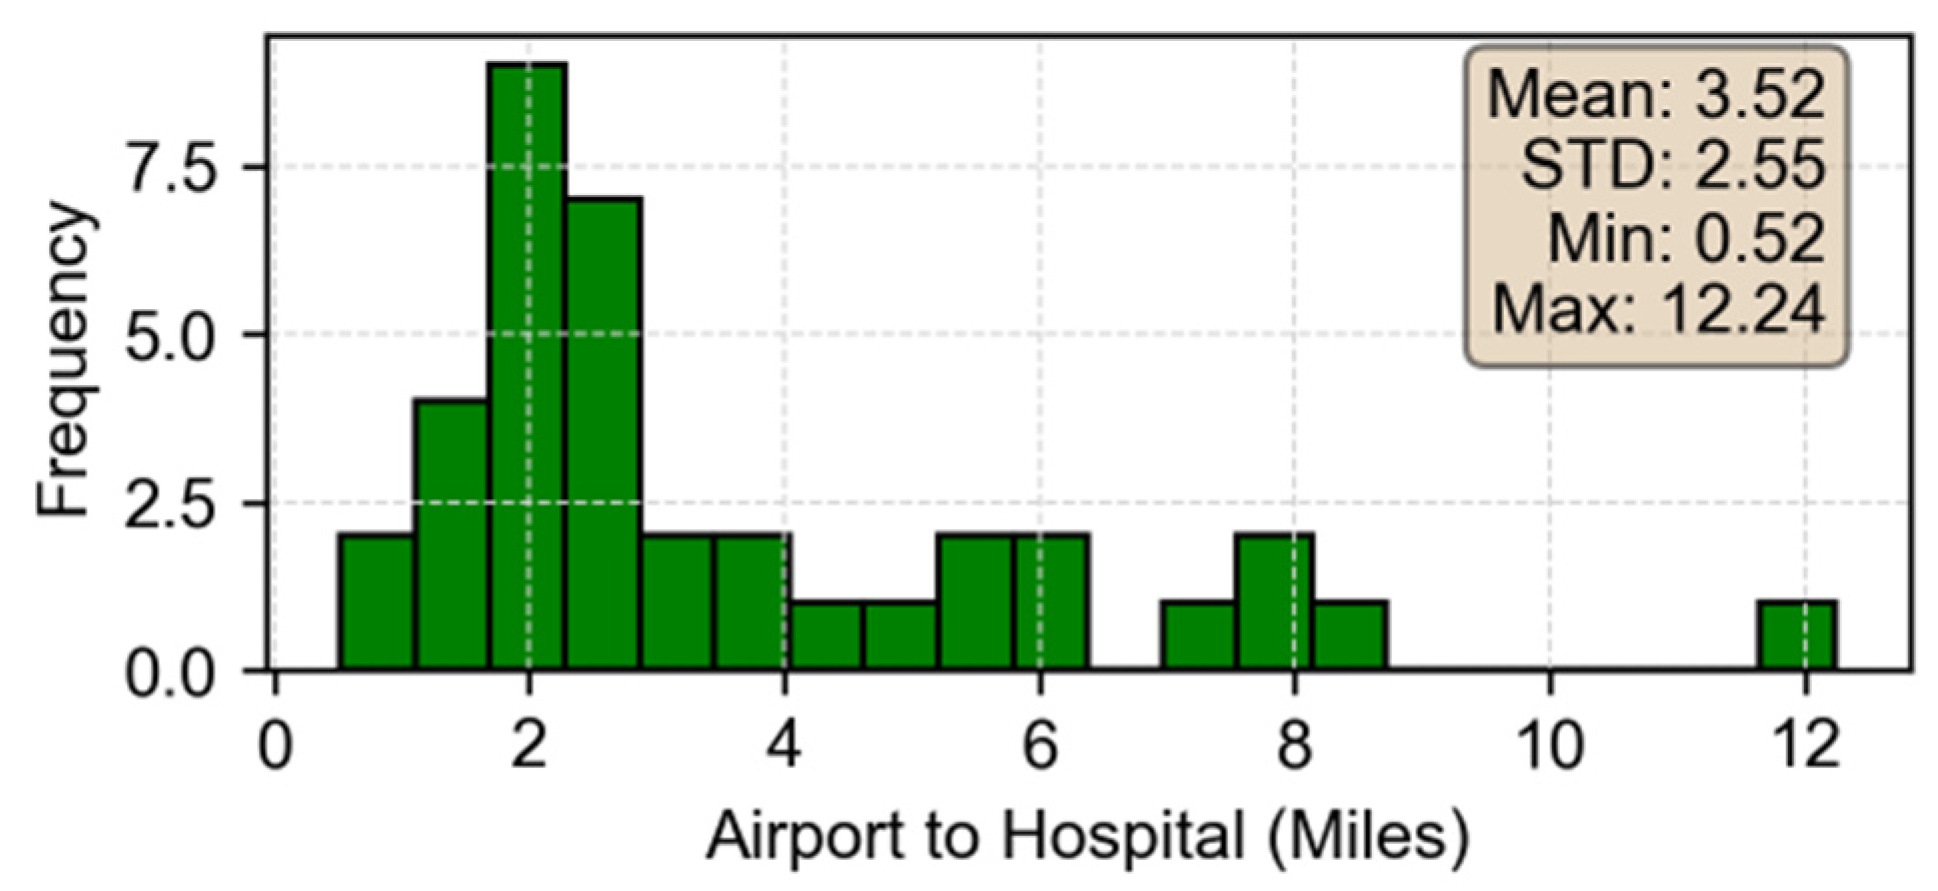
Table 4 summarizes the hospitals that each airport serves in the distance optimization, the average distance in miles (AHM) between the airport and the hospitals, the number of hospitals served (H), the population catchment (PC), and the number of populated places (P) served. Figure 5 shows the distribution of drive miles between hospitals and their closest airport. The mean distance is 3.5 miles with a standard deviation of 2.6 miles, representing fairly short trips to and from demand centers. The PC of the six top HAs, ranked by PYS, accounts for 69% of the ND population. The airports in these six locations also provide commercial flights to domestic and international destinations by major commercial airlines, including American, Allegiant, Delta, Frontier, and United Airlines [39]. Therefore, pharmaceuticals arriving by air at these airports provide additional opportunities to synergize with last-mile transport to and from their respective demand centers.
Table 4.
Hospitals served by the airports, drive distances, and population catchment.

Figure 5.
Distance distribution of trips between HAs and the hospitals they service.
4.3. Person Years Saved
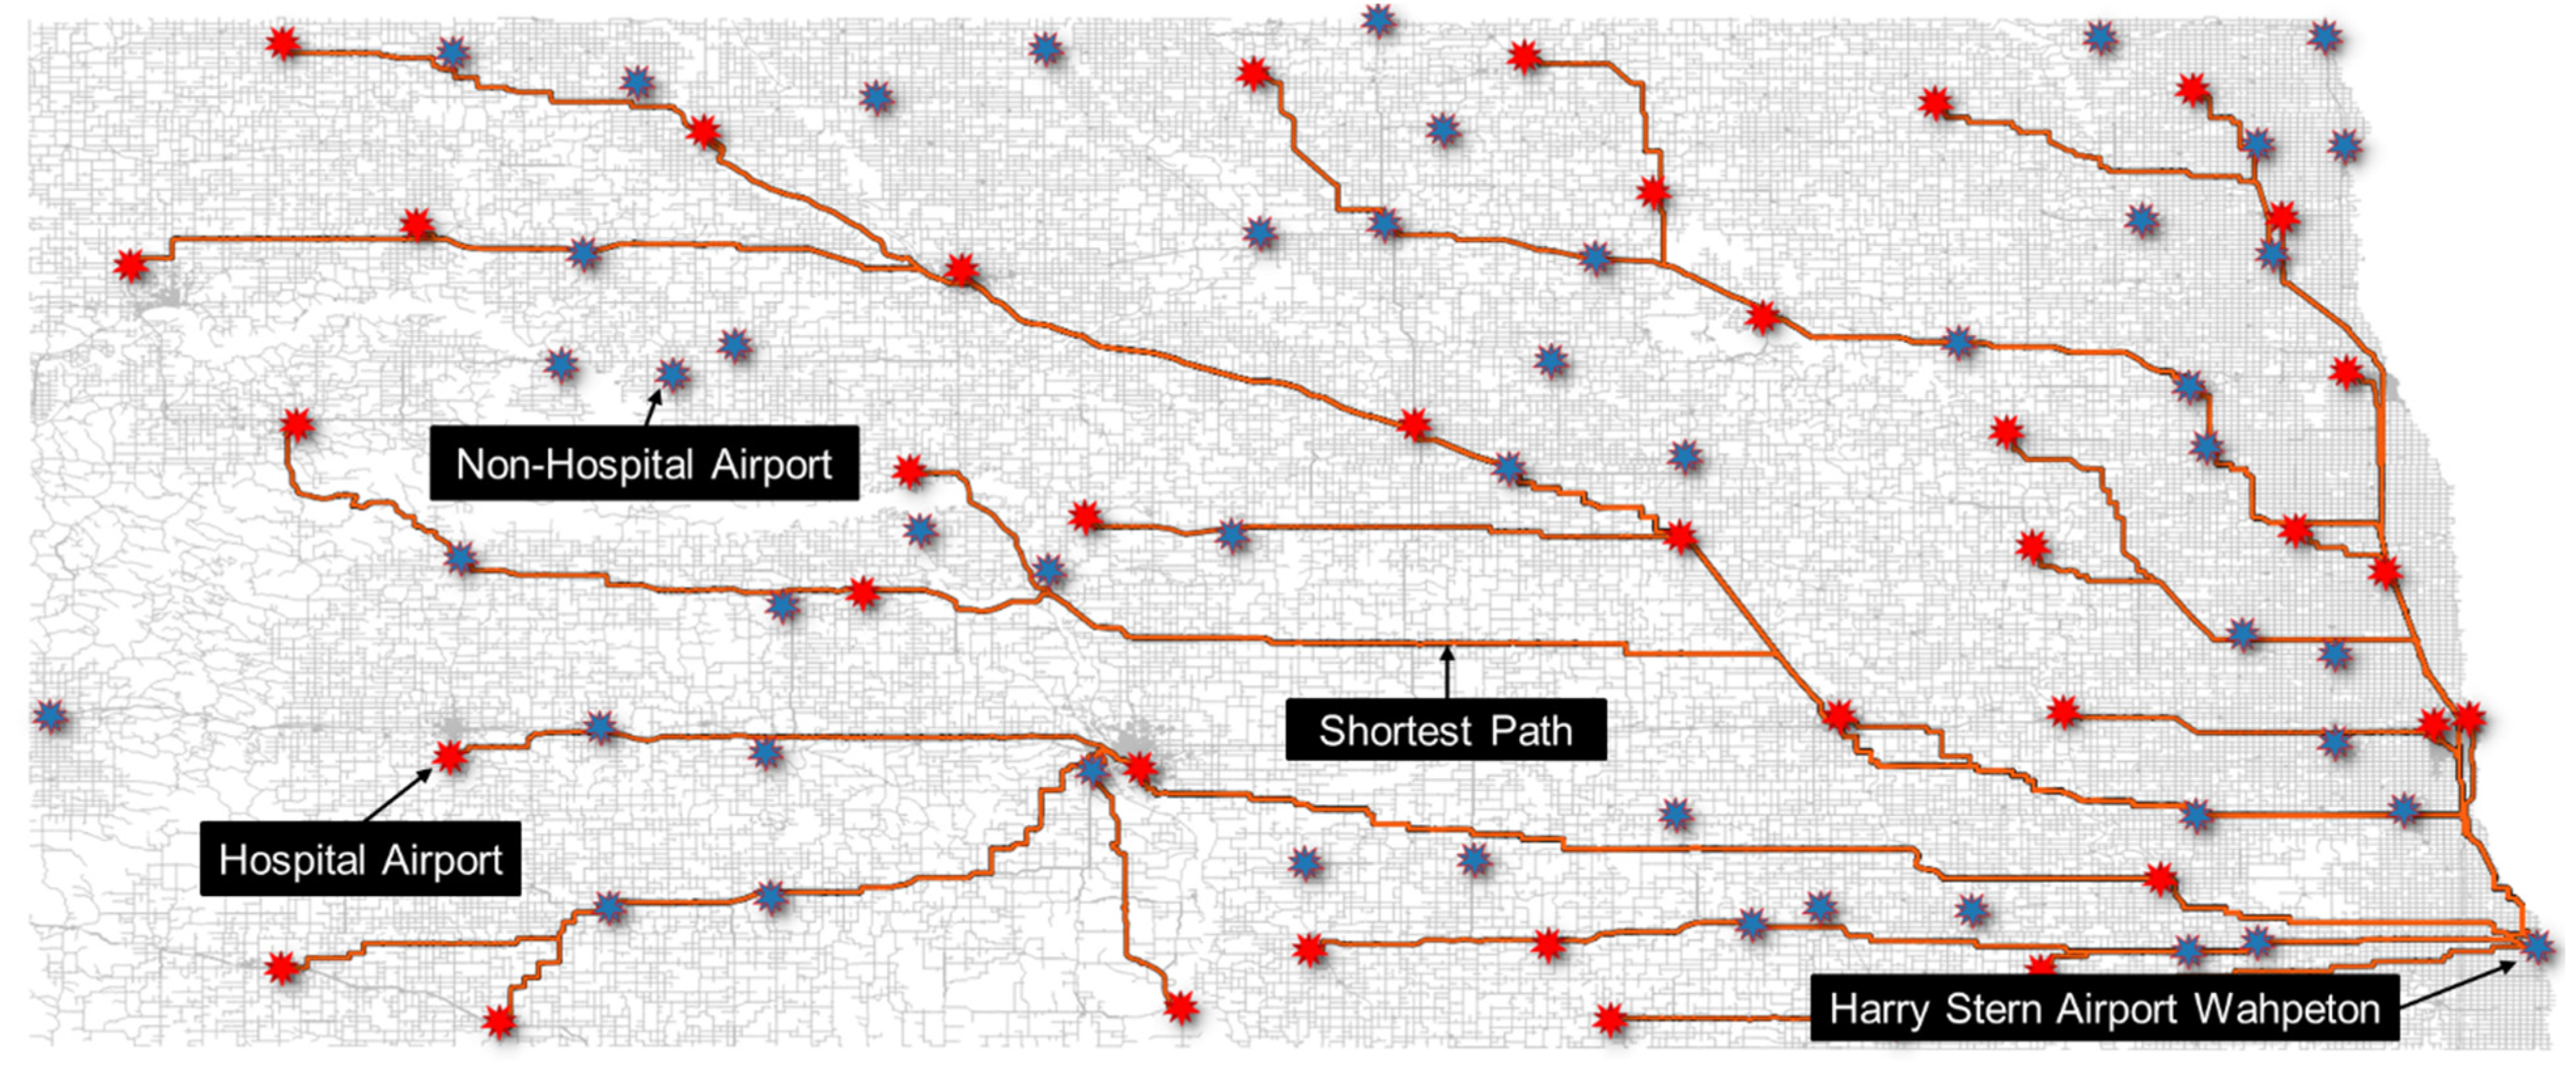
Figure 6 shows the shortest truck routes from the MLC at or near Harry Stern Airport to each of the HAs. It is evident that for the longest routes there are intermediate airports where an aircraft can stop to recharge.
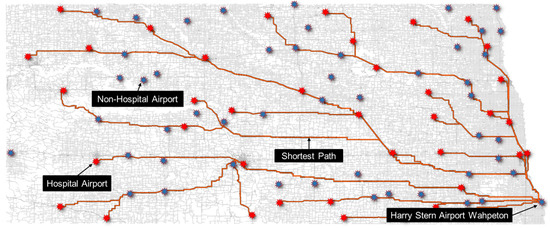
Figure 6.
Shortest truck routes from the MLC to each HA.
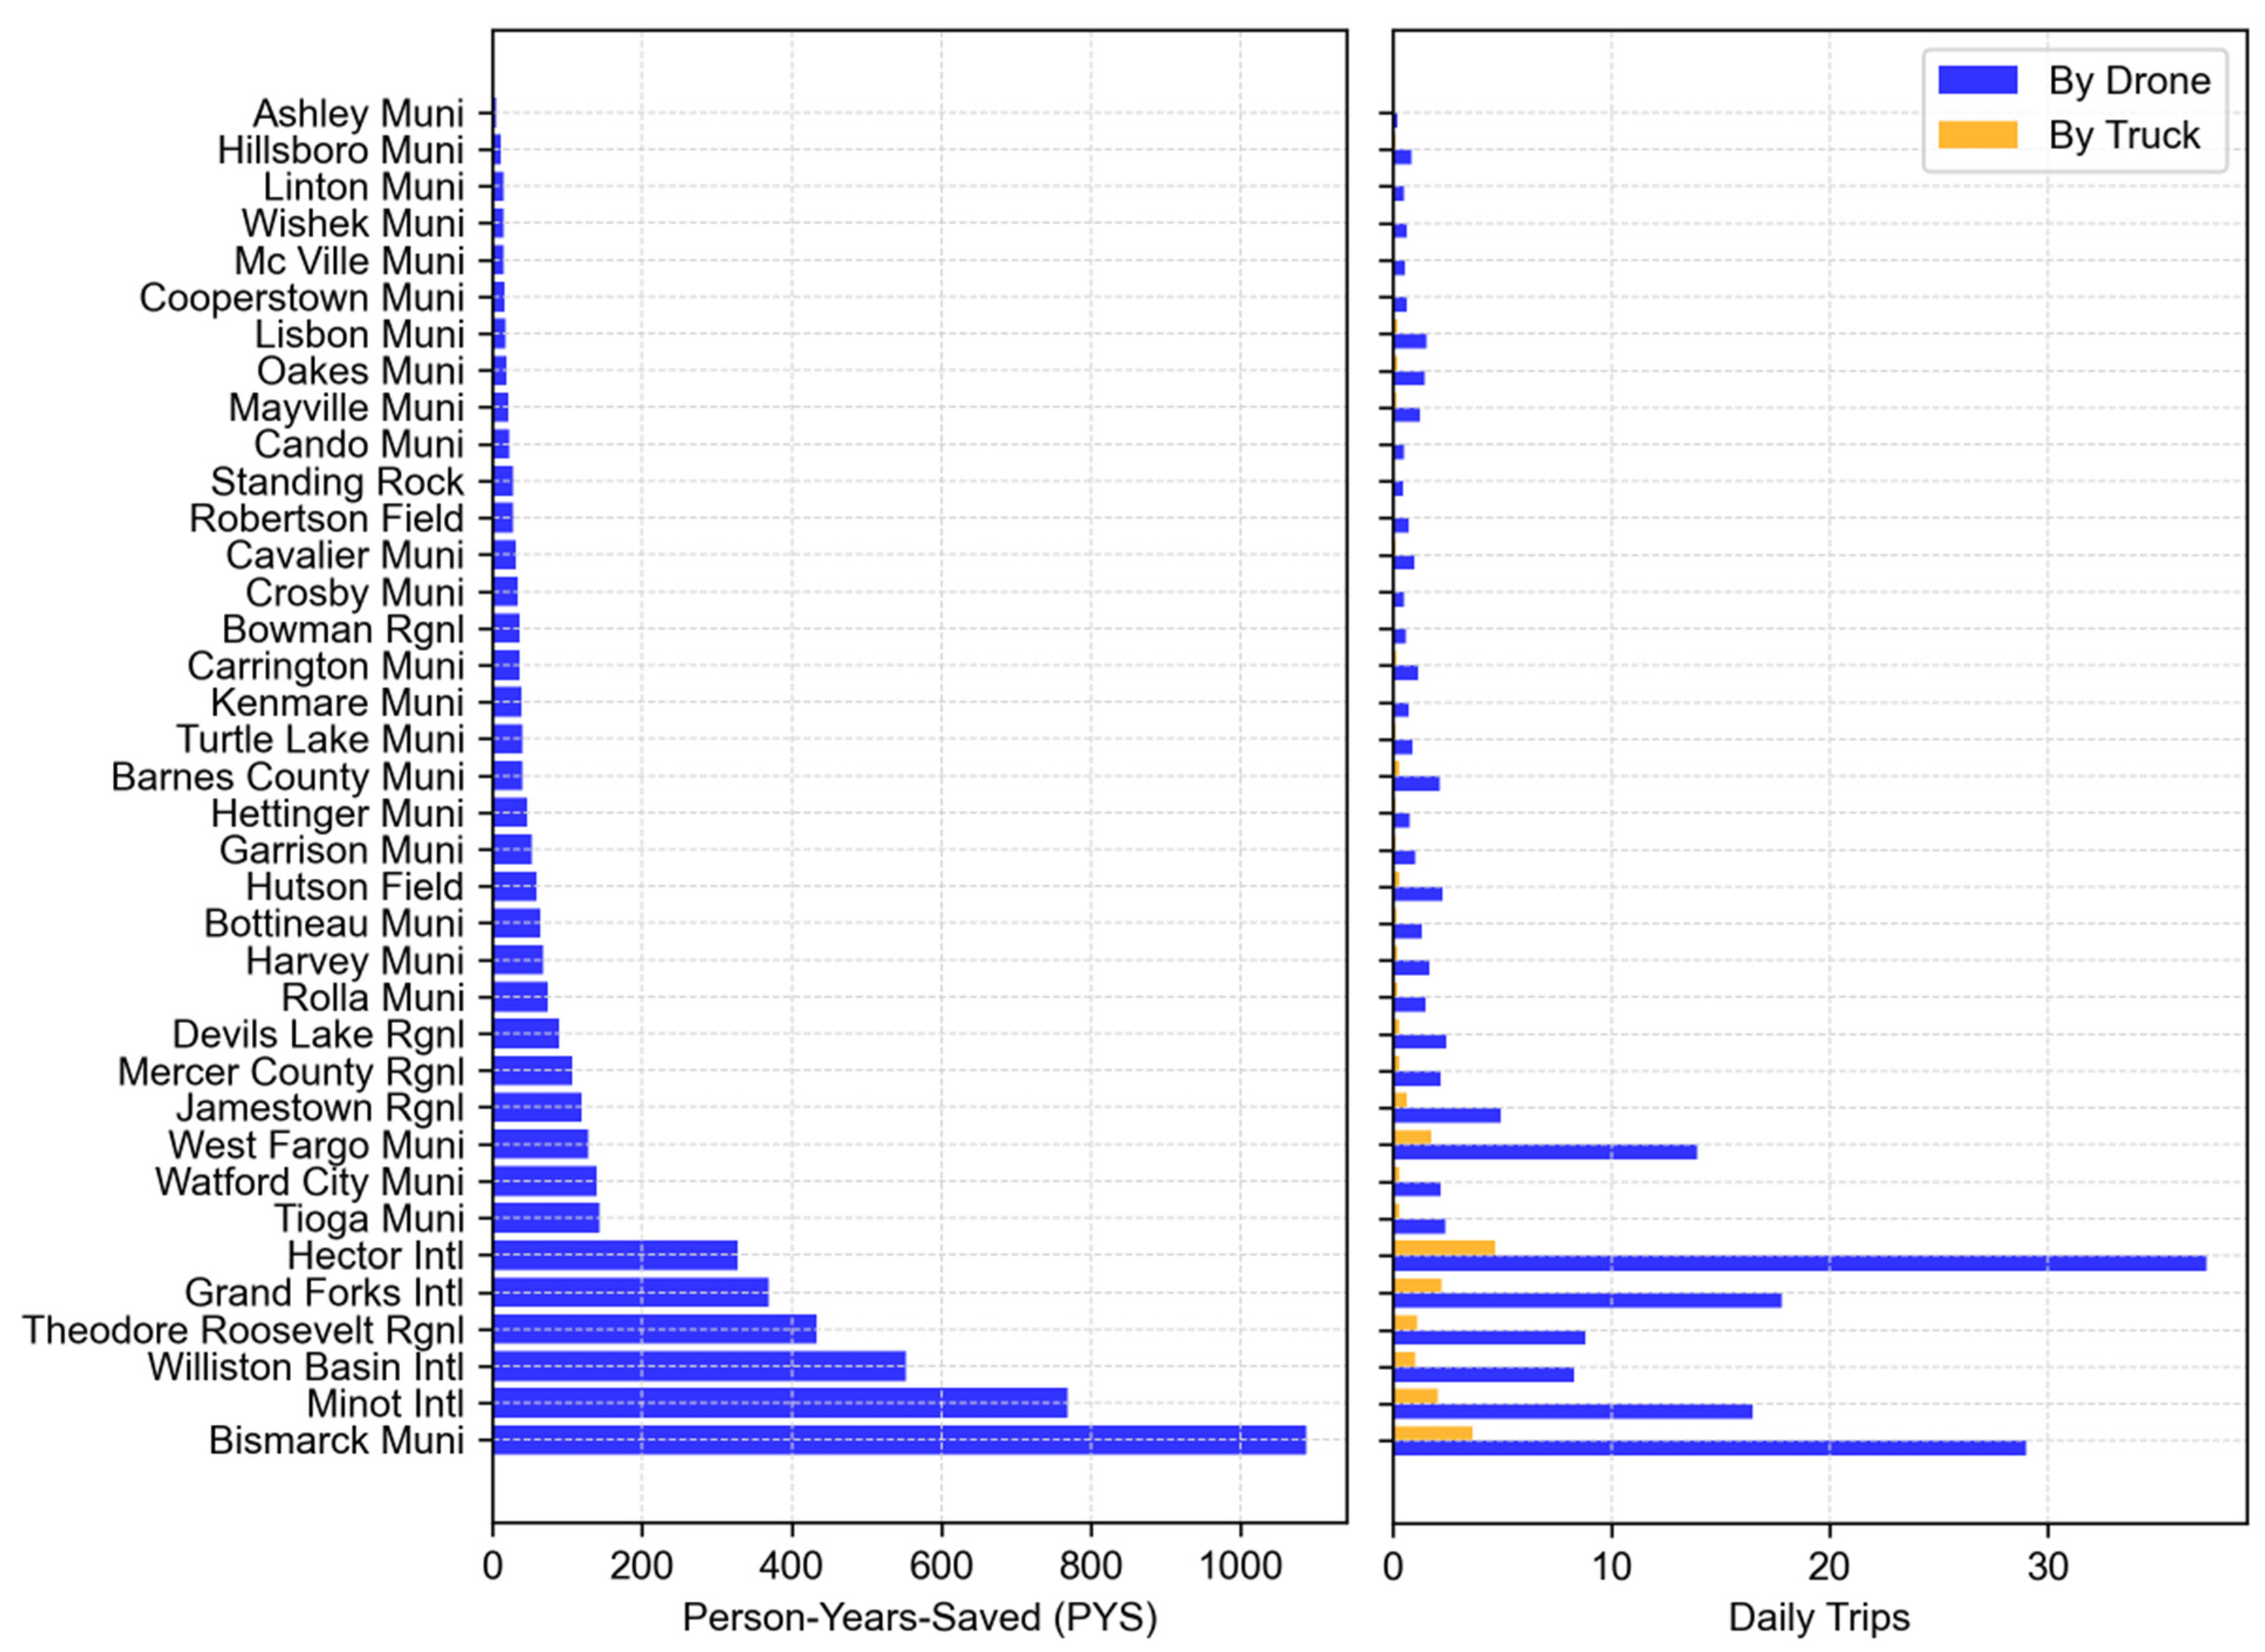
Table 5 summarizes the logistical indicators (defined in Table 2) for trips between the MLC and the HAs. The table is in the order of PYS, identifying the top locations to prioritize AAM service deployments based on the potential impact on the population served. The left side of Figure 7 plots the PYS to visualize the trend. For this logistical scenario, the total PYS was more than 5090, thereby quantifying the enormous potential for AAM to contribute toward health improvements in the state and potentially save lives. Table 5 shows DDT and DTT in decimal instead of integer quantities so as to gauge the amount of vehicle utilization. For example, the DDT of 16.5 to Minot International Airport (second row) means that after 16 fully loaded outbound drone trips, the last aircraft will carry only a half load. Alternatively, each trip may carry a partial load with the total underutilized capacity summing to 0.5 across all trips. The right side of Figure 7 plots the DDT and DTT for comparison. The figure shows that the number of trips dominate for the top-ranking airports by PYS, whereas the required truck trips are far fewer. This suggests that there will be a low demand for trucks when implementing logistics to enable the daily delivery of pharmaceuticals. This may potentially bias decisions to increase the time period between truck deliveries to reduce underutilized truck capacity, which may consequently reduce the PYS substantially.
Table 5.
Logistical indicators for trips between the MLC and HAs.
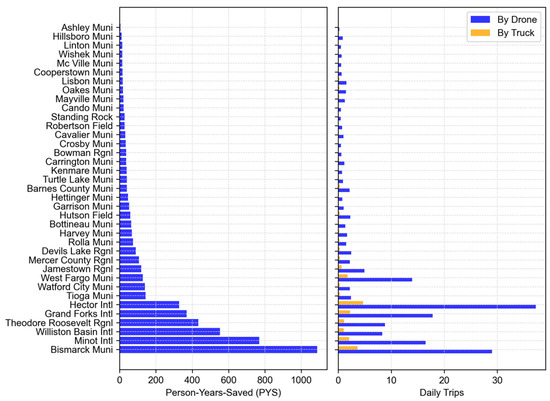
Figure 7.
PYS by AAM deployments at each HA and their daily vehicle trips required.
Figure 8 compares the distributions for the required number of drone and truck trips. The figure highlights that to realize daily deliveries, a majority of the routes (30/37 = 81%) will require less than one full truckload. For drone trips, 15/37 = 40.5% of the routes will require less than one full drone load. However, drones can offer more flexibility by utilizing variable capacity payload pods to optimize performance. For instance, drones can fly faster or longer distances when the payload is lighter [37].
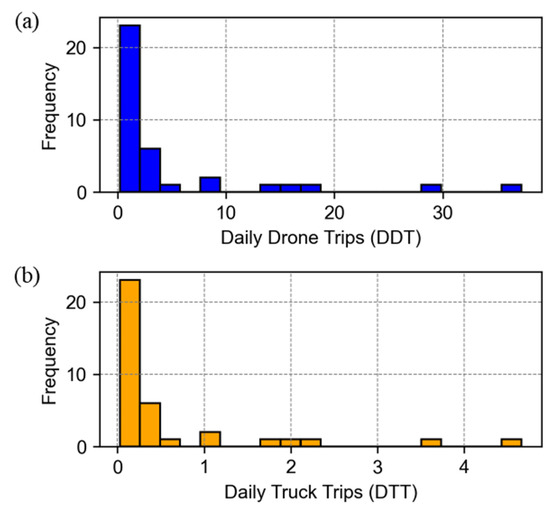
Figure 8.
Distribution of (a) daily drone trips and (b) daily truck trips required.
4.4. Transport Cost Estimates
The specifics of truck utilization influence the cost structure of the haul. Factors include whether the truck is hauling a full or partial load, weight, the necessity of additional permits for overweight loads, driver availability, fuel expenses, insurance, and the geographic details of the pickup and delivery locations. This analysis used the American Transportation Research Institute (ATRI) finding that the average cost to operate a refrigerated truck in 2022 was USD 2.44 per mile [36]. Hence, the cost for drone trips to equal the total logistical cost for truck trips would be
where J is the set of destination airports indexed by j. The result was that drone trips must cost less than 87 cents per mile for the total logistical cost to be less expensive than trucks.
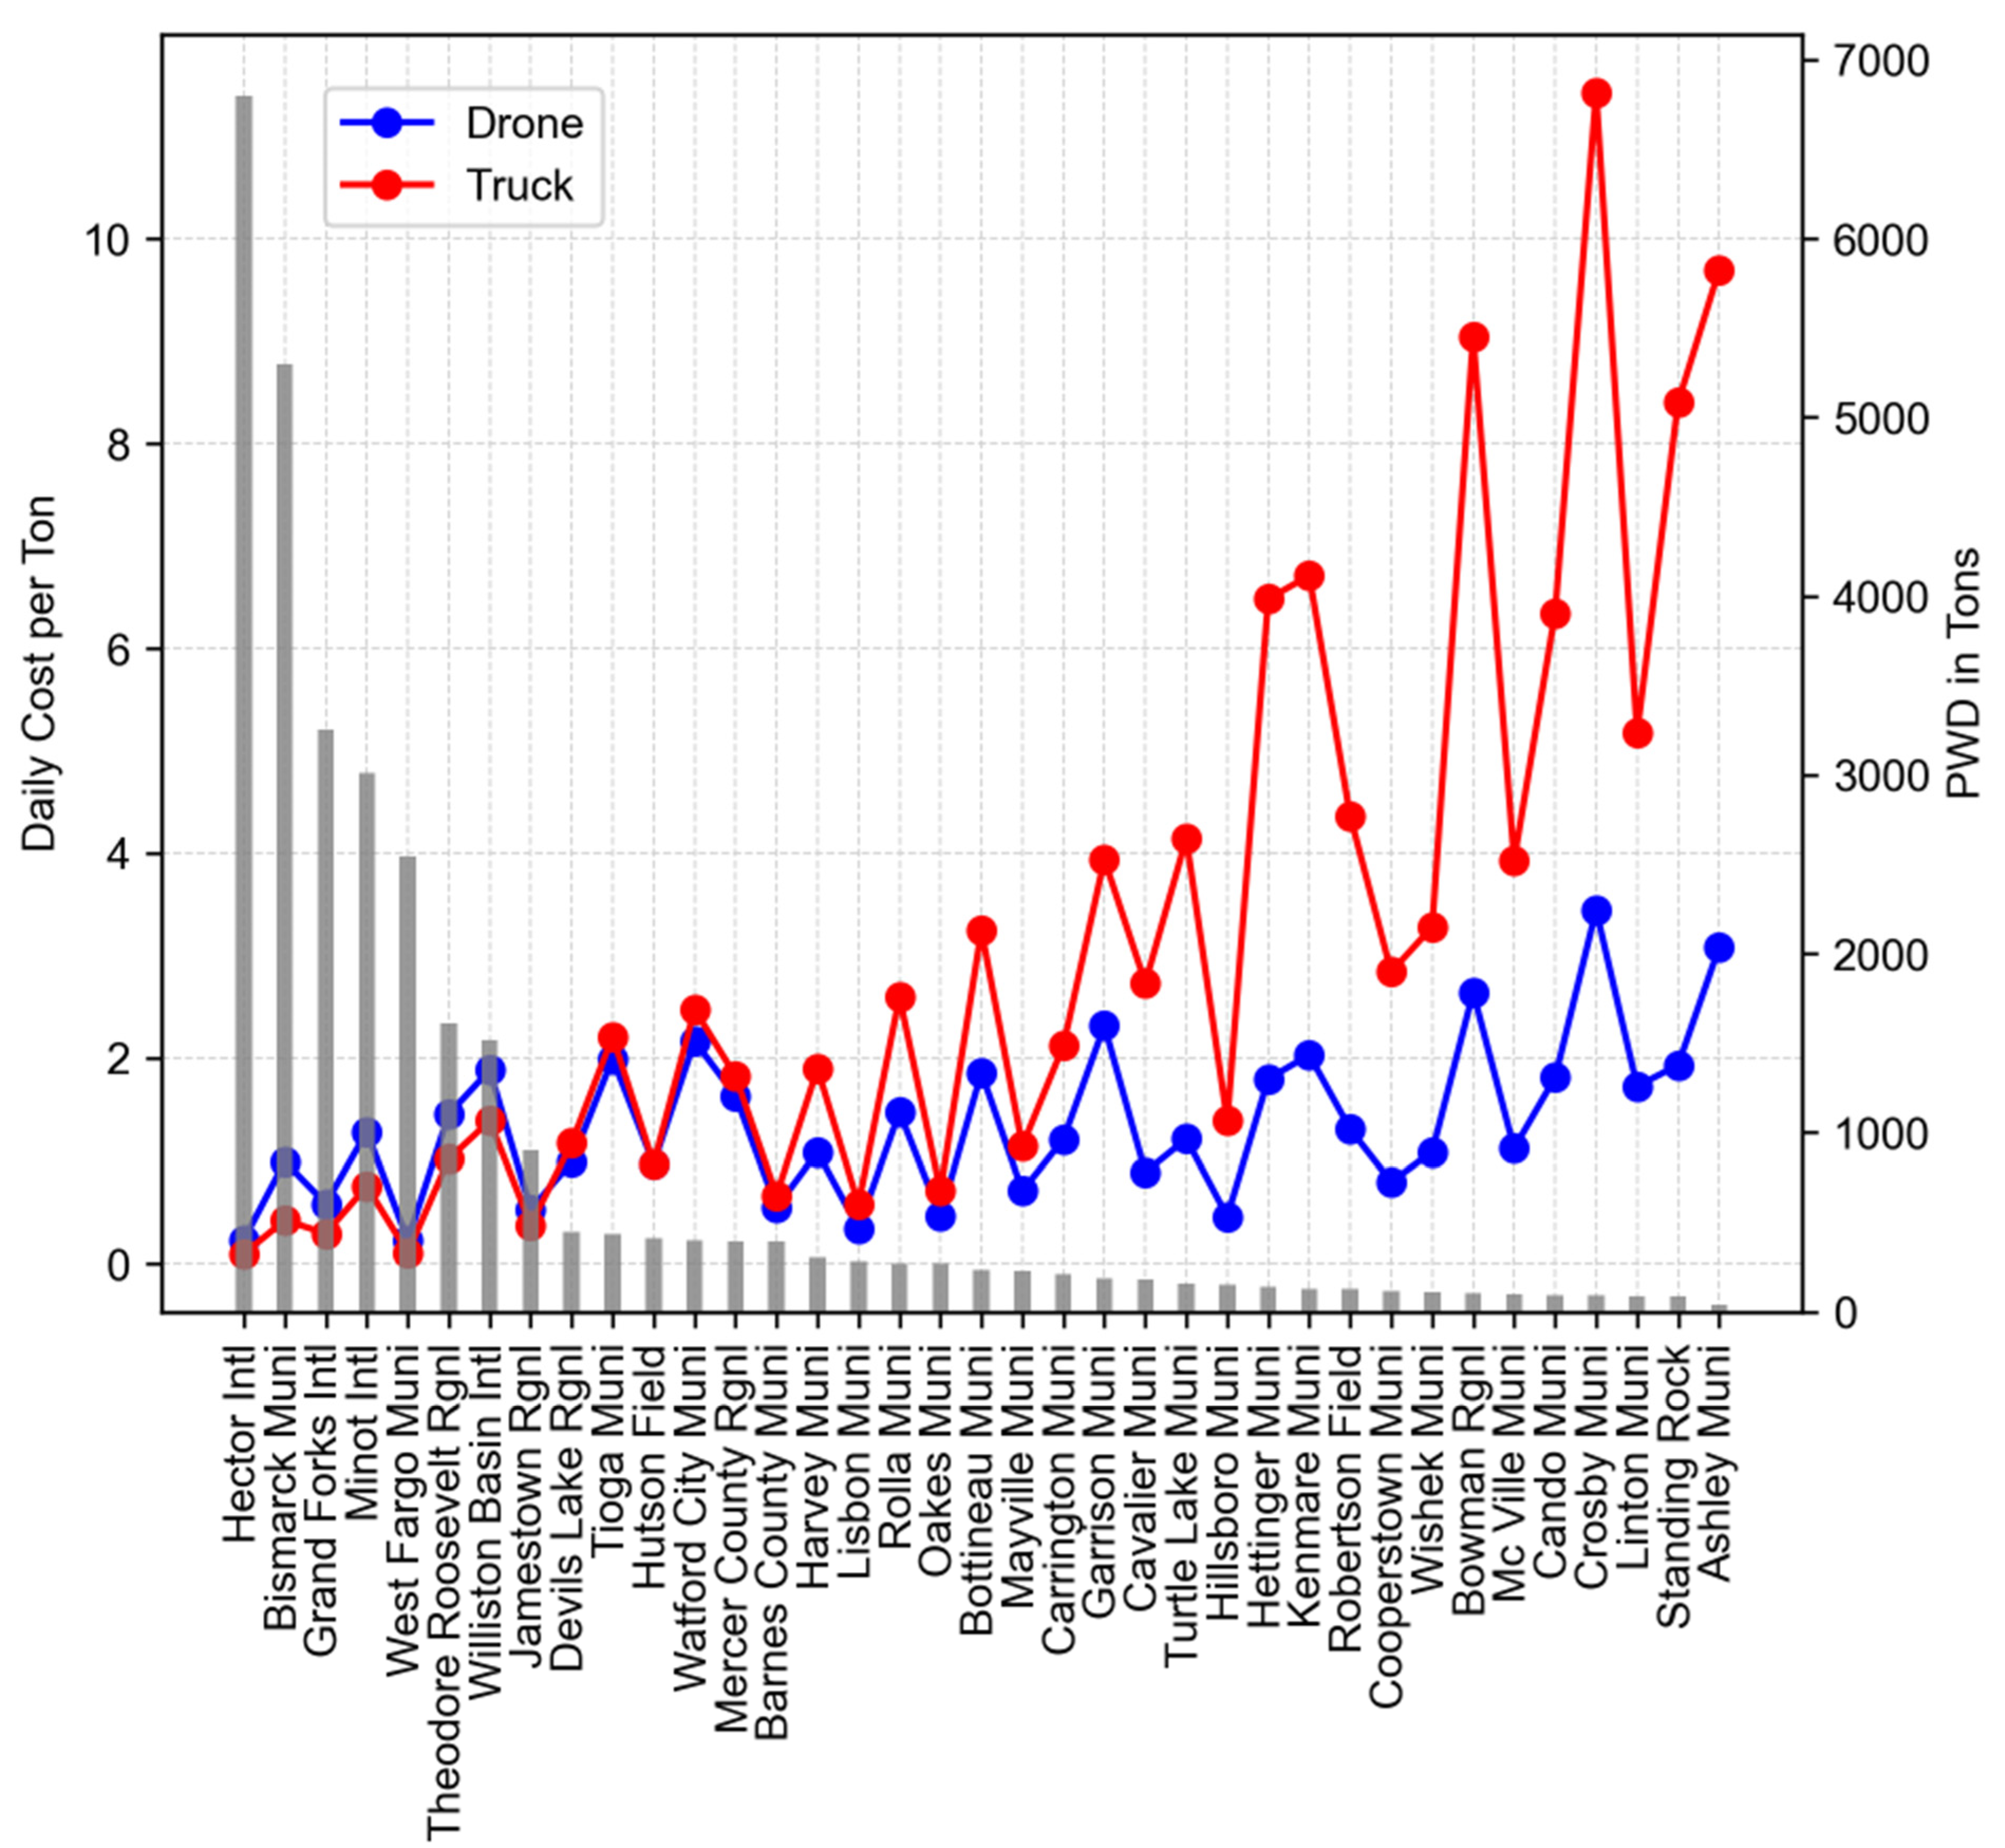
Table 6, sorted by PWD, summarizes the daily truck and drone costs per ton for each destination airport, along with the factors used to calculate them. Figure 9 plots the data in Table 6 to visualize the cost trend as PWD (gray bars) decreases. The average cost per ton for truck and drone trips, respectively, was USD 3.14 and USD 1.36. Hence, even though the total logistical costs on a per-mile basis would be identical, truck trips were, on average, 2.3 times more expensive than drone trips per unit load. In general, truck trips become more expensive than drone trips when the PWD drops below 445 annual tons. Aside from avoiding unreliability resulting from potentially poor road conditions, this lower cost for transporting goods to underserved, low-population density areas highlight the advantage of using drones instead of trucks.
Table 6.
Daily truck and drone costs for each destination airport.

Figure 9.
Daily truck and drone cost per ton by destination airport, ranked by weight demand.
4.5. Vehicle Utilization
Table 7 summarizes the underutilization rates for trucks and drones based on the daily number of trucks and drones needed per route to each destination airport. Figure 10 plots these data for visualization. As defined above in Table 2, the underutilization rate is the sum of unused vehicle proportion of capacity per daily trip. The underutilization rate for trucks is higher for low demand areas because trucks have much larger capacity than drones and consequently will be less full when carrying the same amount of weight to those locations. The average underutilization rates for drones and trucks were 26.3% and 72.6%, respectively. Therefore, the underutilization rate for trucks was 2.8 times higher than for drones, highlighting the inefficiency of truck transport for low demand areas.
Table 7.
Daily truck and drone underutilization rate by destination airport.
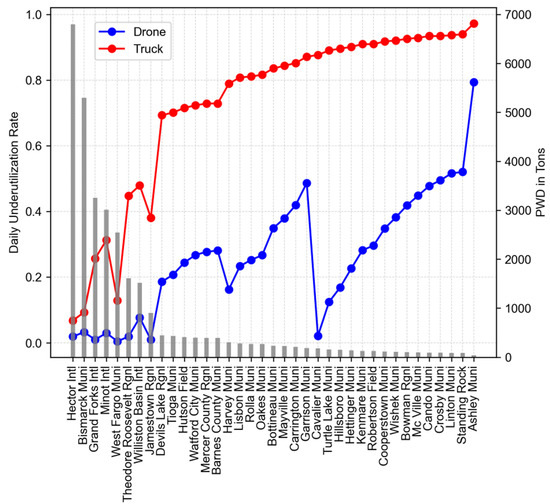
Figure 10.
Vehicle underutilization rate by destination airport.
Drone Fleet Size: Based on the total of 670.4 drone trip hours required daily, a minimum fleet size of drones can potentially service all the routes each day. This requires sharing an aircraft among routes needing only one drone for service. The total daily flight hours for the entire fleet, excluding charging and cargo handling time, would be 141.7 h, which is twice the sum of the NFH column, accounting for roundtrips. Therefore, the average annual utilization per aircraft would be 141.7/28 × 365 = 1846.8 h, which could be a factor in the business case for AAM deployments. For reference, the average annual utilization of small regional jets was 2263 h [40].
5. Discussions
This study evaluated the potential benefits of deploying AAM for pharmaceutical transport in ND, leveraging the unique regulatory environment and rural geography of the state. The GIS and optimization framework developed in this study helped to compare logistical efficiencies by identifying optimal routes for drone and truck transport. Integrating drone deliveries with existing infrastructure can improve the overall efficiency of the supply chain, reduce costs, and improve service levels. Hence, establishing an MLC near an airport where a majority of pharmaceuticals enter the state by truck (Harry Stern Airport) can optimize the distribution network. This scenario resulted in a total PYS of 5090, highlighting the enormous potential for AAM to promote health improvements and potentially save lives, particularly for rural populations and underserved communities.
The top-ranking airports by PYS suggested that healthcare demand centers near these locations can benefit most from drone deliveries. The six top-ranking airports by PYS also receive pharmaceutical shipments directly by air from other states, so there can be synergies in the last mile ground transport portions. Other key findings were that, on average, truck trips were 2.3 times more expensive than drone trips and truck capacity was 2.8 times more underutilized than drone capacity. For ND, 30 of the 37 hospital airports required less than a full daily truckload. Underutilized trucks increase fuel consumption and emissions per unit of cargo transported. In contrast, drones, despite their higher number of trips, can be more environmentally friendly and cost-effective for smaller loads and the avoidance of road congestion.
These results provide critical insights into the practical application of AAM in real-world scenarios and its implications for the broader logistics sector. For instance, shippers should consider full truckloads only for deliveries to the high demand centers and employ flexible drone cargo capacity pods to minimize underutilization for trips to lower demand centers. Furthermore, with their ability to make more frequent deliveries, drones can enable just-in-time logistics, which is particularly beneficial for pharmaceuticals that may have shorter shelf lives or require timely delivery. This flexibility can also reduce inventory holding costs and improve the responsiveness of the supply chain.
The GIS and optimization framework developed in this study streamlined the process of identifying optimal routes for pharmaceutical transport. By integrating data on road networks, airports, hospitals, and populated places, the framework enabled the calculation of shortest ground and air paths. The generation of OD matrices along the network allowed for precise mapping of transport routes, facilitating accurate optimization and scenario analysis. While the application of this framework focuses on ND, the modular and adaptable nature of the framework allows for its application to larger geographic regions and different types of healthcare logistics. Users can customize the framework to address various logistical challenges, making it suitable for diverse settings. This scalability ensures that the proposed AAM solutions can contribute to improving healthcare delivery on a broader scale.
The flexibility of drones in handling smaller, more frequent deliveries aligns well with ND’s dispersed population and challenging logistics. The analysis highlighted how drones can effectively reduce travel times, with notable PYS for several pharmaceutical demand centers. The shorter geodesic flight paths of drones compared with traditional road routes highlight their potential to bypass logistical bottlenecks and deliver pharmaceuticals more promptly. This advantage is particularly prominent during inclement weather when roads often become treacherous to navigate. This flexibility can lead to more reliable and timely deliveries, which is crucial for pharmaceutical logistics where timely delivery is critical for patient outcomes.
The comparative cost analysis demonstrated that drone trips become more cost-effective than truck trips when the annual PWD for a healthcare demand center drops below 445 annual tons. This finding highlights the economic viability of drones for pharmaceutical logistics, particularly in scenarios with lower demand densities. Additionally, the use of drones contributes to environmental sustainability by reducing emissions associated with ground transport. This aligns with the broader goals of enhancing supply chain efficiency while minimizing the carbon footprint.
The results of this scenario study highlight the practical feasibility of implementing AAM in rural settings like ND. The identification of optimal locations for MLCs and hospital airports that can provide last-mile connections to demand centers provides a blueprint for scaling AAM deployments. The study highlights the importance of regulatory support, such as the BVLOS approval in ND, in facilitating the adoption of drone technologies. Policymakers should consider these findings to create favorable regulatory environments that encourage the integration of AAM into existing logistics networks.
While the study focused on the logistical and cargo distribution aspects of the proposed deployment strategy, there is a need for further research to address practical implementation. Future research should focus on pilot implementations to validate the findings and refine the optimization models. Additionally, exploring the integration of other AAM technologies, such as electric vertical take-off and landing (eVTOL) and short take-off and landing (STOL) aircraft, including hybrid propulsion models to avoid charging stops, could further enhance the scope and impact of this research.
Implementing AAM faces potential challenges, including regulatory hurdles, public acceptance of drones, and the need for substantial investment in the required physical and digital infrastructures. Perpetrators can intercept drones and tamper with the cargo. To mitigate these risks, deployments need to integrate advanced security measures such as encryption, tamper-evident packaging, real-time tracking, and geofencing. The integration of emerging technologies such as blockchain and the Internet of Things (IoT) can further enhance cargo traceability and security. Blockchain technology can provide a decentralized and immutable ledger for recording all transactions and movements of pharmaceutical products, making it easier to detect and prevent unauthorized access. IoT devices can track temperature, humidity, and location in real-time, ensuring optimal transport conditions and situational awareness. Shippers must also adopt specialized insulated containers with active cooling systems to maintain the necessary temperature ranges for medicines throughout the delivery process.
The industry must also address regulatory challenges, such as the integration of drones into existing air traffic management systems. Geofencing capabilities of AAM control systems can restrict drone flight paths to secure corridors, reducing the risk of interception. Collaboration between policymakers and industry stakeholders is crucial to developing comprehensive regulatory frameworks that ensure safe and compliant operations. Operators may need to implement designated time windows for drone flights to minimize potential interference with other air traffic and align with current airspace management practices. Furthermore, while the GIS model assumes that drones will follow the shortest viable path to optimize efficiency, future flight rules may restrict flights to designated air corridors, requiring a model update.
Current drone technology may face limitations in terms of payload capacity, range, and battery life. Continued advancements in drone technology and infrastructure, such as the development of more efficient batteries and charging stations, are necessary to overcome these limitations. While drones can reduce emissions compared to traditional ground transport, stakeholders should carefully evaluate and manage the environmental impact of large-scale drone deployments, including energy consumption and potential noise pollution. Addressing these risks and challenges is essential to ensure the successful implementation and scalability of AAM technologies in pharmaceutical supply chains.
6. Conclusions
This study contributes to the literature by providing a robust framework for evaluating AAM deployments in rural settings and highlighting the economic and environmental benefits of drone logistics. By developing a comprehensive GIS and optimization framework, the research identified optimal routes for drone and truck transport in ND, demonstrating significant improvements in travel times and logistical efficiency. The key findings indicate that drones offer substantial advantages in pharmaceutical logistics, particularly in rural settings with dispersed populations and challenging road networks. The flexibility of drones to handle smaller, more frequent deliveries aligns well with ND’s healthcare infrastructure needs. The comparative analysis revealed that drones can become more cost-effective than trucks for routes with lower population-weighted demand, highlighting their economic viability. The person-years-saved (PYS) metric developed in this study provided a measure of the potential impact AAM deployments will have on healthcare delivery. The results showed that implementing drone logistics can lead to considerable time savings, improving the overall responsiveness of the pharmaceutical supply chain. Additionally, the environmental benefits of reduced emissions from drone transport contribute to the sustainability goals of modern logistics operations.
While the findings are promising, the study also acknowledges the need for further research and pilot implementations to validate the results and refine the optimization models. The regulatory environment, particularly the BVLOS approval in ND, plays a crucial role in facilitating the adoption of drone technologies. The logistical challenges and rural characteristics highlighted in this study are not unique to ND. Many other regions in the United States, such as Montana, Wyoming, and South Dakota, also experience dispersed populations, challenging weather conditions, and limited healthcare access.
Policymakers and industry stakeholders should consider creating supportive regulatory frameworks to encourage the integration of AAM into existing logistics networks. The insights gained from this study can inform the development of more efficient, effective, and sustainable logistics practices, leading to improved healthcare delivery and operational efficiency. While this study provides a comprehensive theoretical model, future research should include field tests or pilot studies to validate the findings. These practical applications will help confirm the feasibility and effectiveness of the proposed solutions and provide valuable insights for refining the GIS and optimization models. Such pilot studies can address potential operational challenges and ensure the practical implementation of AAM technologies aligns with the theoretical predictions. Future research will also incorporate stakeholder analysis to validate the findings and understand the practical implications of these operations. As AAM technologies continue to advance, their application in logistics promises to enhance the resilience and responsiveness of supply chains, benefiting both healthcare providers and patients.
Author Contributions
Conceptualization, R.B.; methodology, R.B.; software, R.B.; validation, R.B. and D.T.; formal analysis, R.B.; investigation, R.B.; resources, D.T.; data curation, R.B.; writing—original draft preparation, R.B.; writing—review and editing, R.B. and D.T.; visualization, R.B.; supervision, D.T.; project administration, D.T.; funding acquisition, D.T. All authors have read and agreed to the published version of the manuscript.
Funding
This research received funding from the United States Department of Transportation, Center for Transformative Infrastructure Preservation and Sustainability (CTIPS), Funding Number 69A3552348308.
Institutional Review Board Statement
Not applicable.
Informed Consent Statement
Not applicable.
Data Availability Statement
Data are contained within the article.
Conflicts of Interest
The authors declare no conflicts of interest.
References
- Bridgelall, R. Unlocking Drone Potential in the Pharma Supply Chain: A Hybrid Machine Learning and GIS Approach. Standards 2023, 3, 283–296. [Google Scholar] [CrossRef]
- Purtell, C.; Hong, S.-J.; Hiatt, B. Bibliometric Analysis on Advanced Air Mobility and Drones. J. Air Transp. Manag. 2024, 116, 102569. [Google Scholar] [CrossRef]
- Cox, J.; Harris, T.; Krah, K.; Morris, J.; Li, X.; Cary, S. Impacts of Regional Air Mobility and Electrified Aircraft on Airport Electricity Infrastructure and Demand; National Renewable Energy Laboratory: Washington, DC, USA, 2023. [Google Scholar]
- Guo, J.; Chen, L.; Li, L.; Na, X.; Vlacic, L.; Wang, F.-Y. Advanced Air Mobility: An Innovation for Future Diversified Transportation and Society. IEEE Trans. Intell. Veh. 2024, 9, 3106–3110. [Google Scholar] [CrossRef]
- Janotta, F.; Hogreve, J. Ready for Take-off? The Dual Role of Affective and Cognitive Evaluations in the Adoption of Urban Air Mobility Services. Transp. Res. Part A Policy Pract. 2024, 185, 104122. [Google Scholar] [CrossRef]
- Mishra, S.; Palanisamy, P. Autonomous Advanced Aerial Mobility—An End-to-End Autonomy Framework for UAVs and Beyond. IEEE Access 2023, 11, 136318–136349. [Google Scholar] [CrossRef]
- Menichino, A.; Vito, V.D.; Ariante, G.; Core, G.D. AAM/goods Delivery: Main Enablers for BVLOS Routine Operations within Environment at Low and Medium Risk. Aircr. Eng. Aerosp. Technol. 2023, 95, 1578–1587. [Google Scholar] [CrossRef]
- Long, Q.; Ma, J.; Jiang, F.; Webster, C.J. Demand Analysis in Urban Air Mobility: A Literature Review. J. Air Transp. Manag. 2023, 112, 102436. [Google Scholar] [CrossRef]
- Zhao, B.; Suo, Y.; Tang, L.; Li, C.; Fu, M.; Huang, L. Urban Air Mobility for Time-sensitive Goods with Explicit Customer Preferences: A Case Study on Chengdu. J. Air Transp. Manag. 2024, 118, 102613. [Google Scholar] [CrossRef]
- Dulia, E.F.; Sabuj, M.S.; Shihab, S.A. Benefits of Advanced Air Mobility for Society and Environment: A Case Study of Ohio. Appl. Sci. 2021, 12, 207. [Google Scholar] [CrossRef]
- O’Neill, S. Electric Air Taxis Create Megadeal Buzz. Engineering 2022, 13, 5–8. [Google Scholar] [CrossRef]
- Sah, B.; Gupta, R.; Bani-Hani, D. Analysis of Barriers to Implement Drone Logistics. Int. J. Logist. Res. Appl. 2021, 24, 531–550. [Google Scholar] [CrossRef]
- Ko, Y.; Kim, J.; Duguma, D.G.; Astillo, P.V.; You, I.; Pau, G. Drone secure communication protocol for future sensitive applications in military zone. Sensors 2021, 21, 2057. [Google Scholar] [CrossRef] [PubMed]
- Abedi, S.; Kwon, S.; Yoon, S.W. Healthcare and Pharmaceutical Supply Chain Automation. In Springer Handbook of Automation; Nof, S.Y., Ed.; Springer: Cham, Switzerland, 2023; pp. 1289–1308. [Google Scholar]
- Ding, B. Pharma Industry 4.0: Literature Review and Research Opportunities in Sustainable Pharmaceutical Supply Chains. Process Saf. Environ. Prot. 2018, 119, 115–130. [Google Scholar] [CrossRef]
- Jackson, A.; Srinivas, S. A Simulation-based Evaluation of Drone Integrated Delivery Strategies for Improving Pharmaceutical Service. In Supply Chain Management in Manufacturing and Service Systems; Srinivas, S., Rajendran, S., Ziegler, H., Eds.; International Series in Operations Research & Management Science, 304; Springer: Cham, Switzerland, 2021; pp. 185–204. [Google Scholar]
- Naor, M.; Pinto, G.D.; Davidov, P.; Cohen, Y.; Izchaki, L.; Hadieh, M.; Ghaith, M. Vertical Takeoff and Landing for Distribution of Parcels to Hospitals: A Case Study about Industry 5.0 Application in Israel’s Healthcare Arena. Sustainability 2024, 16, 4682. [Google Scholar] [CrossRef]
- Nalini, M. AI-Powered Drones for Healthcare Applications. In Artificial Intelligence for Autonomous Vehicles; Rajendran, S., Sabharwal, M., Hu, Y., Dhanaraj, R.K., Balusamy, B., Eds.; Scrivener Publishing LLC: Beverly, MA, USA, 2024; pp. 131–149. [Google Scholar]
- Gunaratne, K.; Thibbotuwawa, A.; Vasegaard, A.E.; Nielsen, P.; Perera, H.N. Unmanned Aerial Vehicle Adaptation to Facilitate Healthcare Supply Chains in Low-income Countries. Drones 2022, 6, 321. [Google Scholar] [CrossRef]
- Kamal, M.V.; Dileep, P.; Sharada, G.; Suneetha, V.; Gayatri, M. Drone/UAV Design Development Is Important in a Wide Range of Applications: A Critical Review. In Drone Technology: Future Trends and Practical Applications; Mohanty, S.N., Ravindra, J., Narayana, G.S., Pattnaik, C.R., Sirajudeen, Y.M., Eds.; Scrivener Publishing LLC: Beverly, MA, USA, 2023; pp. 53–67. [Google Scholar]
- Johannessen, K.A. A Conceptual Approach to Time Savings and Cost Competitiveness Assessments for Drone Transport of Biologic Samples with Unmanned Aerial Systems (Drones). Drones 2022, 6, 62. [Google Scholar] [CrossRef]
- Causa, F.; Franzone, A.; Fasano, G. Strategic and Tactical Path Planning for Urban Air Mobility: Overview and Application to Real-world Use Cases. Drones 2022, 7, 11. [Google Scholar] [CrossRef]
- Ramos, T.R.P.; Vigo, D. A New Hybrid Distribution Paradigm: Integrating Drones in Medicines Delivery. Expert Syst. Appl. 2023, 234, 120992. [Google Scholar] [CrossRef]
- Beck, S.; Bui, T.T.; Davies, A.; Courtney, P.; Brown, A.; Geudens, J.; Royall, P.G. An Evaluation of the Drone Delivery of Adrenaline Auto-Injectors for Anaphylaxis: Pharmacists’ Perceptions, Acceptance, and Concerns. Drones 2020, 4, 66. [Google Scholar] [CrossRef]
- Nedelea, P.L.; Popa, T.O.; Manolescu, E.; Bouros, C.; Grigorasi, G.; Andritoi, D.; Pascale, C.; Andrei, A.; Cimpoesu, D.C. Telemedicine System Applicability Using Drones in Pandemic Emergency Medical Situations. Electronics 2022, 11, 2160. [Google Scholar] [CrossRef]
- Silvestri, S.D.; Pagliarani, M.; Tomasello, F.; Trojaniello, D.; Sanna, A. Design of A Service for Hospital Internal Transport of Urgent Pharmaceuticals via Drones. Drones 2022, 6, 70. [Google Scholar] [CrossRef]
- Maheswari, R.; Ganesan, R.; Venusamy, K. Medrone—A Smart Drone to Distribute Drugs to Avoid Human Intervention and Social Distancing to Defeat COVID-19 Pandemic for Indian Hospital. J. Phys. Conf. Ser. 2021, 1964, 062112. [Google Scholar] [CrossRef]
- BTS. Highway Performance Monitoring System (HPMS) 2020. 28 June 2023. Available online: https://geodata.bts.gov/datasets/highway-performance-monitoring-system-hpms-2020/about (accessed on 11 May 2024).
- BTS. U.S. Department of Transportation, Bureau of Transportation Statistics (BTS). 15 November 2022. Available online: https://data.bts.gov/Aviation/Airports/kfcv-nyy3/about_data (accessed on 11 May 2024).
- ESRI. USA Census Populated Place Areas. 6 February 2023. Available online: https://ndsu.maps.arcgis.com/home/item.html?id=d8e6e822e6b44d80b4d3b5fe7538576d (accessed on 11 May 2024).
- HIFLD. Homeland Infrastructure Foundation-Level Data (HIFLD). 7 December 2023. Available online: https://hifld-geoplatform.hub.arcgis.com/ (accessed on 11 May 2024).
- NDMA. North Dakota Medical Association. 2018. Available online: https://www.ndmed.org/patient-resources/nd-clinics-and-resources/ (accessed on 11 May 2024).
- BTS. Bureau of Transportation Statistics (BTS). United States Department of Transportation, Bureau of Transportation Statistics (BTS). 25 April 2024. Available online: https://www.bts.gov/faf (accessed on 1 June 2024).
- QGIS. QGIS: A Free and Open Source Geographic Information System. 16 May 2024. Available online: https://qgis.org/en/site/ (accessed on 16 May 2024).
- Bridgelall, R. Locating Electrified Aircraft Service to Reduce Urban Congestion. Information 2024, 15, 186. [Google Scholar] [CrossRef]
- Leslie, A.; Murray, D. An Analysis of the Operational Costs of Trucking: 2023 Update; American Transportation Research Institute (ATRI): Washington, DC, USA, 2023. [Google Scholar]
- Bridgelall, R.; Askarzadeh, T.; Tolliver, D.D. Introducing an efficiency index to evaluate eVTOL designs. Technol. Forecast. Soc. Chang. 2023, 191, 122539. [Google Scholar] [CrossRef]
- Walker, M.F. North Dakota, A Growing Hub for the Biotech and Bioscience Industries. Fargo Moorhead Economic Development (FMED). 19 December 2022. Available online: https://gfmedc.com/north-dakota-a-growing-hub-for-the-biotech-and-bioscience-industries/ (accessed on 4 June 2024).
- NDTD. North Dakota Airports. North Dakota Tourism Division (NDTD). Available online: https://www.ndtourism.com/information/north-dakota-airports (accessed on 4 June 2024).
- Bridgelall, R. Forecasting Market Opportunities for Urban and Regional Air Mobility. Technol. Forecast. Soc. Chang. 2023, 196, 122835. [Google Scholar] [CrossRef]


Disclaimer/Publisher’s Note: The statements, opinions and data contained in all publications are solely those of the individual author(s) and contributor(s) and not of MDPI and/or the editor(s). MDPI and/or the editor(s) disclaim responsibility for any injury to people or property resulting from any ideas, methods, instructions or products referred to in the content. |
© 2024 by the authors. Licensee MDPI, Basel, Switzerland. This article is an open access article distributed under the terms and conditions of the Creative Commons Attribution (CC BY) license (https://creativecommons.org/licenses/by/4.0/).