Article

Deep Low-Carbon Economic Optimization Using CCUS and Two-Stage P2G with Multiple Hydrogen Utilizations for an Integrated Energy System with a High Penetration Level of Renewables

by
Junqiu Fan
1,2,
Jing Zhang
1,*,
Long Yuan
2,
Rujing Yan
1,
Yu He
1,
Weixing Zhao
2 and
Nang Nin
2
1
The Electrical Engineering College, Guizhou University, Guiyang 550025, China
2
Guizhou Power Grid Co., Ltd., Guiyang 550002, China
*
Author to whom correspondence should be addressed.
Sustainability 2024, 16(13), 5722; https://doi.org/10.3390/su16135722
Submission received: 10 April 2024 / Revised: 17 June 2024 / Accepted: 24 June 2024 / Published: 4 July 2024

Abstract

:
Integrating carbon capture and storage (CCS) technology into an integrated energy system (IES) can reduce its carbon emissions and enhance its low-carbon performance. However, the full CCS of flue gas displays a strong coupling between lean and rich liquor as carbon dioxide liquid absorbents. Its integration into IESs with a high penetration level of renewables results in insufficient flexibility and renewable curtailment. In addition, integrating split-flow CCS of flue gas facilitates a short capture time, giving priority to renewable energy. To address these limitations, this paper develops a carbon capture, utilization, and storage (CCUS) method, into which storage tanks for lean and rich liquor and a two-stage power-to-gas (P2G) system with multiple utilizations of hydrogen including a fuel cell and a hydrogen-blended CHP unit are introduced. The CCUS is integrated into an IES to build an electricity–heat–hydrogen–gas IES. Accordingly, a deep low-carbon economic optimization strategy for this IES, which considers stepwise carbon trading, coal consumption, renewable curtailment penalties, and gas purchasing costs, is proposed. The effects of CCUS, the two-stage P2G system, and stepwise carbon trading on the performance of this IES are analyzed through a case-comparative analysis. The results show that the proposed method allows for a significant reduction in both carbon emissions and total operational costs. It outperforms the IES without CCUS with an 8.8% cost reduction and a 70.11% reduction in carbon emissions. Compared to the IES integrating full CCS, the proposed method yields reductions of 6.5% in costs and 24.7% in emissions. Furthermore, the addition of a two-stage P2G system with multiple utilizations of hydrogen further amplifies these benefits, cutting costs by 13.97% and emissions by 12.32%. In addition, integrating CCUS into IESs enables the full consumption of renewables and expands hydrogen utilization, and the renewable consumption proportion in IESs can reach 69.23%.

1. Introduction

On a global level, humanity is currently confronting two major challenges: the imbalance between energy supply and demand and the escalating threat of climate change driven by greenhouse gas emissions. These challenges not only jeopardize environmental health but also pose a significant risk to sustainable development on various levels [1]. In response, countries all over the world are actively implementing diversified strategies and developing initiatives to mitigate carbon emissions in different domains [2]. In alignment with the 2005 Paris Agreement, China has set ambitious targets to reduce its carbon emissions by 60–65% by 2030, along with increasing the renewable energy share to 25% [3]. Similarly, the State of California in the United States has also set ambitious goals to reduce its carbon emissions by 26–28% compared to 2005 levels by 2025, in addition to expanding the renewable energy share to 60%. This policy has been implemented to hasten the shift towards renewable energy, decrease dependence on fossil fuels, and alleviate the effects of climate change [4]. Overall, these pathways to reducing carbon emissions and achieving sustainable development include renewable energy development, improving energy efficiency, increasing energy conservation, carbon taxes, more equitable balancing of human wellbeing and per capita energy use, and carbon capture, utilization, and storage (CCUS) [5]. Among the pivotal strategies for achieving the set energy and environmental goals, enhancing energy efficiency and expanding the accommodation of renewable energy in energy systems are widely investigated and implemented measures [6]. Integrated energy systems (IESs) can augment energy efficiency and the renewable energy share through the coordinated management of energy production, conversion, storage, and consumption, which is a major route towards reducing carbon emissions of supply energy systems [7].
In IESs, the combined heat and power (CHP) unit is a cornerstone of high energy efficiency [8]. However, this is accompanied by a major challenge related to their inherent thermo-electric coupling characteristics [9], which results in an inherent limitation regarding the flexibility of IESs [10]. This limitation restricts the renewable consumption in IESs, especially in cases where a high share of uncertain renewables is integrated [11]. To address this challenge, two main methods are used to enhance flexibility: one is extracting potential flexible resources by optimizing the operation schedule, and the other is enhancing inherent flexibility by integrating some flexible equipment.
The former improves flexibility through the operational optimization of integrating the potential flexible adjustment resource in IESs. The potential flexible adjustment resource includes the multi-time scale synergy of various energy flows [12], storage characteristics of heating networks [13], and thermal dynamics of buildings [14]. In this regard, ref. [15] examined and implemented the multi-timescale synergies of various energy supply networks, aiming to promote wind energy accommodation. The findings obtained demonstrated that the operational performance of IESs is promoted by integrating the multi-timescale synergies in the model. Considering the enormous thermal storage potential of heating network pipes, refs. [16,17] incorporated the thermal storage capabilities into an optimization model to quantify the available storage capacity. Also, the dynamic thermal characteristics of buildings are considered a key component to target for increasing IESs’ regulation capability. Accordingly, ref. [18] integrated building thermal dynamics as a key component in an optimal dispatch model based on chance constraints. The reported results demonstrated the improved performance of IESs in this case. While yielding promising results and findings, these methods still have limited flexibility regulation capability and are not universally applicable for cases with a high penetration level of renewables because the inherent flexibility of IESs fails to be improved.
The latter incorporates flexible equipment to enhance the inherent flexibility of IESs, with the goal of transferring or transforming energy production to address periods of energy scarcity or transition to different energy sources [7]. It is thus considered a major approach for more flexibility of IESs with a high penetration level of renewables. Accordingly, ref. [19] integrated thermal storage into an IES and utilized its time-shifting characteristics to reshape load curves and improve flexibility. As a result, wind power utilization was promoted [20]. Ref. [21] established a flexible operation model to evaluate the performance of CHP systems integrated with bypass compensation and low-pressure cylinder cutoff compensation. Both of these upgrades can effectively increase the heat-to-power ratio of the CHP systems. Ref. [22] integrated electric boilers on both supply sides of the CHP system. Their results highlighted increased wind power utilization in addition to reduced overall dispatch costs.
The above investigations have demonstrated that the integration of some flexible equipment and the utilization of potential flexible resources can effectively enhance renewable energy consumption and reduce the operational costs for IESs. However, IESs still face challenges in completely resolving carbon emission environmental issues [23]. In particular, the electricity and heat production in most of the current systems still relies heavily on natural gas and coal, which results in residual carbon emissions. Therefore, the adoption of effective decarbonization technologies is essential to promoting the deep low-carbon operation of IESs. Carbon capture and storage (CCS) technology has been demonstrated as an effective technical approach to decrease carbon emissions and has been widely used in the application of coal- and gas-fired units [24]. It is divided into three categories: the full capture of flue gas, the split flow of flue gas, and the flexible operation of integrating storage tanks for lean and rich liquor [25]. The full CCS of flue gas displays a strong coupling between lean and rich liquor as carbon dioxide liquid absorbents. Its integration into IESs with a high penetration level of renewables results in insufficient flexibility and renewable curtailment [26]. Integrating storage tanks for lean and rich liquor as carbon dioxide liquid absorbents into CCS can decouple this strong coupling limitation, enhancing the flexibility and facilitating the flexible operation of CCS [27]. In addition, the split-flow CCS of flue gas can adjust energy consumption by changing the flue gas ratio between imputing CCS and direct exhaustion, which improves the flexibility of IESs. However, the capture time is short due to giving priority to using renewable energy, and carbon dioxide emissions still exist in IESs. To combine flexibility and carbon capture, an integrated flexible CCS system was built by integrating two types (split-flow of flue gas and flexible operation) of CCS [28]. Ref. [29] developed a two-stage day-ahead and real-time coordinated dispatch model which considers integrated flexible CCS. Its results show that integrating flexible CCS significantly promoted the operational performance of IESs. However, leakage risks in carbon dioxide storage processes in CCS still exist. Using the carbon dioxide trapped using CCS technology as a carbon source to develop the CCUS subsystem will reduce the amount of stored carbon dioxide, which effectively mitigates the risk of storage leakage and costs.
The power-to-gas (P2G) system produces hydrogen via the electrolysis of water (first stage) and then generates methane through the methanation of hydrogen and carbon dioxide (second stage) [30], and is capable of linking the power network and gas network [30]. As mentioned above, the P2G system can transform electricity into other energy forms (e.g., hydrogen energy), and thus its integration into IESs can enhance its inherent flexibility [31]. Accordingly, ref. [32] developed an optimization model for an IES integrated with a P2G system, whose results showed that P2G integration enhanced renewable consumption and reduced the operational costs of IESs. Ref. [33] utilized surplus wind power for hydrogen production via a P2G system, which enhanced wind power consumption in the IES. These studies require external purchases of carbon dioxide in the methanation process, leading to increased carbon feedstock costs. The need for a carbon dioxide source means that using a combination of a P2G system and CCS technology to build a CCUS subsystem is a promising option. Accordingly, ref. [34] utilized carbon dioxide captured using CCS technology as a feedstock for methane synthesis and proposed a joint operation mechanism of P2G and CCS systems, reducing carbon costs. Ref. [35] proposed a flexible operation model for the CHP system by integrating CCUS, including CCS and P2G systems, whose results demonstrated good low-carbon economic performance. However, there is a coupling limitation between the hydrogen flow rate and carbon dioxide utilization, which influences the flexibility of the IES integrated with CCUS and the P2G system. Multi-stage utilization and multiple utilizations of hydrogen represent a promising path to address this problem.
In summary, most of the existing studies have integrated various kinds of CCS (e.g., full capture of flue gas, split flow of flue gas, flexible operation, and integrated flexibility) to realize deep decarbonization, and some flexible equipment (e.g., electric boiler, thermal energy storage, and P2G) has been used to develop greater flexibility in IESs. However, these studies paid little attention to integrating a two-stage P2G system with multiple utilizations of hydrogen into integrated flexible CCS to develop CCUS technology and incorporating this CCUS system to build an electricity–heat–hydrogen–gas IES with a high penetration level of renewables for its deep low-carbon and flexible operation. Accordingly, this paper develops a new CCUS and integrates it into the deep low-carbon economic optimization of IESs with a high penetration level of renewables. The main contributions are as follows:
(1) A CCUS method incorporating an integrated flexible CCS system with storage tanks for lean and rich liquor and a two-stage P2G system with multiple utilizations of hydrogen, including hydrogen fuel cells and blending units, is developed to realize the deep low-carbon and flexible operation of electricity–heat–hydrogen–gas IESs.
(2) A deep low-carbon economic optimization strategy for an IES with a high penetration level of renewables, which considers stepwise carbon trading, coal consumption, renewable curtailment penalties, and gas purchasing costs, is proposed to quantify the operational performance benefits.
(3) Taking an IES with a high proportion of 0enewable energy in northern China as an object of investigation, the impacts of the integrated flexible CCUS technology, P2G system, and stepwise carbon trading on the operational performance results are evaluated through a case-comparison analysis.
The rest of this paper is organized as follows: Section 2 presents an analysis and modeling of CCUS. Section 3 develops the deep low-carbon optimization method of IESs with a high penetration level of renewables. Section 4 presents a case study implementation, and Section 5 summarizes the major conclusions.

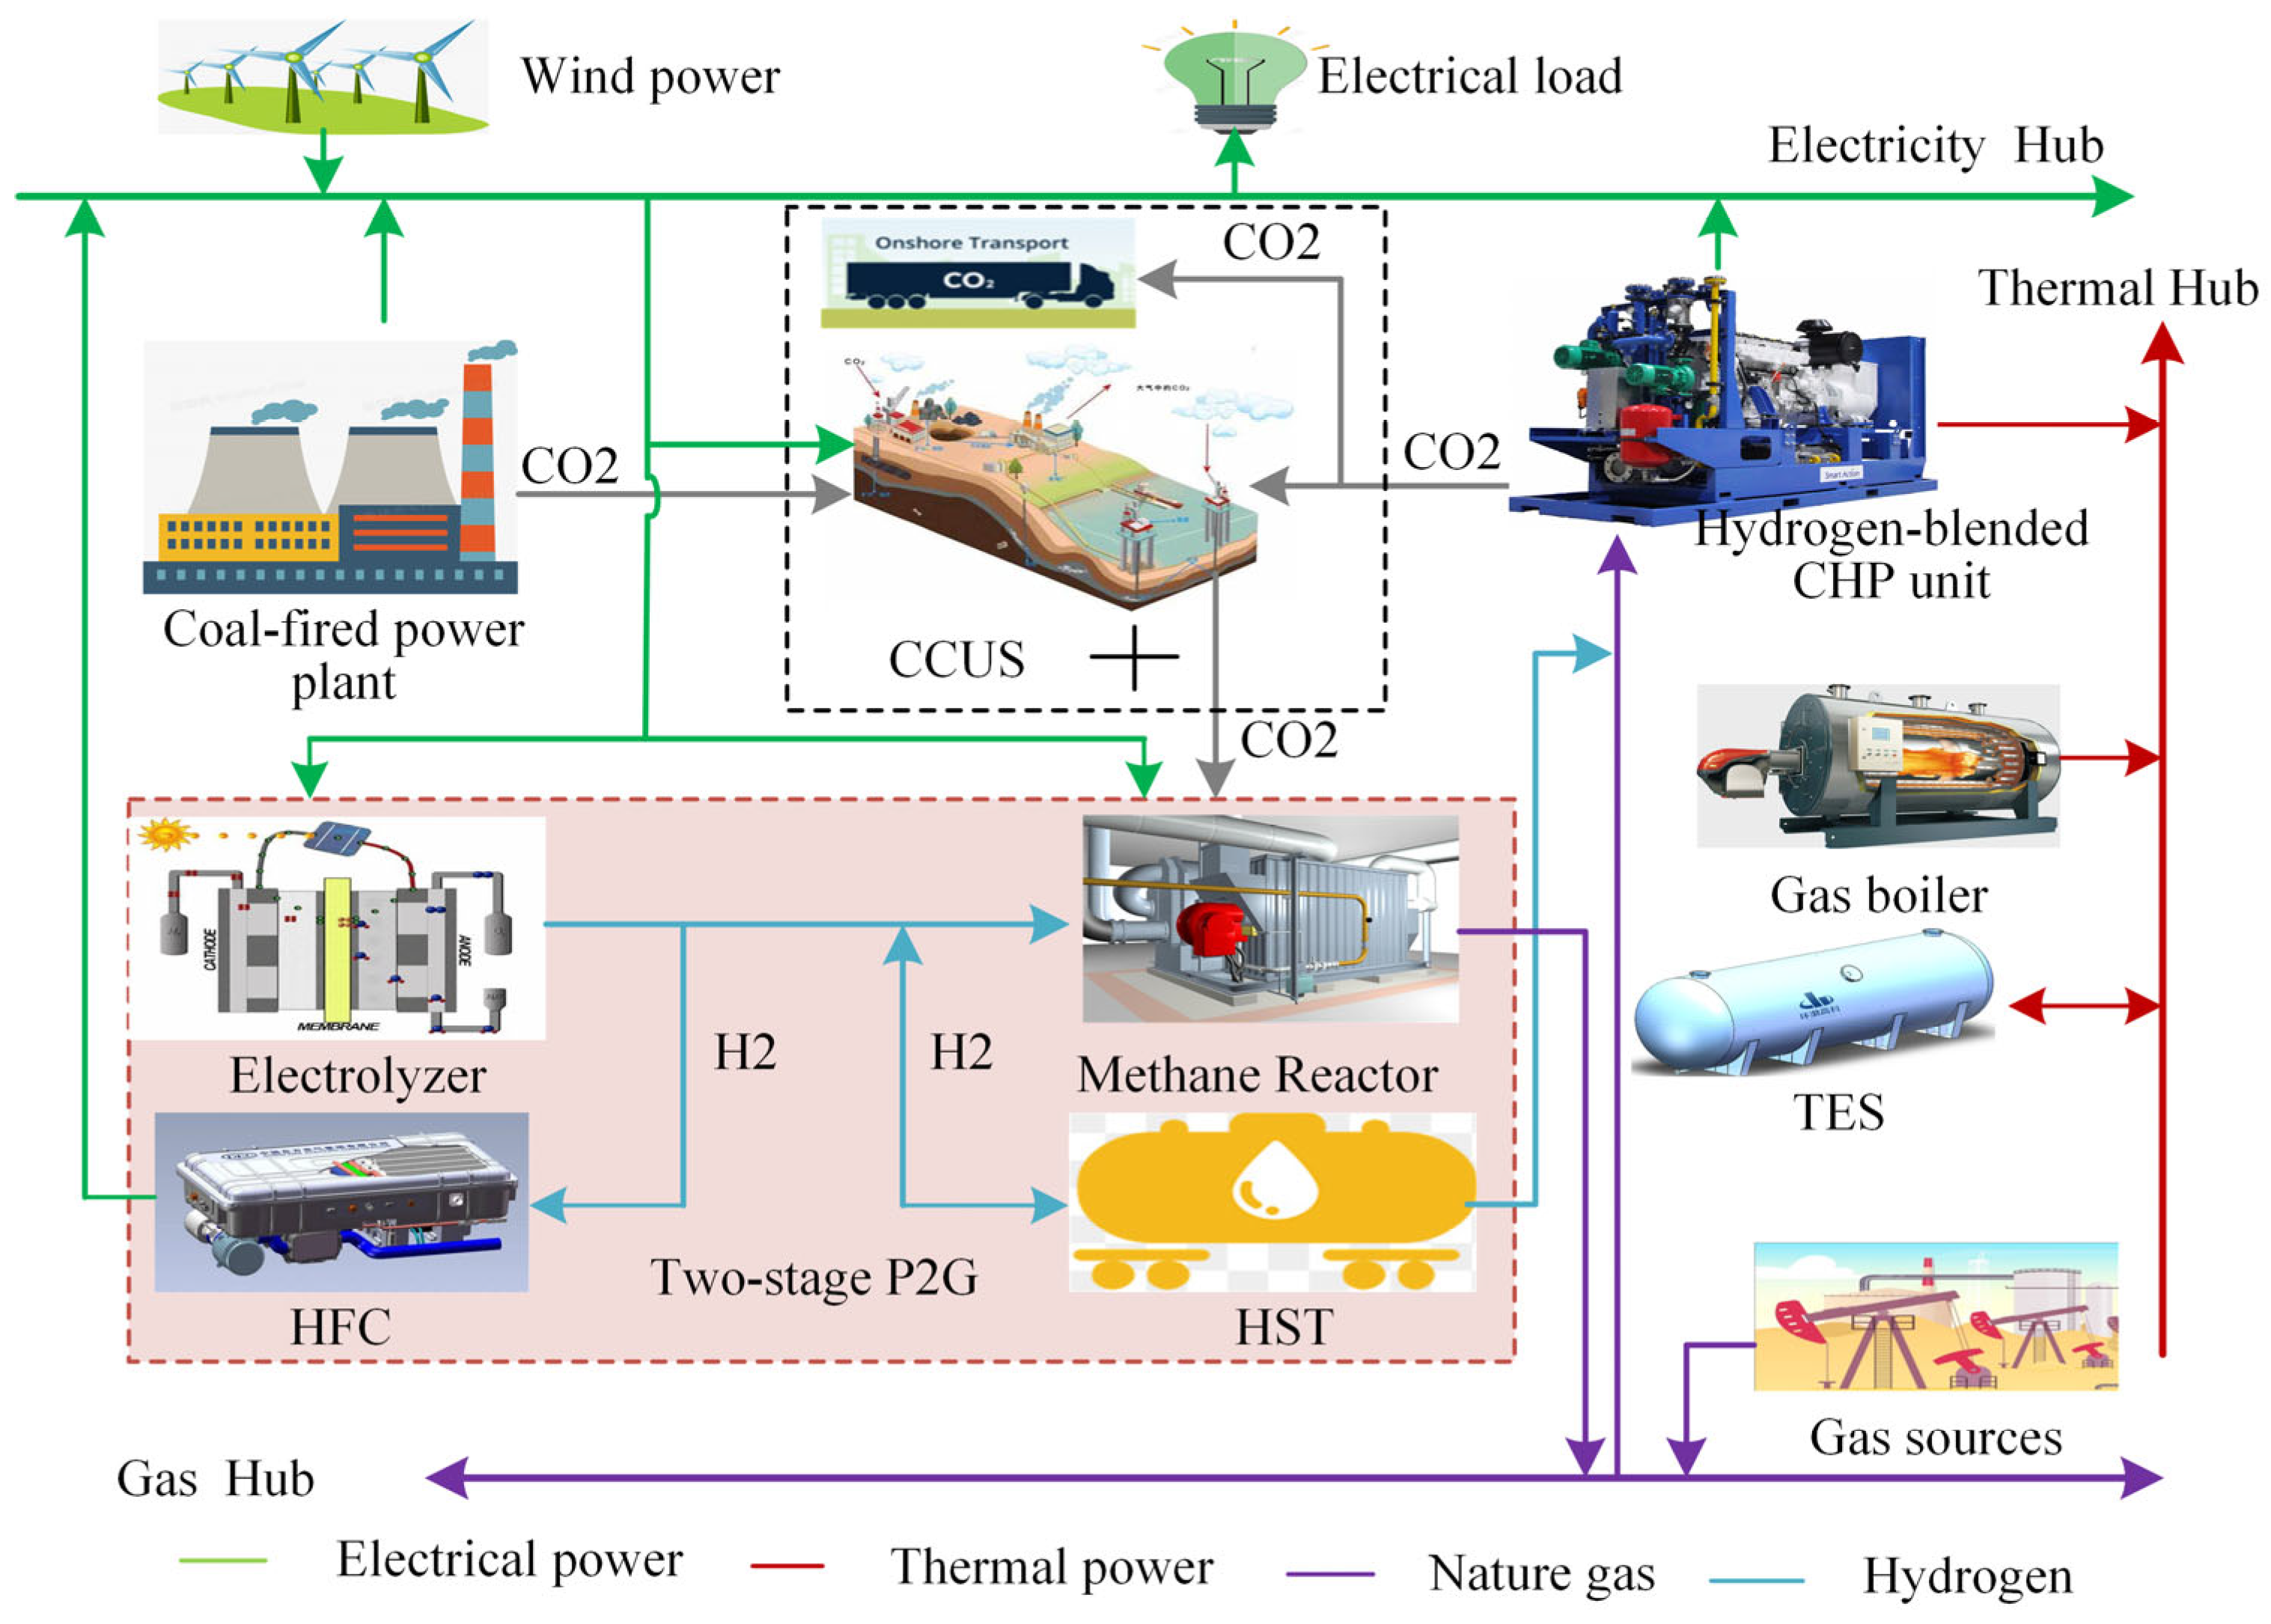
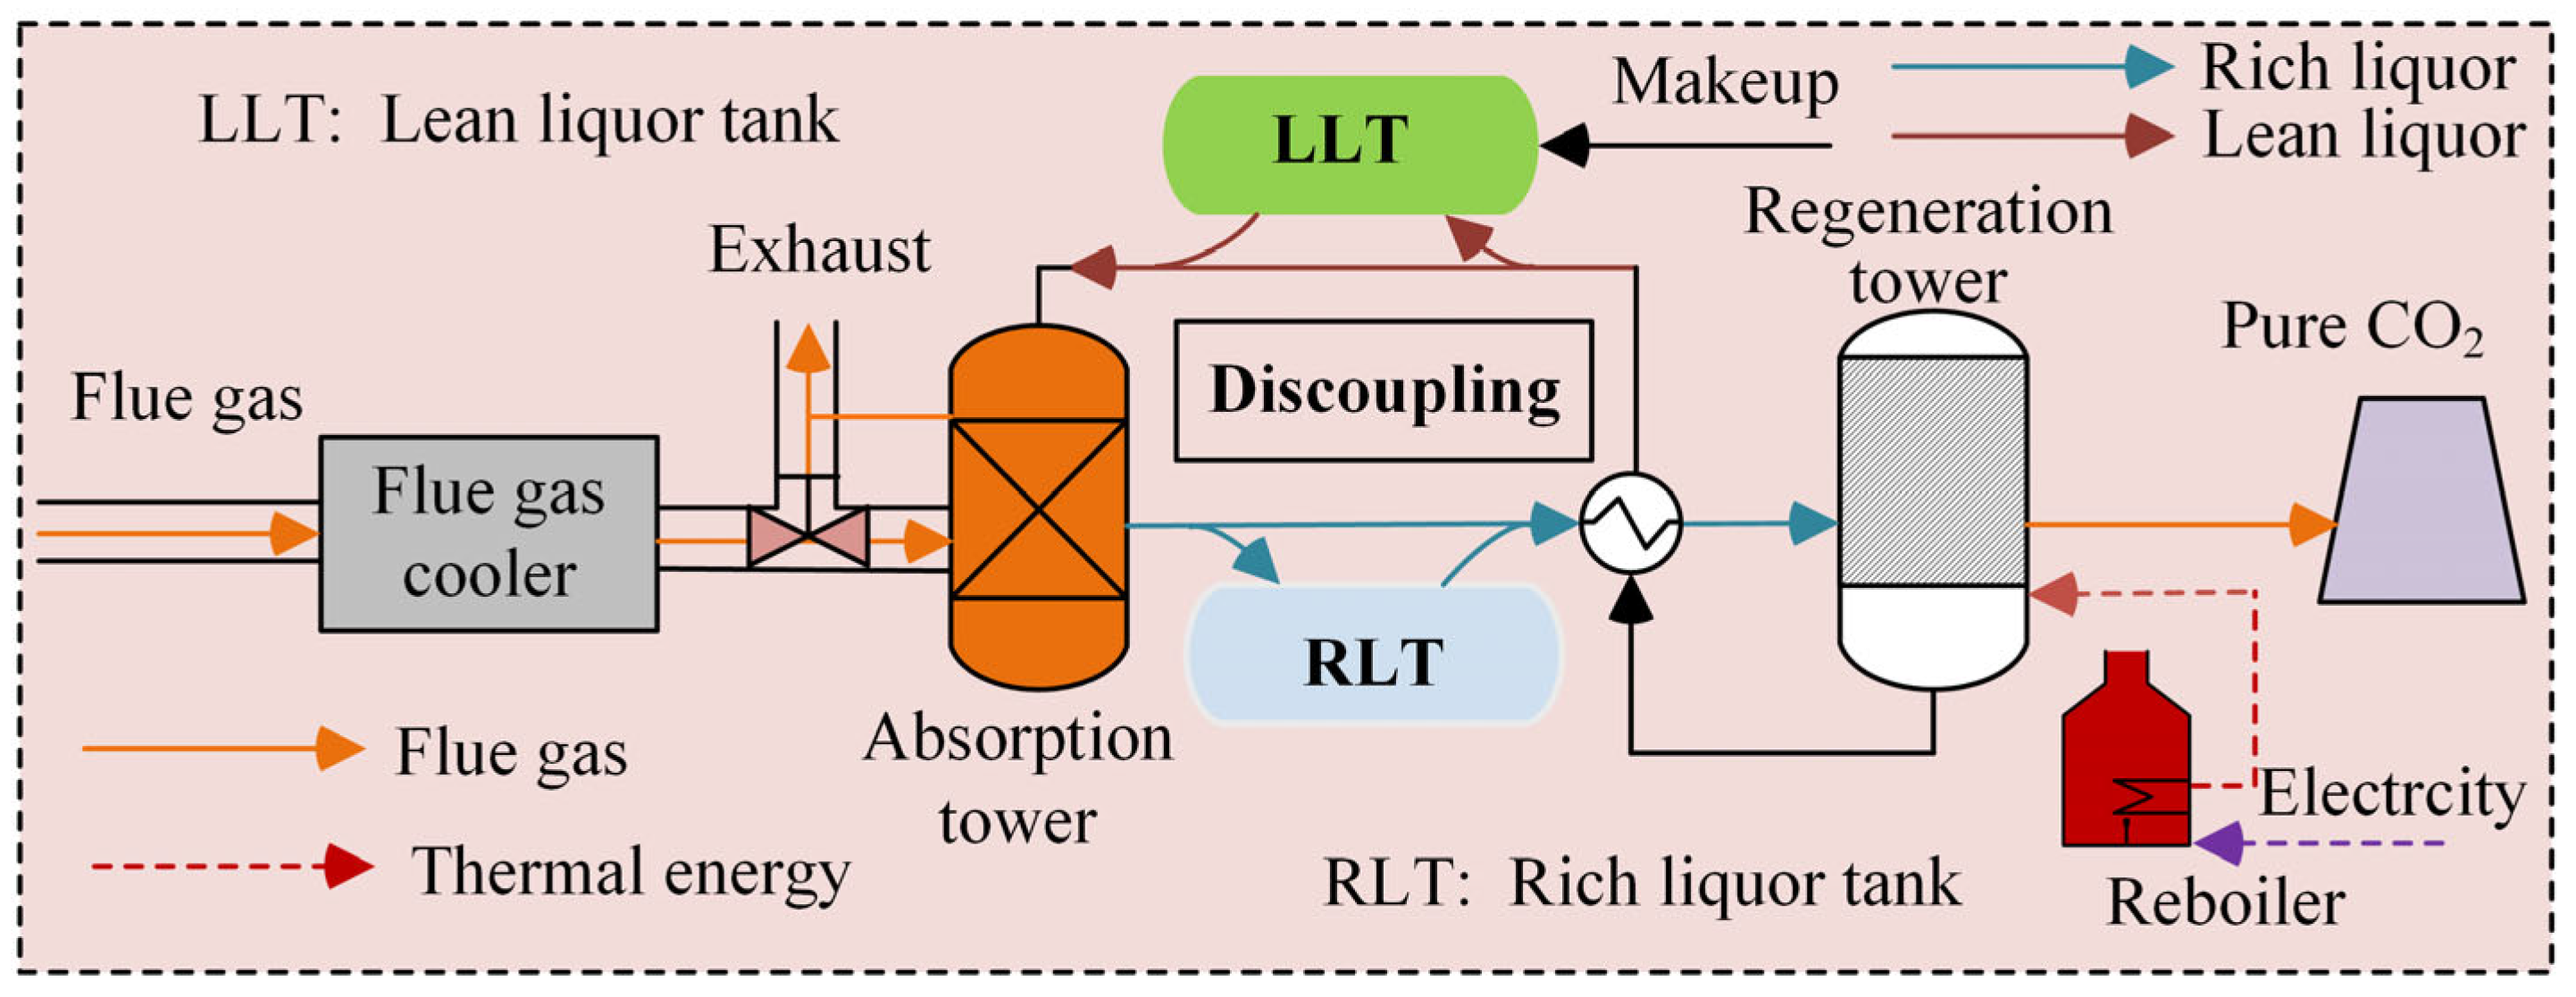
2. Analysis and Modeling of CCUS

The CCUS system is integrated with the IES using an integrated flexible CCS system with storage tanks for lean and rich liquor and a two-stage P2G system with multiple hydrogen utilizations including fuel cells and hydrogen-blended CHP units to achieve the deep low-carbon operation of the IES with a high penetration level of renewables. The structure of the IES integrated with the CCUS is shown in Figure 1.
In the presented IES, the electrical demand is mainly satisfied by a coal-fired power plant, wind power, a hydrogen-blended CHP unit, and an HFC. Additionally, the thermal demand is met by the hydrogen-blended CHP unit, GB, and TES. Also, the gas demand is satisfied by the P2G facility and the purchased natural gas. Moreover, the IES only purchases electricity from the grid without selling electricity back, reducing the stress on the power grid. Based on this structure, the integrated flexible CCS system and the two-stage P2G system with multiple utilizations of hydrogen enhance flexibility and aid in the disturbance response to wind power uncertainty.

2.1. The Model of Integrated Flexible CCS

The carbon dioxide absorption and regeneration stages of the split-flow CCS of flue gas are mutually coupled. During times of peak electricity demand, the coal-fired power plant ramps up its output. It is noted here that an increase in the carbon dioxide absorption intensity during this time will lead to an increase in energy consumption in the regeneration and compression stages. Thus, the net power capacity of the power plant with CCS decreases, resulting in major challenges in balancing carbon capture and power supply demands. To address this problem, storage tanks for lean and rich liquor are added between the absorption and regeneration towers. By adopting this approach, the rich liquor processed by the regeneration tower is no longer solely dependent on the rich liquor generated by the absorption tower, allowing the decoupling of absorption and regeneration stages. In addition, the flue gas can also be directly discharged into the atmosphere through the split-flow of flue gas in extreme cases, so as to enhance the flexibility of the CCS system. The improved structure of the integrated flexible CCS system is presented in Figure 2.
The energy consumption of CCS systems includes the basic and the operational demands. Considering this division, the basic demand is independent of the operational state of the CCS system. Thus, it can be considered a constant [36]. The operational demand is directly proportional to the amount of carbon dioxide captured by the regeneration tower, which can be defined by the following mathematical model.
P C P , t = P C P , t n e t + P C C S , t P C C S , t = P B , t + P R , t P R , t = σ E c 2 , t E c 1 , t = λ t η 1 E G , t E c 2 , t = E c 1 , t + E r i c h , t E C C S , t = η 2 E c 2 , t
where P C P , t denotes the total power of the coal-fired power unit; P C P , t n e t and P C C S , t are the net output of coal-fired power plant with CCS and the energy consumption power of CCS, respectively; σ represents the energy consumption per unit of carbon dioxide captured by CCS; λ t represents the split ratio of flue gas; E c 1 , t and E c 2 , t indicate the amount of carbon dioxide absorbed in the absorption tower and regenerated to be processed in the regeneration tower, respectively; η 1 and η 2 denote the respective absorption and regeneration efficiencies; E r i c h , t is carbon dioxide extracted from the rich liquor tank, where positive value represents a flow from rich liquor tank to regeneration tower and negative value represents a flow from absorption tower to rich tank; and E C C S , t is the actual carbon capture.
For the storage tanks for lean and rich liquor, the following constraints need to be satisfied [34].
E r i c h , t = χ C O 2 v r i c h , t v r i c h , t + v l e a n , t = 0 V r i c h , t = V r i c h , t 1 v r i c h , t V l e a n , t = V l e a n , t 1 v l e a n , t V r i c h , 0 = V r i c h , 24 V l e a n , 0 = V l e a n , 24
where V r i c h , t and V l e a n , t denote the storage content of the rich liquor tank and the lean liquor tank, respectively; v r i c h , t and v l e a n , t denote the flow rates of the rich liquor tank and the lean liquor tank, respectively; and χ C O 2 represents the density of carbon dioxide solution in the rich liquor tank.

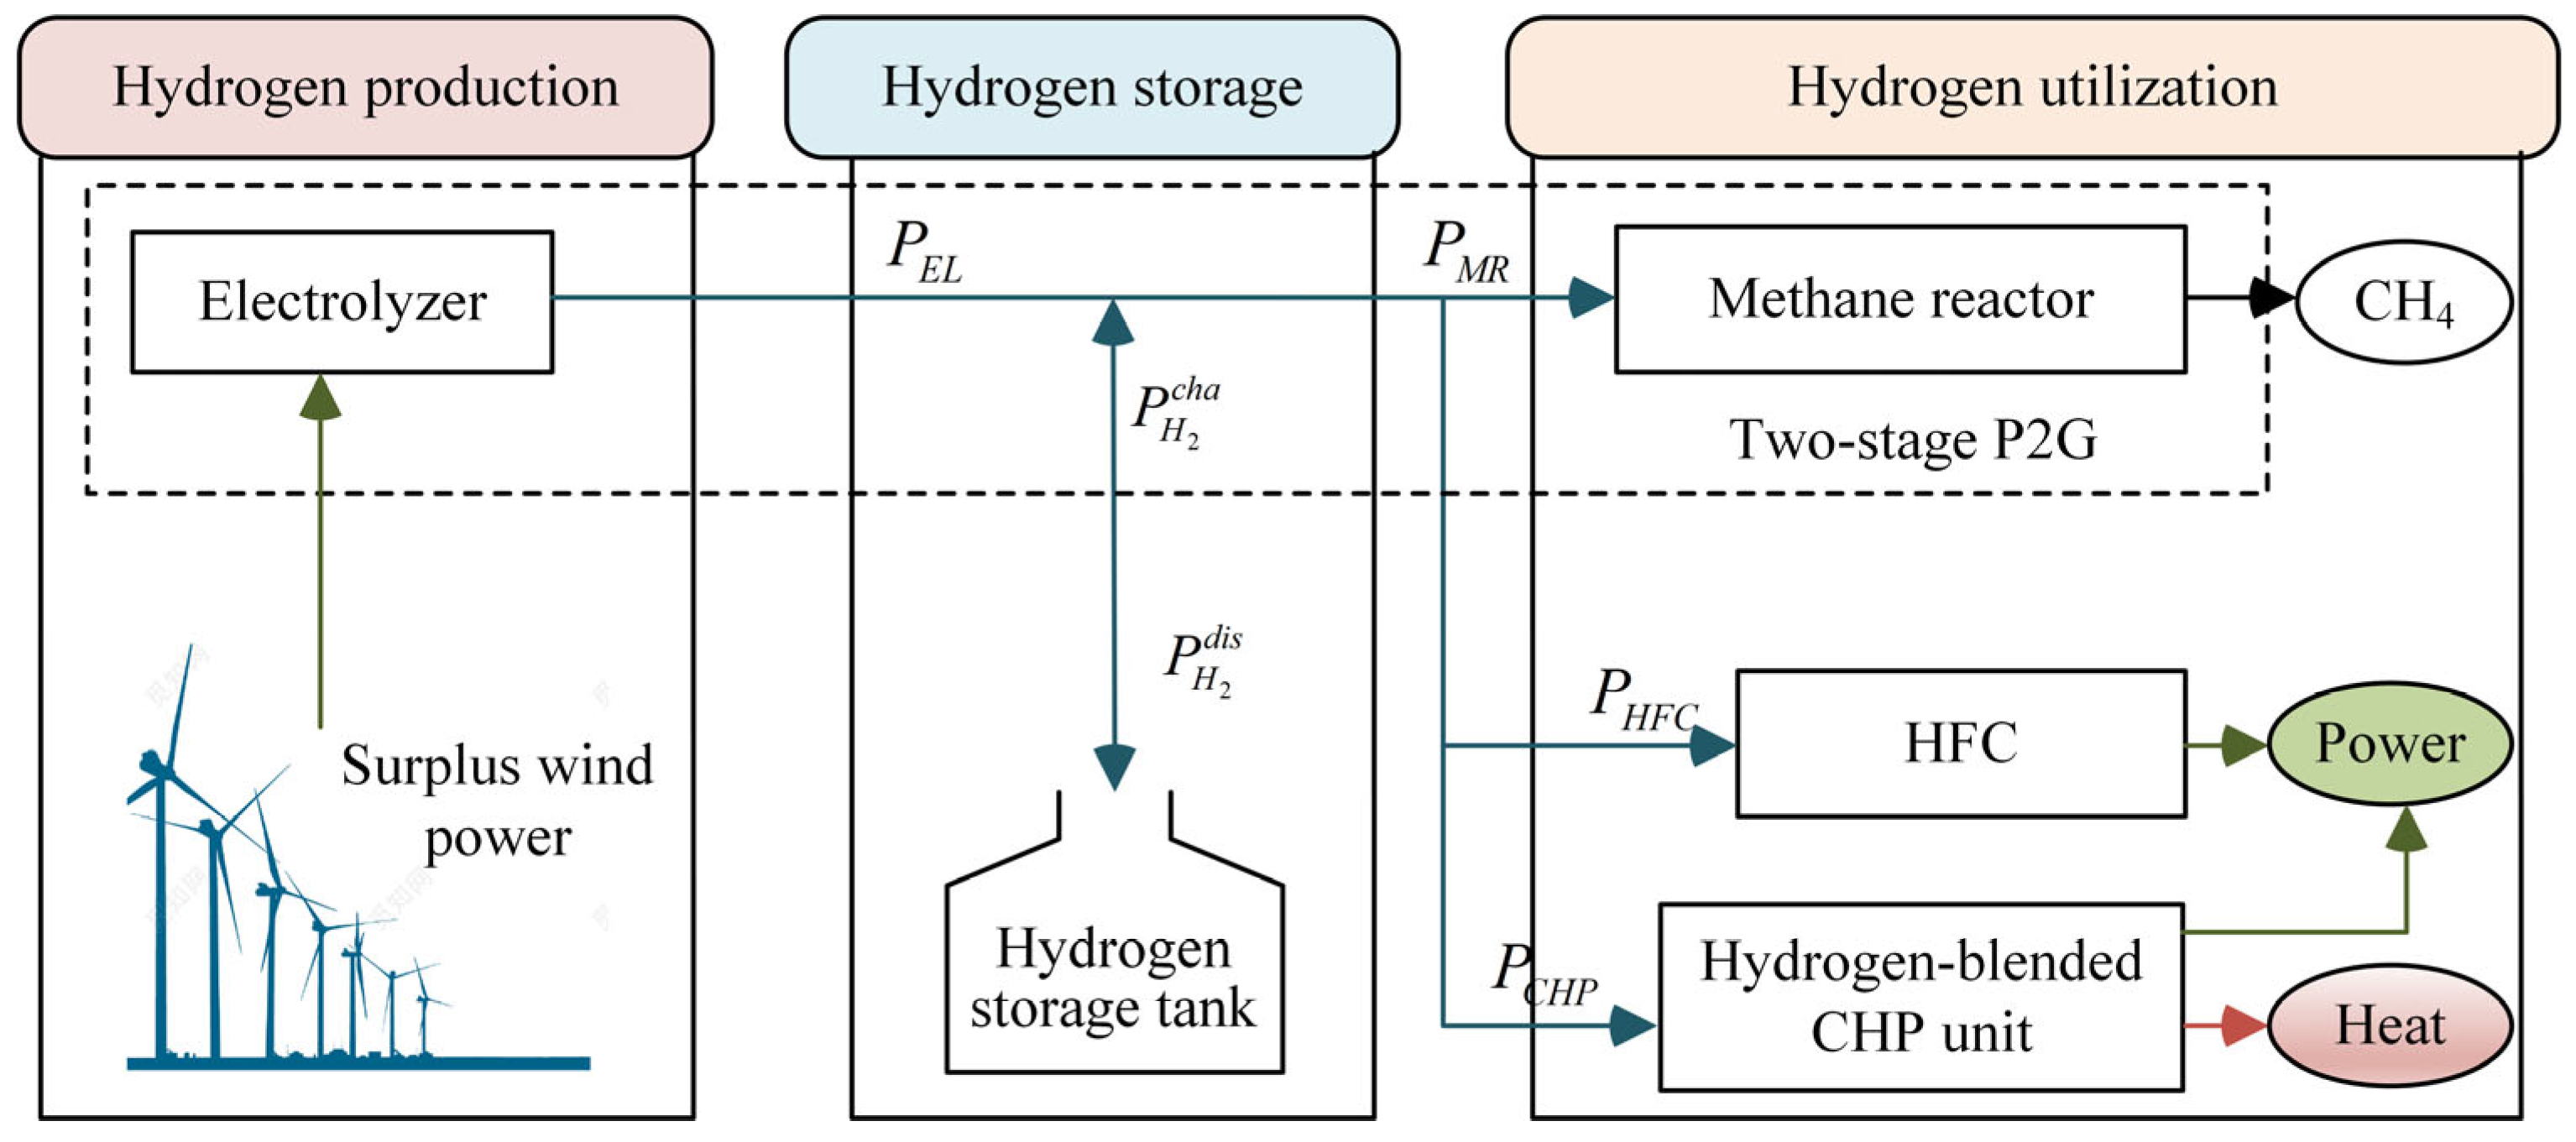
2.2. The Model of Two-Stage P2G with Hydrogen Multiple Utilization

To maximize the low-carbon advantages of hydrogen and increase the overall energy conversion efficiency of P2G, its process is divided into two different stages: hydrogen generation and methane conversion. The structure of two-stage P2G with multiple utilizations of hydrogen is constructed and shown in Figure 3.
The two-stage P2G system with multiple hydrogen utilizations comprises an EL, MR, HST, HFC, and a hydrogen-blended CHP unit. Herein, excess wind energy is converted into other types of energy for storage and utilization through the P2G system to enhance the flexibility of the IES. The hydrogen produced by the EL is used for methane synthesis, along with the carbon dioxide captured by the CCS system. Also, part of this is used for supplying hydrogen to the HFC and the hydrogen-blended CHP unit. Additionally, the hydrogen storage tank stores excess wind energy in the form of hydrogen and can be supplied to the IES during peak energy demand periods. Overall, the structure of hydrogen multiple utilization proposed here can fully leverage the low-carbon benefits of hydrogen energy in addition to enhancing the flexible regulation capability of the IES, which enhances the utilization of wind power and reduces carbon emissions. The model is expressed as [35]
P E L , t H 2 = η E L P E L , t P M R , t C H 4 = η M R P M R , t H 2 0 P E L , t P E L max 0 P M R , t H 2 P M R H 2 , max
where the subscripts of EL and MR are the electrolyzer and methane reactor, respectively. P E L , t and P E L , t H 2 represent the electrical power consumed for electrolysis in the EL and the hydrogen production power, respectively. P M R , t H 2 and P M R , t C H 4 are the hydrogen power consumption and methane power production of the methane reactor, respectively. η E L and η M R represent the efficiencies of the EL and methane reactor, respectively. P E L max and P M R H 2 , max represent the respective maximum power consumption of the electrolysis tanks and the maximum power consumption of hydrogen of the methane reactor, respectively.
In addition, the HFC can convert the energy generated from the combustion of hydrogen gas into electricity. The model is as follows:
P H F C , t = η H F C P H F C , t H 2 0 P H F C , t P H F C max
where the subscript HFC is the hydrogen fuel cell; P H F C , t and P H F C , t H 2 are the output electrical power and the input power of the HFC, respectively; η H F C denotes the conversion efficiency of the HFC; and P H F C max represents the maximum electrical power output of the HFC.
It is noteworthy that the loss of hydrogen energy during the charging and discharging of the hydrogen storage tank can be effectively modeled by incorporating charging and discharging efficiencies. The respective mathematical models are as follows:
E H S T , t H 2 = P H S T , t 1 H 2 + η H S T c h a P H S T , t H 2 , c h a t η H S T d i s P H S T , t H 2 , d i s t P H S T , 0 H 2 = P H S T , 24 H 2
where the subscript HES is the hydrogen storage tank; E H E S , t H 2 represents the energy of hydrogen stored in the hydrogen storage tank; P H S T , t H 2 , c h a and P H S T , t H 2 , c h a are the hydrogen power of charging and discharging of the hydrogen storage tank, respectively; and η H S T c h a and η H S T d i s are the charging and discharging efficiencies of the hydrogen storage tank, respectively.
In addition, natural gas can be mixed with hydrogen generated from the electrolyzer within a certain hydrogen blending ratio range. This mixture is then supplied to the hydrogen-blended CHP unit. Since the gas turbine units have little impact on their operation when the hydrogen blending ratio is set between 0% and 20%, and considering that the thermoelectric ratio is adjustable within a certain range, the electrical and thermal output ratio can be flexibly adjusted during operation according to the real-time electrical and thermal demands. The model of the hydrogen-blended CHP unit is thus given as
κ t = P C H P , t H 2 L H V H 2 / P C H P , t H 2 L H V H 2 + P C H P , t N G L H V C H 4 0 κ t 20 % P C H P , t = L H V m i x P C H P , t H 2 L H V H 2 + P C H P , t N G L H V N G L m i x = κ t L H V H 2 + [ ( 1 κ t ) ] L H V N G P C H P , t + H C H P , t = η C H P P C H P , t m i x ρ C H P min H C H P , t = ρ C H P max P C H P , t
where LHV is the low heating value; κ t is the hydrogen blending ratio of fuel gas; P C H P , t H 2 and P C H P , t C H 4 are the power of hydrogen and natural gas consumed by the hydrogen-blended CHP unit, respectively; P C H P , t m i x is the energy power of mixed flue gas consumed by the CHP unit; L H V m i x , L H V H 2 , and L H V C H 4 are the low heating values of mixed flue gas, hydrogen, and methane, respectively; P C H P , t and H C H P , t are the electrical and heat power of output of the CHP unit, respectively; η C H P represents the overall efficiency of the CHP unit calculated as the sum of electrical and heat conversion efficiencies; and ρ C H P min and ρ C H P max are the adjustable upper and lower limits of the thermoelectric ratio of the CHP unit.

3. Deep Low-Carbon Economic Optimization

3.1. Stepwise Carbon Trading Model

The stepwise carbon trading model is based on actual carbon emissions and initial carbon emission quotas. Its model is adopted in this study, where the actual carbon emissions are expressed as the difference between the carbon dioxide emissions from the emission sources (e.g., coal-fired power unit, hydrogen-blended CHP unit, gas boilers) and captured by the CCS system [37],
E I E S = E G + E C H P + E G B E C C S E G = t = 1 T ε P G , t E C H P = t = 1 T λ N G ϕ h - e P C H P , t N G E G B = t = 1 T λ N G ϕ h - e P G B , t N G
where ε denotes the carbon emission intensity of the coal-fired power plant; λ N G indicates the carbon content per unit calorific value of natural gas; ϕ h - e is the thermoelectric conversion coefficient; and P G B , t N G denotes the energy power of natural gas consumed by GB. Herein, all of the heat units are converted into power units.
The baseline approach is used to confirm the number of allocations of the initial carbon emission quotas. The specific allocation of carbon emission rights involves the hydrogen-blended CHP unit and the coal-fired power unit. The calculation formula for the initial carbon emission quotas is defined as
E I E S 0 = E C P 0 + E C H P 0 ; E C P 0 = χ C P t = 1 T P C P , t E C H P 0 = χ C H P e t = 1 T P C H P , t + χ C H P h ϕ h - e t = 1 T H C H P , t
where E I E S 0 , E G 0 , and E C H P 0 indicate the initial quotas of carbon emissions, the coal-fired power unit, and the hydrogen-blended CHP unit, respectively; χ C P represents the power supply reference value of the coal-fired power unit; and χ C H P e and χ C H P h denote the electrical and thermal power supply value of the CHP unit, respectively.
After the calculation of the free quotas and the actual emissions of carbon dioxide, the difference between them represents the amount of carbon traded in the carbon market, as illustrated below.
E = E I E S E I E S 0
Furthermore, to regulate carbon emissions, this study adopts a carbon trading mechanism that is similar to tiered electricity pricing. Implementing a unified carbon trading system involves the introduction of a carbon emission interval to evaluate the cost of carbon trading. In this scenario, when the variance between actual emissions and free quotas surpasses a specified interval, the price of carbon trading rises. Conversely, surplus carbon emission allowances can be sold to generate revenue. In addition, the study introduces a compensation coefficient, which increases the incentives and penalties for emissions reduction. Accordingly, the model of the tiered carbon trading cost is presented as
f t C O 2 = χ ( 2 + 3 δ ) L + χ ( 1 + 3 δ ) ( E + 2 L ) , E 2 L χ ( 1 + δ ) L + χ ( 1 + 2 δ ) ( E + L ) , 2 L E L χ ( 1 + δ ) E , L E 0 χ E ,   0 E L χ L + χ ( 1 + θ ) ( E L ) , L E 2 L χ ( 2 + θ ) L + χ ( 1 + 2 θ ) ( E 2 L ) , 2 L E
where χ represents the carbon trading price; θ denotes the growth rate of the carbon trading price; L denotes the length of the carbon emission interval; δ represents the compensation factor; and f t c o 2 represents the carbon trading cost, where a positive value is used for a purchase and a negative value is used for a sale.

3.2. Integrated Demand Response Model

The flexible load of electrical and heat load in the IES mainly refers to the transferable loads, which can be represented by the specific mathematical model below,
P L , t = P D R , t + P t r a n , t a P L , t P t r a n , t a P L , t t = 24 T P t r a n , t = 0 H L , t = H D R , t + H t r a n , t b H L , t H D R , t b H L , t t = 24 T H t r a n , t = 0
where P L , t and H L , t are the electrical and heat load, respectively; P t r a n , t and H t r a n , t represent the electrical and heat load transferred at time t, respectively; a and b are the transferable ratios of electrical and heat loads, respectively; and P D R , t and H D R , t represent the electrical and thermal load after comprehensive demand response implementation, respectively.

3.3. Objective Function

The deep low-carbon economic optimization model aims to minimize the total cost of the IES.
min F = min ( F c o a l + F g a s + F D R + F t a d e + F s t o r e + F c u r + F i n )
where F represents the total operational cost of the IES, which includes the purchase cost of coal of the coal-fired power plant ( F C P ) and natural gas ( F N G ), the demand response cost ( F D R ), the carbon trade cost ( F t r a d ), the carbon storage cost ( F s t o r e ), the curtailment penalty cost of wind power ( F c u r ), and the investment cost of CCUS ( F i n ). The purchase cost of coal is expressed as
F C P = t = 1 T c c o a l P C P , t
where c c o a l represents the power supply cost of the coal-fired power units.
The purchase cost of natural gas is defined as
F N G = t = 1 T c N G ϕ h - e P b u y , t N G L H V N G
where c N G represents the unit price of natural gas.
The demand response cost is defined as
F D R = t = 24 T ( c t r a n , e P t r a n , t + c t r a n , h H t r a n , t )
where c t r a n , e and c t r a n , h represent the unit electrical and heat load transfer costs, respectively.
The carbon trading cost is defined as
F t a d e = t = 1 T f t C O 2
Upon completion of the entire carbon capture process, a CCUS treatment is required for the captured carbon dioxide. The treated carbon dioxide is first supplied to the methane reactor of the P2G system as a reactant, and the remaining portion is stored. This approach promotes carbon recycling and saves on carbon storage costs. Under ideal conditions, the methanation chemical reaction formula highlights that the volume of carbon dioxide consumed in the reaction should be equal to the volume of methane produced. Accordingly, the carbon store cost is defined as
E P 2 G , t = ϕ h - e ρ C O 2 P C H P , t H 2 L C H 4 F s t o r e = δ c s t = 1 T ( E C C S , t E P 2 G , t )
In Equation (17), E P 2 G , t indicates the amount of carbon dioxide required for the P2G; ρ C O 2 denotes the carbon dioxide gas density; and δ cs denotes the unit cost of storing carbon dioxide.
The curtailment cost of wind power is expressed as
F c u r = t = 24 T c c u r ( P W P max P W P , t )
where c c u r indicates the curtailment cost of unit wind power.
The daily depreciation cost of CCS includes the depreciation cost of the split-flow devices of flue gas and the depreciation cost of the liquid storage tank.
F i n = F C C S ( 1 + α ) N C C S α 365 ( ( 1 + α ) N C C S 1 ) + c r i c h V r i c h , max ( 1 + α ) N r i c h α 365 ( ( 1 + α ) N r i c h 1 )
where α represents the depreciation rate of CCS, F C C S is the total cost of the split-flow CCS of flue gas, V r i c h , max is the depreciation period of the split-flow CCS of flue gas, c r i c h is the total cost of the liquid storage tank in unit volume, and V r i c h , max and N r i c h are the total volume and depreciation years of the liquid storage tank, respectively.

3.4. Constraints

The constraints of the deep low-carbon economic optimization model include the energy balance constraint, the device operation constraint and the purchase constraints of natural gas.

3.4.1. Energy Balance Constraints

The IES comprises four kinds of energy flow, namely electricity, heat, gas and hydrogen. Accordingly, the energy balance constraints are expressed as
P G , L , t + P W P , t + P C H P , t + P H F C , t = P D R , t + P L , t H C H P , t + H G B , t = H D R , t + H T E S , t c h a H T E S , t d i s P M R , t C H 4 + P b u y , t N G = P C H P , t N G + P G B , t N G + P L , t N G P E L , t H 2 = P M R , t H 2 + P H F C , t H 2 + P C H P , t H 2 + P H S T , t H 2 , c h a P H S T , t H 2 , d i s
where P W G , t represents the actual power output of wind power; P L , t N G represents the load power of natural gas of IES; H G B , t denotes the heat power output of the gas boiler; and H T E S , t c h a and H T E S , t d i s represent the heat power of charging and discharging the thermal storage tank, respectively.

3.4.2. Device Operation Constraints

The wind power needs to meet the following limitation:
0 P W P , t P W P max
where P W P max represents the predicted (maximum) power output of wind power.
The operation constraint of the CCS is defined as
λ min λ t λ max 0 P R , t ϖ τ μ 1 ε P C P max
where λ min and λ max denote the upper and lower limits of the split ratio of the flue gas shunt device, respectively; and τ denotes the maximum operating condition coefficient of the regeneration tower and compressor.
The operation constraint of the gas boiler is expressed as
H G B , t = η G B P G B , t N G 0 H G B , t H G B max
where H G B , t denotes the heat power output of the gas boiler; P G B , t N G denotes the power of natural gas consumed by the gas boiler; η E B denotes the conversion efficiency of the gas boiler; and H G B max denotes the maximum heat power output of the gas-fired boiler.
It is worth noting here that the response speed and rapid power changes during the energy conversion process could lead to unsafe equipment operation. To ensure the stable operation of the device, the input power needs to satisfy ramp constraints.
P i min P i , t + 1 P i , t P i max
where i represents the input power of the i-th energy conversion device, which includes the coal-fired power plant, EL, MR, HFC, hydrogen-blended CHP unit, and gas boilers. P i min and P i max represent the upper and lower limits of the energy conversion equipment climbing power, respectively.
The TES and HST are also subject to the constraints presented in Equations (2) and (5). The TES model is similar to the HST.

3.4.3. Purchase Constraints of Natural Gas

This paper assumes that the IES is directly connected to the natural gas network. The power of the interconnection lines must be limited to a certain range to ensure the operational safety of IES, as highlighted in the equation below.
0 P b u y , t N G P b u y N G , max
where P b u y , t N G is the natural gas purchase power.

3.5. Solution

The model established in this study comprises nonlinear terms related to the stepwise pricing mechanism. As a result, the deep low-carbon economic optimization model is a mixed-integer nonlinear optimization model, which is difficult to solve directly. Conventional heuristic algorithms are normally used for the solution [16], but they tend to produce local optima. In this case, the optimization results lack repeatability. To address this, this paper adopts a piecewise linear approximation technology to address the nonlinear terms presented in Equation (10). It allows for transforming the model into a mixed-integer linear model. The commercial solver GUROBI is then utilized within MATLAB in the solution process.

4. Case Study

To substantiate the efficacy of the proposed method and the associated model formulation, a case study of an industrial park IES in Baoding, Hebei, is considered for demonstration and evaluation purposes. The typical wind power profile and the gas, heat, and power load curves are presented in Figure 4. Additionally, the parameters of various facilities in the IES are shown in Table 1. The lower heating values of natural gas and hydrogen in the park are considered as 39 MJ/m3 and 11 MJ/m3, respectively. The power-to-heat conversion coefficient is set at 3600 MJ/MW·h, and the purchase price of natural gas is set at CNY 3.79/m3.
To analyze the impacts of the integrated flexible CCS system, coupled with the two-stage P2G system with multiple hydrogen utilizations, on the deep low-carbon economic optimization of the IES, four cases are defined for investigation and evaluation in this study. The four cases considered are as follows:
Case 1: The IES integrated without a CCUS system;
Case 2: The IES integrated with a split-flow CCS system of flue gas;
Case 3: The IES integrated with an integrated flexible CCS system;
Case 4: The IES integrated with a CCUS system.

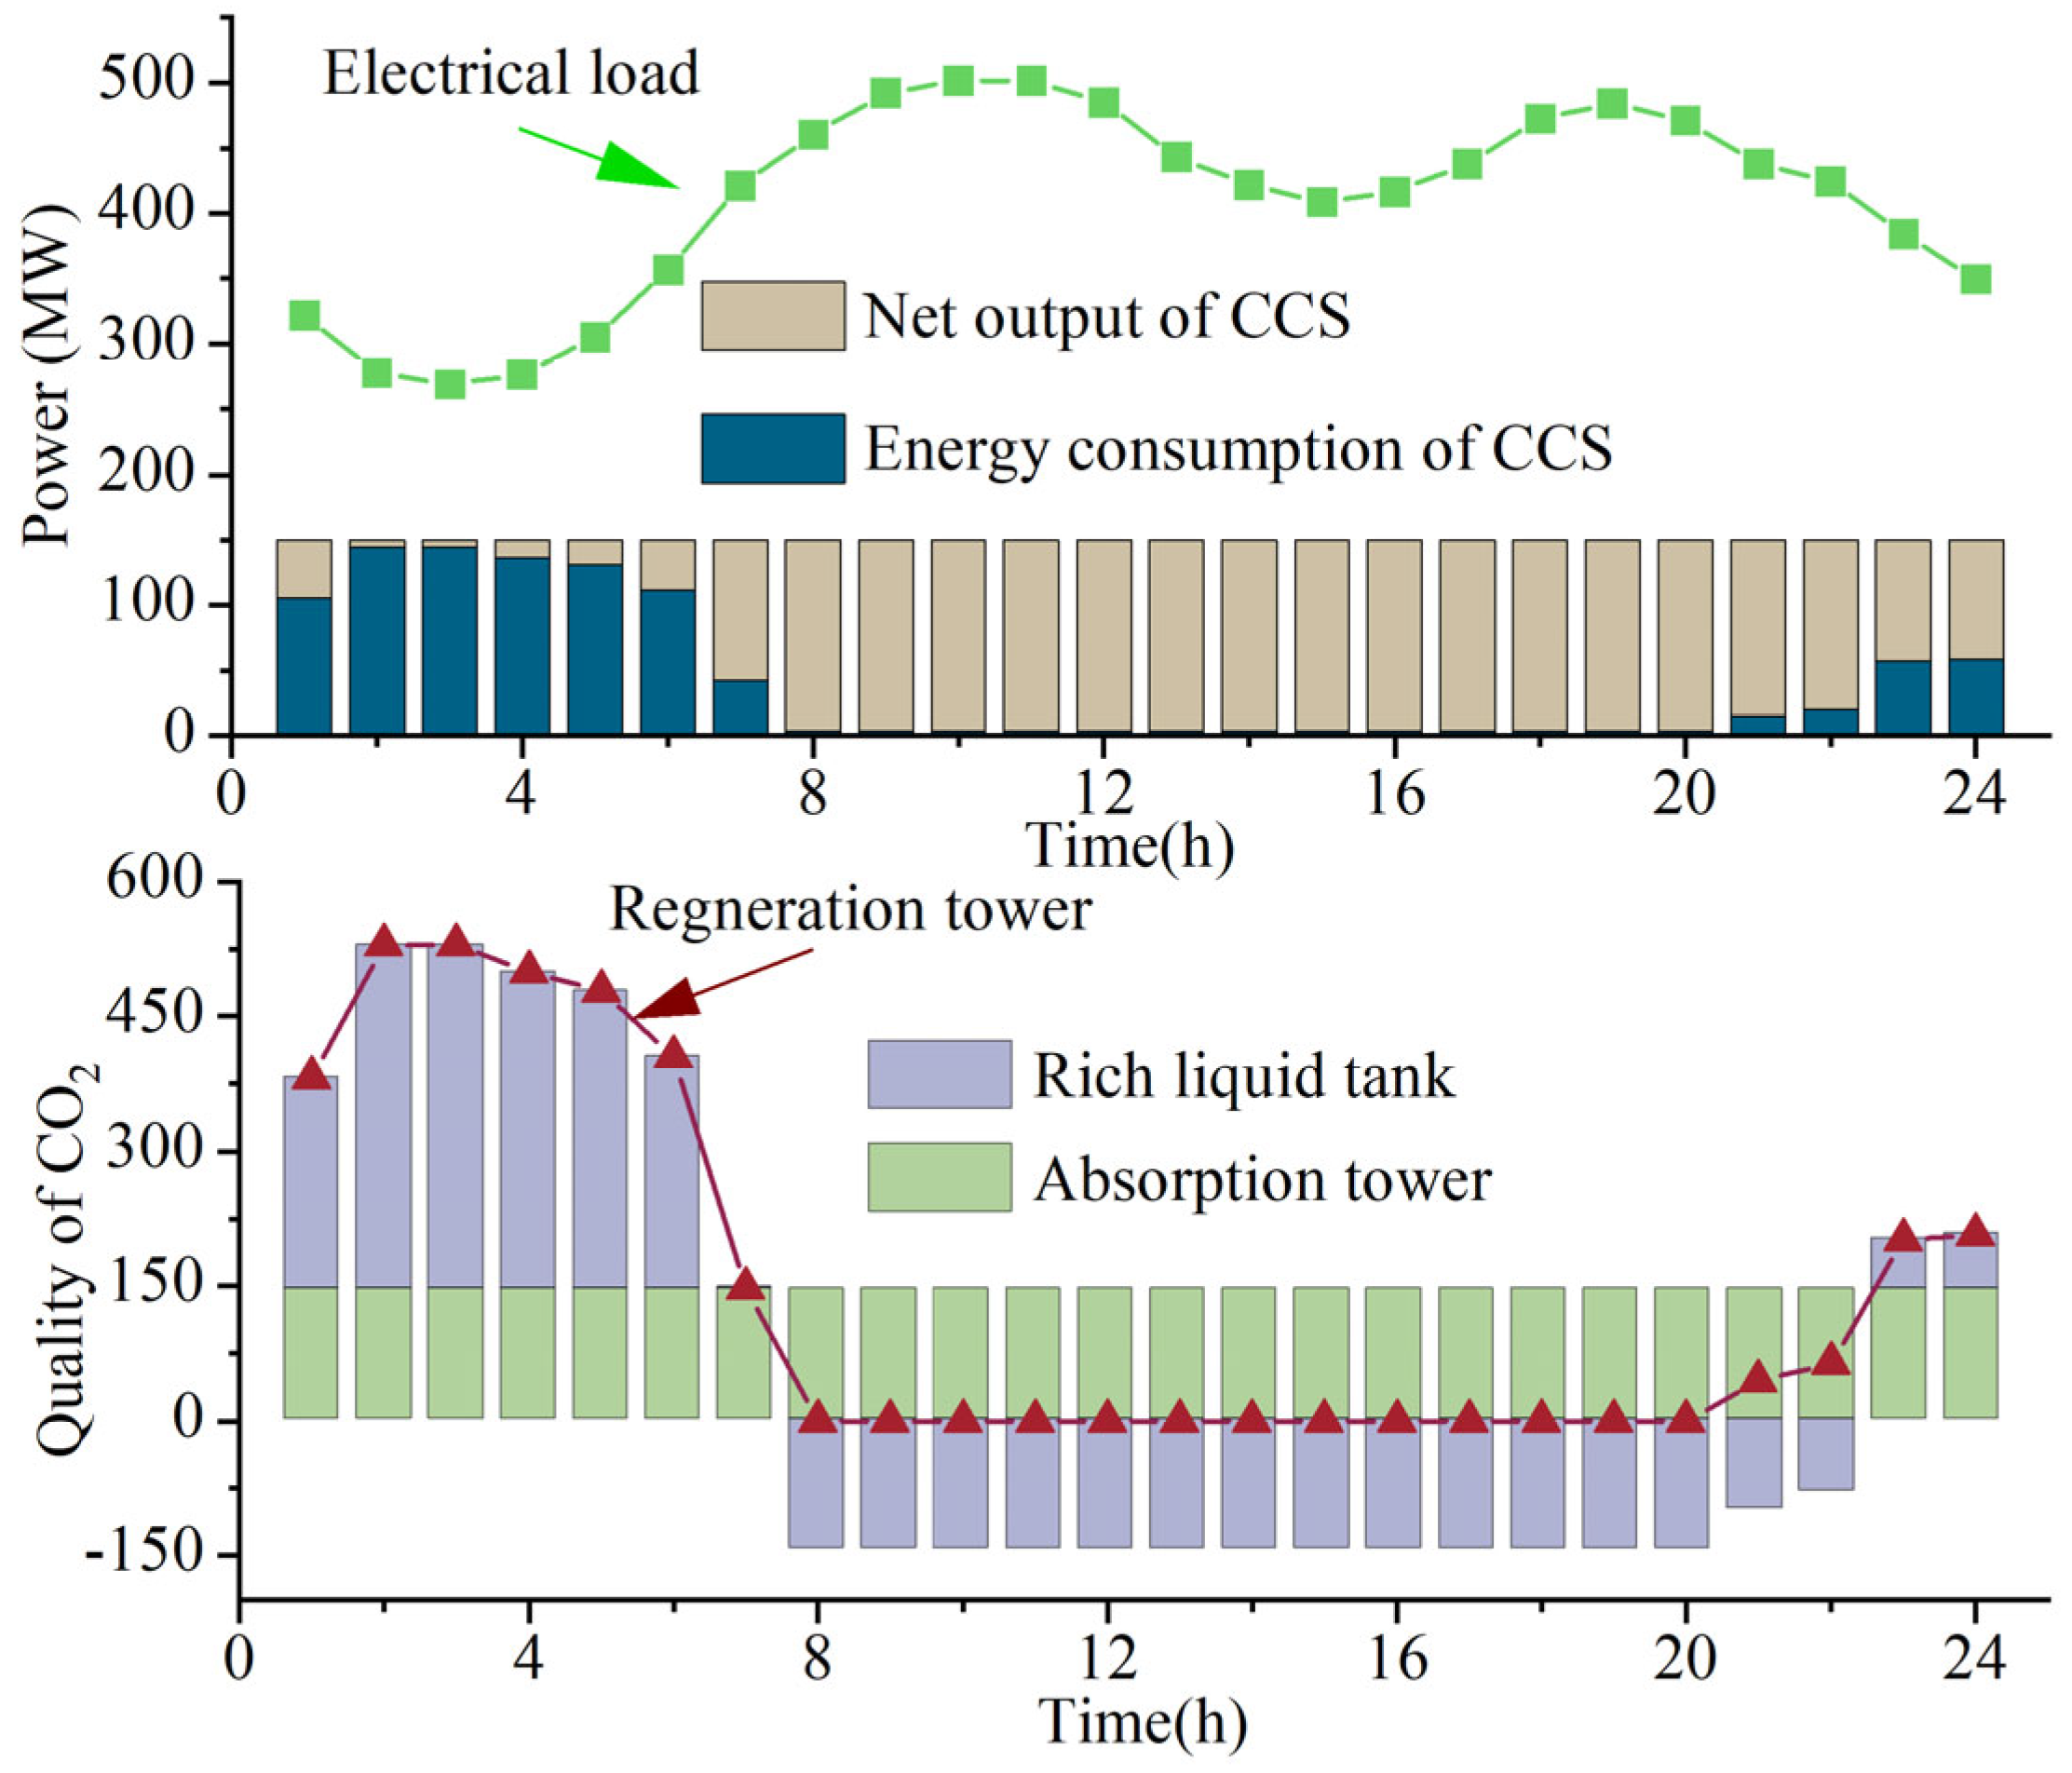
4.1. Optimization Results

The deep low-carbon economic optimization method of the IES was implemented under the four scenarios defined above. The results are shown in Table 2.
The total cost of the IES without a CCUS system for Case 1 is CNY 5792.1 thousand. The corresponding costs of coal purchasing, gas purchasing, carbon trading, wind curtailment penalties, and demand response are CNY 1525.2 thousand, CNY 2786.7 thousand, CNY 424.5 thousand, CNY 1043.8 thousand, and CNY 11.8 thousand, respectively. Among these different costs, the gas purchase cost is the highest, accounting for around 48.11% of the total operational cost. In addition, the exploitation efficiency of wind power is 69.33%, and the net carbon emissions of the IES is 4871.1 tons.
In Case 2, by integrating the split-flow CCS of flue gas, the net carbon emissions of the IES decreases to 2658.2 tons, representing a reduction of 54.57% in comparison to Case 1. In addition, the carbon trading cost decreases from CNY 424.5 thousand to CNY −206.3 thousand, leading to a 10.89% reduction in the total cost of the IES compared to Case 1. Additionally, the results in Case 2 show that the split-flow CCS system of flue gas leads to additional power consumption, reducing the actual output of the coal-fired power unit and accommodating additional wind power consumption. Thus, the utilization rate of wind power increases from 67.79% to 74.53%. Significantly, the integration of the CCS system within the IES increases the investment cost of CCS, and the overall energy consumption and the cost of coal and gas purchases exhibit a slight increase. Nevertheless, the reductions in carbon trading costs and wind curtailment penalties are substantial enough to counterbalance the rise in investment, gas purchasing, and coal purchasing costs. As a result, this leads to an overall reduction in the total cost. In Case 3, the addition of the storage tanks in the split-flow CCS system of flue gas allows for the decoupling of the lean and rich liquor, which improves the flexibility of the IES. Thus, the utilization rate of wind power increases from 75.99% in Case 2 to 85.85%. In this case, the curtailment penalty cost of wind power decreases to CNY 181.7 thousand. These results highlight that the decoupling and time-shifting capabilities of the storage tanks of lean and rich liquor can further reduce the amount of flue gas emitted directly from the separation process and increase the carbon capture time. Consequently, the net carbon emissions of the IES decreased from 2212.9 tons in Case 2 to 1657.3 tons in Case 3, representing a reduction of 25.11%. Correspondingly, the carbon trading cost decreased by CNY −345.4 thousand compared to Case 2. Although the integration of the storage tanks for the split-flow CCS system of flue gas leads to higher energy consumption and a slight increase in the coal purchasing cost and investment cost, the total cost still exhibits a decrease to CNY 5156 thousand, representing a reduction of 9.69%. This is mainly due to the improved wind power utilization rate and the reduction in carbon emissions.
Furthermore, when the CCUS system, including the integrated flexible CCS system and a two-stage P2G system with multiple hydrogen utilizations, is integrated into the IES (Case 4), the optimized results report an enhancement in the flexibility of the IES. This scenario allows for the full exploitation of wind power. The consumption proportion of wind power in the IES can reach 69.23%. The substitution effect of wind power can reduce coal and gas purchases in the IES. As a result, there is a decrease in the corresponding coal and gas purchasing costs to CNY 1512.0 and 2312.6 thousand, respectively. These reductions in coal and gas purchases also reduce the net carbon emissions of the IES to 1454.4 tons, a decrease of 70.14% compared to Case 1. Overall, the reductions in the consumption of coal and gas, carbon trading, and wind curtailment penalty costs lead to this case contributing the lowest total cost of the IES among the four cases, at only CNY 4166.7 thousand, a reduction of 28.06% compared to Case 1.
Overall, integrating the CCUS system including the integrated flexible CCS system and a two-stage P2G system with multiple hydrogen utilizations into an IES can reduce carbon dioxide emissions 70.14% and facilitate the full consumption of wind power. The optimized results demonstrate that the CCUS system can effectively promote the flexibility of the IES and mitigate the corresponding carbon emissions.

4.2. Discussion

The accommodation level of wind power over time under the four cases considered is shown in Figure 5. The results highlight that the periods with abundant wind power generation are 00:00–06:00 and 22:00–24:00. During these periods, it is evident that the thermal demand is relatively high, whereas the electrical demand remains low. Due to the cogeneration characteristics of the hydrogen-blended CHP unit and the output limit of the coal-fired power unit, there is an output increase in the hydrogen-blended CHP unit, while the accommodation level for wind energy decreases. This results in the curtailment of wind energy. In addition, the energy consumption for CCS in Cases 2 and 3 leads to a reduction in the net output of the coal-fired power unit compared to Case 1. This results in expanding the net output regulation range and enhancing the accommodation of wind power. As a result, the utilization rate increases from 67.79% to 85.72%. Built on Case 3, Case 4 introduces a two-stage P2G system with multiple hydrogen utilizations. In this case, the excess wind power is converted and stored as hydrogen. Part of the hydrogen is supplied to MR for natural gas production, reducing the gas purchasing costs and realizing carbon dioxide utilization. The rest of the hydrogen produced is harnessed by HFC during peak power load periods to meet the electrical demand. Therefore, the accommodation level of wind power is effectively enhanced, and the utilization rate reaches 100%.
To further analyze the flexible operation characteristics of the CCS in IESs, this paper analyzes the power distribution of a coal-fired power plant with CCS in Case 4, as shown in Figure 6. It is shown that during low load periods with a relatively high wind energy output, the carbon capture power plant maintains a minimum total output of 150 MW. This results in an increased carbon capture energy use of CCS and an elevated net output level of the coal-fire power unit. Additionally, during peak load hours with relatively lower wind power, the carbon capture power plant achieves flexible regulation of the net power output by reducing the energy consumption of CCS. At the same time, a minimum total output is maintained. Moreover, Figure 6 shows that the amounts of carbon dioxide treated by the absorption tower and regeneration tower are not equal in all dispatch periods. In peak load periods, the absorption tower captures and stores all of the generated carbon dioxide in the rich liquor tank without regeneration to increase the net output of the coal-fire power unit to supply the load. Nevertheless, in periods with abundant wind energy, the excess wind energy is utilized to regenerate both the stored carbon dioxide in the rich liquid tank and the newly captured carbon dioxide from the absorption tower. It is worth noting here that in Case 2, the energy consumption for the carbon capture is restricted by the coupling of the absorption tower and the regeneration tower. In contrast, the addition of a liquid storage tank in Case 3 eliminates the space limitation. Therefore, it has the ability to dynamically adjust the net output of the carbon capture power plant. The carbon capture power plant boosts the net output during peak load periods to offset the output of the hydrogen-blended CHP, thereby decreasing the net output of the coal-fired power unit during low load periods to enhance the utilization of wind power and reduce carbon emissions. As a result, it is reported that the gas purchase of the IES is reduced from CNY 2901.9 thousand in Case 2 to CNY 2560.5 thousand in Case 3, improving its economic efficiency.
The optimal operation results of power, heat, natural gas, and hydrogen for each device in Case 4 are shown in Figure 7a. The demand from users and the EL is met by the coal-fired power unit, the hydrogen-blended CHP unit, wind power, and the HFC. It is highlighted that 00:00–07:00 and 22:00–24:00 are the two periods with curtailment of wind power. At these times, the coal-fired power unit maintains a low net output to increase the accommodation of wind power. This process is equivalent to using part of the curtailed wind to supply carbon capture energy consumption, reducing carbon emissions while consuming wind power and enhancing the low-carbon economic performance of IESs. Additionally, the EL converts excess wind power into stored hydrogen and cooperates with the coal-fired power unit to achieve the deep accommodation of wind power. During the peak hours of electrical load with insufficient wind power, the power supply demand balance is achieved by increasing the output of the coal-fired power unit, the hydrogen-blended CHP unit, and the HFC to meet the electrical demand. This ensures the stable electrical operation of the IES. In addition, the heat optimization results of Case 4 are presented in Figure 7b. It is shown that the required heat load is supplied by the hydrogen-blended CHP unit, GB, and TES. In this case, the hydrogen-blended CHP unit primarily meets the heat load of the IES. This is supplemented by the GB when additional heat is needed. Additionally, excess heat is stored in the TES to be released later during periods of high heat demand. Additionally, it enhances the thermoelectric coupling characteristics of CHP and improves the operational performance of the system.
The natural gas optimization results of Case 4 are presented in Figure 7c. During the period 04:00–06:00, with the curtailment of wind power, it is shown that the MR converts surplus wind power into natural gas. This gas is then used as a resource for the hydrogen-blended CHP units and for satisfying the gas load while consuming carbon dioxide from the coal-fired power unit and hydrogen-blended CHP unit. In conclusion, the reduction in carbon emissions and the integration of surplus wind power contribute to improving the low-carbon performance of the IES.
Moreover, the hydrogen optimization results of Case 4 are presented in Figure 7d. In the wind-abundant periods of 00:00–07:00 and 22:00–24:00, it is shown that the hydrogen produced by the EL using excess wind power is converted into natural gas by the methanation device along with the carbon dioxide captured using CCS. In this case, the produced natural gas can be harnessed to satisfy the gas load or stored in the HST. Most of the hydrogen produced by the EL is sent to the HST, and only a small portion is sent to the methane reactor. The hydrogen storage tank supplies most of the hydrogen to the HFC during peak load periods, because the HFC directly generates electricity, resulting in higher energy utilization efficiency. At the same time, the HFC produces clean electricity, the system will prioritize the allocation of hydrogen energy to the HFC. However, it is foreseeable that with the progress made in gas hydrogen blending technology, the economic and environmental benefits brought about by hydrogen blending will be further improved. As a result, it is reported that the gas purchasing cost of the IES is reduced from CNY 2779.1 thousand to CNY 2312.8 thousand. This decreases the operating costs of the IES by CNY 1042.6 thousand, improving its economic efficiency.
According to the previous analysis, the carbon trading price significantly influences the optimization results, and different carbon trading price results provide different optimization results. This paper analyzes the total cost and net carbon emissions under different carbon trading prices in Case 4, and the results are shown in Figure 8. The results demonstrate that as the carbon trading price continues to increase, the total cost and net carbon emissions continue to decrease. Among them, when the carbon trading price is less than CNY 60, a low carbon trading price cannot stimulate CCUS to capture CO2, resulting in almost unchanged net carbon emissions. When the carbon trading price is between CNY 60 and CNY 160, carbon emissions show different degrees of reduction, and carbon emissions are stable at CNY 140. In conclusion, the pricing of carbon trading can effectively steer the IES towards carbon reduction and facilitate the operation of a low-carbon economy.

5. Conclusions

This study developed a carbon capture utilization and storage (CCUS) system by integrating an integrated flexible carbon capture and storage (CCS) system and a two-stage P2G system with multiple hydrogen utilizations to deeply reduce the carbon dioxide emissions and enhance the flexibility of an integrated energy system (IES) with a high proportion of renewable energy. Then, a case study of an industrial park IES in Baoding, Hebei, is considered for demonstration and evaluation purposes. The main conclusions of this study are as follows:
(1) The integrated flexible CCS system possesses the ability to transfer energy consumption. The IES with an integrated flexible CCS system outperforms that without CCS, with an 8.8% cost reduction and a 70.11% decrease in emissions. Compared to the IES integrating a full CCS, it yields reductions of 6.5% in costs and 24.7% in emissions. The results obtained in this study demonstrate the carbon benefit and the advantage of using storage tanks for lean and rich liquor in reducing emissions.
(2) Integrating the CCUS system including the integrated flexible CCS system and a two-stage P2G system with multiple hydrogen utilizations into IESs can achieve the full consumption of wind power and reduce carbon dioxide emissions by 70.11%. The optimized results demonstrate that the CCUS system can effectively enhance the flexibility of the IES with a high proportion of renewable energy and reduce the corresponding carbon emissions.
This paper mainly considers the four heterogeneous energy sources of electricity, heat, hydrogen, and gas, while ignoring cold energy. In future research, cold energy will be added to enrich the model. In addition, source-load uncertainty will also be considered in this optimization.

Author Contributions

Conceptualization, J.F.; Methodology, J.F.; Visualization, J.F., R.Y., N.N. and J.Z.; Investigation, J.Z.; Formal analysis, J.F.; Writing—Original draft, J.F., L.Y., R.Y., W.Z. and Y.H.; Writing—Review and Editing, J.F., L.Y., W.Z. and J.Z.; Resources, Supervision, J.F. All authors have read and agreed to the published version of the manuscript.

Funding

This research was funded by the Science and Technology Foundation of Guizhou Province, China (Grant No. qiankehezhicheng [2023] general 345), and also received support from the Southern Power Grid General Technology Projects (Grant No. GZKJXM20210413) and the Natural Science Special (special post) Research Fund Program of Guizhou University [2022]-48.

Institutional Review Board Statement

Not applicable.

Informed Consent Statement

Not applicable.

Data Availability Statement

Data sharing is not applicable.

Conflicts of Interest

The authors declare no conflicts of interest.

Nomenclature

P2GPower to gas
CCSCarbon capture storage
CCUSCarbon capture, utilization and storage
IESIntegrated energy system
CHPCombined heat and power
ELElectrolyzer
MRMethane reaction
HFCHydrogen fuel cell
GBGas boiler
TESThermal energy storage
HSTHydrogen storage tank
WPWind energy
NGNatural gas
Symbol
PElectrical power
HHeating power
σ Energy consumption of carbon dioxide
λ Split ratio of flue gas
EMass of carbon dioxide
η Efficiency
VCapacity of liquid tank
κ t Hydrogen blending ratio of fuel gas
LHVLow heating value
λ Carbon trading base price
θ Growth rate of the carbon trading price
δ Compensation factor
FCost
λ CH 4 Carbon content per unit calorific value of natural gas
ϕ h - e Thermoelectric conversion coefficient
ρ CO 2 Carbon dioxide gas density
vFlow rate
δ cs Unit cost of storing carbon dioxide
Superscript
netNet power
chaCharging
disDischarging
mixMixed flue gas
Subscript
tTime
CPCoal-fired power plant
leanLean liquor
richRich liquor
LLoad
tranTransferred
DRDemand response
coalCoal-fired unit
GPower grid
curCurtailment

References

  1. Wei, P.Y.; Bamisile, O.; Adun, H.; Cai, D.S.; Obiora, S.; Li, J.; Huang, Q. Bibliographical progress in hybrid renewable energy systems’ integration, modelling, optimization, and artificial intelligence applications: A critical review and future research perspective. Energy Sources Part A-Recovery Util. Environ. Eff. 2023, 45, 2058–2088. [Google Scholar] [CrossRef]
  2. Wang, H.; Zhang, Z. Construction and Application of Regional Carbon Performance Evaluation Index System: The Case of Chinese Provinces. Sustainability 2024, 16, 4460. [Google Scholar] [CrossRef]
  3. Zhang, C.; Su, B.; Zhou, K.; Yang, S. Decomposition analysis of China’s CO2 emissions (2000–2016) and scenario analysis of its carbon intensity targets in 2020 and 2030. Sci. Total Environ. 2019, 668, 432–442. [Google Scholar] [CrossRef] [PubMed]
  4. Deng, Y.; Li, S.; Liu, H.; Zhang, H.; Baeyens, J. Recent Research in Solar-Driven Hydrogen Production. Sustainability 2024, 16, 2883. [Google Scholar] [CrossRef]
  5. Holechek, J.L.; Geli, H.M.E.; Sawalhah, M.N.; Valdez, R. A Global Assessment: Can Renewable Energy Replace Fossil Fuels by 2050? Sustainability 2022, 14, 4792. [Google Scholar] [CrossRef]
  6. Wu, M.; Yan, R.; Zhang, J.; Fan, J.; Wang, J.; Bai, Z.; He, Y.; Cao, G.; Hu, K. An enhanced stochastic optimization for more flexibility on integrated energy system with flexible loads and a high penetration level of renewables. Renew. Energy 2024, 227, 120502. [Google Scholar] [CrossRef]
  7. Yan, R.; Wang, J.; Huo, S.; Qin, Y.; Zhang, J.; Tang, S.; Wang, Y.; Liu, Y.; Zhou, L. Flexibility improvement and stochastic multi-scenario hybrid optimization for an integrated energy system with high-proportion renewable energy. Energy 2023, 263, 125779. [Google Scholar] [CrossRef]
  8. Wu, M.; Fan, J.; Yan, R.; Hu, X.; Zhang, J.; He, Y.; Cao, G.; Zhao, W.; Song, D. Flexible Regulation and Synergy Analysis of Multiple Loads of Buildings in a Hybrid Renewable Integrated Energy System. Sustainability 2024, 16, 2969. [Google Scholar] [CrossRef]
  9. Wang, J.; Han, Z.; Guan, Z. Hybrid solar-assisted combined cooling, heating, and power systems: A review. Renew. Sustain. Energy Rev. 2020, 133, 110256. [Google Scholar] [CrossRef]
  10. Pal, A.; Kakran, S.; Kumar, A.; Youssef, A.B.; Singh, U.P.; Sidhu, A. Powering squarely into the future: A strategic analysis of hydrogen energy in QUAD nations. Int. J. Hydrogen Energy 2023, 49, 16–41. [Google Scholar] [CrossRef]
  11. Wang, H.; Hua, P.; Wu, X.; Zhang, R.; Granlund, K.; Li, J.; Zhu, Y.; Lahdelma, R.; Teppo, E.; Yu, L. Heat-power decoupling and energy saving of the CHP unit with heat pump based waste heat recovery system. Energy 2022, 250, 123846. [Google Scholar] [CrossRef]
  12. Pan, Z.; Guo, Q.; Sun, H. Interactions of district electricity and heating systems considering time-scale characteristics based on quasi-steady multi-energy flow. Appl. Energy 2016, 167, 230–243. [Google Scholar] [CrossRef]
  13. Lynch, A.; Perez, Y.; Gabriel, S.; Mathonniere, G. Nuclear fleet flexibility: Modeling and impacts on power systems with renewable energy. Appl. Energy 2022, 314, 118903. [Google Scholar] [CrossRef]
  14. Li, Y.; Wang, C.; Li, G.; Wang, J.; Zhao, D.; Chen, C. Improving operational flexibility of integrated energy system with uncertain renewable generations considering thermal inertia of buildings. Energy Convers. Manag. 2020, 207, 112526. [Google Scholar] [CrossRef]
  15. Chen, X.; Wang, C.; Wu, Q.; Dong, X.; Yang, M.; He, S.; Liang, J. Optimal operation of integrated energy system considering dynamic heat-gas characteristics and uncertain wind power. Energy 2020, 198, 117270. [Google Scholar] [CrossRef]
  16. Pan, E.; Li, H.; Wang, Z.; Peng, D.; Zhao, L.; Fan, L.; Wang, Y.; Huang, F.; Ma, Y.; Liu, L. Operation optimization of integrated energy systems based on heat storage characteristics of heating network. Energy Sci. Eng. 2021, 9, 223–238. [Google Scholar] [CrossRef]
  17. Deng, T.; Tian, L.; Hu, B.; Liu, X.; Liu, J.; Zhou, G.; Zhao, Y. Dynamic availability of energy storage in district heating networks for automatic generation control of a CHP plant. Appl. Therm. Eng. 2021, 183, 116198. [Google Scholar] [CrossRef]
  18. Wu, C.; Gu, W.; Xu, Y.; Jiang, P.; Lu, S.; Zhao, B. Bi-level optimization model for integrated energy system considering the thermal comfort of heat customers. Appl. Energy 2018, 232, 607–616. [Google Scholar] [CrossRef]
  19. Li, Y.; Sun, F.; Zhang, Q.; Chen, X.; Yuan, W. Numerical Simulation Study on Structure Optimization and Performance Improvement of Hot Water Storage Tank in CHP System. Energies 2020, 13, 4734. [Google Scholar] [CrossRef]
  20. Xue, X.; Ai, X.; Fang, J.; Yao, W.; Wen, J. Real-time schedule of integrated heat and power system: A multi-dimensional stochastic approximate dynamic programming approach. Int. J. Electr. Power Energy Syst. 2022, 134, 107427. [Google Scholar] [CrossRef]
  21. Yan, Z.; Quan, L.Y.U.; Yang, L.I.; Na, Z.; Haixia, W.; Hui, S.U.N. Analysis on Operation Flexibility of Combined Heat and Power Plant with Four Improved Power-Heat Decoupling Schemes. Autom. Electr. Power Syst. 2020, 44, 163–171. [Google Scholar]
  22. Cheng, X.; Gu, C.; An, N.; Liu, X.; Bo, L.; Zheng, H.; Cui, Y. Coordinated wind power dispatch model for an integrated heat and power system by a novel scenario-dependent algorithm. In Proceedings of the 2021 Power System and Green Energy Conference (PSGEC), Shanghai, China, 20–22 August 2021; pp. 765–774. [Google Scholar]
  23. Qi, Z.; Peng, S.; Wu, P.; Tseng, M.-L. Renewable Energy Distributed Energy System Optimal Configuration and Performance Analysis: Improved Zebra Optimization Algorithm. Sustainability 2024, 16, 5016. [Google Scholar] [CrossRef]
  24. Kim, M.; Kwon, S.; Ji, M.; Shin, H.; Min, B. Multi-lateral horizontal well with dual-tubing system to improve CO2 storage security and reduce CCS cost. Appl. Energy 2023, 330, 120368. [Google Scholar] [CrossRef]
  25. Zhu, Z.; Sheng, M.; Chen, Z. Low-carbon economic dispatching of integrated energy system considering liquid air energy storage and integrated demand response. Dianli Zidonghua Shebei/Electr. Power Autom. Equip. 2022, 42, 1–13. [Google Scholar]
  26. Wu, Q.; Li, C. Modeling and operation optimization of hydrogen-based integrated energy system with refined power-to-gas and carbon-capture-storage technologies under carbon trading. Energy 2023, 270, 126832. [Google Scholar] [CrossRef]
  27. Cui, Y.; Zeng, P.; Hui, X.; Li, H.; Zhao, J. Low-carbon Economic Dispatch Considering the Integrated Flexible Operation Mode of Carbon Capture Power Plant. Dianwang Jishu/Power Syst. Technol. 2021, 45, 1877–1885. [Google Scholar]
  28. Wang, Y.; Li, M.; Qi, Y. Low-carbon economic dispatching of integrated energy system with P2G considering comprehensive and flexible operation mode of carbon capture power plant. Dianli Zidonghua Shebei/Electr. Power Autom. Equip. 2023, 43, 1–8. [Google Scholar]
  29. Zhou, R.; Sun, H.; Tang, X.; Zhang, W.; Yu, H. Low-Carbon Economic Dispatch Based on Virtual Power Plant Made up of Carbon Capture Unit and Wind Power Under Double Carbon Constraint. Zhongguo Dianji Gongcheng Xuebao/Proc. Chin. Soc. Electr. Eng. 2018, 38, 1675–1683. [Google Scholar]
  30. Sun, H.; Sun, X.; Kou, L.; Ke, W. Low-Carbon Economic Operation Optimization of Park-Level Integrated Energy Systems with Flexible Loads and P2G under the Carbon Trading Mechanism. Sustainability 2023, 15, 15203. [Google Scholar] [CrossRef]
  31. Khani, H.; Farag, H.E.Z. Optimal Day-Ahead Scheduling of Power-to-Gas Energy Storage and Gas Load Management in Wholesale Electricity and Gas Markets. IEEE Trans. Sustain. Energy 2018, 9, 940–951. [Google Scholar] [CrossRef]
  32. Zhang, M.; Li, H.; Zhu, Y. Optimal Operation of a Regional Integrated Energy System Considering P2G and Stepped Carbon Trading. In Proceedings of the 5th Asia Energy and Electrical Engineering Symposium, AEEES 2023, Chengdu, China, 23–26 March 2023; Institute of Electrical and Electronics Engineers Inc.: Piscataway, NJ, USA, 2023; pp. 1796–1801. [Google Scholar]
  33. Tao, Y.; Qiu, J.; Lai, S.; Zhao, J.; Xue, Y. Carbon-Oriented Electricity Network Planning and Transformation. Ieee Trans. Power Syst. 2021, 36, 1034–1048. [Google Scholar] [CrossRef]
  34. Li, X.; Li, T.; Liu, L.; Wang, Z.; Li, X.; Huang, J.; Huang, J.; Guo, P.; Xiong, W. Operation optimization for integrated energy system based on hybrid CSP-CHP considering power-to-gas technology and carbon capture system. J. Clean. Prod. 2023, 391, 136119. [Google Scholar] [CrossRef]
  35. Zhang, B.; Wu, X.; Ghias, A.M.Y.M.; Chen, Z. Coordinated carbon capture systems and power-to-gas dynamic economic energy dispatch strategy for electricity-gas coupled systems considering system uncertainty: An improved soft actor-critic approach. Energy. 2023, 391, 136119. [Google Scholar] [CrossRef]
  36. Qiu, B.; Gao, Z.; Wang, K. IES Low-Carbon Economic Dispatch Considering Natural Gas Pressure Energy Power Generation under P2G-CCS. In Proceedings of the 2023 IEEE International Conference on Power Science and Technology, ICPST 2023, Kunming, China, 5–7 May 2023; Institute of Electrical and Electronics Engineers Inc.: Piscataway, NJ, USA, 2023; pp. 793–800. [Google Scholar]
  37. Guo, R.; Ye, H.; Zhao, Y. Low carbon dispatch of electricity-gas-thermal-storage integrated energy system based on stepped carbon trading. Energy Rep. 2022, 8, 449–455. [Google Scholar] [CrossRef]
  38. Luo, Z.; Wang, J.; Wang, H.; Zhao, W.; Yang, L.; Shen, X. Optimal scheduling of integrated energy system considering carbon capture and power-to-gas. Dianli Zidonghua Shebei/Electr. Power Autom. Equip. 2023, 43, 127–134. [Google Scholar]
Figure 1. Structure of the IES integrated with CCUS.
Sustainability 16 05722 g001
Figure 2. Structure of the integrated flexible CCS system.
Sustainability 16 05722 g002
Figure 3. Two-stage P2G system with multiple hydrogen utilizations.
Sustainability 16 05722 g003
Figure 4. Wind power and load profiles in the considered park.
Sustainability 16 05722 g004
Figure 5. The accommodation level of wind power over time under the four cases.
Sustainability 16 05722 g005
Figure 6. Power distribution and carbon trace of the CCUS system in Case 4.
Sustainability 16 05722 g006
Figure 7. Optimal hourly operation result of each device in case 4.
Sustainability 16 05722 g007
Figure 8. Total cost and net carbon emissions under different carbon trading prices in Case 4.
Sustainability 16 05722 g008
Table 1. Individual equipment parameters [38].
DeviceParameterValueDeviceParameterValue
coal-fired power plantUpper and lower limits of coal-fired power generation output (MW)455/150Hydrogen-blended CHP unitCHP capacity (MW)200
Upper and lower limits of climbing power (MW)200/−200Upper and lower limits of climbing power (MW/h)50
Carbon emission intensity per unit of power generation (t/(MW∙h))1.02Comprehensive efficiency of the CHP0.92
Coal cost per unit of power generation (CNY/(MW∙h))420Upper and lower limits of heat-to-electric ratio0.48/2.07
CCUSBasic energy consumption of the CCUS (MW)3P2GEL equipment capacity (MW)200
Energy consumption coefficient of the CCUS operation ((MW∙h)/t)0.268Energy conversion efficiency of the EL0.75
Absorption efficiency/regeneration efficiency0.95/0.9Upper and lower limits of climbing power of the EL (MW/h)50
Maximum operating condition coefficient120%Capacity of MR equipment (MW)200
Initial liquid storage capacity of the liquid tank (m3)30,000Energy conversion efficiency of the MR0.7
Maximum/minimum liquid storage capacity of the liquid tank (m3)60,000/3000Upper and lower limits of climbing power of the MR (MW/h)50
GBGB equipment capacity (MW)150HFCCapacity of HFC equipment (MW)400
Upper and lower limits of climbing power (MW/h)75/–75Upper and lower limits of climbing power (MW/h)200/–200
Thermal efficiency of the GB0.8Electricity generation efficiency of the HFC0.87
Thermal storage tankUpper and lower limits of the heat storage capacity (MW∙h)270/30HSTUpper and lower limits of the HES capacity (MWh)1500/150
Initial heat storage capacity (MW∙h)150Initial HES capacity (MWh)750
Single maximum heat storage/release power (MW)75Single maximum hydrogen storage/release power (MW)500
Heat storage/release efficiency0.85/0.5Hydrogen storage/release efficiency0.95/0.95
Table 2. The resulting system costs under the four different cases considered (CNY 103).
Coal Purchase CostGas Purchase CostCarbon Trading CostCarbon Storage CostCurtailment Penalty CostDemand Response CostInvestment Cost of CCUSTotal CostWind Power Utilization Rate/%Net Carbon Emissions/Ton
Case 11525.22786.7424.501043.811.805792.169.334871.1
Case 21623.92901.9−206.3296.4817.212264.35709.575.992212.9
Case 31759.92560.5−345.4365.5481.711.8322515685.851657.3
Case 41512.02312.6−361.1311.509.73224166.7100.001454.4
Disclaimer/Publisher’s Note: The statements, opinions and data contained in all publications are solely those of the individual author(s) and contributor(s) and not of MDPI and/or the editor(s). MDPI and/or the editor(s) disclaim responsibility for any injury to people or property resulting from any ideas, methods, instructions or products referred to in the content.

