Article

Economic Valuation of the University of Brasília Arboretum and Determinants of Willingness to Pay for the Arboretum

by
Manuella de Rezende Alvares
1,
Humberto Angelo
1,
Alexandre Nascimento de Almeida
2,*,
Maristela Franchetti de Paula
3,
Alexandre Anders Brasil
1 and
Eraldo Aparecido Trondoli Matricardi
1
1
Departamento de Engenharia Florestal, Faculdade de Tecnologia (FT), Universidade de Brasília, Brasilia 70910-900, Brazil
2
Faculdade UnB de Planaltina (FUP), Universidade de Brasília, Planaltina 73345-010, Brazil
3
Departamento de Administração, Campus de Guarapuava, Unicentro, Guarapuava 85040-167, Brazil
*
Author to whom correspondence should be addressed.
Sustainability 2024, 16(13), 5724; https://doi.org/10.3390/su16135724
Submission received: 8 May 2024 / Revised: 27 May 2024 / Accepted: 28 June 2024 / Published: 4 July 2024

Abstract

:
Despite forest remnants being crucial components of the urban environment, they have been insufficiently studied in terms of their economic value. This study aimed to assess the economic value of the Arboretum at the University of Brasília (UnB) in the Federal District, using the contingent valuation method (CVM) from environmental economics to facilitate effective preservation measures. Questionnaires were randomly distributed to the university population of UnB residing in the Federal District. The findings indicated a willingness among the university community to contribute to the conservation of the Arboretum. Specifically, the study estimated the economic value of the environmental asset, determined the likelihood of willingness to pay (WTP), calculated the average monthly WTP, and analyzed the respondents’ profiles to identify the factors influencing WTP. Among the psychographic, environmental, and socioeconomic variables, only the variables related to environmental segmentation were statistically significant determinants of WTP. The analysis showed that individuals with a greater understanding of ecology were more inclined to express willingness to pay for the Arboretum. Thus, the variable “EK” was identified as an important predictor of environmentally favorable behaviors. The study concluded that the Arboretum’s estimated economic value in 2020 was BRL 57,890,196.00 (with USD 1.00 = BRL 5.25), and the willingness to pay for this environmental asset was estimated at BRL 5.33 per month, consistent with values estimated for other conservation units in Brazil. This willingness to pay makes it possible to generate subsidies for the development of public policies and management strategies to improve and preserve the Arboretum.

1. Introduction

The highlight of the innovation in this article is the economic valuation of an urban arboretum, a subject that has been little explored in previous studies; thus, this study fills a significant gap in the valuation of forest remnants, especially in Brazil. The study makes important contributions by analyzing a natural resource in an urban environment, aiding in the guidance of conservation policies. It emphasizes the willingness of the university community to support the conservation of the arboretum, underscoring the importance of local participation in conservation initiatives.
Moreover, the study provides quantitative data that can underpin public policies and management strategies aimed at improving and preserving urban green areas. By identifying ecological knowledge as a key factor in willingness to pay for conservation, the study highlights the importance of environmental education as an essential part of conservation strategies.
The application of the contingent valuation method (CVM) in a Brazilian context, specifically within a higher education institution, adds significant value to the study. This is particularly relevant given that many studies on the economic valuation of natural areas focus on broader contexts or more traditional resources such as forests and water bodies.
Finally, the study serves as a reference for future research on the valuation of urban resources, encouraging the integration of socioeconomic and environmental aspects. These elements make the study crucial for academics and policymakers interested in improving the management of urban green spaces, promoting a more integrated and substantiated approach to their conservation.
The Arboretum of the University of Brasília (UnB), as an area of environmental preservation, is vital for the conservation of biodiversity, scientific research, environmental education, and leisure, housing a wide variety of plant species of the cerrado, including some exotic ones. This green area is in Brasilia, Federal District, Brazil, and plays a key role in environmental awareness and protection of the typical ecosystems of the Brazilian cerrado. Both the university and the local community could better enjoy the benefits provided by this environmental asset.
Urbanization has drastically reduced green areas, making urban forest fragments vital to remediate the local microclimate, where the urban environment is affected by temperature, humidity, and air movement [1]. These urban forest fragments are small, fragmented portions of native forest separated due to urbanization and are of great social, political, economic, and ecological importance, demanding preservation [2]. Urban vegetation serves various functions [3]: socially, it provides leisure; aesthetically, it beautifies the landscape; educationally, it promotes environmental education projects; psychologically, it offers contact with nature for relaxation; and ecologically, it improves air, water, and soil quality, maintains fauna, infiltrates water, and improves the local climate, contributing to the well-being of residents. In large urban centers, the suppression of green areas during urban expansion creates local microclimates and increases temperature, contributing to the phenomenon of the “heat island”, due to the high density of materials that absorb solar radiation and radiate it as heat. The maintenance of forest fragments is crucial for thermal comfort and a higher quality of life for the population [4]. Thus, urban vegetation plays an essential role in regulating the local microclimate, controlling radiation exchange, airflow, air pollutant ventilation, evaporation, erosion, runoff, noise, temperature, humidity, and air movement [5]. It acts as a filter for pollutants and atmospheric gases, increases soil permeability, controls wind speed, and has a direct impact on the urban microclimate as a controller of temperature and humidity, being fundamental to mitigate the adverse effects of urbanization on the environment [6,7]. Urban green areas help reduce ambient temperature through shading provided by tree canopies [8]. Additionally, the presence of vegetation increases air humidity due to evapotranspiration, contributing to a higher atmospheric vapor rate [9]. Finally, trees decrease wind speed by acting as barriers; thus, open areas enable wind to become more intense [10].
However, the increase in socioeconomic activities has caused significant environmental damage, affecting the quality of life of citizens. The shift to a more sustainable development model requires not only ecological but also political, moral, scientific, social, religious, economic, cultural, and ethical considerations. It is essential to balance the social and economic needs of human beings with environmental preservation to ensure sustainability for present and future generations. Economic valuation, estimating the economic value of an environmental resource, is crucial in order to include the environment in economic development strategies, management of environmental resources, and decision making that will generate environmental impacts. This is important because natural resources do not have a defined market.
The justification for this research is that there are still significant gaps regarding environmental valuation in Brazil, emphasizing the need for more scientific research to enhance the credibility of the findings [11]. This underscores the importance of such scientific inquiry, particularly considering the absence of studies on the topic related to the UnB Arboretum. Another reason for this study is institutional, since the Arboretum is linked to a public educational institution that does not have its own resources for its maintenance, a common challenge in the management of conservation units. This results in a lack of prioritization of the Arboretum and the need to measure willingness to pay (WTP) to inform policies aimed at attracting private-sector and community support for its conservation. The scarcity of resources for the conservation of the Arboretum results in environmental problems, such as soil erosion, human invasion, and fires, due to inconsistent or inadequate management by UnB, which may represent a problem for the city. Therefore, the economic valuation of the Arboretum is crucial to guide projects and public policies aimed at sustainable development and the effective implementation of natural resource conservation measures. This approach makes it possible to make decisions involving environmental resources by estimating their monetary values, allowing for an efficient allocation of resources for environmental conservation and management. Given that the Arboretum is a public asset, willingness to pay for its conservation reflects both the individual preferences of the community and its environmental awareness regarding the preservation of natural resources. Therefore, the importance of this study is to provide information about the potential of Brasília residents to financially contribute to the improvement of the Arboretum, thereby increasing its significance to society. Additionally, it aims to understand the users’ profiles to guide environmental public policies focused on the conservation and enhancement of the Arboretum.
This research aims to estimate the economic value that visitors attribute to the University of Brasília Arboretum through willingness-to-pay assessments. Given the current lack of studies on the subject, the estimated values will guide the management of similar conservation areas, providing valuable parameters for public policies and decision-making. In this context, the objective of this study is to value the University of Brasília Arboretum using the contingent valuation method (CVM), through willingness to pay (WTP). This work specifically aims to achieve the following: (a) Estimate the probability of willingness to pay for the Arboretum using the logistic regression model; (b) Analyze the profile of the respondents using the logistic regression model and determine the determining factors (psychographic, environmental, and socioeconomic) in the probability of WTP for the Arboretum; (c) Estimate the average monthly willingness to pay for the conservation, preservation, and maintenance of the Arboretum, based on the arithmetic average of the individuals willing to pay; and (d) Estimate the economic value of the Arboretum.
The article is clearly and structurally organized, following a logical sequence that includes an introduction, a theoretical framework, materials and methods, results and discussion, and finally the conclusion.

2. Theoretical Framework

Developed by environmental economics, total economic value (TEV) identifies the various values associated with environmental resources, which consist of use values (direct use, indirect use, and option value) and non-use values (existence value). The direct use values (DUVs) of an environmental resource arise from its direct use or consumption, while the indirect use values (IUVs) come from the benefits provided by the resource’s ecological functions indirectly. Option values (OVs) reflect people’s willingness to pay to maintain the possibility of future use of the resource, while existence value (EV) represents the satisfaction of knowing that the resource exists, even if it is not used.
Environmental economic valuation assigns monetary values to goods and services that come from natural resources, even if there are no established market prices for them. Environmental economic valuation methods seek to quantify people’s preferences for an environmental resource or service. Thus, what receives monetary value is not the environment itself or the environmental resource, but rather people’s preferences in relation to changes in the quality or quantity of the environmental resource [12]. The contingent valuation method was chosen due to the absence of direct market information related to the Arboretum. In addition, CVM makes it possible to determine the economic value of an environmental asset by being able to capture the use, option, and existence values of the Arboretum. The CVM is unique in allowing the estimation of existence values, capturing individual preferences about resources that may never be used by people [13]. These characteristics provide the method with the ability to measure both the use and non-use values of the Arboretum. The CVM encompasses three main categories: reliability, validity, and biases. Validity refers to the degree to which CVM results reflect the true value of the investigated good. Reliability evaluates the consistency of estimates, being lower when the sample is less random, because a more random sample tends to better reflect reality due to the different socioeconomic and behavioral characteristics of the population. Biases are the problems associated with the method, representing sampling errors that affect reliability and need to be minimized [13]. There are at least ten main types of biases, as described by Willis [14] and Bateman and Turner [15]: strategic bias, hypothetical bias, part–whole bias, information bias, interviewer and respondent bias, payment instrument bias, starting-point bias, obedience bias, subjectivity bias, and aggregation sequence bias.
In representative samples of the population, people are asked through a field survey about their willingness to pay (WTP) or willingness to accept (WTA) for the benefits of environmental goods and services, which allows inferring their individual preferences in relation to the environmental resource [12]. Being a probabilistic model, the model estimates WTA and WTP values through hypothetical markets. These markets are created through field research, in which hypothetical questionnaires are presented directly to people. These questionnaires ask respondents about their contingent valuation (WTA or WTP). However, a methodological challenge arises in the difficulty of capturing environmental values that people may not understand or unaware of, given that the questions are hypothetical. This can lead people to offer different answers than they would if they had to pay for the actual environmental resource [12]. Therefore, it is crucial to simulate a scenario as close to reality as possible so that the preferences reflected in the surveys represent people’s real decisions, as if there were a market for the environmental resource described. The choice of valuation measure should be made between WTP for the environmental asset or WTA as compensation for environmental loss. For this study, we opted for the use of the WTP valuation measure for the use of the environmental resource, due to the difficulty mentioned by Motta [13] in the elaboration of a reliable survey of contingent valuation with the WTA.
Although still a developing topic in Brazil, some studies have already addressed economic valuation methods in conservation and preservation areas [13]. Regarding studies in similar preservation areas that utilized the contingent valuation method through willingness to pay, we can mention the investigations of Muñoz [16] and Almeida et al. [17], which respectively analyzed Brasília National Park and Olhos d’Água Park, both located in Brasília, Federal District, Brazil.

3. Materials and Methods

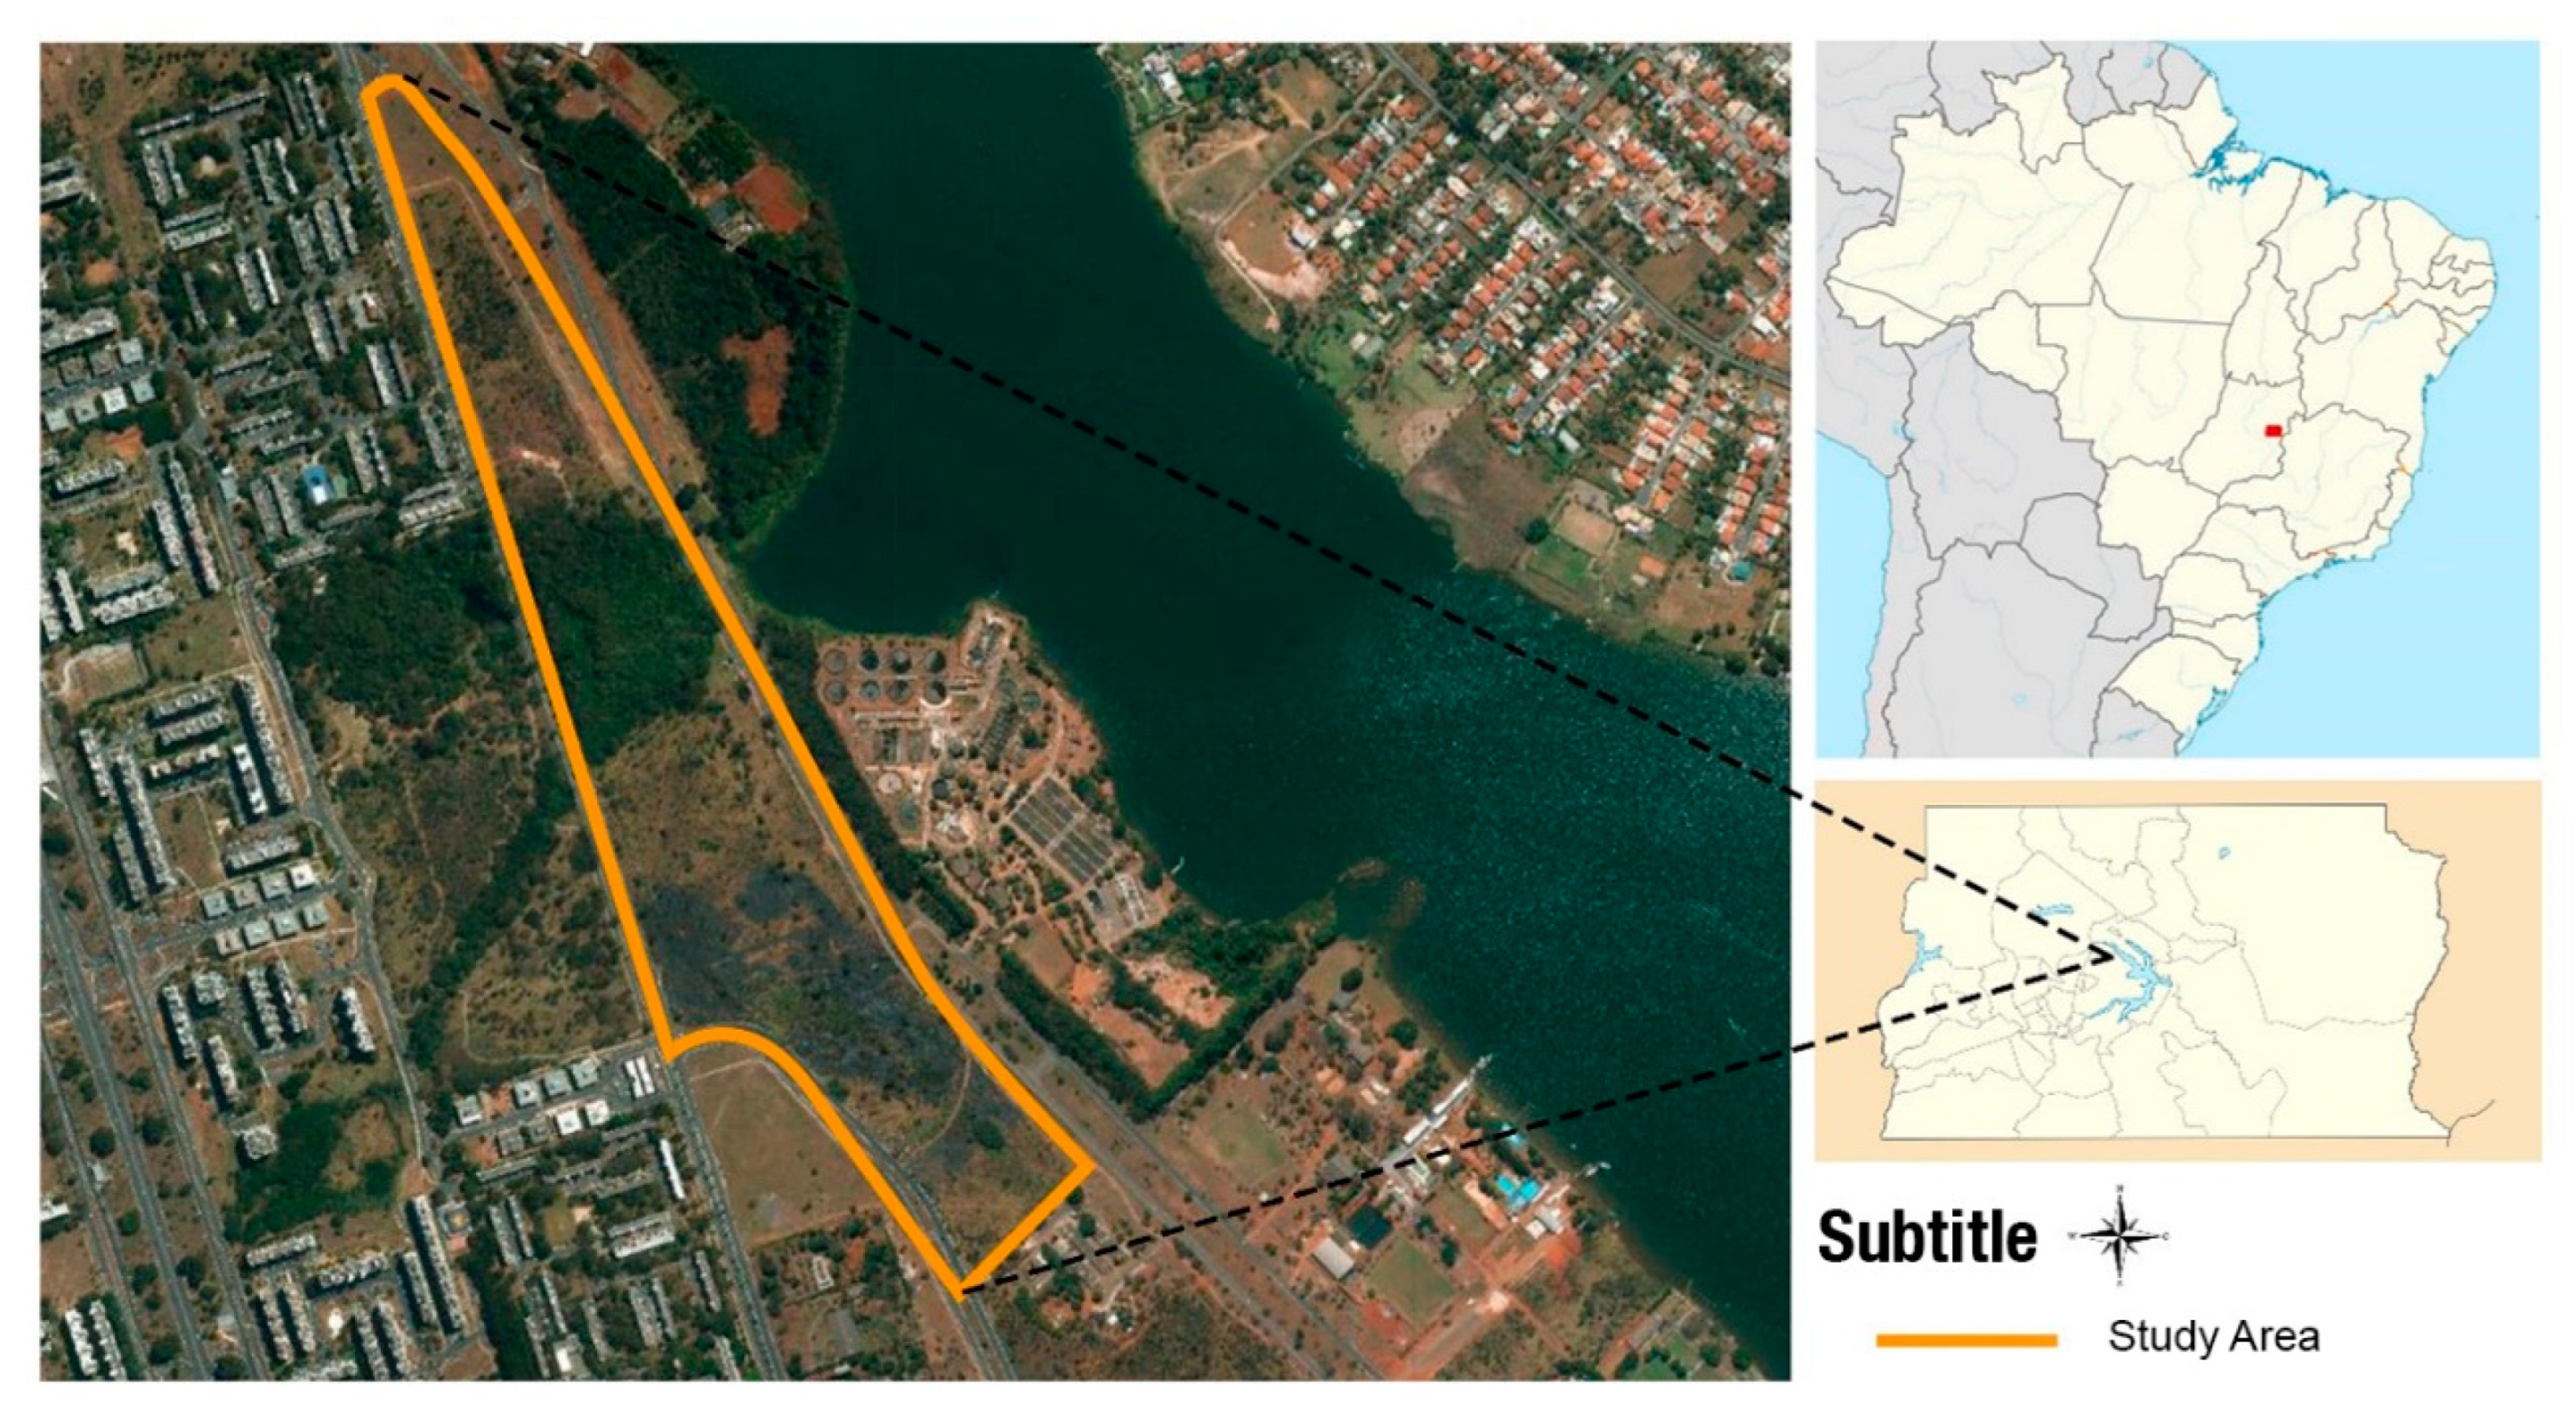
3.1. Environmental Asset

The focus of this study is the Arboretum of the University of Brasilia (Figure 1), classified as a Natural Area of Strict Preservation [18]. It is an area of strict protection of native vegetation and is open to the public. Although it is an Environmental Preservation Area, it is partially managed, with restricted use according to the guidelines for the preservation of the natural area. It is a nature reserve with buildings limited to the needs of on-site research.
Located at the northern end of the Darcy Ribeiro Campus of the University of Brasilia, in Asa Norte of the Plano Piloto, Federal District, Brazil, the Arboretum, also known as Physical Unit SN-13, has geographic coordinates of (15°44′34″ S, 47°52′52″ W) and covers a total area of 262,872 m2. It occupies the space of the extinct Superquadras Norte 413 and 414. The Arboretum is located near Lake Paranoá, to the left of the Olhos d’Água Ecological Park, extending to the shore of the lake, where the Biology Experimental Station (Physical Unit SN-14) is located, and continues to the Asa Norte Sewage Treatment Plant, operated by CAESB (Brasília Water and Sewage Company).
Due to its proximity to the preserved spring areas of Olhos d’Água Park and Lake Paranoá, the preservation and conservation of the Arboretum are essential. This is due to the presence of watercourses, groundwater outcrops, and springs, as well as riparian forests that protect the margins of the water sources that flow into Lake Paranoá [18]. The vegetation cover of the Arboretum consists mainly of native species of the cerrado biome, forming a mosaic of vegetation that includes different types of forests, savannas, and grasslands. Stretches of gallery forest, riparian forest, cerrado stricto sensu, and campo sujo can be found. Due to its proximity to Lake Paranoá, the microclimate in the Darcy Ribeiro University Campus area is favored. The lake narrows in this stretch, extending until it reaches a small spring basin that also runs through the Olhos d’Água Park and the Arboretum. The following pictures show different sections of the Arboretum (Figure 2).
The area is intended for conducting research projects in biology, covering the study of the soil, fauna, and flora of the cerrado, in addition to serving as a space for teaching and extension activities, benefiting both the University and the community. Although it has potential for these activities, it is misused by the academic community. Given the institutional challenges that the University of Brasilia faces, with no provision to allocate resources for the environmental asset, it is crucial to conduct this study to assess the value of the Arboretum. If it is found that there is a willingness to pay, it is possible to generate subsidies for the formulation of effective public policies and management strategies to improve and preserve the Arboretum. This includes measures to protect and restore the on-site water resources, aiming to improve water quality, as well as investments in infrastructure to ensure the safety of study visits and research support facilities. Currently, due to the scarcity of resources for its maintenance and conservation, and despite being a protected area, the Arboretum is subject to several threats, including deforestation; contamination of water sources and watercourses; wildfires; invasions by people and animals; introduction of exotic plant species; firewood extraction; illegal hunting of wildlife; improper disposal of sewage, garbage, and debris; and other environmental problems. It is important to highlight the main invasions of exotic plant species, resulting from degradation, especially of signal grass (Brachiaria decumbens), gamba grass (Andropogon gayanus), giant cane (Arundo donax), century plant (Agave spp.), and elephant grass (Pennisetum purpureum), as identified by Nunes [19].

3.2. Sample Size

The sample must be adequate to capture a representative amount of people, but it also needs to be small enough to save time in data collection. For this, we used the simplified formula proposed by Yamane [20] to calculate the sample size, according to Equation (1).
n = U n B   p o p u l a t i o n 1 + U n B   p o p u l a t i o n · ( e ) 2
where the variables are defined as follows:
  • n = sample size.
  • UnB population = a count including active permanent, substitute, temporary, and visiting faculty; undergraduate students; graduate students (master’s, doctoral, and medical residency); and technical–administrative staff [21]. The size of UnB population is 54,306 people.
  • e = significance level of 10%.
As a measure to mitigate potential issues in the form responses, a maximum error of 10% on the total sample was established, with a confidence level of 90%. To ensure the representativeness of the sample from the population of the University of Brasília residing in the Federal District (DF), a minimum of 100 individuals (n = 100) in the sample population is required.

3.3. Data Source

The study was conducted based on the contingent valuation method, which used information about the environmental asset under study to create a hypothetical scenario. The CVM involved the random distribution of questionnaires directed to the university population of the University of Brasília residing in the Federal District, with the objective of estimating a probability model for the WTP and calculating a monthly average WTP for the Arboretum. The data used in this study came from a primary source, collected through electronic interviews on the online platform Google Forms. A sample of at least 100 individuals was determined, however, a total of 341 interviews were conducted, which increases confidence in the sample. A total of 308 interviews were utilized, while the others had to be discarded due to sampling errors. The questionnaires were applied in the 2nd semester of 2020, totaling 8 weeks.
There are several ways to present questions to obtain the willingness to pay from the respondents. However, the closed format, also known as binary, dichotomous, or referendum, was chosen, as it offers fewer statistical problems and is closer to real market circumstances. The chosen payment method was a monthly fee to mitigate hypothetical bias. This fee was a fixed amount from all taxpayers charged on the water bill of the respondents, and unlike taxes, which are compulsory contributions levied by the state to finance public expenses, the water bill is a fee charged for the specific use of this service. In a system where all taxpayers pay the same amount, it raises questions about fairness and efficiency. While it may be seen as fair in terms of equality since it treats all taxpayers uniformly, regardless of their financial capacity, it can also be perceived as unfair as it places a heavier burden on those with lower incomes. In terms of efficiency, it is easy to administer but may be ineffective if it does not consider individual payment capabilities. This monthly fee can be seen as a tax. Many tax systems use principles of progressivity, where taxes increase with income, aiming to balance fairness and efficiency.
The questionnaire was structured into 18 questions divided into four distinct parts. In the first part, respondents express their willingness to pay using the contingent valuation method. The second part identifies the levels of environmental awareness of the interviewees through psychographic variables (altruism, perceived efficacy, environmental concern, and liberalism). The third part captures the ecological knowledge of the interviewees through environmental variables. Finally, the fourth part characterizes the interviewees based on socioeconomic variables (gender, age, monthly income, residence, education, and occupation). The survey was designed according to Dillman et al. [22]. Full details on the questionnaire development are available in the Appendix A.
The WTP values were determined according to the literature of the contingent valuation method, specifically Hanemann’s referendum model [23]. Question 1 of the questionnaire established the willingness to pay for the Arboretum. An additional question was directed to respondents not willing to pay, aiming to understand the reason for this choice (protest bias). Once these reasons are understood, it is possible to improve the study by proposing new solutions to increase people’s willingness to pay for the Arboretum.
To understand willingness to pay responses for environmental improvements, it is important to consider several factors. To validate these answers, we must inquire about the socioeconomic attributes and personal characteristics of each participant, as well as the quality and quantity of the environmental good offered. This comprehensive approach helps to gain a more accurate understanding of individual preferences regarding WTP. To achieve this, psychographic, ecological knowledge, and socioeconomic variables from the questionnaire were established.
To establish the environmental variables, simple questions about the Arboretum were considered to capture each interviewee’s ecological knowledge. Greater agreement with the first statement of question 7 and the fifth statement, and disagreement with the second, third, and fourth statements indicated a higher level of environmental knowledge. The socioeconomic variables were defined based on the literature, where the location of the residence of the interviewees in the Federal District was determined by the distance to the Arboretum, located in Asa Norte. Additionally, the questions regarding the socioeconomic information of the respondents were positioned last to avoid potential biases in completion. The psychographic variables focus on the individual and aspects related to their lifestyle. They were defined based on Straughan and Roberts [24] to assess the ecological awareness of the interviewees, considering their personal values. The answers in the questionnaire are measured on a five-category Likert scale, where higher levels of agreement on the four statements of question 3 are associated respectively with the following profiles:
  • Altruism: Concern for the well-being of others.
  • Environmental Concern: Level of concern about environmental problems.
  • Perceived Efficacy: Belief in individual capacity to make a difference.
  • Liberalism: Belief in left-wing political ideologies.

3.4. Determination of Willingness to Pay

As per Hair et al. [25], logistic regression is highly flexible and suitable for many situations, as it does not rely on strict statistical assumptions such as data normality and equal variance–covariance matrices across groups, assumptions often unmet in many situations. To estimate the probability of WTP for all respondents and conduct profile analysis, a logistic regression model was employed. This model considers several independent variables, which were selected based on their potential influence on the dependent variable. It allows for the assessment of how these variables affect the probability of respondents being willing to pay for the Arboretum, providing valuable insights into respondents’ profiles and trends. Therefore, the model was fitted using binary logistic regression, as it is a nonlinear model in which the dependent variable is dichotomous. Additionally, a monthly average of the willingness to pay (WTP) was estimated from the arithmetic mean of the values provided by the 265 individuals who expressed willingness to pay for the Arboretum, disregarding the portion of the sample unwilling to pay. To obtain a more consistent WTP average, data treatment was performed to disregard outlier values. It is important to highlight that the probability of WTP is a dichotomous variable, while WTP itself (in BRL) is a continuous variable.

3.5. Estimation of Willingness to Pay

According to the literature, when dealing with an open-ended elicitation questionnaire, the expected average value of the dependent variable (WTP) is usually obtained directly through the application of regression techniques to validate the result. This implies that the collected data, including the WTP responses, are used as input for a regression model, which then analyzes the relationship between the independent variables (such as socioeconomic, environmental, and psychographic characteristics) and the dependent variable (WTP). From this analysis, it is possible to estimate the expected average value of WTP and assess its accuracy and statistical significance. This procedure helps validate the results obtained from the questionnaire and provide a reliable estimate of the average WTP based on the collected data. In addition, the analysis of the profile of the interviewees, covering their economic, psychographic, and ecological knowledge characteristics, provides valuable information for Arboretum management, benefiting the University, the community, and preventing environmental problems.
To estimate the probability of willingness to pay (WTP) and analyze the profile of the interviewees, a binary logistic regression model was used, due to the use of dichotomous choices in the questionnaire related to the referendum method. This model correlates the probability of “yes” or “no” answers with explanatory variables, using a logistic function. The chances of an event occurring are calculated by dividing the probability of occurrence (pi) by the probability of non-occurrence (1 − pi). The fitted model predicts the probability of WTP based on independent variables, where the dependent variable is the logarithm of an individual’s chances of choosing to pay or not. The natural logarithm of the ratio between the probability of an affirmative answer (p(Yes)) and the probability of a negative answer (1 − p(Yes)) to the willingness to pay (WTP) question is calculated assuming that when there is no information, the probability of occurrence (p) is always assumed to be 0.50. Therefore, the probability of non-occurrence (1 − p) is also equal to 0.50. This occurs due to the lack of knowledge about the occurrence of the event, implying a 50% probability of paying for the preservation of the Arboretum and a 50% probability of not paying for the preservation of the Arboretum.
The logistic function, when linearized as a linear function of the parameters and explanatory variables to keep the model as simple as possible, is expressed by Equation (2), with the dependent variable being WTP and explained by environmental, psychographic, and socioeconomic variables.
l n p ( p r o b a b i l i t y   o f   o c c u r r i n g ) 1 p ( p r o b a b i l i t y   o f   n o t   o c c u r r i n g ) = ln e β 0 + β 1 X 1 + + β k X k = β 0 + β 1 X 1 + + β k X k + ε
W T P i = p i 1 p i = β 0 + β 1 X 1 + + β k X k + ε
The specification of the logit model was according to Equation (2), where the variables are defined as follows:
  • ε represents the error of the model, resulting from the exclusion of some variables or systematic errors.
  • β0 is the model constant.
  • βi (from i = 1 to 14) are the coefficients of the explanatory variables to be estimated, indicating the impact of each independent variable on willingness to pay.
  • Xi (from i = 1 to 14) are the explanatory variables.
After defining the independent and dependent variables to fit the regression model, the linearized logistic function was used to estimate willingness to pay (WTP) for the Arboretum. The logistic regression equation relates the dependent variable (WTP) to the independent variables (psychographic, environmental, and socioeconomic variables) that influence willingness to pay for the preservation of the Arboretum:
WTPi = Respondents’ willingness to pay (dichotomous dependent variable)
  • pi = Probability of an affirmative or negative response to the WTP question; 1 (willing to pay) and 0 (not willing to pay).
  • At: Altruism; 1 (altruistic) and 0 (selfish).
  • EC: Environmental concern; 1 (concerned) and 0 (unconcerned).
  • EP: Perceived efficacy of environmental actions; 1 (effective) and 0 (ineffective).
  • L: Liberalism; 1 (liberal) and 0 (non-liberal).
  • AK: Knowledge of the Arboretum; 1 (knows) and 0 (does not know).
  • UAK: Knowledge that the UnB has an Arboretum; 1 (knows) and 0 (does not know).
  • VF: Frequency of visit to the Arboretum (classes); 6 (always), 5 (very often), 4 (often), 3 (occasionally), 2 (rarely), 1 (almost never), and 0 (never).
  • EK: Ecological knowledge; 1 (higher knowledge) and 0 (lack of knowledge).
  • G: Gender; 1 (female) and 0 (male).
  • A: Age (age groups); 0 (under 20), 1 (20–24), 2 (25–31), 3 (32–44), 4 (45–59), 5 (60–65), and 6 (over 65).
  • RP: Place of residence; 1 (Asa Norte—near the arboretum) and 0 (far from the arboretum).
  • LE: Educational level (classes); 0 (no education), 1 (incomplete primary education), 2 (primary education), 3 (incomplete secondary education), 4 (secondary education), 5 (incomplete higher education), 6 (higher education), and 7 (postgraduate).
  • Oc: Occupation of the individual; 1 (student) and 0 (worker).
  • IM: Monthly income (income range classes); 0 (up to 1 minimum wage), 1 (1–3), 2 (3–5), 3 (5–7), 4 (7–9), 5 (9–12), 6 (12–15), 7 (15–20), 8 (20–25), 9 (25–30), and 10 (over 30 minimum wages).
A logistic regression analysis was performed to investigate the profile of the interviewees, identifying which independent variables significantly influenced the decision of whether or not to be willing to pay for the environmental asset. A variable is crucial to the model if it has a significant influence on the dependent variable. For the linearized model to adequately describe the relationship between the response and the predictor, the variables with only two options were considered categorical (At, EC, EP, L, AK, UAK, EK, G, RP, and Oc), while the variables on scales (VF, A, LE, and IM) were treated as continuous. The parameters (β) of the logistic regression model were estimated using the Maximum Likelihood method, considering a significance level of 5% used to interpret the p-value. These estimated parameters are used to predict the probability of the occurrence of the event of interest based on the independent variables. If the p-value associated with a regression coefficient is less than 0.05, it suggests that the coefficient is statistically significant, and the corresponding variable has a significant relationship with the dependent variable. On the other hand, if the p-value is greater than 0.05, it indicates that the coefficient is not statistically significant, and the null hypothesis that there is no relationship between the independent variable and the dependent variable at a 95% confidence level is accepted. Performing a more detailed analysis of the model results, the significant variables were investigated regarding the adjusted R2 and the odds ratio. The adjusted R2 indicates the proportion of total variability in the dependent variable explained by the model, considering the number of independent variables included in the model. Finally, the odds ratio in logistic regression models indicates how the likelihood of the event of interest occurring changes for each unit change in an independent variable, while keeping all other variables constant. The estimated coefficients are used to calculate the odds ratio. The odds ratio is useful for understanding how independent variables affect the probability of the event of interest occurring in logistic regression.
In binary logistic regression, the aim is to determine if the model is significant, and which independent variables significantly contribute to explaining the variability in the dependent variable. The fitted logistic regression model was assessed through hypothesis tests to determine if the result is statistically significant. The Hosmer–Lemeshow test, Pearson’s test, and the deviance test were employed. They are used to verify if the model fits well to the observed data, determining if there are significant discrepancies between the observed frequencies and the expected frequencies of events.
In regression, the p-value tests the null hypothesis (H0) that all coefficients for predictors are equal to zero. The alternative hypothesis (H1) is that at least one of the coefficients of an independent variable is not equal to zero. The chi-square test is a statistical tool used to assess the adequacy of a logistic regression model to the observed data. Consistent with Iglesias [26], a non-significant chi-square result indicates that the data fit well with the model. In other words, the null hypothesis that there is no significant difference between the observed values and the values predicted by the model is accepted. If the p-value associated with its chi-square statistic is greater than the chosen significance level α, typically 5%, the model accepts the null hypothesis (H0) that the model fits the data well and rejects the alternative hypothesis (H1) that the model does not fit the data. If the p-value is less than the accepted significance level, it means that at least one coefficient is different from zero, and the model is rejected.
Moreover, to enhance the explanatory power of the model, correlation analyses were conducted to assess the degree of association between variables, utilizing the Pearson correlation coefficient (r). The aim was to assess the relationship between the independent variables and the dependent variable. If the correlation coefficient is very low (less than ± 0.20) and the p-value is not significant (p-value > 0.05), it indicates that further descriptive analyses should not be pursued. Among the independent variables, the potential presence of multicollinearity was investigated. Multicollinearity occurs when two or more independent variables are highly correlated (more than ± 0.90), which can hinder the regression model’s fit as both variables would equally explain variations in the dependent variable. Thus, by identifying the lowest correlation coefficients, it is possible to select the most suitable interaction terms for inclusion in the model. If multicollinearity exists among the independent variables, one of them may become non-significant in the model (p-value > 0.05), and subsequently be removed, necessitating a model readjustment.
In accordance with the suggestion of Hair et al. [25] for the econometric evaluation of the model, the graph of the residuals was presented, minimizing problems of heteroscedasticity, specification, and autocorrelation, according to the randomness of the scatter plot of the unstandardized residuals. However, as per Gujarati [27], checking the dispersion of the regression residuals provides an important diagnosis of econometric problems such as heteroscedasticity, autocorrelation, and model specification. Therefore, a visual analysis of the residual dispersion was conducted.

3.6. Total Economic Value

A calculation of the TEV was performed to estimate the value of the Arboretum, using the concept of present value of an infinite and annual series in the forest economics. In this context, the present value of this series is determined by the relationship between the annuity and the interest rate (Equation (3)).
T E V = A n n u i t y I n t e r e s t   r a t e
The annuity is calculated as the value in BRL of the average monthly WTP of the UnB population respondents residing in the Federal District multiplied by the population of the UnB, considering an interest rate of 0.5% per month.

4. Results and Discussion

4.1. Sample Characterization

Of the 308 interviewees, 19% resided in Asa Norte, where the Arboretum is located, while 81% were from other Administrative Regions of the Federal District. The majority of respondents were female (66%), with the predominant age group being between 20 and 24 years old (57%), reflecting a young profile of the sample. The occupation was predominantly students (72%), reflecting the university environment of the Darcy Ribeiro Campus of the University of Brasilia, where the Arboretum is located, and also validated the young profile of the sample, with 88% of interviewees in the age range of under 20 to 31 years old. Of the 223 students, 183 are undergraduates, 25 are in high school, 12 are graduates, and 2 are postgraduates. Among the 85 working individuals, 34 are postgraduates, 24 are graduates, 18 are undergraduates, and 9 are in high school. The high level of education of the interviewees, with 89% of the individuals having incomplete higher education, complete higher education, or postgraduate degrees, was also attributed to the location of the Arboretum. Considering the minimum wage of BRL 1045 in 2020, the majority of the sample was in the monthly income range of 1 to 3 minimum wages (16%). According to Brazilian Institute of Geography and Statistics [28], the average monthly family income in the Federal District was BRL 2685.76, exceeding the income of 21% of the sample. On the other hand, 79% of the sample had income above the average monthly family income of the Federal District, suggesting a high-income pattern for the city.
Although most interviewees did not reside in Asa Norte, this region contributed with the highest number of participants (60 people), as expected due to the location of the Arboretum. Regarding the willingness to pay, out of the 308 interviewees, 86% were willing to contribute to the maintenance of the Arboretum (equivalent to 265 people). Most of the sample willing to pay consists of students, with 194 individuals, representing 73% of the total. The remaining 27% are made up of working individuals. Of these, 81% did not reside in Asa Norte, which was in line with expectations due to their higher environmental awareness. On the other hand, within the group of non-payers, 84% did not reside in Asa Norte, confirming that those who lived farther away were less likely to pay. Among the 43 individuals unwilling to pay, 63% are undergraduate students, 14% are graduates, 14% are postgraduates, and 9% are high school students.
Overall, there was a low willingness to pay higher amounts by residents of the Administrative Regions of the Federal District. The weighted average of the monthly willingness to pay of the sample was BRL 7.13, considered low despite the high income of most of the interviewees. Even in Asa Norte, an upscale area with high family income (about 80% of the respondents), the weighted average of the monthly WTP was BRL 6.38, a low value compared to the purchasing power of the residents.

4.2. Willingness to Pay

The average monthly value of individuals willing to pay for the Arboretum was BRL 5.33 with a standard deviation of BRL 0.74. Thus, BRL 5.33 is the maximum monthly amount that society would pay for the preservation of the Arboretum of the University of Brasilia. It was also observed that the higher the amount of the proposed payment, the less likely it is that people will be willing to pay for the Arboretum. Despite the high probability of WTP, with 86% of the interviewees were willing to pay for the Arboretum, when considering the high average monthly per capita income of the Federal District, the average value found for the WTP, and similar studies, it is concluded that there is a low willingness to pay for the conservation and maintenance of the Arboretum of the University of Brasilia.
A willingness to contribute to the maintenance and conservation of the Arboretum of the University of Brasília has been demonstrated. The estimated value of willingness to pay of BRL 5.33 per month is aligned with findings from comparable studies in conservation areas, and this should be considered when planning public policies to increase Arboretum revenue, underscoring the importance of strategic planning in public policies aimed at increasing environmental resource revenue. For example, Angelo et al. [29] estimated the willingness to pay (WTP) at BRL 9.31 per month for the Brasília National Park (PNB), based on the average exchange rate on the date of data collection, i.e., in 2014 (USD 1 = BRL 2.26), while Mota [30] estimated a WTP of BRL 6.62 per month for the PNB, based on the average exchange rate in 2000 (USD 1 = BRL 1.80). Both studies revealed a willingness to contribute to the Park. In comparison, Muñoz [16] found an average monthly WTP of BRL 9.31 for the PNB, based on the same 2014 exchange rate mentioned earlier, also revealing a willingness to contribute to the Park. Almeida et al. [17] recorded an average of BRL 15.80 for the Olhos d’Água Park, also based on the 2014 exchange rate, while Morgado et al. [31] estimated a WTP of BRL 11.59 per month for the Águas Claras Multiple-Use Ecological Park, based on the average exchange rate in 2008 (USD 1 = BRL 1.62), both located in the Federal District.
Among respondents unwilling to pay (representing 14% of the sample), about 33% argued that this is a “government responsibility” (question 2 of the questionnaire), reflecting a protest belief against individual financial investment in environmental protection. This reason may explain the low willingness to pay (BRL 5.33 per month). Similary to the findings of Adams et al. [32], where the majority of respondents expressed the opinion that the maintenance of the Park is the responsibility of the government and that they already pay enough taxes, in this study 33% chose the “government responsibility” option, followed by “I already pay enough taxes” (19%). In the study by Adams et al. [32], there was a high number of protest votes (38.5%), reflecting discontent with government policies on environmental preservation or opposition to tax increases. The resistance to willingness to pay pointed to a problem directed at the government, which, by charging high taxes, should have invested in park improvements and maintenance. This had led to distrust in the government’s ability to provide effective public services, discouraging people from expressing their true values.

4.3. Adjusted Model—Determinants of Willingness to Pay

Identifying the green consumer profile in Brasília by analyzing the effects of psychographic, environmental, and socioeconomic factors on environmental behavior is essential for developing effective environmental management strategies, particularly for conserving the Arboretum. Understanding the significant factors of environmental behavior enables more efficient allocation of resources and policies, promoting sustainable practices and contributing to the preservation of the local environment.
In logistic regression, we first fit the model to the data, estimating the coefficients of the independent variables using methods such as Maximum Likelihood. We then performed hypothesis testing to determine the statistical significance of these coefficients. The Table 1 shows the coefficients and p-values of the independent variables in the adjusted logistic regression model.
Only statistically significant variables from the segmentation exert a significant influence on the decision to be willing or unwilling to pay for the Arboretum, which occurs when the p-value is less than 0.05 (Table 1). The effects of these variables occurred as expected, with a confidence level of 95%. According to the results of the logistic regression model, only environmental variables were statistically significant. Specifically, the variables of EK (ecological knowledge), VF (visit frequency), and UAK (knowledge that the UnB has an Arboretum). Therefore, non-significant variables should be removed from the logistic regression model, considering only the coefficients that best fit the data, resulting in Equation (4).
W T P i ^ = 0.74 1.10 U A K + 0.48 V F + 1.33 E K
According to Gujarati [27], in binary regression models, the quality of fit is of secondary importance. What matters are the expected signs of the regression coefficients and their statistical significance. The effect of significant independent variables to explain the dependent variable was analyzed by observing the estimated coefficients. The coefficients indicate the direction and magnitude of the effect of the independent variables on the probability of the event of interest (dependent variable). Larger coefficients in magnitude indicate a greater influence of the independent variable on the dependent variable.
The results indicated that only the variables EK and VF showed a positive relationship with willingness to pay. This meant that higher ecological knowledge and more frequent visits were associated with a higher likelihood of accepting willingness to pay for the environmental good, in this case, the Arboretum. Higher ecological knowledge could lead people to value the natural environment more by understanding its importance for preservation. Thus, individuals with greater ecological knowledge tended to be more willing to contribute financially to the conservation of the Arboretum. Additionally, people who visited the Arboretum more frequently were more familiar with and valued its environmental benefits, making them more willing to pay for its conservation. Therefore, these results highlighted the importance of ecological knowledge and direct experience at the site in increasing willingness to pay for the preservation of natural resources such as the Arboretum. It is important to highlight the impact of EK, which was found to be the variable that most increases the likelihood of WTP, considering its highest positive coefficient (1.33). The inverse relationship of the UAK variable with the probability of WTP indicated that the higher the value of the UAK variable, the lower the probability of willingness to pay for the Arboretum. This result could reflect the perception that it was the responsibility of the UnB to conserve the Arboretum, thereby reducing the likelihood of people being willing to contribute financially to its maintenance and preservation.
In this study, all independent variables, except those related to environmental segmentation, were found not to be statistically significant. There was empirical evidence that supported the non-significant results found. As in the study by Afonso [33], the socioeconomic variables G (gender), A (age), LA (educational level), and IM (income) were not relevant in explaining environmentally conscious behavior. According to the existing literature review, this result was expected, as with the increasing concern and debates about environmental issues, socioeconomic characteristics alone were not sufficient to explain green behavior. As in the mentioned study, the psychographic variables of L (liberalism) and EC (environmental concern) were also not relevant in explaining environmentally conscious behavior. Additionally, the findings of Straughan and Roberts [24] suggest that L is also irrelevant in explaining the dependent variable. Aligned with the study by Almeida et al. [17], the variables G, A, LA, IM, RP (place of residence), L, and EP (perceived efficacy) were not significant. In line with the study by Muñoz [16], the variables of RP, LA, and G also did not prove to be relevant in explaining the WTP. The variables G, and A were also not significant in the studies by Rowlands et al. [34], and Webster [35], respectively. As for variable LA, the studies by Romeiro [36], Mainieri [37], Laroche et al. [38] Brugnaro [39], Silva [40], and Cirino and Lima [41] did not find a significant relationship between education and green behavior. Moreover, in the study by Queirós [11] the variable G was not significant for WTP. These results are also in line with Almeida et al. [42], as the variables EC, At (altruism), G, and A were not significant.
Moreover, after adjusting the model, the adjusted R2 of 4.92% indicated that 4.92% of the variation in willingness to pay was explained by the independent variables. However, not all variables were statistically significant. After a new model adjustment, including only the significant variables, the adjusted R2 increased to 5.59%. This suggests that the non-significant variables that were removed from the model did not contribute to explaining willingness to pay. Additionally, regarding the odds ratio results, in the “VF” variable, for each one-unit increase in the independent variable, the likelihood of the event of interest occurring was 1.62 times greater. Concerning the “UAK” variable, for each unit change in the independent variable, the likelihood of willingness to pay decreased by 0.33 times. Finally, regarding the “EK” variable, the likelihood of an individual belonging to the “yes (1)” category of this variable belonging to the “yes (1)” category of willingness to pay was 3.76 times greater than the likelihood of an individual belonging to the “no (0)” category of the “EK” variable.
The outcome of the hypothesis tests indicates whether the model fit is good or if the model is rejected. A non-significant chi-square test value suggests that the data fit the model well. A p-value associated with a chi-square statistic greater than 0.05 (maximum error 5%) indicates a good model fit. A p-value < 0.05 rejects the model. The results of the logistic regression model indicate that the p-value was greater than the 5% significance level in all tests. Thus, the null hypothesis (H0) that the model fits the data well was accepted, and all tests were significant (Table 2).
The residual graph was presented for econometric evaluation of the model. The Figure 3 suggests randomness in the dispersion of logistic regression residuals, minimizing issues of heteroscedasticity, autocorrelation, and model specification. The concentration of positive and negative residuals in separate clusters is due to the dichotomous nature of the dependent variable, which is characteristic of logistic regression models.
Moreover, a new logistic regression model was fitted considering only the significant variables, resulting in Equation (5). The magnitude of the coefficients, as well as the exact level of significance, can be found in Table 3.
W T P i ^ = 0.81 0.98 U A K + 0.49 V F + 1.41 E K
To analyze differences in willingness to pay among different groups, predictions were made using the logistic regression model. Including variables that are not statistically significant can increase the complexity of the model without improving its ability to predict the desired outcome. Therefore, when making predictions, only significant variables that affect the dependent variable were included, ensuring that the model is more accurate and effective in predicting the outcome.
Four predictions were made based on significant variables. The first considered “VF” as “never (0)”, “UAK” as “no (0)”, and “EK” as “no (0)”, resulting in a 68.8% probability of willingness to pay for the Arboretum. In the second prediction, with “VF” as “never (0)”, “UAK” as “yes (1)”, and “EK” as “yes (1)”, the probability was 78%. In the third prediction, with “VF” as “always (6)”, “UAK” as “no (0)”, and “EK” as “no (0)”, the probability was 99.6%. In the fourth prediction, with “VF” as “always (6)”, “UAK” as “yes (1)”, and “EK” as “yes (1)”, the probability was 98%. It is concluded that those who always visit the Arboretum, unaware that it belongs to the UnB and lacking ecological knowledge, have the highest probability of willingness to pay (99.6%), while those who never visit the Arboretum, unaware that it belongs to the UnB and lacking ecological knowledge, have the lowest probability (68%).
These results underscore the need for environmental education public policies, showcasing their positive impact on the environmental sphere. The environmentally conscious individuals in Brasília are those who visit the Arboretum, possess knowledge about it, and are ecologically aware. Therefore, it is essential to consider these aspects when providing subsides for the development of environmental public policies aimed at conserving and improving the Arboretum.

4.4. Adjusted Model—Interaction Terms

Only the variable “Ecological Knowledge” exhibited a significant correlation (p-value < 0.05) with the dependent variable. A very weak positive correlation (0.18) was observed, indicating that as ecological knowledge increases, there is a greater likelihood of willingness to pay for the Arboretum.
Among the independent variables, multicollinearity was not observed. Consequently, independent variables with low correlation (less than ± 0.40) and a significant p-value were included in the regression model as interaction terms, as shown in the Table 4.
Interaction terms are added to assess whether the effect of an independent variable on the dependent variable changes depending on the values of other independent variables. In summary, they indicate whether the impact of an independent variable on the dependent variable varies across different conditions or levels of other independent variables. In the new regression model adjustment, interaction terms between the independent variables of interest were included. However, none of these interaction terms were statistically significant (p-value < 0.05), and only the independent variables “Age” and “Educational Level” were significant in the adjusted model with interaction terms included, in accordance with the studies of Muñoz [16] and Almeida et al. [42], respectively. Additionally, several studies have found a significant relationship between GI and issues related to favorable environmental behavior, such as Straughan and Roberts [24], Rowlands et al. [34], Webster [35], Bissonnette and Contento [43], and Chan [44].
Upon examining the hypothesis test (Table 5) to assess the significance of interaction terms through the likelihood ratio, which compares the model fit with and without interaction terms, it was observed that the test did not indicate a significant improvement in the model fit with the inclusion of interaction terms. Consequently, there is no evidence of significant interaction. A p-value < 0.05 rejects the model, and a p-value > 0.05 indicates a good model fit. Since the p-value of the Pearson test was less than 0.05, it was not considered significant.

4.5. Economic Value of the Arboretum

The calculation of the value of the Arboretum was performed according to Equation (3), using the population of UnB and the monthly average WTP of UnB population respondents residing in the Federal District, with an interest rate of i = 0.5% per month. Considering the benefits provided by the Arboretum to society, the estimated economic value of this environmental asset in monetary terms is BRL 57,890,196.00 (Equation (6)).
T E V A r b = W T P ¯ × U n B   p o p u l a t i o n i = 5.33 × 54,306 0.005 = R $ 57,890,196.00
Considering the economic value of the Arboretum as BRL 57,890,196.00 and comparing it to similar studies, different willingness to pay values could be observed. For example, in a study conducted in the PNB, the willingness to pay was BRL 7.88 per month, equivalent to BRL 28,771,819.76 per year [45], based on the average exchange rate in 1999 (USD 1 = BRL 1.75). In Mota’s study [30], a willingness to pay of BRL 6.62 per month for the PNB was estimated, representing BRL 1,769,367.10 per year, based on the average exchange rate in 2000. In another similar study in Brazil, Adams et al. [32] estimated the economic value for the conservation of Morro do Diabo State Park, in São Paulo, at BRL 7,080,385.00 per year based on the average exchange rate in 2002 (USD 1 = BRL 2.54). Leite and Jacoski [46] estimated that visitors to Palmeiras Park in Chapecó, Santa Catarina, were willing to pay BRL 7.14 per month. This implied an estimated value for maintaining the park’s functions of BRL 14,651,280.00 per year, based on the average exchange rate in 2008. According to the study by Cirino and Lima [41], the monthly WTP for the São José APA, in Minas Gerais, was BRL 22.88, corresponding to an annual value of the benefits provided by this environmental asset of BRL 8,555,838.72, based on the average exchange rate in 2005 (USD 1 = BRL 2.40).

5. Conclusions

A willingness to pay for the conservation, preservation, and maintenance of the Arboretum of the University of Brasilia is evident. Despite 14% of respondents not being willing to contribute financially and casting protest votes, the majority of respondents (86%) were willing to pay, highlighting a strong inclination towards contribution. Willingness to pay for the conservation of the Arboretum reflects the recognition of its importance as an environmental resource and for human well-being. This demonstrates a support for environmental preservation and indicates a conservationist attitude within the community, promoting the health of the local ecosystem and improving the quality of life for university attendees and nearby residents. Therefore, the willingness to pay for the conservation of the Arboretum represents a collective commitment to environmental preservation and human well-being, reflecting environmental awareness and a desire to ensure a sustainable future for present and future generations.
The average value found for individuals willing to pay was BRL 5.33 per month, and the economic value of the Arboretum was estimated at BRL 57,890,196.00 in 2020. These results are consistent with the reviewed literature from several studies conducted in Brazil, which could highlight a market related to the use of this environmental asset. Considering the high income of individuals and the benefits provided by the preservation area in question, it is concluded that there is a low willingness to pay for green areas by society.
Based on the results of the logistic regression model, the determinant variables of willingness to pay (WTP) for the Arboretum were ecological knowledge, visit frequency, and knowledge that the UnB has an Arboretum. Additionally, it was observed that individuals with greater ecological knowledge exhibited the greatest willingness to contribute to the Arboretum. This suggests that individuals who have a deeper understanding of the environment are more likely to financially support the maintenance and preservation of the Arboretum.
Understanding the reasons behind unwillingness to pay can lead to solutions to increase people’s interest in contributing to the Arboretum. Main reasons often include dissatisfaction with government policies on environmental preservation or opposition to tax increases, with the perception that high taxes should be directed towards improvements in preservation. Additionally, the results of protest votes underscore the need to improve the government’s image in tax administration, given the widespread mistrust regarding the handling of public funds in Brazil. The success of policies aimed at raising extra funds from the community depends primarily on transparent and exemplary management. Involving the community in Arboretum conservation is crucial to address these concerns and reduce distrust in public resource management and government effectiveness. Another solution could be partnering with the private sector to address government issues, which could also be effective in increasing available resources and their efficient allocation. A 2024 article published in Corporate Social Responsibility and Environmental Management [47] examines the impact of green finance reforms on corporate performance in environmental, social, and governance (ESG) criteria. The research outlines how financial policies focused on sustainability can encourage or compel companies to improve practices in areas such as environmental impact, social responsibility, and governance. The findings suggest that green finance reforms lead to significant improvements in corporate ESG metrics, demonstrating the potential of financial policy as an effective tool for promoting sustainability in the business sector. The study advocates for the integration of sustainability goals into financial policies to foster broader environmental and social improvements.
The government’s influence on changing individuals’ environmental behavior can be achieved through economic incentive policies. A comprehensive understanding of individual motivations and characteristics is crucial to encourage financial contributions to Arboretum conservation. This can be achieved through awareness campaigns highlighting its environmental and social benefits, along with efforts to raise public awareness of its importance. Implementing environmental education programs is vital for conservation efforts. Additionally, society can promote social inclusion and community involvement in Arboretum activities, fostering environmental consciousness and understanding of the benefits of preservation. Moreover, policies encouraging recreational activities and public–private partnerships can ensure adequate resources for the Arboretum conservation.
Finally, the results of this research and its associated guidelines have the potential to strengthen the preservation of the Arboretum and enhance its utilization by both the University of Brasília and the community.
Additionally, several studies provide essential information for assessing and conserving the Arboretum. For instance, research by Zhang, He, and Zhao [48] addresses visitor demand management and resource allocation through the study of grazing and congestion in service systems. Jankalová and Kurotová [49] present a framework for analyzing the long-term economic impact and sustainability of the Arboretum, using added economic value. Additionally, a study by Downing and Roberts [50] offers an effective methodology for estimating the Arboretum’s use value by visitors, serving as a valuable reference for assessing its economic value.
Moreover, a 2024 article published by the Singapore Economic Review [51] explores the impact of innovative urban policies on carbon efficiency across various regions in China. The study shows that these policies enhance carbon efficiency both in the cities where they are implemented and in adjacent areas, contributing to the country’s environmental sustainability goals. This work highlights the importance of local policies in advancing broader environmental benefits and emphasizes the need for considering the interactions between different regions in developing environmental strategies and public policies.
The limitations of this study are associated with the typical constraints of surveys relying on questionnaires and errors related to the contingent valuation method. Additionally, the model does not include all variables that could influence the dependent variable. Moreover, it is possible that the model contains instrumental or sampling errors that affect its precision.

Author Contributions

Conceptualization, M.d.R.A. and H.A.; methodology, M.d.R.A. and A.N.d.A.; software, M.d.R.A.; validation, A.N.d.A., A.A.B., and M.F.d.P.; formal analysis, M.d.R.A.; investigation, M.d.R.A.; resources, H.A.; data curation, M.d.R.A.; writing—original draft preparation, M.d.R.A. and H.A.; writing—review and editing, A.N.d.A., M.F.d.P., A.A.B., and E.A.T.M.; visualization, A.N.d.A.; supervision, E.A.T.M.; project administration, H.A. All authors have read and agreed to the published version of the manuscript.

Funding

This research received no external funding.

Institutional Review Board Statement

Not applicable.

Informed Consent Statement

Informed consent was obtained from all subjects involved in the study.

Data Availability Statement

Available if requested by reviewers.

Acknowledgments

The author is very grateful to UnB and CAPES.

Conflicts of Interest

The authors declare no conflicts of interest.

Appendix A. Questionnaire on the Economic Valuation of the UnB Arboretum

WTP Estimation Model
1. For the conservation and improvement of the environmental quality of the Arboretum of the University of Brasilia, a natural preservation area located on the Campus of Asa Norte, a minimum allowance from the population would be necessary, since UnB has exhausted the financial resources for its preservation and maintenance. In this case, considering the environmental benefits provided by this asset, how much would you be willing to pay, monthly along with the water bill, for this environmental asset? (value in R$)
( ) Wouldn’t pay ( ) R$ 1 ( ) R$ 3 ( ) R$ 5 ( ) R$ 7 ( ) R$ 10
( ) R$ 15 ( ) R$ 20 ( ) R$ 25 ( ) R$ 30 ( ) More than R$ 35 ( ) Other Value:_______
2. What is the reason for the unwillingness to pay? (if you chose not to pay)
( ) I don’t know what it’s about.
( ) I do not accept to pay for the protection and maintenance of the Arboretum.
( ) I don’t care about the preservation of the environment and environmental quality.
( ) I do not believe that the preservation of the Arboretum would bring environmental benefits to society.
( ) That wouldn’t help protect more.
( ) I already pay enough taxes.
( ) It is responsibility of the government.
( ) It is responsibility of the UnB.
( ) I already have a lot of daily expenses.
( ) I am satisfied with the existing situation.
( ) I don’t trust the veracity of the system.
( ) I’m not interested in the topic.
( ) I don’t care about the Arboretum.
( ) I find it difficult to access.
( ) I live far from the Arboretum.
( ) Other:_________________________
Psychographic Variables
3. For each of the statements presented below, what is your degree of agreement on a scale of five degrees: (5) Strongly agree; (4) Agree; (3) Neither agree nor disagree; (2) Disagree; (1) Strongly disagree
( )Humans are part of the Earth and need to live in balance with nature, as we depend on essential natural resources for our survival, such as clean water, a mild climate, fertile soil, and fresh air.
( )Development must respect the boundaries of ecosystems, as natural resources are finite and essential for life, not just commodities to be exploited. Therefore, it is crucial for society to become aware of the environment.
( )Our political and economic choices impact the environment, but as citizens we have significant influence. The solution to environmental problems lies in our changing behavior and doing our part, because what we have is the result of human choices and can be changed.
( )The Arboretum should be privatized due to the lack of resources from the University of Brasilia for its maintenance.
Environmental Variables
4. Do you know what an Arboretum is?
( ) Yes ( ) No
5. Do you know that the University of Brasilia has an Arboretum?
            ( ) Yes ( ) No
6. Do you often visit the Arboretum?
            ( ) Always ( ) Very often ( ) Often ( ) Occasionally ( ) Rarely ( ) Very rarely or almost never ( ) Never
7. For each of the statements presented below, what is your degree of agreement on a scale of five degrees: (5) Strongly agree; (4) Agree; (3) Neither agree nor disagree; (2) Disagree; (1) Strongly disagree
            ( ) The Arboretum must be protected due to the existence of springs and watercourses, as well as the collection of forest species (especially native vegetation).
            ( ) The riparian forests present in the Arboretum are not important for the protection of the springs.
            ( ) Soil erosion does not influence the vegetation present in the Arboretum.
            ( ) The Arboretum influences the maintenance of the world’s climate.
            ( ) The neglect of the Arboretum area generates several environmental problems, such as waste disposal, which can become a problem for the city.
8. Which of these categories do you consider most important about the benefits provided by the Arboretum to society?
            ( ) Public visitation, contemplation.
            ( ) Environmental education, scientific research and extension.
            ( ) Protection of native vegetation.
            ( ) Protection of springs and watercourses, erosion prevention, nutrient cycling.
            ( ) Biodiversity, natural resources, fauna and flora.
            ( ) Inheritance and security.
9. Do you believe that people would be willing to pay more for the preservation and conservation of the Arboretum, if it were better cared for, publicized and accessible to the community, whether for visitation or research?
( ) Yes ( ) No
10. Would you be willing to pay more for the preservation and maintenance of the Arboretum if you lived near it?
( ) Yes ( ) No
Socioeconomic Variables
11. Gender:
( ) Male ( ) Female
12. Age: (years)
            ( ) Under 20 ( ) 20–31 ( ) 32–44 ( ) 45–59 ( ) 60–65 ( ) Over 65
13. Do you live in the Federal District?
            ( ) Yes ( ) No
14. Place of Residence: (if you reside in the Federal District)
            ( ) Asa Norte ( ) Other:_________
15. In which state do you reside? (if you do not live in the Federal District) _______________
16. Educational Level:
            ( ) No education ( ) Incomplete primary education ( ) Primary education
            ( ) Incomplete secondary education ( ) Secondary education ( ) Incomplete higher education
            ( ) Higher education ( ) Postgraduate ( ) Other:___________
17. Occupation:
            ( ) Student ( ) Worker ( ) Other:_______
18. Monthly Family Income: (minimum wages)
            ( ) Up to 1 ( ) 1 to 3 ( ) 3 to 5 ( ) 5 to 7 ( ) 7 to 9
            ( ) 9 to 12 ( )12 to 15 ( ) 15 to 20 ( ) 20 to 25 ( ) 25 to 30 ( ) Over 30

References

  1. Raymundo, E.P.B.; Biondi, D.; Dacól, F.V.; Leal, M.d.S.; Reksidler, K. Microclimatic effects of an urban forest fragment in Curitiba—PR. Rev. Soc. Bras. Arborização Urbana 2020, 15, 18–27. [Google Scholar] [CrossRef]
  2. Guirao, A.C.; Filho, J.T. Preservation of an urban forest fragment—Case study: The ARIE Santa Genebra forest, Campinas—SP. Geousp—Espaço e Tempo 2011, 15, 147–158. Available online: https://www.revistas.usp.br/geousp/article/view/74193/77836 (accessed on 23 June 2024). [CrossRef]
  3. Bargos, D.C.; Matias, L.F. Urban green areas: A review study and conceptual proposal. Rev. Soc. Bras. Arborização Urbana 2011, 6, 172–188. [Google Scholar] [CrossRef]
  4. Martini, A.; Biondi, D. Microclimate and thermal comfort of an urban forest fragment in Curitiba, PR. Floresta e Ambiente 2015, 22, 182–193. [Google Scholar] [CrossRef]
  5. Oke, T.R.; Mills, G.; Christen, A.; Voogt, J.A. Urban Climates, 1st ed.; Cambridge University Press: Cambridge, UK, 2017. [Google Scholar]
  6. Alves, R.S.; Fialho, E.S. Urban climate. Rev. Geogr. 2012, 1, 8–16. [Google Scholar] [CrossRef]
  7. Biondi, D.; Batista, A.C.; Martini, A.; Grise, M.M. The microclimatic effect of the Capão da Imbuia forest in the city of Curitiba—PR, Brasil. In Proceedings of the Fifth Latin American Forest Congress, Lima, Peru, 18–21 October 2011. [Google Scholar]
  8. Martelli, A.; Junior Santos, A.R. Urban Afforestation in the municipality of Itapira—SP: Perspectives for environmental education and its influence on thermal comfort. Rev. Eletrônica Gest. Educ. Tecnol. Ambient. 2015, 19, 1018–1031. [Google Scholar]
  9. Barbirato, G.M.; Souza, L.C.L.; Torres, S.C. Climate and City: The Climatic Approach as a Subsidy for Urban Studies, 1st ed.; Edufal: Maceió, Brazil, 2007. [Google Scholar]
  10. Tong, S.; Wong, N.H.; Tan, C.L.; Jusuf, S.K.; Ignatius, M.; Tan, E. Impact of urban morphology on microclimate and thermal comfort in northern China. Sol. Energy 2017, 155, 212–223. [Google Scholar] [CrossRef]
  11. Queirós, A.R.S. Environmental Valuation of the Cocó State Park (CE). Master’s Dissertation, Department of Hydraulic and Environmental Engineering, Federal University of Ceará, Fortaleza, Brazil, 2020. [Google Scholar]
  12. May, P.H.; Lustosa, M.C.; da Vine, V. Economics of the Environment; Elsevier: Rio de Janeiro, Brazil, 2003. [Google Scholar]
  13. da Motta, R.S. Manual for the Economic Valuation of Environmental Resources; IPEA/MMA/UNDP/CNPq: Brasília, Brazil, 1998. [Google Scholar]
  14. Willis, K.G.; Corkindale, J.T. Environmental Valuation: New Perspectives; CAB International: Wallingford, UK, 1995. [Google Scholar]
  15. Bateman, I.J.; Turner, R.K. Valuation of the environment, methods and techniques: The contingent valuation method. In Sustainable Environmental Economics and Management: Principles and Practice; Turner, R.K., Ed.; Belhaven Press: London, UK, 1993; pp. 120–191. [Google Scholar]
  16. Muñoz, J.P. Economic Valuation of the Brasilia National Park. Master’s Dissertation, Graduate Program in Forest Sciences, University of Brasilia, Brasilia, Brazil, 2015. [Google Scholar]
  17. Almeida, A.N.; Versiani, R.d.O.; Soares, P.R.C.; Angelo, H. Environmental assessment of the Olhos d’Água Park: Application of the willingness to pay method. Floresta e Ambiente 2017, 24, e00094714. [Google Scholar] [CrossRef]
  18. FUB (University of Brasília Foundation). Rector’s Office. Physical Master Plan of the Darcy Ribeiro University Campus; Universidade de Brasília: Brasília, Brazil, 1998; 290p. [Google Scholar]
  19. Nunes, G. Survey of Invasion of the Grass Brachiaria decumbens in an Area Inserted in the Arboretum of UnB; Undergraduate Monograph in Geography; University of Brasilia: Brasilia, Brazil, 2012. [Google Scholar]
  20. Yamane, T. Statistics: An Introductory Analysis; Harper and Row: New York, NY, USA, 1967. [Google Scholar]
  21. UnB. Anuário Estatístico da UnB; Decanato de Planejamento, Orçamento e Avaliação Institucional (DPO), Novembro de 2023. Available online: https://anuario2023.netlify.app (accessed on 28 April 2024).
  22. Dillman, D.A.; Smyth, J.D.; Christian, L.M. Internet, Phone, Mail, and Mixed-Mode Surveys: The Tailored Design Method, 4th ed.; John Wiley & Sons Inc.: Hoboken, NJ, USA, 2014. [Google Scholar]
  23. Hanemann, W.M. Welfare Evaluation in contingent valuation experiments with discrete response. Am. J. Agric. Econ. 1984, 66, 332–341. [Google Scholar] [CrossRef]
  24. Straughan, R.D.; Roberts, J.A. Environmental segmentation alternatives: A look at green consumer behavior in the new millennium. J. Consum. Mark. 1999, 16, 558–575. [Google Scholar] [CrossRef]
  25. Hair, J.F., Jr.; Anderson, R.E.; Tatham, R.L.; Black, W.C. Multivariate Data Analysis, 5th ed.; Bookman: Porto Alegre, Brazil, 2005. [Google Scholar]
  26. Iglesias, C.T. Goodness of Fit Methods in Logistic Regression. Master’s Thesis, University of Granada, Granada, Spain, 2013. [Google Scholar]
  27. Gujarati, D.N. Basic Econometrics, 4th ed.; Makron Books: São Paulo, Brazil, 2006. [Google Scholar]
  28. IBGE (Brazilian Institute of Geography and Statistics). Minimum Wage Adjustment Index; IBGE: Brasília, Brazil, 2024. Available online: https://sidra.ibge.gov.br/tabela/91 (accessed on 2 May 2024).
  29. Angelo, H.; Almeida, A.N.; Vasconcelos, P.G.A.; Gaspar, R.O.; Paula, M.F.; Matricard, E.A.T. Economic valuation of the National Park of Brasilia. Rev. Eletrônica Gest. Educ. Tecnol. Ambient. 2020, 24, e8. [Google Scholar] [CrossRef]
  30. Mota, J.A. Valuation of Environmental Assets as a Subsidy for Public Decision-Making. Ph.D. Thesis, Center for Sustainable Development, University of Brasilia, Brasilia, Brazil, 2000. [Google Scholar]
  31. Morgado, R.C.; Abreu, L.M.; Requia, W.J.; Aravéchia, J.C. Environmental valuation of the multi-use ecological park Águas Claras—DF: Analyzing the willingness to pay of users. Rev. Estud. Ambient. 2011, 13, 6–17. [Google Scholar]
  32. Adams, C.; Motta, R.S.; Ortiz, R.A.; Sinisgalli, A. The use of contingent valuation for evaluating protected areas in the developing world: Economic valuation of Morro do Diabo State Park, Atlantic Rainforest, São Paulo State (Brazil). Ecol. Econ. 2008, 66, 359–370. [Google Scholar] [CrossRef]
  33. Afonso, A.C.B. The Green Consumer: Profile and Buying Behavior. Master’s Thesis, Institute of Economics and Management, Technical University of Lisbon, Lisbon, Portugal, 2010. [Google Scholar]
  34. Rowlands, I.H.; Parker, P.; Scott, D. Consumers and Green Electricity: Profiling Potencial Purchase. Bus. Strategy Environ. 2003, 12, 36–48. [Google Scholar] [CrossRef]
  35. Webster, F.E., Jr. Determining the characteristics of the socially conscious consumer. J. Consum. Res. 1975, 2, 188–196. Available online: http://www.jstor.org/stable/2489054 (accessed on 7 May 2024). [CrossRef]
  36. Romeiro, M.D.C. A Study on Environmentally Favorable Consumer Behavior: A Verification in the ABC Paulista Region. Ph.D. Thesis, School of Economics, Administration and Accounting, University of São Paulo, São Paulo, Brazil, 2006; 358p. [Google Scholar]
  37. Mainieri, T.; Barnett, E.G.; Valdero, T.R.; Unipan, J.B.; Oskamp, S. Green Buying: The influence of Environmental Concern on Consumer Behavior. J. Soc. Psychol. 1997, 137, 189–204. [Google Scholar] [CrossRef]
  38. Laroche, M.; Bergeron, J.; Barbaro-Forleo, G. Targeting consumers who are willing to pay more for environmentally friendly products. J. Consum. Mark. 2001, 18, 503–520. [Google Scholar] [CrossRef]
  39. Brugnaro, C. Value Attributed by the Population to the Riparian Forests of the Corumbataí River Basin, SP. Ph.D. Thesis, Graduate Program in Applied Economics Sciences at the “Luiz de Queiroz” School of Agriculture. University of São Paulo, São Paulo, Brazil, 2000. [Google Scholar]
  40. Silva, R.G. Valuation of the “Chico Mendes” Environmental Park, Rio Branco-AC: A Probabilistic Application of the Referendum Method with Bidding Games. Master’s Dissertation, Graduate Program in Economics. Department of Rural Economics, Federal University of Viçosa, Viçosa, Brazil, 2003. [Google Scholar]
  41. Cirino, J.F.; Lima, J.E. Contingent valuation of the São José-MG Environmental Protection Area (APA): A case study. Rev. Econ. Sociol. Rural 2008, 46, 647–672. [Google Scholar] [CrossRef]
  42. De Almeida, A.N.; Da Silva, J.C.G.L.; Gonçalves, A.O.; Angelo, H. Determinants of Environmental Behavior in Brasília. J. Environ. Manag. Sustain. 2015, 4, 46–56. [Google Scholar] [CrossRef]
  43. Bissonnette, M.M.; Contento, I.R. Adolescents’ perspectives and food choice behaviors in terms of the environmental impacts of food production practices: Aplication of a psychosocial model. J. Nutr. Educ. 2001, 33, 72–82. [Google Scholar] [CrossRef]
  44. Chan, T.S. Concerns for environmental issues and consumer purchase preferences: A two-country study. J. Int. Consum. Mark. 1996, 9, 43–55. [Google Scholar] [CrossRef]
  45. EMBRAPA (Brazilian Agricultural Research Company). Socio-Economic Evaluation of the Brasilia National Park; National Center for Research in Genetic Resources, CENARGEN/EMBRAPA: Brasília, Brazil, 1999. [Google Scholar]
  46. Leite, D.C.; Jacoski, C.A. User behavior in contingent valuation and travel cost: The case of Palmeiras Park in Chapecó, SC, Brazil. Ambiente e Agua—Interdiscip. J. Appl. Sci. 2010, 5, 226–235. [Google Scholar] [CrossRef]
  47. Gao, D.; Zhou, X.; Wan, J. Unlocking sustainability potential: The impact of green finance reform on corporate ESG performance. Corp. Soc. Responsib. Environ. Manag. 2024, 31. [Google Scholar] [CrossRef]
  48. Zhang, H.; He, Q.M.; Zhao, X. Balancing herding and congestion in service systems: A queueing perspective. Inf. Syst. Oper. Res. 2020, 58, 511–536. [Google Scholar] [CrossRef]
  49. Jankalová, M.; Kurotová, J. Sustainability assessment using economic value added. Sustainability 2019, 12, 318. [Google Scholar] [CrossRef]
  50. Downing, M.; Roberts, R.K. Estimating visitor use-value of arboreta: The case of the University of Tennessee Arboretum. J. Environ. Hortic. 1991, 9, 207–210. [Google Scholar] [CrossRef]
  51. Gao, D.; Feng, H.; Cao, Y. The spatial spillover effect of innovative city policy on carbon efficiency: Evidence from China. Singap. Econ. Rev. 2024, 1–23. [Google Scholar] [CrossRef]
Figure 1. Location map of the Arboretum (SN-13), surrounded by a yellow line, in Asa Norte, Brasília, Federal District, Brazil. Satellite image.
Sustainability 16 05724 g001
Figure 2. Sections of the Arboretum of the University of Brasilia.
Sustainability 16 05724 g002
Figure 3. Dispersion of model residuals.
Sustainability 16 05724 g003
Table 1. Values of the coefficients and the p-values of the independent variables.
Independent VariableCoefficientp-Value
Constant0.740.02
At
1
0.890.30
EC
1
−0.520.76
EP
1
−1.310.13
L
1
0.840.09
AK
1
0.400.32
UAK
1
−1.100.01
VF0.480.03
EK
1
1.330.01
G
1
0.160.66
A−0.230.31
RP
1
0.090.84
LE0.160.51
Oc
1
0.010.99
IM0.040.56
Table 2. Hypothesis test.
TestDFChi-Square Statisticp-Value
Deviance293222.780.999
Pearson293320.490.129
Hosmer–Lemeshow89.000.342
Table 3. Values of the coefficients and the p-values of the significant variables.
Independent VariableCoefficientp-Value
Constant0.810.00
UAK
1
−0.980.01
VF0.490.01
EK
1
1.410.00
Table 4. Values of the coefficients and the p-values of the independent variables and interaction terms.
Independent VariableCoefficientp-Value
Constant−1.970.14
At
1
1.280.65
EC
1
−0.940.70
EP
1
−1.570.50
L
1
12.150.09
AK
1
0.560.64
UAK
1
0.900.75
VF1.400.09
EK
1
2.210.18
G
1
0.170.76
A−1.160.03
RP
1
−0.100.93
LE0.960.03
Oc
1
−0.150.87
IM0.540.34
VF*A0.100.52
A*IM0.130.12
LE*IM−0.130.20
VF*AK
1
−1.260.14
A*AK
1
0.300.51
A*UAK
1
0.070.91
LE*L
1
−1.810.09
LE*UAK
1
−0.480.42
IM*Oc
1
−0.020.94
At*EP
1 1
0.200.94
At*EK
1 1
−0.730.67
L*Oc
1 1
−2.520.31
AK*EK
1 1
−0.290.80
UAK*G
1 1
0.400.61
UAK*RP
1 1
−0.110.91
EK*RP
1 1
0.280.82
Table 5. Hypothesis test with the inclusion of interaction terms.
TestDFChi-Square Statisticp-Value
Deviance277210.490.999
Pearson277320.990.035
Hosmer–Lemeshow811.780.161
Disclaimer/Publisher’s Note: The statements, opinions and data contained in all publications are solely those of the individual author(s) and contributor(s) and not of MDPI and/or the editor(s). MDPI and/or the editor(s) disclaim responsibility for any injury to people or property resulting from any ideas, methods, instructions or products referred to in the content.

