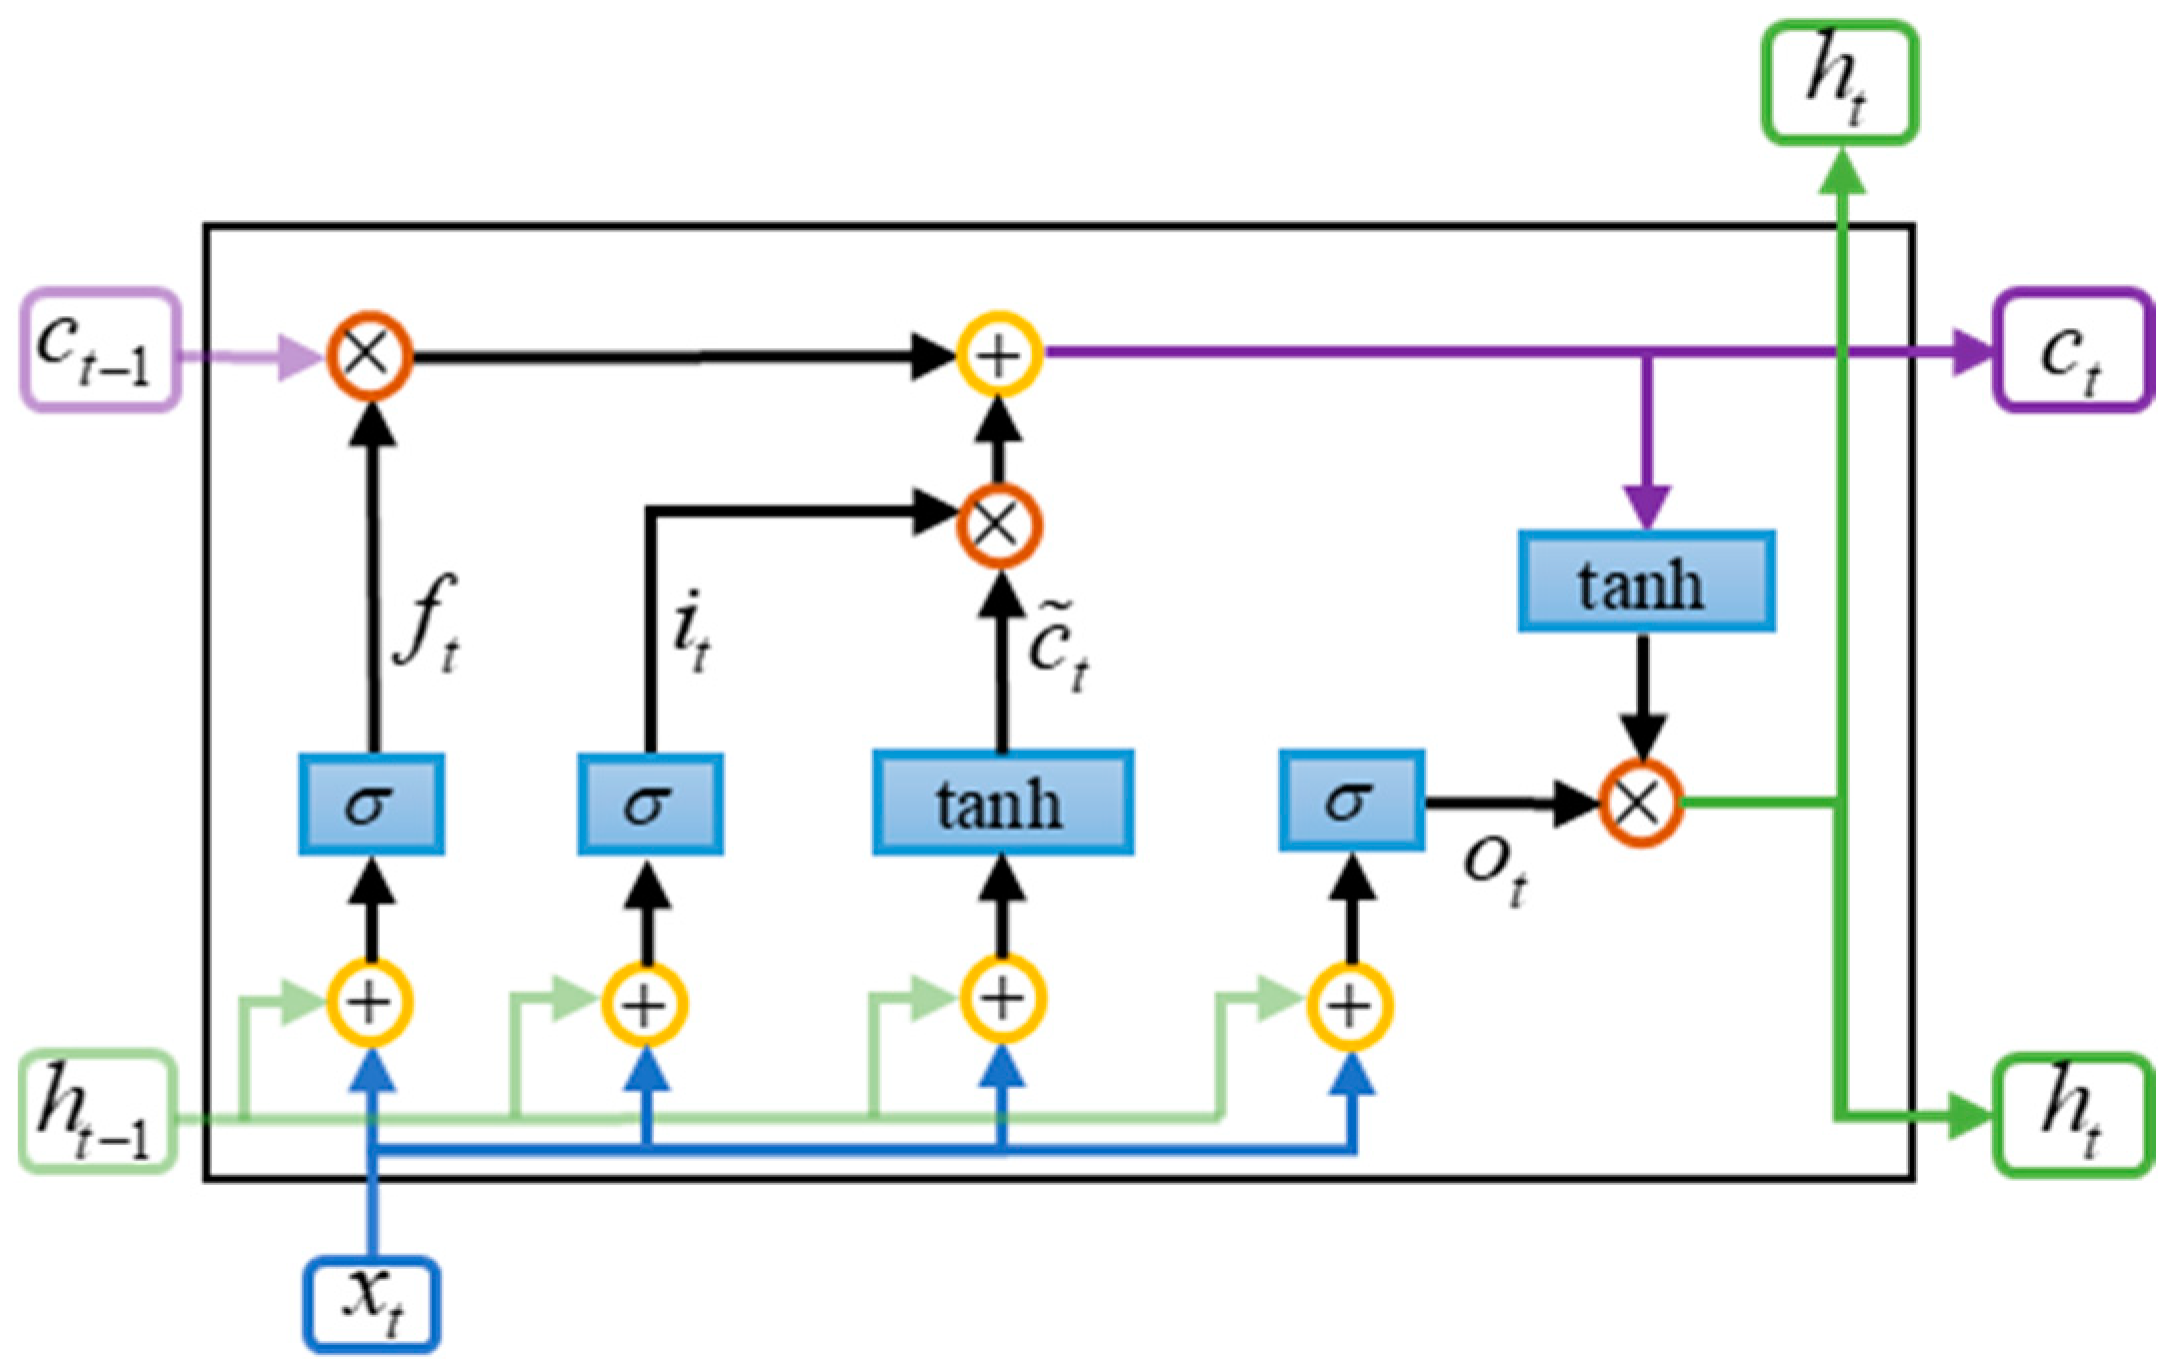
3.1. ConvLSTM
The traditional recurrent neural network (RNN) model yields good results in time series prediction due to its unique chain structure. However, when it comes to long sequence problems, the parameter sharing among its different units can lead to gradient explosion or vanishing, which in turn can cause nonconvergence. To solve this problem, Sepp Hochreiter and Jürgen Schmidhuber [
28] proposed the LSTM model based on an RNN. Each LSTM cell consists of the four following components: a forgetting gate, an input gate, an output gate, and a memory cell. The structure is shown in
Figure 1. The parameters of LSTM are separated rather than shared among the cells. In this case, the gradient vanishing and gradient explosion problems are solved.
Although LSTM can handle the time series prediction problem better, it is more difficult to handle the spatial correlation problem. In other words, LSTM is able to complete the time series prediction problem, but it is unable to do anything about the spatiotemporal prediction problem. Therefore, some scholars proposed the ConvLSTM model to deal with the spatiotemporal prediction problem, where ConvLSTM converts the multiplication operation in LSTM into a convolution operation. The improved ConvLSTM not only deals with 1-dimensional time series prediction problems, but also deals with 2D spatiotemporal prediction problems, which makes the model more applicable. Initially, ConvLSTM was used for rainfall prediction (i.e., to predict whether rain will fall in a region at a future moment and its intensity) [
29], and it is also widely used in the field of transport.
The first is the forgetting gate, which determines what information was forgotten in the past. By reading the output of the previous cell
and the input of the current cell
, each element is converted to a value of 0–1 by a sigmoid function. It is calculated using the following formula [
28,
29]:
where both
and
denote the weight matrix,
is the bias vectors, and
denotes the sigmoid activation function.
The input gate determines what new information will be stored in the cell state. It consists of two parts. The first is the selective update, which decides which parts to update by using the sigmoid function. The other part is the candidate layer, which uses the tanh function to generate new candidate values that may be added to the cell state
[
28,
29]
where
,
,
, and
are the weights and
and
denote the bias vectors.
Then there is the cell state update, which updates the cell state by combining the results of the forgetting gate and the input gate [
28,
29]
Finally, there is the output gate, which decides which information in the cell state should be passed on to the hidden state at the next moment or as model output at the current moment. The activation value of the output gate is computed from the current input
and the hidden state of the previous cell
by a fully connected layer with a sigmoid activation function, and is then elementwise multiplied by the value of the cell state after the tanh function to obtain the final state
[
28,
29]
where
and
are the weights,
denotes the bias vectors, and
is the Hadamard product, denoting the matrix multiplication by elements.
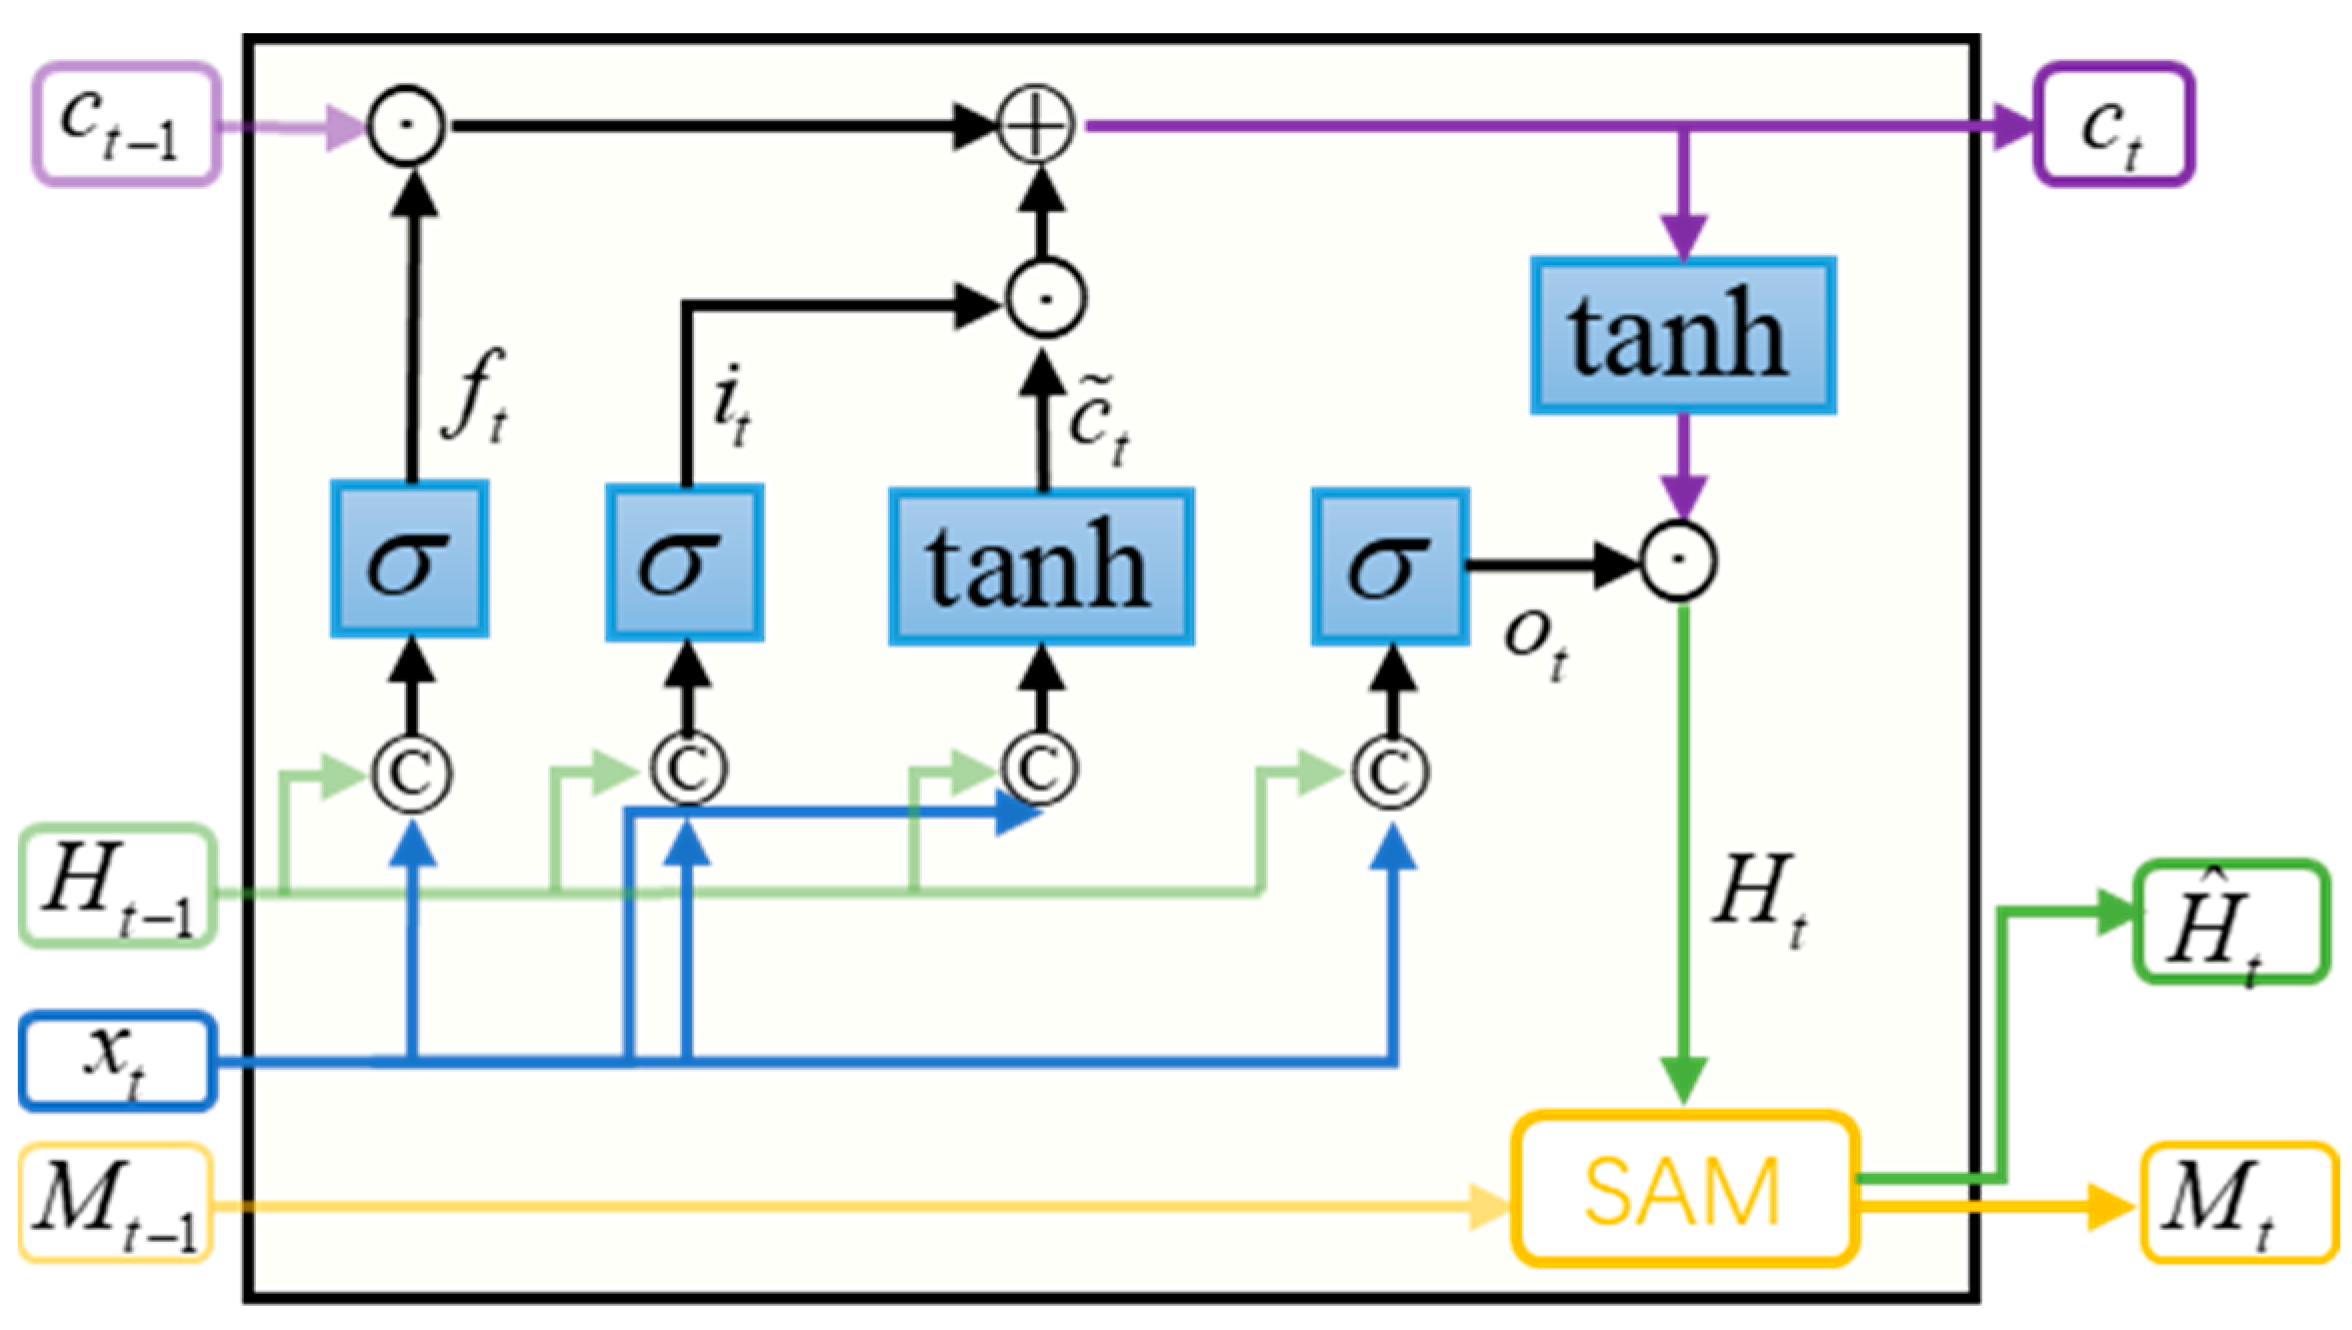
3.2. Sa-ConvLSTM
Sa-ConvLSTM was proposed in 2020 [
30]. The traditional ConvLSTM can only acquire a small range of spatial relations, and the size of the range is determined by the size of the convolutional kernel. To extract a larger range of spatial correlations, one can only increase the number of convolution kernels or stack more ConvLSTM layers. Increasing the size of the convolutional kernel inevitably leads to a significant increase in computational load, which is detrimental to the stacking of model depth. Moreover, stacking additional layers of ConvLSTM tends to perform poorly. In this case, Sa-ConvLSTM introduces the self-attention mechanism into ConvLSTM, enabling global correlation capture with fewer layers. Sa-ConvLSTM does not simply inlay the self-attention mechanism into the model, but rather optimizes the self-attention mechanism further to obtain the memory-based self-attention memory (SAM) module. The SAM module is embedded into the model, and its structure is shown in
Figure 2. From the figure, we can see that compared with the ConvLSTM model, the Sa-ConvLSTM model has an extra SAM module, which realizes the updating of the memory cells and the output feature maps of the current time step. Compared with the ConvLSTM model, the Sa-ConvLSTM model not only obtains the long-term spatiotemporal dependence through adaptive updating, but also extracts the global spatial dependence to a certain extent through the self-attention module. If this module is removed, the Sa-ConvLSTM model will become a ConvLSTM model.
The specific structure of the SAM module is shown in
Figure 3. The input of this structure contains two inputs, which are the input feature map
of the current time step and the output of the memory cell
of the previous time step, and the capture of long-term spatial dependencies is accomplished according to the three parts of feature aggregation, memory updating, and outputs, and the final outputs are the memory cell
of the current time and the final output of the current time step
[
30].
In the feature aggregation step, similar to the self-attention mechanism, the output of the current time step and the memory cell of the previous unit are projected to and , and the aggregated features are obtained after splicing and convolution.
First, the query
, the key
, and the value
of the initial feature map
, and the key
and the value
of the memory cell
can be computed by the following equations [
23]:
In these equations, , , , , and denote 1 × 1 convolutions.
Query
and key
are multiplied to obtain similarity scores, which indicate the relevance of the current position to other positions [
23,
30]
Based on these proposed equations, the similarity scores calculation of different positions of feature map
and the similarity scores calculation of different positions of memory cell
can be simplified by using the following two formulas:
Next, the similarity scores
and
are input into the softmax function to obtain the attention weights
and
. The softmax function converts the raw scores into a probability distribution such that the sum of the attention weights for all positions is 1. The formula is as follows [
31]:
The aggregated feature for the
th position is derived by multiplying the attention score weighting with the corresponding
[
31]
The final aggregated features are obtained by splicing
and
, computing them by 1 × 1 convolution
After feature aggregation, the memory unit
needs to be updated. The memory update module enables the SAM module to capture long-range dependencies in both spatial and temporal domains. By aggregating the feature
and current time step output
, the memory unit
is updated using a gating mechanism similar to that of LSTM, which can be expressed as follows [
23,
30]:
where
,
,
, and
denote the weight matrix and
and
denote the bias. As
gets closer to 0, it means that more information was left in the previous cell.
The final output is obtained by combining the updated memory cell
with the output gates
of the SAM module [
23,
30]
where
and
denote the weight matrix and
denotes the bias.
The Sa-ConvLSTM model is obtained by embedding the SAM module into the ConvLSTM model, and its computational procedure is shown below. Equations (32), (33), and (40) represent the operations of the SAM module [
23,
30].
Equations (32) and (33) represent the feature maps
and memory information
obtained after the SAM module for
and
, respectively,
where SA represents the operation of the SAM module.
Equations (34)–(39) represent the operations of the ConvLTSM model by simply replacing
with
In Equation (40),
indicates that the final feature map output is obtained
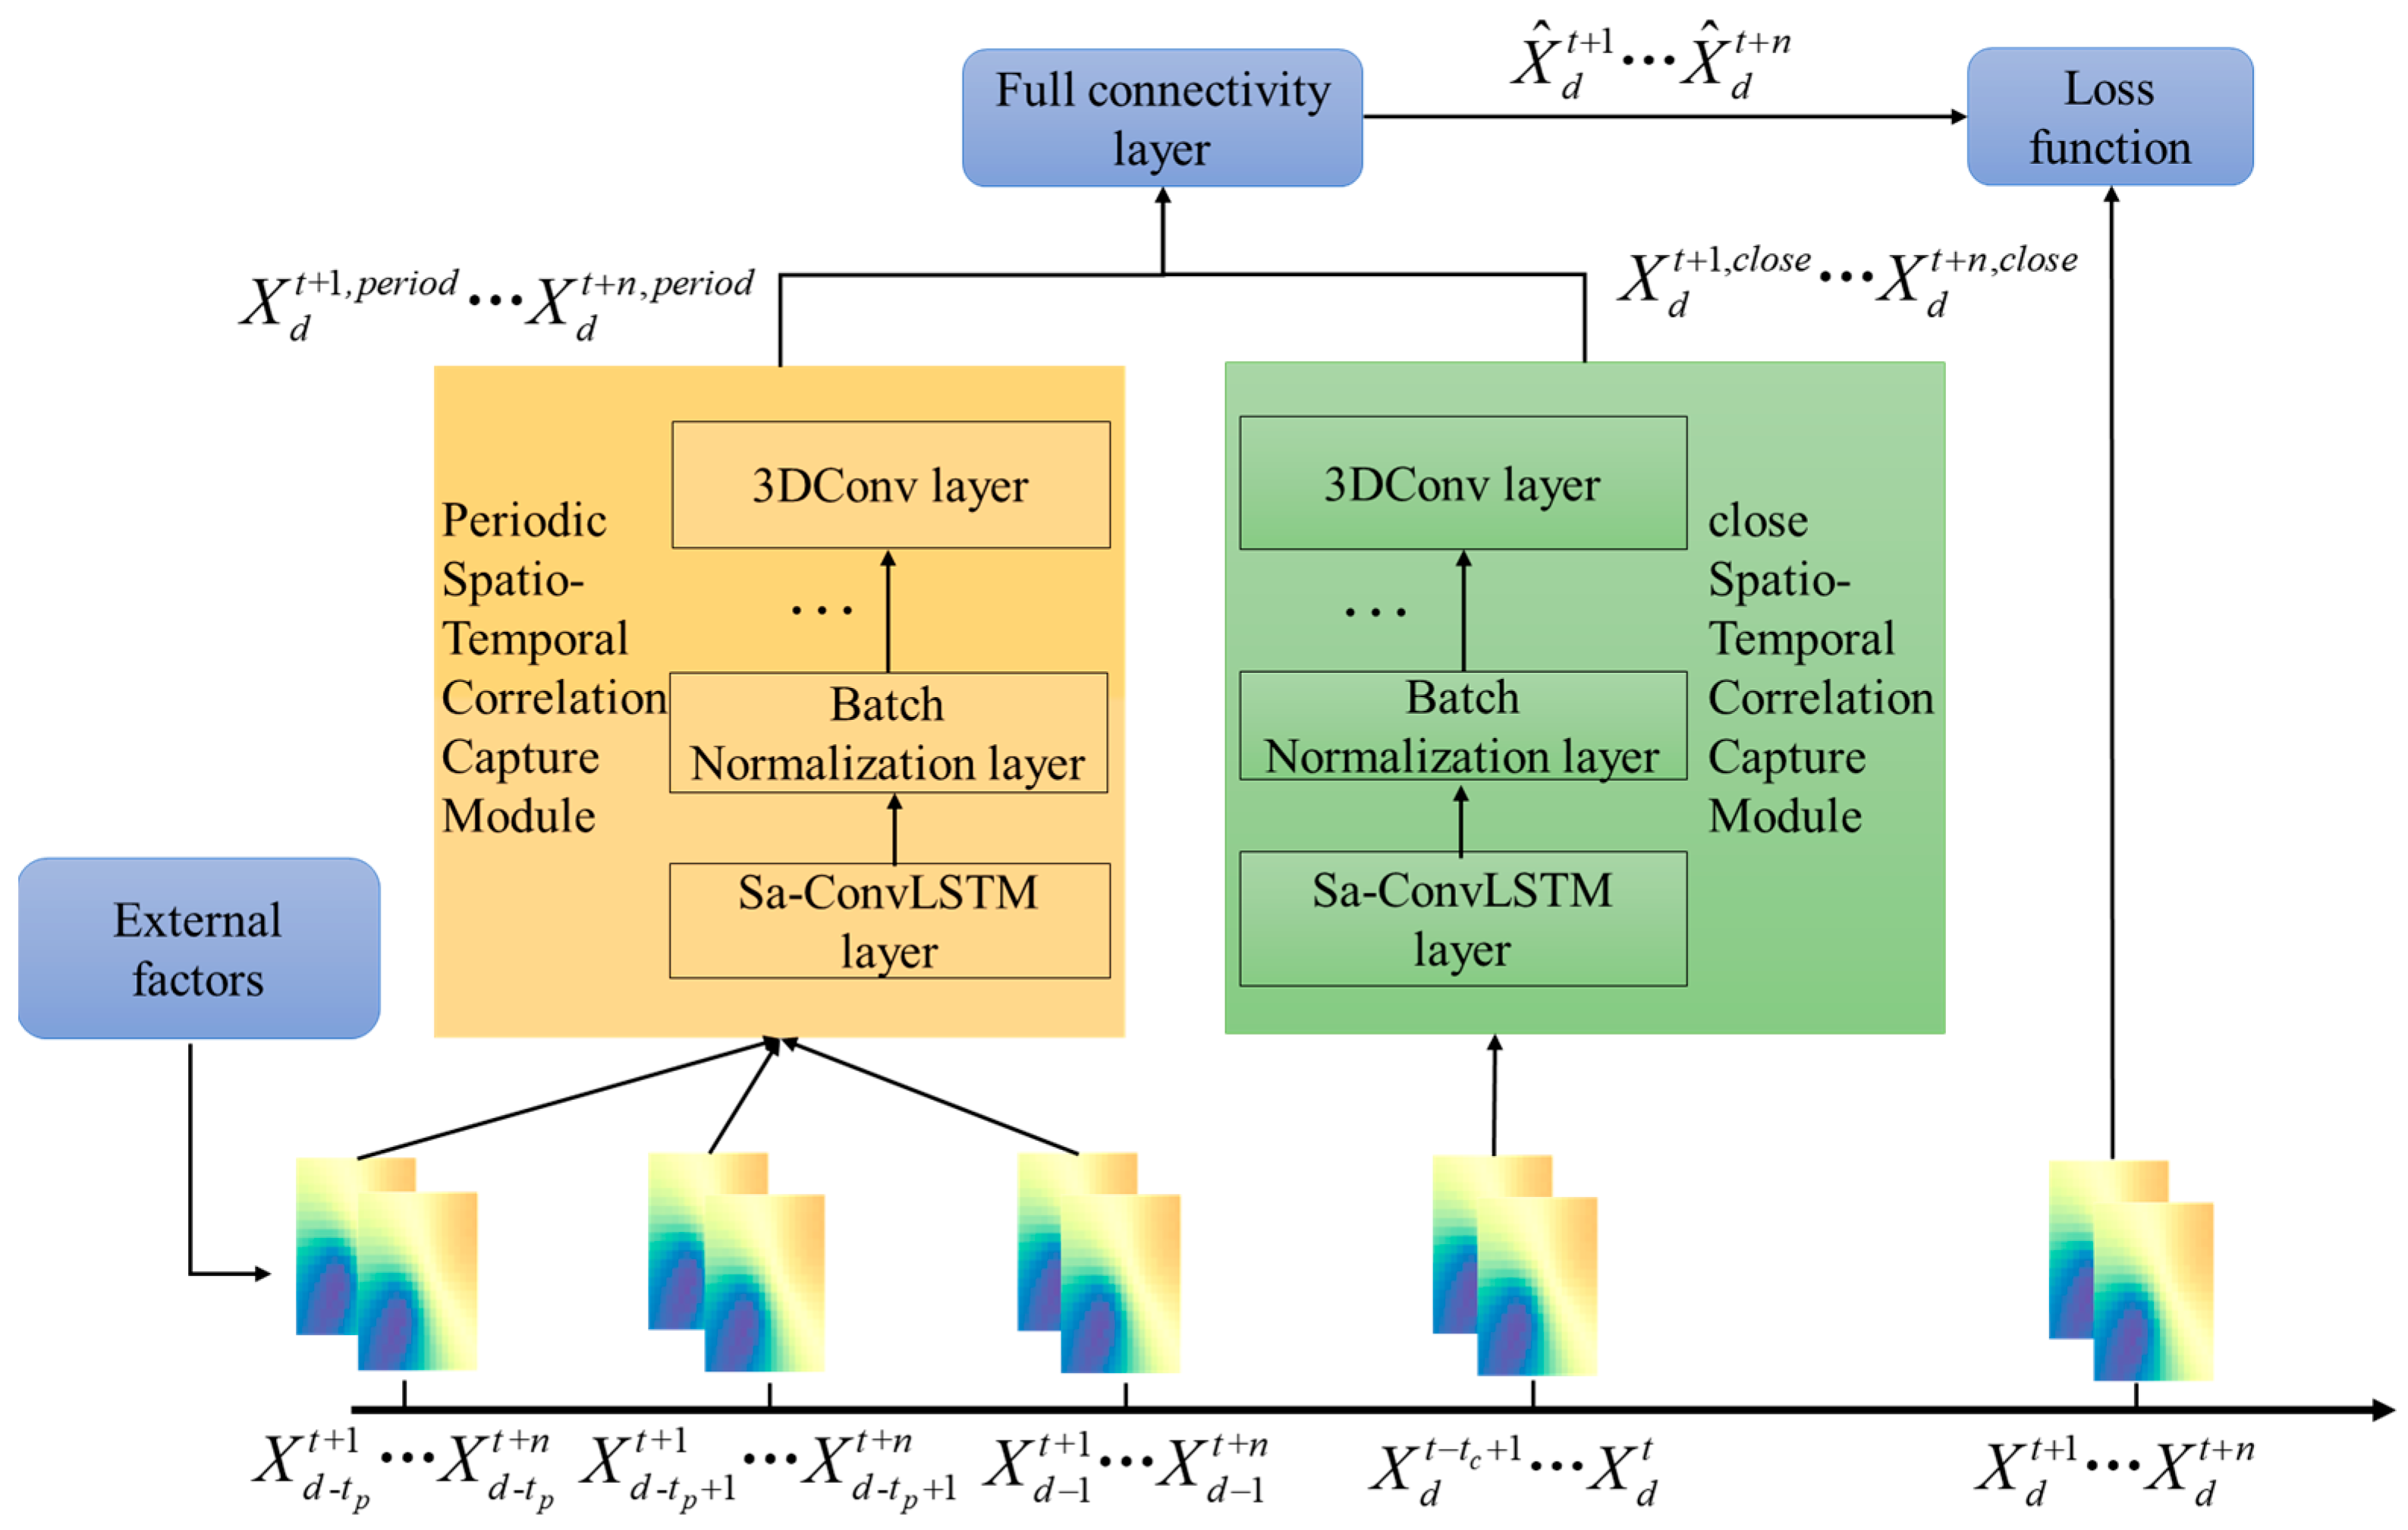
3.3. Proposed Model
In this section, the proposed model will be presented and
Figure 4 shows the main structure of the model, divided into three inputs, three modules, and the final output.
First, the input consists of three parts, which are the external factor time series , the spatiotemporal series reflecting the change pattern of cyclical net travel demand and the spatiotemporal series reflecting the change pattern of recent net travel demand , and the short-term cyclical spatiotemporal correlation capture module and the recent spatiotemporal correlation capture module accepts them, respectively, as , , , and . These two modules learn the internal spatiotemporal features present in them and output the outputs and , respectively, which are combined, and output through the fully connected layer.
To match the spatiotemporal series, we extend the external factor time series
into a spatiotemporal series
. Due to the limitations of the data available, it is not possible to determine the information on the external factors for a specific region, and we assume that there is no spatial variation in the factors. The inputs to the model can be expressed as
For subsequent ease of representation, we use and to simply denote and .
The periodic spatiotemporal correlation capture module and the near-term spatiotemporal correlation capture module receive two inputs, respectively, and are dropped into the 2DSa-ConvLSTM layer. It can be simply expressed by the following equations:
To prevent overfitting problems, a batch normalization (BN) layer is added after each 2DSa-ConvLSTM layer. As an example, in the periodic spatiotemporal correlation capture module, the upper output
is normalized and
is forced to transform into a distribution with mean 0 and variance 1. After normalization, two learnable parameters,
and
, were introduced to adaptively adjust the normalized data [
32]
where
indicates the mean and
means the variance.
After several layers of the 2DSa-ConvLSTM layer and the batch normalization layer, a C convolutional layer is used in the last layer of these two modules to output the prediction. The computational formula is as follows:
In this equation, , , and denote the length, width, and height of the convolution kernel, respectively, and and denote the weights and biases.
In the prediction module, the output is made by weighted fusion of the higher-order representations of the outputs of the two modules through a fully connected layer. It is computed as follows:
The loss function uses mean squared error (MSE), which is the most used of the regression loss functions and is the mean of the sum of squares of the errors
where
is the total number of predictions,
is the step size of the prediction, and
is the set of learnable parameters.


