Abstract
Carbonate reservoirs, influenced by depositional and diagenetic processes and characterized by features like faults and vugs that impact storage capacity, require more than traditional Borehole Imaging logs () for accurate porosity data. These data are essential for geological assessments, production forecasting, and reservoir simulations. This work aims to address this limitation by developing methods to measure and monitor the sustainability of carbonate reservoirs and exploring the application of sustainability principles to their management. The study integrates and conventional logs from two wells to classify porosity-based facies within the Barra Velha Formation () in the Santos Basin. The methodology involves four steps: (i) analyzing conventional logs; (ii) segmenting BHI logs; (iii) integrating conventional and segmented BHI logs using Self-Organizing Maps (); and (iv) interpreting the resulting classes. Matrix porosity values and non-matrix pore sizes categorize the porosity into four facies: (A to D). The results of this research indicate the following: Facies A has high non-matrix porosity with 14,560 small megapores, 5419 large megapores, and 271 gigapores (71.9%, 26.76%, and 1.34% of the 20,250 pores, respectively). Facies B shows moderate non-matrix porosity with 8,669 small megapores, 2642 large megapores, and 33 gigapores (76.42%, 23.29%, and 0.29% of the 11,344 pores, respectively) and medium matrix porosity. Facies C exhibits low non-matrix porosity with 7749 small megapores, 2132 large megapores, and 20 gigapores (78.27%, 21.53%, and 0.20% of the 9901 pores, respectively) and medium matrix porosity. Facies D has low non-matrix porosity with 9355 small megapores, 2346 large megapores, and 19 gigapores (79.82%, 20.02%, and 0.16% of the 11,720 pores, respectively) and low matrix porosity. The results of this research reveal the effectiveness of a semiautomatic methodology that combines and conventional well logs to distinguish between matrix and non-matrix-related pore spaces, thus enabling a preliminary classification of reservoir facies based on porosity. This study advances our understanding of carbonate reservoir sustainability and heterogeneity, thus offering valuable insights for robust, sustainable reservoir characterization and management in the context of global environmental and geological changes. The novelty of this work lies in integrating data from two sources to classify porosity across the presalt reservoir interval, thus serving as a proxy for preliminary lithofacies identification without core data.
1. Introduction
Porosity analysis provides essential geological insights that significantly impact policy decisions for sustainable energy production. By measuring the pore space within rocks or sediments, this technique helps understand the storage and flow of fluids like oil, gas, and water. This research enables policymakers to identify suitable reservoirs for energy storage, assess carbon capture and storage potential, evaluate unconventional energy resources, manage groundwater sustainably, and conduct environmental impact assessments. Although other critical parameters, such as permeability, reservoir pressure, reservoir temperature, fluid properties, and cap integrity, are essential for a comprehensive evaluation of reservoirs and informed decision making, our focus on porosity is particularly valuable. Identifying formations with high porosity supports decisions on renewable energy storage projects, such as compressed air and pumped hydroelectric storage. It also assesses the capacity of geological formations to store carbon dioxide (CO2) from industrial processes, thus guiding decisions on carbon capture and storage projects to mitigate climate change. For unconventional energy resources like shale gas and tight oil, porosity analysis evaluates viability and environmental impact, thus informing regulations and policies. It also provides insights into the porosity and permeability of aquifers for sustainable groundwater management, guiding water extraction rates, recharge strategies, and resource protection. Moreover, porosity analysis contributes to environmental impact assessments by evaluating potential groundwater contamination, subsidence, and other geological hazards. This information helps develop policies to minimize environmental impacts and ensure the responsible use of energy resources.
The significance of porosity analysis is underscored by various studies. Pavičić et al. [1] presented a geometric characterization of the measured microporosity of dolomites, thus demonstrating the direct relationship between porosity and permeability. Similarly, Ran et al. [2] investigated the mechanical properties of unconsolidated sandstone reservoirs, thus revealing how different permeability levels influence fracture propagation. Reis et al. [3] evaluated the storage potential of natural landscapes with high rock solubility, known as karsts, which underscores the relevance of porosity in assessing geological storage capabilities. Additionally, Dvanajščak et al. [4] developed a methodology for hydrogeological investigation and decision making during tunnel construction, thereby aiming to ensure the sustainability of water resources in aquifers. In summary, porosity analysis offers vital geological insights that aid policymakers in making informed decisions across various aspects of sustainable energy production and environmental protection [5].
Brazilian presalt carbonate reservoirs exhibit intricate heterogeneities, which are primarily influenced by the depositional system’s characteristics and subsequent diagenetic processes [6,7]. Identifying and characterizing geological features such as faults, fractures, caves, conduits, and vugs in these reservoirs is imperative due to their significant impact on fluid flow behaviors, thus distinguishing them from siliciclastic reservoirs dominated by matrix production [8]. Understanding these complexities is essential for improving our knowledge of the geological dynamics within carbonate reservoirs, which is crucial for their sustainable development and potential utilization in carbon capture and storage.
Recent years have seen substantial efforts directed towards comprehending the origins and impacts of primary heterogeneities, including faults, fractures, caves, and vugs, within carbonate reservoirs (e.g., [9,10]). The prediction of significant heterogeneities, such as faults (associated with tectonic processes) and caves (resulting from karstic processes), has prompted numerous studies utilizing seismic data and seismic attributes [11,12,13,14,15]. For instance, Xu et al. [11] investigated anomalous bright spots known as the String of Beads Response () on seismic migration sections, which are prevalent features in carbonate reservoirs directly associated with caves resulting from karst processes. Similarly, Yu et al. [12] characterized fault systems and paleokarst features using bright spots from seismic data and the formation of microimager logs across different scales.
However, inherent resolution limitations in seismic data underscore the challenges in achieving high-quality acquisition, given its associated costs [16]. In addressing these resolution-related concerns, some works (e.g., [14,17]) have sought to improve seismic resolution data by developing methodologies such as spectral whitening, deconvolution, and inverse Q filtering. By mitigating these resolution issues, the proposed methods enhance the precision and confidence in seismic data interpretation, thus contributing to a more nuanced understanding of the complex geological features in carbonate reservoirs. Nevertheless, some significant heterogeneities related to carbonate reservoirs, such as fractures, conduits, and vugs, cannot be recognized through seismic data due to inherent scale limitations.
On the other hand, borehole image logs () have gained widespread utilization for several purposes, including detecting subseismic features like fractures and vugs, predicting porosities [18], establishing connections between acoustic facies (derived from ) and petrophysical parameters [19], and interpreting acoustic facies in the context of depositional settings [20].
Fractures and vugs, referred to in this article as non-matrix-related pores, are of paramount importance in carbonate reservoirs, and they have been driving recent studies (e.g., [13,21,22]) focused on understanding their impact on storage, fluid flow, and oil production. However, an early step in understanding the impact of non-matrix-related pores is their identification. In this sense, play a significant role in interpreting fractures and vugs within carbonate reservoirs.
Recognizing the critical need for the expeditious assessment of fractures and vugs within carbonate reservoirs, coupled with the limited availability of for comprehensive well coverage and the high time consumption for manual interpretation, researchers (e.g., [23,24,25]) have scrutinized the response of conventional well logs to non-matrix-related pores. While conventional well logs lack the ability to provide qualitative details such as the size and shape of non-matrix-related pores, they have proven effective in offering quantitative information regarding porosity. However, detecting non-matrix-related pores solely through conventional logs poses significant challenges.
Acknowledging the inherent uncertainties associated with data, recent efforts have focused on integrating data with different scales to enhance results. Several studies, including those by Zhou et al. [22], Aghli et al. [24], Zhao et al. [26], and Zhu et al. [27], have concentrated on developing data integration approaches to reduce uncertainty and improve the identification and characterization of geological features. Zhou et al. [22] employed cluster analysis of well-logged petrophysical properties and geophysical responses to identify “sweet spots” for hydrocarbon production. Aghli et al. [24] proposed a method combining preprocessed petrophysical logs with Adaptive Neuro Fuzzy Inference for estimating fracture parameters in reservoirs. Similarly, Zhao et al. [26] integrated machine learning with Nuclear Magnetic Resonance to enhance reservoir evaluation, while Zhu et al. [27] utilized mathematical morphology to quantitatively characterize organic matter pores in deep shale reservoirs.
Mahjour et al. [28] focused specifically on reducing the uncertainties in reservoir development through distance-based clustering and metaheuristic algorithms applied to reservoir static and dynamic data. Their findings highlighted the effectiveness of the distance-based clustering method in preserving the representativeness of original data.
Despite efforts in data integration, there remains a noticeable gap in the literature regarding the integration of conventional logs and for characterizing non-matrix-related pores. Existing studies predominantly rely on core data, plugs, thin sections, or specialized well logs such as nuclear magnetic resonance () to explore porosity, though they are constrained by availability and cost limitations for widespread application across wells.
Nonetheless, the use of techniques has emerged as an indispensable tool for combining data and aiding in predicting reservoir characteristics, as evidenced by numerous publications (e.g., [29,30,31,32]). The widespread integration of techniques signifies their pivotal role in enhancing our ability to comprehend and predict crucial reservoir characteristics, especially in scenarios where conventional methods face limitations.
Recognizing the crucial sustainable role of non-matrix-related pores in carbonate reservoirs, particularly acknowledging that provide optimal visual interpretation of these features and leveraging the availability of conventional well logs, this study introduces a methodology to seamlessly integrate and three specific conventional logs (sonic, density, and photoelectric factors) through the implementation of a self-organizing map (). The primary objective is to conduct facies classification based on porosity. This approach offers distinct advantages, including the application of a semiautomatic methodology that harmonizes data from disparate sources (borehole imaging tools for and well logging tools for conventional well logs) and scales (mesoscale for and macroscale for well logs). This integration not only mitigates the time-consuming aspects associated with handling extensive datasets but also minimizes uncertainties inherent to each dataset. Additionally, the interpreted facies lend themselves to a meaningful interpretation in terms of depositional environments.
To establish a preliminary correlation between porosity-based facies and the principal lithofacies identified in the Barra Velha Formation (), we conducted an innovative analysis of datasets from varied sources and scales. This analysis employed combined machine learning techniques to streamline the traditionally time-consuming analysis process and reduce manual interpretation, thereby improving and minimizing uncertainties in the final results. The dataset utilized in this study includes conventional well logs (sonic, density, and photoelectric factors) and data from two wells drilled in the Santos Basin’s . A detailed exposition of this dataset is provided in the subsequent section. Through this innovative methodology, we aim to enhance our understanding of carbonate reservoir characteristics by integrating visual insights from with quantitative data derived from conventional logs, thus contributing to a more comprehensive and nuanced interpretation of subsurface geological features. Additionally, this work aims to contribute to the development of sustainable strategies for carbon capture and storage in these carbonate reservoirs.
2. Geological Settings
The investigation undertaken in this study focuses on the meticulous examination of two wells situated within the Santos Basin located in the southeastern margin of Brazil, as illustrated in Figure 1a. The inception of this basin can be traced back to the Late Jurassic to Early Cretaceous period, which was marked by the fragmentation of the Gondwana Supercontinent, thus consequently leading to the emergence of the South Atlantic Ocean. This geological transformation gave rise to the complex Brazilian Rift System, thus encompassing diverse basins and prominently featuring the Santos Basin [29,33,34].
As expounded by Mohriak et al. [35], the developmental trajectory of sedimentary basins along the eastern Brazilian margin, inclusive of the Santos Basin, unfolded through three discernible tectonic stages. The initial stage, termed the Rift phase, was characterized by heightened lithospheric stretching and asthenosphere uplift, thus representing a pivotal intracontinental rifting episode within the South Atlantic region. The subsequent stage, denoted as the Transitional phase, involved the cessation of synrift extension and is distinguished by the gradual diminution of sizable faults that rotated the rift block along with their sedimentary covert. The consequential break up unconformity demarcates the boundary between continental lacustrine sediments and those transitioning to marine environments [35]. In certain sedimentary basins, a significant thickness of Aptian siliciclastic and carbonate rocks has been observed between this unconformity and the evaporite transitional sequence, which is construed as a sag basin fill. Biostratigraphic and geochemical analyses provide compelling evidence that this sequence harbors hydrocarbon source rocks. During the Late Aptian, an arid climate and intermittent marine water influx facilitated the formation of an elongated salt basin stretching between the West African and eastern Brazilian margins. The third and final stage, recognized as the Drift phase, is marked by the emergence of a mid-Atlantic ridge, thus accompanied by spreading processes and widespread salt tectonics [35].
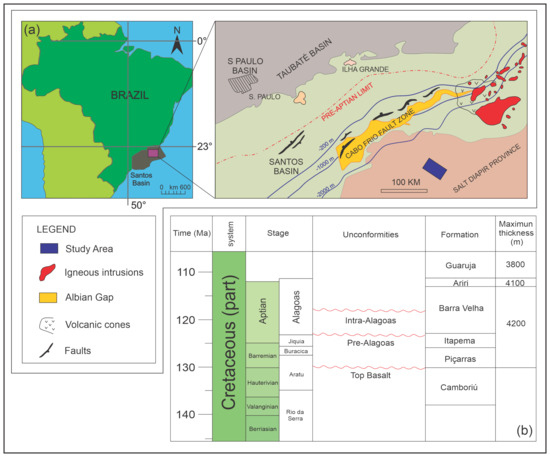
Figure 1.
(a) Location map of study area. (b) Stratigraphy chart of the . Modified from Moreira et al. [36].
The reservoir under scrutiny in this study pertains to the Aptian carbonates of the , which are strategically positioned within the aforementioned Transitional phase. The is characterized by three distinct unconformities, which are elucidated in Figure 1b: (i) The Pre-Alagoas Unconformity situated at the summit of the Itapema Formation; (ii) the Intra-Alagoas Unconformity demarcating the division of the into the Upper and Lower ; and (iii) the Salt Base Unconformity segregating the from the Ariri Formation [36,37].
The carbonates constituting the underwent their genesis in lacustrine environments, with their deposition intricately governed by factors such as salinity, pH, water level, topography, and variations in sediment supply [9]. As posited by Wright et al. [38], the development of vugs and dissolved fractures can be ascribed to intervals of subaerial exposure of prominent structures termed mounds. Tosca et al. [39], along with Poros et al. [40], contend that these mounds exhibit substantial vuggy and fracture porosities, which are hypothesized to be a consequence of the influence of elevated temperatures or hydrothermal fluids, thus facilitated by the interaction between Mg-silicate and the carbonates.
The predominantly comprises in situ and reworked carbonates, thus encompassing diverse lithologies: (1) carbonates fashioned in the form of calcite crystal shrubs; (2) spherulites; (3) reworked carbonates consisting of intraclasts; and (4) locally extensive and laterally persistent accumulations of carbonate mud. These lithological constituents are consistently associated with a broad spectrum of pore sizes [37,41,42].
In conclusion, this study delves into the geological intricacies of the Santos Basin, specifically within the context of the Aptian carbonates of the . By elucidating the tectonic stages and depositional characteristics of the basin, we gain valuable insights into the geological processes that have shaped this region. Furthermore, the detailed analysis of the sheds light on the diverse lithologies and pore structures within the reservoir, thus offering crucial information for understanding and optimizing hydrocarbon exploration and extraction in similar geological settings.
3. Materials and Methods
In Figure 2, the mind map illustrates the sequential progression of the steps devised within the dataset and methods framework. The initial elucidation pertains to the dataset, thus encompassing conventional logs (specifically, the Density Log, Sonic Log, and Photoelectric Factor Log) and borehole images, which feature the Ultrasonic Borehole Imager () and Circumferential Borehole Imaging Log (). The comprehensive dataset forms the foundational basis for subsequent analytical procedures. Lastly, but of paramount importance, the articulated methods include petrophysical analysis, image segmentation for pore size classification, and the application of a technique, namely the . This strategic delineation serves to underscore the systematic and structured approach undertaken in the exploration and analysis of geological data, thus highlighting the integral role of both dataset components and methodological processes in this scientific endeavor.
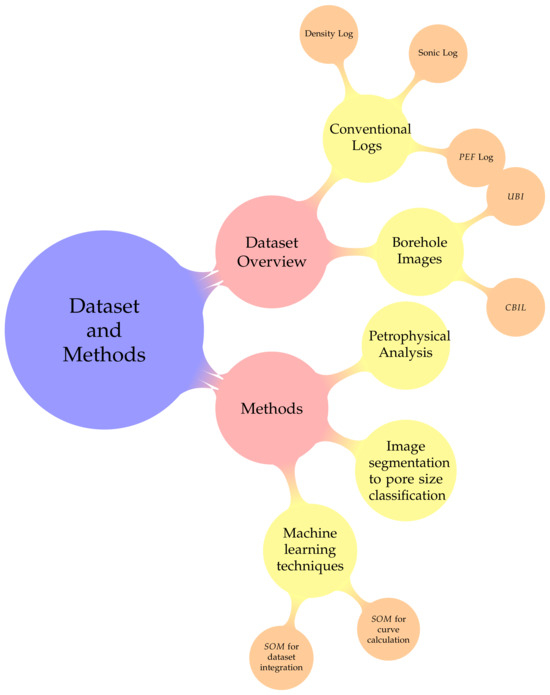
Figure 2.
Mind map showing the dataset and methodology.
3.1. Dataset Overview
This research centers on a rigorous analysis of conventional logs and borehole images, thus employing advanced methodologies such as image segmentation and . The meticulous examination aims to extract nuanced insights from the dataset. To protect sensitive information, the dataset originates from two anonymized wells, designated as A and B. This strategic anonymization ensures data integrity while adhering to ethical research standards. However, certain essential details are disclosable. Wells A and B are situated in the Santos Basin, southeastern Brazil, with drilled depths of 5884.926 m and 5784.172 m, respectively. Specific field names, locations, and geographical references are withheld due to confidentiality concerns. The adoption of cutting-edge techniques like image segmentation and underscores the commitment to a comprehensive and advanced dataset analysis, thus aiming for a profound understanding of the geological characteristics specific to the studied wells. For this study, only wells A and B were available, thus fulfilling the requirement for a complete dataset that includes conventional logs and specialized borehole images.
3.1.1. Conventional Logs
Within the dataset, a diverse array of well logs emerges, with each contributing distinctive perspectives on the intricate features of subsurface formations. These encompass density, sonic, and photoelectric factor (), as illustrated in Figure 3.
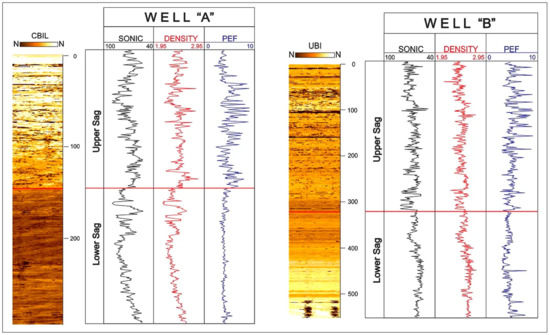
Figure 3.
Composition of the study dataset: Utilized data originates from two wells encompassing conventional well logs (sonic, density, and photoelectric factor) alongside (Dynamic and , presented at 1:1000 scale for well A and 1:1500 scale for well B).
Density Log
The density log assumes a pivotal role as a critical metric in determining the bulk density of geological formations [43]. Operating as a comprehensive measure, the bulk density encapsulates both the solid matrix and fluids residing within pores [44]. This log proves indispensable for comprehending the overall composition, with matrix density shedding light on the solid framework of rocks that are devoid of porosity. Employing gamma radiation, typically emanating from sources like caesium-137 or cobalt-60, the density log meticulously gauges the return of gamma rays, thus offering essential insights into the rock’s intricate composition [44].
Sonic Log
The sonic log assesses the interval transit time of a compressional sound wave navigating the formation along the borehole axis. This temporal interval intricately links to the elastic properties of the matrix, thereby providing significant revelations about porosity [24,45]. Outfitted with ultrasonic transmitters and receivers, the sonic log furnishes indispensable data for discerning the lithological properties governing subsurface formations.
Photoelectric Factor Log
The log serves as a quantitative measurement of gamma ray absorption by electrons. This log is extensively employed for lithological identification, thus offering valuable insights into subsurface rock compositions. Nevertheless, the widespread application of the log is not without challenges, particularly in scenarios involving the incorporation of barite as a mud additive. Barite, characterized by its high photoelectric absorption index, introduces a complicating factor by inducing pronounced peaks in the log readings when it infiltrates pore spaces. This phenomenon, as elucidated by Serra et al. [46], underscores the necessity for a nuanced interpretation of logs in settings where barite is utilized, thus requiring a careful consideration of the potential impact of mud additives on the log’s response. The intricate interplay between the lithological characteristics and the presence of mud additives, such as barite, highlights the need for a comprehensive understanding of the log’s behavior to ensure accurate lithological recognition and interpretation in diverse geological contexts.
3.1.2. Borehole Images ()
were procured utilizing two distinct tools in this study. Specifically, the Circumferential Borehole Imaging Log (Dynamic from Baker) was employed for well A, while the Ultrasonic Borehole Imager (Dynamic from Schlumberger) was utilized for well B [47]. These tools, each renowned for its unique capabilities, contributed essential data to the investigation. The Circumferential Borehole Imaging Log, provided by Baker, operates dynamically to offer a comprehensive view of the well’s surroundings. In contrast, the , supplied by Schlumberger, utilizes dynamic imaging capabilities based on high-frequency acoustic pulses, thus ensuring a detailed representation of the borehole conditions. The strategic selection of these tools aimed to capture nuanced geological features and provide a holistic understanding of subsurface formations in the respective wells, thus enhancing the overall depth and reliability of the dataset for subsequent analyses.
Ultrasonic Borehole Imager ()
The functions at elevated frequencies, thus providing heightened image resolution through precise measurements of amplitude and transit time. Its sensitivity to subtle variations on the borehole wall permits the to capture intricate details, wherein rugosity plays a pivotal role in influencing reflection amplitude. Notwithstanding, the effectiveness of in detecting lithological variations is intricately linked to surface effects rather than discerning changes in subsurface lithology [47,48]. While its adeptness in delineating surface features is notable, careful consideration must be given to the interpretative limitations imposed by its reliance on surface characteristics, thus necessitating a nuanced understanding of its application in lithological analyses.
Circumferential Borehole Imaging Log ()
The serves a specialized purpose: it is meticulously designed for ultrasonic scanning operations in both open and cased hole wells. This instrument operates by transmitting acoustic pulses at high frequencies, thus facilitating a detailed analysis of the subsurface. Through the precise measurement of arrival times and amplitudes of echoes, the adeptly distinguishes variations in rock properties and borehole geometry, thus capturing the unique characteristics of the returning wave. Of particular significance is ’s noteworthy application in fracture analysis, thus offering insights into the structural integrity of geological formations. Moreover, it contributes to estimating the in situ stress field by scrutinizing borehole breakouts and fractures induced during drilling activities [48,49].
This dataset, which seamlessly integrates conventional logs with advanced borehole images, serves as the fundamental groundwork for subsequent analytical endeavors employing sophisticated methodologies such as image segmentation and techniques. The synergistic application of these methodologies aims to yield a comprehensive and nuanced understanding of the intricate subsurface dynamics within Brazilian presalt carbonate reservoirs, thus contributing to advancements in reservoir characterization and resource management strategies.
3.2. Methodology
In the pursuit of advancing this research, an initial petrophysical analysis of density and sonic logs was undertaken to derive values for total and matrix porosity, respectively. A meticulous examination of values from the log was subsequently conducted to qualitatively assess the potential presence or absence of pore spaces, thus guided by a predetermined cutoff (5.8 ) established in existing literature [29]. Intervals surpassing this threshold were construed as having a heightened likelihood of harboring pore spaces. Similarly, and logs underwent image segmentation and applications, thus facilitating the creation of a novel quantitative log denoted as . This log encapsulates depth-specific values of visible porosity. The ensuing step involved utilizing density, sonic, , and logs as inputs, from which derived classes with akin data patterns. These classes were subsequently juxtaposed with the and matrix porosity, thus culminating in the identification of facies based on porosity. The nomenclature assigned to these facies was predicated on qualitative assessments of matrix and non-matrix porosity, coupled with considerations of the predominant pore sizes.
The comprehensive methodology employed in this study is succinctly encapsulated in Figure 4, with detailed elucidation provided subsequently. This strategic amalgamation of petrophysical analyses, log assessments, and clustering techniques, as depicted in the ensuing sections, serves as the bedrock for unveiling the intricate characteristics of carbonate reservoirs.
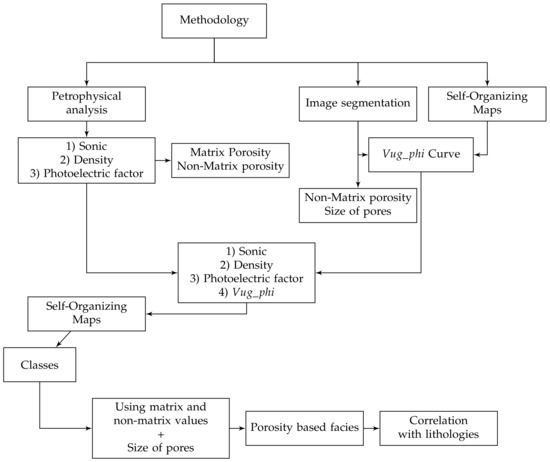
Figure 4.
Concise overview of methodology: Detailed depiction of petrophysical analysis, image segmentation, and self-organizing maps in the proposed approach.
3.2.1. Petrophysical Analysis
The examination of conventional well logs through petrophysical analysis serves as a crucial methodology for delineating fundamental physical attributes of rocks, thereby encompassing lithology, porosity, permeability, and water saturation [22,45,50]. Within the scope of this study, sonic and density logs served as pivotal tools for scrutinizing the isolated and synergistic behaviors of these well logs concerning porosity. The sonic log quantifies the time taken by a compressional sound wave to traverse the interval along the axis of the borehole [45]. The computation of porosity was facilitated through the application of the Wyllie time average equation (Equation (1)), which defines an empirical relationship correlating the velocity of the rock matrix with borehole fluids [51]. This equation, outlined as follows, forms the cornerstone for porosity derivation:
where denotes the fractional porosity of the rock, v signifies the velocity of the formation (ft/s), represents the velocity of interstitial fluids (ft/s), and stands for the velocity of the rock matrix (ft/s). The subsequent sections expound upon the intricate interplay of these variables, thus unraveling the intricacies of porosity computation in the pursuit of comprehending the underlying geological formations.
Utilizing Equation (1), we derived Equation (2) by considering the reciprocal of velocity () as the interval transit time ().
The computation of matrix porosity becomes feasible when the values of transit time are known, which are achieved through Equation (3), which was extracted from Equation (2) [45].
In the context of the presented equation, signifies matrix porosity, represents acoustic transit time, and denote acoustic transit time of interstitial fluids () and acoustic transit time of the rock matrix (), respectively.
It is noteworthy that when the travel time (t) is a known variable, the computation of porosity becomes feasible. Drawing upon Equation (2) and substituting the acoustic transit time ( by travel time (t), we systematically derived the matrix porosity as illustrated in the subsequent formulation.
where, represents matrix porosity, t denotes travel time (ft/s), signifies travel time of interstitial fluids (ft/s), and shows travel time of the rock matrix (ft/s).
The density log provides a comprehensive portrayal of density values across the entirety of the formation, thus encompassing both its solid and fluid components. Employing Equation (2) as a foundation and substituting the acoustic transit time () by the formation bulk density (), we derived Equation (5). This equation serves as a computational tool for determining the values of total porosity ().
where denotes the total porosity, and represents the matrix density. Also, and signify formation bulk density and fluid density, respectively.
3.2.2. Image Segmentation for Pore Size Classification
Pore size classification plays a pivotal role in understanding the dynamic properties of carbonate reservoirs, as distinct behaviors emerge with varying pore sizes [52,53]. Larger pores, for instance, exhibit correlations with fluid losses during drilling or signify intervals of heightened productivity [53]. The intricate three-dimensional nature and irregularities of pores, as highlighted by Choquette et al. [52], pose challenges in precisely characterizing their sizes visually. However, the application of image segmentation has proven instrumental in identifying and scrutinizing pore spaces. This analytical process involves linking the well image to an image of identical dimensions, thus establishing a correlation between each well region and a specific class. The execution of a meticulously devised workflow, depicted in Figure 5 and grounded in image processing techniques, facilitates the connection of each individual pore analysis to its corresponding class. The image processing techniques were developed in Python 3.11.5 and are described in greater detail in the Appendix A.
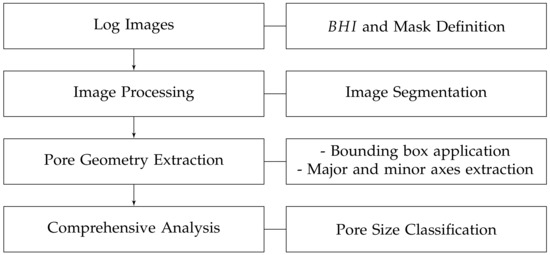
Figure 5.
Workflow to analyze the pore geometry based on image processing.
Leveraging the capabilities of the Python programming language, the methodology proposed by Bomfim et al. [54] was implemented for noise reduction and segmentation, thus employing the Multiscale Retinex with Color Preservation and Color Image Quantization method on the log. Following segmentation, the determination of pore size was conducted by adopting the porous radius representation outlined by Jia et al. [55]. The final size value was defined as the average of major and minor axes and calculated through the opencv library function, “boundingRect()”, which provides values for the major and minor axes of a convex contour (such as porous). Initially, in a 1-pixel scale, these values are subsequently converted to millimeters using the original well scale, with a conversion rate of 7 mm per pixel. The resultant data undergoes classification into gigapores, large-mesopores, and small-mesopores, thus adhering to the nomenclature proposed by Choquette et al. [52], De Jesus et al. [56], Mohammadizadeh et al. [57], and Malik et al. [58].
Choquette et al. [52] delineated three primary size classes for regularly shaped pores smaller than 256 mm. Specifically, pores smaller than 0.0625 mm are termed micropores, and those ranging from to 4 mm are identified as mesopores. Due to inherent image resolution limitations, the detection of micropores and mesopores proved unfeasible in this research. Pores spanning 4 to 256 mm are designated megapores, which are further categorized into small megapores (4 mm to 32 mm) and large megapores (32 mm to 256 mm). While Choquette et al. [52] introduced the term cavern for pores larger than 256 mm, a nomenclature inconsistency led to the adoption of gigapores for sizes surpassing 256 mm, thus aligning with the classification proposed by De Jesus et al. [56].
3.2.3. Advancements in Machine Learning Techniques for Geological Analysis
Numerous studies underscore the transformative impact of techniques across diverse domains, with particular relevance to geosciences, as exemplified in works by Zhao et al. [59,60]. Notably, recent developments have emphasized novel methodologies tailored for big data analysis and leveraging deep learning algorithms, as evidenced by the works of Guo et al. [61]. However, the available well dataset provides limited instances detailing the application of these state-of-the-art techniques. Traditional approaches to well log analysis typically hinge on supervised methods for classification, including Multilayer Perceptron and ensemble techniques, thus necessitating prior rock classification to train the algorithm. Yet, during the exploration phase, where insights into the field are minimal and core data are unavailable, employing such techniques becomes impractical.
In response to this challenge, this study advocates a pioneering methodology that amalgamates all available data, thus seeking to autonomously identify patterns within the dataset and facilitate field interpretation during the exploration phase. To this end, the study presents best practices for applying an unsupervised method, thus opting for , which is a classical clustering technique. Devised by Kohonen et al. [62] in the 1980s, represents a neural network technique proficient in projecting high-dimensional data into a 2D space and forming a map, as illustrated in Figure 6. This map comprises nodes—or neurons—arranged in a network or linked mesh. The iterative process of competitive learning adjusts the positions of nodes based on computed distances between samples and nodes. During learning, the algorithm computes the distance of samples to all nodes, thus adjusting not only the winning node but also its neighbors to be closer to the sample. This meticulous process ensures the preservation of crucial topological relationships within the displayed data, thereby allowing for the visual analysis of various data types through the map. The resulting map of distances, termed the U matrix, and the component maps, which depict the distribution of each attribute used for training, provide insights into the topological organization of the data. algorithms were implemented on the computing platform, with further details provided in the Appendix A.
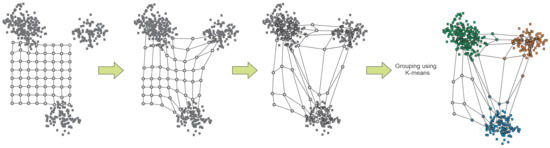
Figure 6.
Visualization of the training process using , where the arrangement is dictated by the similarity of dataset values. Subsequently, the grouped dataset undergoes further categorization through k-means clustering, thus providing insight into the clustering dynamics and the formation of distinct patterns.
Given the high number of nodes in the map, an application of k-means was employed to regroup them, thus utilizing the Davies–Bouldin index to define the optimal number of clusters. Through the judicious use of component maps and the U matrix, the user gains the flexibility to define clusters, thereby grouping nodes in the map as per their preferences. This comprehensive approach underscores the efficacy of in offering an intelligent and visual means to analyze complex datasets, particularly in scenarios where traditional supervised methods face practical limitations during the exploration phase.
At the core of s lie a sophisticated array of artificial neurons, which are meticulously organized within a two-dimensional grid. Each neuron within this grid is associated with a weight vector, the adaptation of which forms the central thrust of the network’s learning process. The following delineates a more comprehensive exposition of the workings of s:
- Initialization: The weight vectors corresponding to each neuron are initially configured either randomly or through alternative initialization methods. These weight vectors effectively represent points within the input space.
- Competition and Cooperation: Throughout the training process, an input vector is introduced to the . Each neuron computes its resemblance to the input vector by employing a similarity metric, most commonly the Euclidean distance. The neuron with the weight vector that most closely resembles the input is deemed the winning neuron.
- Weight Adjustment: The winning neuron and its immediate neighbors within the lattice have their weight vectors adjusted to become more akin to the input vector. The extent of this adjustment is contingent upon the neighborhood function, which gradually contracts over time, thus allowing the to converge.
- Topology Preservation: A striking attribute of s is their ability to conserve the topological relationships inherent in the input data. Comparable input vectors are mapped to proximate neurons within the grid, thereby facilitating data visualization and clustering.
- Training Iteration: The steps delineated in points 2 through 4 are iteratively repeated for a predefined number of training cycles, thus progressively enhancing the mapping of input data within the .
- Final Representation: After training, the furnishes a condensed, structured representation of the input data, thus effectively functioning as an organized, lower-dimensional rendition of the original dataset.
- ∘
- Similarity Metric (Euclidean Distance): The similarity (or dissimilarity) between an input vector, denoted as I, and a neuron equipped with a weight vector, denoted as W, is calculated as follows:where and represent the components of the input vector and the weight vector, respectively.
- ∘
- Weight Adjustment: The modification of the weight vector for the winning neuron and its neighboring neurons is executed in the following manner:where signifies the change in weight, corresponds to the learning rate, designates the neighborhood function, and signifies the disparity between the input vector and the weight vector.
- ∘
- Neighborhood Function: The neighborhood function, denoted as , dictates the influence exerted by the winning neuron on its neighboring neurons, with its magnitude diminishing as a function of both time and distance from the winner:where, c denotes the distance from the winning neuron, while represents the neighborhood radius.
In this study, was applied to perform automatic segmentation of the , thus creating a new log based on porosity while recognizing patterns within conventional logs and those derived from in an automatic and hierarchical manner. The utilization of provides a valuable approach for comprehensive data analysis, particularly when traditional supervised methods prove impractical in the absence of detailed rock classifications during the exploration phase.
Utilizing for Curve Computation
Preceding any analytical procedures, it is imperative to underscore the significance of adhering to robust practices in image analysis, particularly in the identification and segregation of nongeological features. As asserted by Lofts et al. [63], the initial phase of any interpretation should involve the meticulous recognition of nongeological features or image artifacts. Employing filters stands out as a prevalent practice to extricate image artifacts while preserving lithological features (e.g., [64]). Consequently, as a foundational step, the methodology advanced by Bomfim et al. [54] was applied to cleanse the images, thus ensuring their quality and mitigating potential issues linked to noise during training.
The fundamental premise underpinning the automatic recognition of porous spaces in this study hinges on their direct association with low amplitude values in the borehole image, which are manifested as dark brown coloration. Subsequently, the well images underwent individual classification via and k-means preprocessing. was implemented with parameters elucidated in Table 1, thus utilizing the three channels of the Red, Green, and Blue () image of the reservoir interval as input data, which was classified separately for each well.

Table 1.
Input parameters for training.
The determination of a high number of clusters was automated through the Davies–Bouldin index. In a subsequent interactive phase, the interpreter scrutinized the clusters discerned by and k-means, thus ultimately defining the optimal cutoff for porous spaces and effecting the binarization of the image into porous spaces and background. The porous spaces thus identified were correlated with depth, thereby providing the foundational data for the computation of the percentage of pores within the image diameter, which is referred to in this study as . This intricate methodology ensures a meticulous and automated delineation of porous spaces, thus contributing to the nuanced understanding of reservoir characteristics in the exploration phase.
Integration of Datasets Using (Conventional and Logs)
The prevailing consensus within the literature underscores a crucial limitation: individual conventional well logs, in isolation, often fall short in effectively discerning pore spaces arising from fractures or dissolution, as substantiated by Aguilera et al. [65], Aghli et al. [24], Wu et al. [66], and Lai et al. [67]. Consequently, the pivotal question arises in an investigative context: What distinctive behavioral patterns should one anticipate from well logs within a porous environment, and how can the integration of datasets enhance the identification of non-matrix-related pores?
Addressing these inquiries, a tandem application of and k-means was employed once more to amalgamate the image log with the conventional well logs. The deliberate overestimation of the number of clusters, assessed by Davies–Bouldin, serves a strategic purpose—capturing a maximal spectrum of information pertaining to the variability of well logs contingent upon porosity content. This methodological fusion engenders a comprehensive synthesis of data, thus facilitating a nuanced exploration of the intricate interplay between image-derived porosity information and conventional well log data. The judicious integration of these disparate datasets promises to enhance the discernment of non-matrix-related pores, thereby advancing the precision of reservoir characterization in porous environments.
4. Results and Discussion
This section presents the discrete outcomes attained through the advocated methodology. The initial findings pertain to the utilization of image segmentation and techniques, thus culminating in the derivation of a novel log termed . Subsequently, employing petrophysical analysis, we delve into comprehending the intricacies of the logs employed as input data, thus facilitating an automated classification process. Ultimately, the resultant clusters from the automated classification underwent further categorization, thus resulting in the establishment of four distinct facies groups. These groups, meticulously described and interpreted, offer comprehensive insights into their lithological associations. The ensuing discussion unpacks the implications and significance of these findings, thus shedding light on the broader geological context and enhancing our understanding of the subsurface intricacies within the studied reservoirs
4.1. “ Curve” Calculation
In the meticulous undertaking of delineating the “ curve”, a comprehensive and intricate methodology utilizing was deployed. This involved the establishment of a neuron map for well A and a more delimited neuron map for well B The ultimate quantification of the errors, pertaining to both quantization and topography, was assiduously documented. Specifically, the quantization errors for well A were precisely recorded at , while the corresponding topographic errors were meticulously noted at . Similarly, for well B, the quantization errors were detailed at , and the topographic errors were discerningly documented at . The graphical representation of these findings is eloquently portrayed in Figure 7. The intricacies of this computational analysis reveal the meticulous attention given to the nuanced characteristics of each well, thus providing a comprehensive insight into the intricacies of the “ curve” calculation.
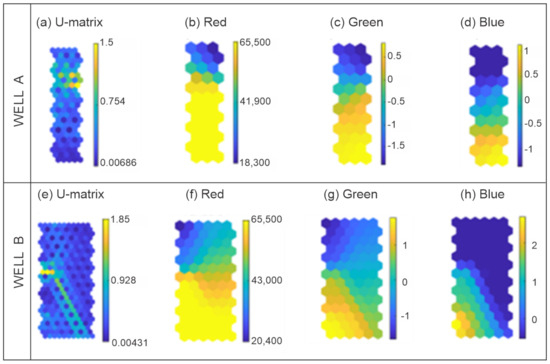
Figure 7.
Presentation of 2D -generated maps illustrating the U matrix distribution of channels for A and B wells. Subfigures (a,e) depict the U matrix with the overall distribution of channels for A and B wells, respectively. Further breakdowns are provided in subfigures (b,f) for the red channel values, (c,g) for the blue channel values, and (d,h) for the green channel values for A and B wells, respectively.
It is of paramount importance to emphasize the necessity for meticulous implementation within the realm of automated unsupervised image segmentation. The inherent patterns embedded in images often deviate from the precise goals of the interpreter. Consequently, it becomes essential to meticulously design and execute a systematic array of tests. These tests should be subjected to judicious evaluation, thus aligning with predefined benchmarks and objectives, as elucidated in the current investigation by Rangel, et al. [29]. The intricacies of image segmentation demand a thorough and circumspect approach to ensure the attainment of accurate and meaningful outcomes in alignment with the study’s elucidation.
The formidable undertaking at present revolves around the discrimination of porous spaces from the ambient background. Although an instinctive approach to segmentation might incline towards a binary classification of mapped nodes, the consequences ensuing from the classification utilizing the unveiled a pitfall in the segmentation of Kohonen maps through k-means into two classes. This led to an overestimation of pore spaces, as illustrated in Figure 8. The nuanced intricacies of this process highlight the need for a more refined and nuanced segmentation strategy, thus considering the limitations inherent in the simplistic binary classification employed initially.
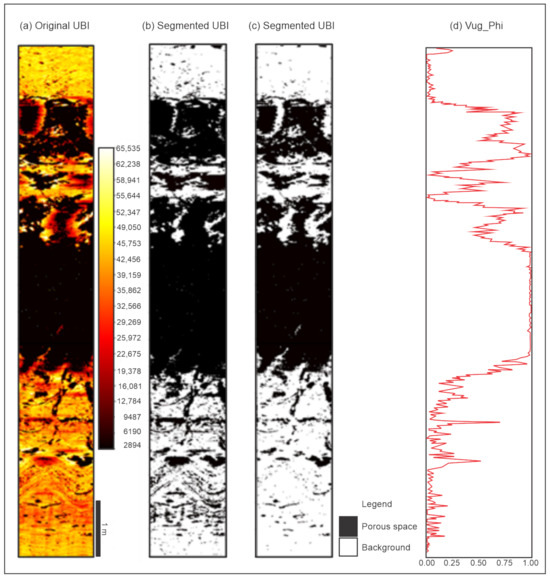
Figure 8.
curve calculation. (a) Representation of a 10-meter interval from the original of well B, thus revealing a significant porous space. (b) Initial split of the Kohonen map by k-means into two classes, thus displaying an overestimated porous segmentation. (c) Improved results with segmentation into six classes, thus offering greater flexibility and reliability. For this segmentation, one class is specifically associated with porous space, while the remaining classes represent the background. (d) The resultant curve obtained through image segmentation.
A discernible factor contributing to the overestimation of pore space in is rooted in the algorithm’s inability to achieve the optimal Davies–Bouldin index value. Additionally, in this particular scenario, the category pertaining to porous space within well B constitutes a mere 9% of the entire reservoir interval. This occurrence results in an inherent imbalance, which is a subtlety that becomes obscured when simplifying the image into two classes. The misalignment between the algorithmic assessment and the actual distribution of porous space in well B accentuates the significance of refining the algorithmic parameters to ensure a more accurate portrayal of subsurface characteristics. The nuanced nature of reservoir characterization demands a meticulous approach to algorithmic calibration, thereby acknowledging the intricate heterogeneity within the geological formations under scrutiny. As such, a comprehensive understanding of these complexities is imperative for advancing the precision and reliability of borehole image analysis in reservoir characterization studies.
The endorsed approach encompasses the broadening of clusters examined through the lens of the Davies–Bouldin index, with particular attention directed towards scrutinizing the cluster characterized by the most minimal amplitude values within the Kohonen map. This intricate procedure, as delineated in Figure 9, underscores a nuanced and systematic examination reliant on the proportionality of input range values. By meticulously navigating this process, it is affirmed that the optimal number of classes has been ascertained, thereby facilitating a more refined and precise mapping of the dataset. The visual representation in Figure 9 effectively illustrates the intricacies of this methodology, thus highlighting its reliance on scrutinizing amplitude values and underscoring its efficacy in enhancing the overall mapping accuracy of the dataset. This methodological refinement ensures a discerning exploration of the dataset’s inherent structure, thus contributing to a heightened understanding and representation of the underlying patterns and relationships within the data.
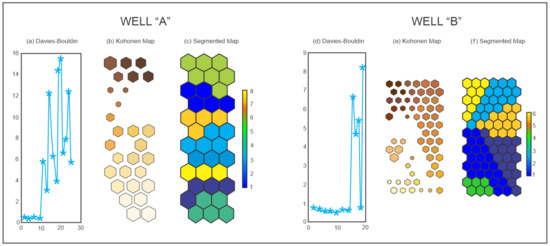
Figure 9.
Visual representation of (a,d) Davies–Bouldin index, (b,e) Kohonen map, and (c,f) segmented maps for well A and B, respectively. Well A exhibits division into six clusters, while well B displays separation into eight clusters. Notably, Cluster 6 in both wells corresponds to the lowest values of amplitude.
Following segmentation, the enumeration of pixels categorized as pore space becomes instrumental in deriving the percentage of this particular class at varying depths. This computational endeavor results in the generation of a non-matrix porosity percentage curve denoted as . In the context of this research, well A underwent segmentation, thus resulting in its division into eight distinct clusters. Well B was subjected to a similar process, thus leading to its partitioning into six clusters. It is noteworthy that within this classification, the cluster characterized by lower amplitude values assumes the role of representing the pore space. This meticulous approach to segmentation and subsequent cluster assignment aims to discern and quantify the distribution of pore spaces at different depths in the wells under investigation, thereby contributing valuable insights into the subsurface characteristics and porosity variations. The choice of clusters, particularly designating the one with lower amplitude values, reflects a deliberate strategy to capture and emphasize the relevant geological features related to pore space within the wells under scrutiny.
4.1.1. Responses of the Data Inputs against Porous Environment
This section delves into the nuanced responses of data inputs within porous environments, particularly focusing on carbonate reservoirs renowned for their intricate porosity systems. These systems are categorized into porosity stemming from the matrix (interparticle porosity) and non-matrix-related porosity encompassing features like caves, fractures, and vugs [68]. The sonic log emerges as a key informant by furnishing insights into interval transit time and establishing a direct linkage with interparticle porosity. By applying the Wyllie time average equation [51], the values of matrix porosity can be derived, offering a comprehensive understanding of the depositional and early diagenetic processes of the reservoir.
Complementary to the sonic log, the density log contributes vital information by supplying values of bulk density. This density is a composite influenced by matrix density and the fluid density within the pores, as outlined by Asquith et al. [45]. Employing a well-established equation, the density log aids in calculating the total porosity specific to a given interval, thus contributing to a comprehensive assessment of the reservoir’s porosity characteristics. Differences between density and sonic log values illuminate non-matrix porosity, which is typically filled with mud filtrate. This filtrate, distinguished by lower density and prolonged travel time compared to the host rock, becomes a crucial indicator. Intervals exhibiting low density values and prolonged travel time, contrasted with the established background values for carbonates, are interpreted as zones with a heightened percentage of pore spaces [24,25,68,69].
Conversely, intervals demonstrating elevated density values and reduced travel time are construed as areas with underdeveloped or nonvisible pores. This nuanced interpretation underscores the intricate interplay between the data inputs and the porous environment, thus providing valuable insights into the nature and extent of porosity within carbonate reservoirs. Such meticulous analysis, supported by advanced equations and log readings, forms the foundation for a comprehensive understanding of reservoir characteristics and facilitates informed decision making in the realm of geological exploration and resource extraction.
Despite the quantitative insights offered by density and sonic logs concerning porosity, it is imperative to meticulously record and distinguish the configurations of non-matrix-related pores to enhance classification accuracy. To address this need, the utilization of image segmentation on emerged as a pivotal tool, which significantly contributing to the characterization and delineation of shapes and sizes associated with non-matrix-related pores. This aspect introduced an additional criterion for our ultimate facies classification, thereby refining our understanding of the reservoir’s geological attributes. Nonetheless, it is crucial to acknowledge the inherent limitations of , including challenges related to image resolution and potential confusion stemming from image artifacts that may be mistakenly identified as non-matrix features, as noted by De Jesus et al. [56].
In an effort to overcome the constraints associated with image artifacts, we employed the methodology proposed by Bomfim et al. [54] to meticulously eliminate noise from the images, thus preserving solely the pertinent geological features. This methodological refinement facilitated a clearer distinction between genuine geological attributes and potential artifacts, thereby enhancing the reliability of our data. Subsequent to this refinement process, our analysis revealed the identification of three distinct categories of pore sizes—(i) small megapores, (ii) large megapores, and (iii) gigapores—as per the taxonomy introduced by Choquette et al. [52] and De Jesus et al. [56], wherein a visual representation of which is provided in Figure 10. This detailed categorization of pore sizes constitutes a critical step forward in our understanding of the reservoir’s intricacies, thus laying the groundwork for more nuanced interpretations and informed decision making in the domain of geological exploration and resource management.
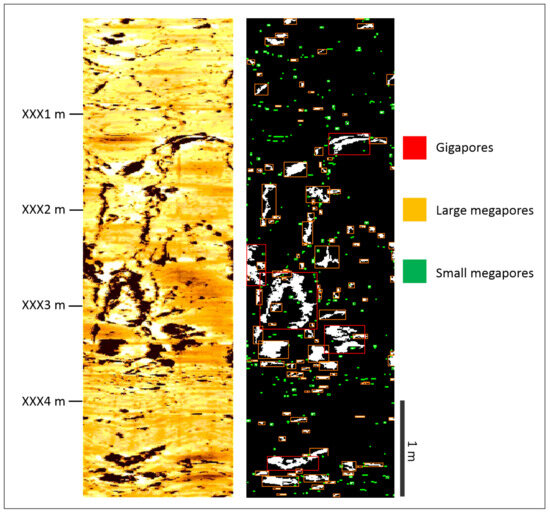
Figure 10.
Pore size classification using image processing adopting nomenclature proposed by Choquette et al. [52] and De Jesus et al. [53]. In this representation, pore areas are depicted in white, while the background is rendered in black for image processing clarity.
An additional well log subjected to analysis in this study is the photoelectric factor (). Widely recognized as a conventional log, the log serves as a direct tool for lithology determination, as evidenced by the works of Lai et al. [67], Wu et al. [66], Li et al. [70], and Hasan et al. [71]. Beyond its conventional application, the log also plays a crucial role in the initial identification of non-matrix-related pores, as highlighted by Li et al. [70], Hasan et al. [71], and Fernandez et al. [68]. In the context of our research, the primary utility of the log lies in qualitatively distinguishing intervals with non-matrix pores from those without. The response of the log to non-matrix-related pores is characterized by elevated values (above 5.8 b/e), which are attributable to the filling of these pores with barite-containing mud filtrate. The high photoelectric factor of barite, as elucidated by Serra et al. [46], contributes to these heightened values. Conversely, when intervals lack pores in direct contact with the well wall, log values closely align with the background for carbonate rocks, specifically around 5.084 b/e. A comprehensive summary delineating the applicability of each conventional well log for identifying distinct porosity is presented in Table 2.
Table 2.
Overview of employed well logs and corresponding porosity types.
4.1.2. Integration of Conventional and Logs
Upon completion of the comprehensive petrophysical analysis and the computation of the curve, the subsequent phase involves the integration of this dataset to unveil latent patterns in an unsupervised manner. This integration is accomplished through the deployment of the , which utilizes the following logs as inputs: , , , and . The representation of these logs is visually rendered on bidimensional maps, as delineated in Figure 11.
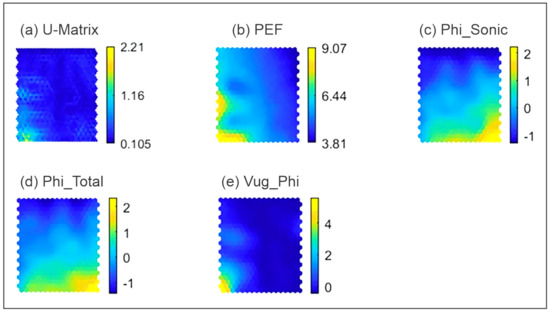
Figure 11.
Presentation of 2D maps of the input dataset. (a) Final U matrix map illustrating the neural network’s training outcome using input values from (b–e) as a guide to differentiate groups with similar information. (b) A 2D map depicting the distribution of values for . (c) A 2D map depicting the distribution of values for porosity derived from the sonic log. (d) A 2D map illustrating the distribution of values for total porosity. (e) A 2D map showing the distribution of values for the log.
The 2D portrayal of the log (Figure 11b) elucidates distinct groups, showcasing their values’ spatial distribution. Elevated values are concentrated in the left and bottom left corner, whereas lower values are situated in the top right corner. Intermediate values predominate based on the map’s distribution.
Upon plotting the log on the 2D map (Figure 11c), the porosity derived from sonic measurements was observed to segregate into different groups, which was delineated by varying colors on the map. Notably, high values are concentrated in the bottom right, while lower values are found at the top. The central area of the map is characterized by intermediate values.
Likewise, the 2D representation of (Figure 11d) manifests a distribution and behavior akin to , where higher values cluster in the bottom left, and lower values occupy the top. Intermediate values of predominate and are centralized on the map.
The 2D map of the log (Figure 11e) portrays values grouped such that higher values are concentrated in the bottom left, while lower values are positioned in the top and slightly right bottom corner. The prevalence of lower values is observable across the map.
The distinctive colors characterizing each 2D map signify groups with analogous distances between nodes or neurons, thus representing the values of each well log. The spatial location of each color group is intrinsically linked to the input space of the respective log.
The outcomes of the network training with the four inputs (, , , and ) are visually presented in a 2D map (Figure 11a). A noticeable variation in the color scale (ranging from blue to yellow) facilitates the visual separation into groups with comparable characteristics. Post-training, the has the potential to group high values of , , , and . To achieve precise grouping, a segmentation of the 2D map is imperative, thus involving the application of the Davies–Bouldin index and k-means. This segmentation is a crucial step in ensuring an accurate and meaningful classification of the dataset.
For the segmentation process, both wells underwent a joint classification. The was configured on a map, thus yielding quantization and topographic errors of and , respectively. Subsequently, this 2D map underwent further subdivision into 32 distinct patterns, which were guided by the performance of the Davies–Bouldin index in conjunction with the k-means split method, as visually represented in Figure 12.
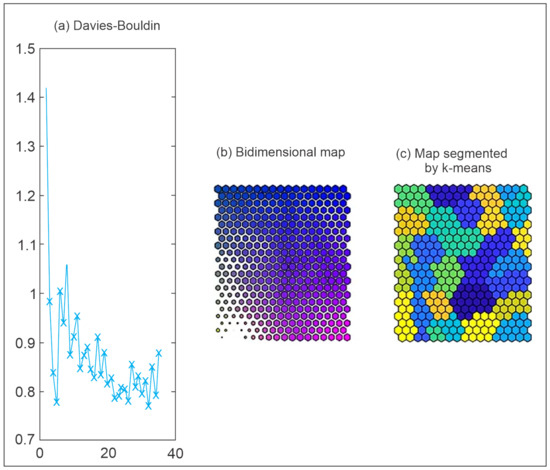
Figure 12.
(a) Visualization of the Davies–Bouldin index, (b) 2D map incorporating the entire dataset input, and (c) Segmented map into 32 groups, guided by the Davies–Bouldin index.
The Davies–Boldin index functions as a critical metric for evaluating the clustering efficacy of 2D maps that encapsulate information from all well logs. Diminished values of the Davies–Boldin index signify a more proficient clustering outcome. Application of the Davies–Boldin index to the 2D map (Figure 12b) culminated in the final classification of data into thirty-two discernible groups (Figure 12c). This enumeration of groups (thirty-two) was deemed the optimal clustering solution, thus substantiated by the performance of the Davies–Boldin index on our trained 2D map.
4.2. Porosity-Based Facies
Within the framework of facies delineation based on porosity, an exhaustive examination of the 32 discerned classes led to the delineation of four discrete facies designated as A, B, C, and D. This systematic categorization was executed through a meticulous scrutiny of the intricate interdependencies existing among matrix and non-matrix porosities, values, and the parameter, as visually depicted in Figure 13. The intricate nature of these interrelationships was pivotal in establishing the distinct identities of the aforementioned facies. This analytical endeavor sought to uncover nuanced patterns and correlations embedded within the porosity characteristics, thereby contributing to a refined classification system. The resulting facies classification not only serves as a foundational framework for further geological interpretations but also signifies a significant advancement in our understanding of the subsurface reservoir heterogeneity. This approach underscores the importance of integrative analyses in deciphering intricate geological features and enhances the potential for accurate reservoir characterization.
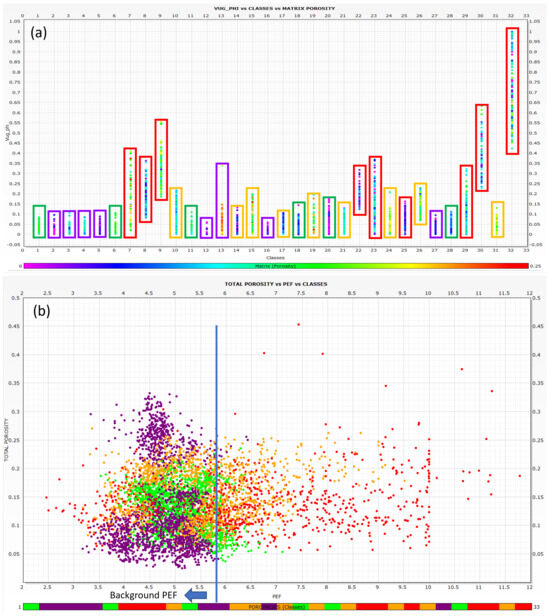
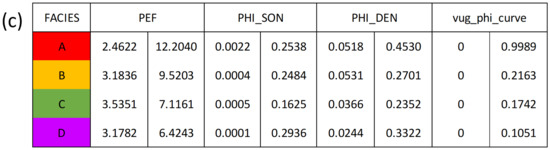
Figure 13.
Porosity-based facies classification: (a) Crossplot depicting the relationship between , 32 classes, and matrix porosity values. (b) Crossplot illustrating the correlation between total porosity, , and 32 classes. (c) Visualization of the 32 classes with minimum and maximum values derived from all input data.
4.2.1. Facies A
Within the geological context being examined, facies A emerged with distinct characteristics concerning the porosity parameters gleaned from diverse well logs. Specifically, the total porosity values assigned to facies A, extrapolated from density logs, span a noteworthy spectrum ranging from 0.0518 m3/m3 to 0.4530 m3/m3. Simultaneously, matrix porosity values, derived from sonic logs, manifest within the range of 0.0022 m3/m3 to 0.2538 m3/m3. The values associated with this facies exhibited considerable variability, spanning from to 12.20 b/e, with a pronounced concentration surpassing the threshold of 5.832 b/e. The curve, depicting variations in vuggy porosity, showcased the highest values fluctuating between 0 and , with a predominant concentration observed within the interval of to . A meticulous examination of visible pore spaces through advanced image segmentation techniques reveals that facies A predominantly encompasses pores exceeding 4 mm but falling below 32 mm. Utilizing the classification proposed by Choquette et al. [52], pores within the 4 to 32 mm range were designated as small megapores. Intriguingly, despite this classification, facies A also exhibits pores surpassing the 32 mm threshold. The automated enumeration of total pores within this facies underscores the prevalence of small megapores at 71.90%, large megapores at 26.76%, and gigapores at 1.34%, culminating in a total pore count of 20,250, as delineated in Table 3. The amalgamation of insights from well logs and pore size analysis converges to depict facies A as a facies characterized by high non-matrix porosity, which are graphically elucidated in Figure 14. This nuanced exploration of facies A not only contributes to the refinement of subsurface geological interpretations but also underscores the intricate heterogeneity inherent in reservoir formations, thereby enriching our understanding of the geological complexities at play.
Table 3.
Facies-based porosity and number of pores automatically detected.
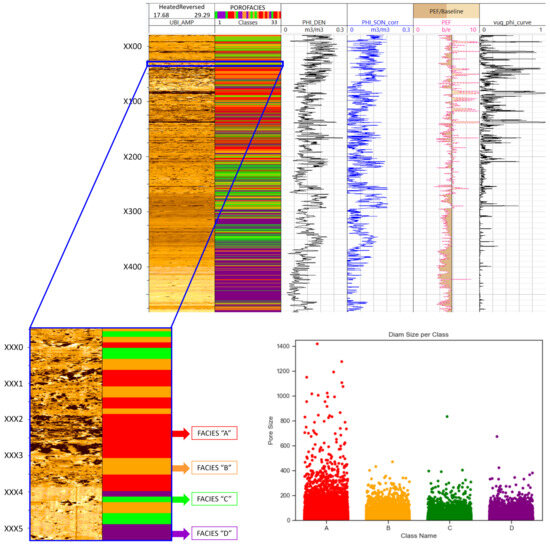
Figure 14.
Conventional and of a representative well, thus showcasing porosity facies classification. Facies A is distinguished by the presence of gigapores (>256 mm), while facies B, C, and D are predominantly characterized by smaller megapores. Limitations in image resolution precluded the differentiation of pores with diameters less than 7 mm, thus resulting in the exclusion of mesopores and micropores from the analysis.
4.2.2. Facies B
Facies B is distinguished by a spectrum of total porosity values ranging from 0.0531 m3/m3 to 0.2701 m3/m3, with matrix porosity values slightly exceeding those of facies A and falling within the range of 0.004 m3/m3 to 0.2484 m3/m3. The values within this facies exhibit a dispersed distribution, thus fluctuating between 3.1836 b/e and 9.5203 b/e. The curve also reveals varied values, thus spanning from a minimum of 0 to a maximum of . Notably, the predominant visible pores in this classification are characterized as small megapores, with sizes ranging from 4 mm to 32 mm, thereby constituting 76.46% of the total enumerated pores. Large megapores account for 23.29%, while gigapores represent a minimal 0.29%. The cumulative pores in this category amount to 11,344, as detailed in Table 3. Through a comprehensive integration of data, facies B emerges as a classification demonstrating moderate non-matrix and medium matrix porosity, as illustrated in Figure 14. This meticulous analysis contributes significant insights into the nuanced characteristics of facies B, thus shedding light on its porosity parameters and enhancing our understanding of the heterogeneity inherent in subsurface geological formations.
4.2.3. Facies C
In the analysis of facies C, a comprehensive examination revealed a broad spectrum of total porosity values ranging from 0.0366 m3/m3 to 0.2352 m3/m3. Notably, the matrix porosity values exhibit variability within the range of 0.0005 m3/m3 to 0.1625 m3/m3, with average values surpassing those observed in the matrix porosity of both facies A and B. The values, albeit scattered, display a discernible range from 3.5351 b/e to 7.1161 b/e, with a noteworthy concentration of values closely aligning with the background levels. Moreover, facies C manifests low values of , thus presenting a minimum of 0 and a maximum of . The predominant pore sizes in this facies span from 4 mm to 32 mm, thus constituting small megapores, which contribute to a substantial 78.27% of the total pores enumerated. Large megapores represent 21.53%, whereas gigapores constitute a minimal 0.20%. The total number of pores identified in facies C amounts to 9901, as detailed in Table 3. Importantly, given the constraints imposed by image resolution quality, there is a heightened probability of the presence of mesopores, as inferred from the moderate values of matrix porosity. Delving into the nuances of visible pore sizes and acknowledging the pronounced significance of matrix porosity, it is plausible to characterize facies C as a facies marked by low non-matrix porosity and medium matrix porosity, which are characterizations substantiated by the graphical representation in Figure 14. This detailed exploration enhances our understanding of the intricate geological characteristics inherent in facies C.
4.2.4. Facies D
Facies D, as evidenced by comprehensive analysis, manifested the most diminished levels of both total and matrix porosity within the studied geological context. The range of total porosity values spans from 0.0244 m3/m3 to 0.3322 m3/m3, while matrix porosity values exhibit a spectrum from 0.0001 m3/m3 to 0.2936 m3/m3. Notably, when juxtaposed with the preceding three facies, facies D emerges with the lowest values, fluctuating between 3.1782 b/e and 6.4243 b/e. Concurrently, the values for this specific facies exhibit a noteworthy minimum, thus oscillating between 0 and . In parallel with the previously elucidated facies, facies D showcases a dominance of small megapores, thus constituting an overwhelming 79.82%, followed by large megapores at 20.02%, and gigapores at a marginal 0.16%. The automated enumeration of total pores for this facies tallies to 11,720 (refer to Table 3), thus underscoring the intricate pore structure inherent in this geological setting. Analogous to the characteristics observed in facies C, the identification of mesopores and micropores remains elusive. However, a nuanced consideration of the conspicuously low values associated with matrix porosity prompts speculation regarding the probable occurrence of micropores. Consequently, facies D is categorically described as a geological stratum characterized by low non-matrix and low matrix porosity, which is a characterization visually represented in Figure 14. This multifaceted analysis delves into the intricate nuances of facies D, thus shedding light on its distinct porosity attributes and hinting at the potential existence of microscale porosity features, as well as enriching our understanding of the geological composition under investigation.
4.3. Porosity-Based Facies as Lithology Proxies
The intricate lithological composition characterizing the has spurred numerous researchers [19,29,68,72,73,74] to engage in comprehensive sedimentological and petrophysical investigations. Gomes et al. [37] innovatively employed thin sections, core descriptions, and chemical data to propose a novel facies classification system grounded in the relative abundance of mud, calcite spherulites, and calcite shrubs. Tamoto et al. [72] utilized plug samples and techniques to categorize groups with analogous petrophysical behaviors, thus facilitating a qualitative differentiation of the Barra Velha reservoir into categories of tight, good, and excellent. Basso et al. [19] employed a holistic approach integrating borehole image logs, nuclear magnetic resonance, and core samples, and they conducted a meticulous acoustic facies classification, thereby subsequently establishing correlations between these facies and specific lithologies. It is noteworthy that the aforementioned studies share a common reliance on specific databases, thus primarily comprised of cores or plugs and enabling a robust analysis of the lithological aspects within the reservoir. However, the prevalent absence of cores and plug samples in most reservoirs poses a common challenge, thus impeding accurate lithological interpretations. In response to this challenge, recent noteworthy endeavors by Muniz et al. [75], Basso et al. [19], and Soares et al. [20] have involved the interpretation of to identify acoustic facies. Subsequently, these acoustic facies have been associated with the prevailing lithologies, thus incorporating crucial petrophysical parameters such as porosity and permeability into their analyses. This innovative approach, relying on well log data, addresses the common limitation of core scarcity and significantly contributes to advancing our understanding of the complex lithological dynamics within the .
Basso et al. [19] presented a comprehensive analysis of five interpreted lithofacies within the geological context of the , thus amalgamating both depositional and postdepositional characteristics. These lithofacies include (1) shrub-dominated lithologies; (2) partially cemented shrub-dominated lithologies; (3) intraclastic/spherulitic grainstones–rudstones; (4) highly cemented lithologies; and (5) dolomudstones and marls. According to the findings of Basso et al. [19], shrub-dominated lithologies exhibit high visual porosity, whereas detrital carbonates, represented by grainstones and rudstones, showcase medium to high visual porosity. Partially silicified and/or dolomitized lithologies, specifically the partially silicified shrubby framestones, demonstrate medium visual porosity. In contrast, highly cemented lithologies, such as spherulite packstones, dolomudstones, and marls, exhibit low visual porosity. In a similar vein, Soares et al. [20] undertook a correlation between acoustic facies and the principal lithologies described in the , as per the framework proposed by Gomes et al. [37]. The visual porosity characteristics of these lithologies can be delineated as follows: (1) shrubstone-like lithologies demonstrate high porosity, thus aligning with pore morphologies resembling the growth patterns of shrubs; (2) rudstones-like lithologies display high porosity attributed to subangular cobbles, whereas low porosity is linked to angular pebbles; (3) grainstones-like lithologies exhibit medium porosity, with pore spaces situated between intraclasts of silica lamina, shrub fragments, or extraformational clasts; and (4) mudstone-like lithologies manifest low porosity owing to their highly homogeneous nature and the frequent interbedding of strata. These detailed characterizations contribute significantly to our understanding of the diverse porosity attributes associated with distinct lithofacies within the .
While these studies have demonstrated efficacy in discerning vertical variation patterns and aiding in the identification of depositional facies, certain impediments, such as the challenge of low quality in data or the labor-intensive nature of their interpretation, impose limitations on the widespread application of these approaches, particularly when confronted with extensive datasets. The inherent constraints of low quality can compromise the accuracy of interpretations, while the time-consuming nature of the analysis may hinder the efficiency of the investigative process. In addition, the absence of cores or plug samples, which is a common scenario in many reservoirs, presents a notable challenge. The absence of these physical samples can complicate the establishment of a nuanced relationship between depositional character and the porosity system. In light of these challenges, this paper endeavors to navigate these constraints by presenting a preliminary correlation between porosity-based facies and lithology. This innovative approach seeks to provide insights into the lithological characteristics of the , offering a potential avenue for overcoming the limitations associated with data quality and the absence of traditional core samples in the context of extensive datasets.
The facies denoted as A, expounded upon in this article and distinguished by its heightened non-=matrix porosity, can be associated with lithologies that evolve in situ, notably shrubstones and spherulitestones [19,20,37]. The paucity of gigapores evident in facies A finds plausible correlation with dissolution processes, as posited by Basso et al. [19], while the presence of megapores is attributed to the typical morphologies associated with dendritic form shrub growth. In the context of matrix porosity, the observed values fluctuating between low and intermediate levels may be attributed to the interparticle nature of the primary deposition. Subsequently, this primary deposition appears to have undergone transformations influenced by processes such as cementation and silicification, as elucidated by Tamoto et al. [72] and Basso et al. [19]. This nuanced understanding of facies A not only contributes to our comprehension of its porosity characteristics but also sheds light on the intricate geological processes shaping its lithological attributes, thus fostering a more comprehensive analysis within the framework of the .
Facies B is characterized by a moderate level of non-matrix and matrix porosity, and a correlation with rudstones lithologies has been established, thus originating from subrounded to subangular pebbles comprising shrubstone, spherulitestone, and silicified nodules [20,37,75]. The visual porosity within this facies primarily emanates from the morphological characteristics and particle sizes of shrubstone clasts, as well as spherulitestone components, as explicated by Tamoto et al. [72]. Concurrently, the matrix porosity predominantly results from interparticle spaces arising from the interspersing of shrub and spherulite pores. The intermediate values of matrix porosity described in this study for facies B align cohesively with -derived porosity values reported by Basso et al. [19] and Soares et al. [20] for analogous rudstones-like facies. This congruence underscores the robustness of the analytical framework applied in this investigation, thus substantiating the consistency of our findings with established methodologies. Furthermore, this alignment with existing -derived porosity values enhances the credibility of the correlations drawn between visual and matrix porosity in facies B, thus providing a more nuanced understanding of its lithological attributes within the broader context of the .
Facies C is characterized by a juxtaposition of low non-matrix porosity and medium matrix porosity, thus revealing distinct attributes within the lithological spectrum. This facies is intricately associated with detrital carbonates, specifically grainstones lithologies, as indicated by Soares et al. [20]. The visual pores in facies C are notably sparse, primarily localized along the contacts of laminations or linked to the morphological remnants of shrub fragments. The observed matrix porosity values in facies C are marginally lower than those documented for facies B. This disparity in matrix porosity can be elucidated through a parallel analysis, thus revealing that the matrix porosity in facies C is chiefly intraparticle and influenced to some extent by silicification or cementation processes, thus aligning with the findings of Basso et al. [19]. The nuanced examination of facies C thus not only refines our comprehension of its porosity characteristics but also delves into the geological processes shaping its matrix porosity, thereby shedding light on the intricate interplay of factors contributing to the lithological framework within the broader context of the .
Lastly but not least, facies D, characterized by low non-matrix and low matrix porosity, aligns seamlessly with the lithologies dominated by mudstone, as extensively elucidated by Basso et al. [19] and Soares et al. [20]. The distinctive feature of this facies lies in its highly homogeneous nature, which is a quality that translates into the identification of only a minimal number of mesopores. The homogeneity observed in facies D is indicative of potential early stage silicification or cementation processes during the deposition of mudstone-like lithologies in accordance with the interpretations provided by Basso et al. [19] and Soares et al. [20]. The notably low values of matrix porosity in facies D further underscore the influence of these early stage processes, as expounded upon and extensively detailed by [19]. A succinct comparison between their outcomes is encapsulated in Table 4, thus providing a concise synthesis of the congruence and variations in their findings and contributing to a more comprehensive understanding of the intricate lithological dynamics within the .
Table 4.
Comparative analysis of lithological interpretations by Basso et al. [19] and Soares et al. [20] utilizing acoustic facies and visual porosity, in contrast with the four porosity-based facies proposed in the current study.
5. Conclusions
The study explores the effectiveness of and conventional well logs in identifying subseismic features, such as faults, fractures, and vugs, which are crucial in unconventional reservoirs. While excel in this task, their scarcity and susceptibility to interference patterns necessitate the consideration of conventional well logs. This research proposes a semiautomatic methodology integrating and conventional well logs to distinguish between matrix and non-matrix-related pore spaces, thus providing a preliminary classification of reservoir facies based on porosity. In summary, this study yields the following key conclusions:
- Utility of : excel in identifying subseismic features in unconventional reservoirs.
- Challenges with Logs: Their scarcity and susceptibility to interference patterns necessitate supplementary data sources.
- Role of Conventional Well Logs: While limited in pore space identification, they complement in interpreting subseismic features.
- Complementary Nature: Integrating both log types enhances the preliminary detection of intervals with high pore space percentages.
- Methodology: A semiautomatic approach integrating and conventional logs using a neural network trained with density, sonic, , and data, thus resulting in four facies classifications based on porosity and non-matrix pore size.
- Facies Characterization: Facies A–D correlate with specific lithologies and exhibit varying reservoir qualities and flow behavior implications.
- Reservoir Management Insights: This study advances permeability modeling in carbonate reservoirs, thus highlighting vuggy porosity’s significant impact on production rates.
- Methodological Reliability: The proposed approach offers a robust framework for preliminary facies classification, thus bridging static and dynamic data gaps.
In conclusion, this study advances our understanding of permeability modeling in carbonate reservoirs, thus emphasizing the critical role of vuggy porosity and its profound impact on production rates. The proposed methodology bridges the gap between static and dynamic data, thus offering a comprehensive approach to permeability assessment. These insights hold immense value for reservoir management and the optimization of production strategies in complex carbonate reservoirs.
Author Contributions
Conceptualization R.G.V.G., S.M., G.B., L.d.S.B., S.K.M. and A.C.V.; methodology, R.G.V.G., S.M., M.C.K.A., G.B. and O.R.C.; validation, R.G.V.G., S.M., G.B. and L.d.S.B.; formal analysis, R.G.V.G., S.M. and O.R.C.; investigation, R.G.V.G., G.B. and M.V.T.S.; resources, R.G.V.G. and A.C.V.; data curation, R.G.V.G., S.M., M.C.K.A., L.d.S.B. and Á.F.M.; writing—original draft preparation, R.G.V.G., S.M. and S.K.M.; writing—review and editing, R.G.V.G., S.M. and M.C.K.A.; supervision, A.C.V.; project administration, A.C.V.; funding acquisition, A.C.V. All authors have read and agreed to the published version of the manuscript.
Funding
This research was funded by the ongoing R&D project registered as ANP nº 20469-3, Desenvolvimento de reservatórios carbonáticos—SIMFRAC sponsored by Shell Brasil Petróleo Ltda under the ANP R&D levy as Compromisso de Investimentos com Pesquisa e Desenvolvimento. The APC was funded by Seyed Kourosh Mahjour.
Institutional Review Board Statement
Not applicable.
Informed Consent Statement
Not applicable.
Data Availability Statement
Data is contained within the article.
Acknowledgments
The authors would like to acknowledge the Institute of Geosciences, the Center of Petroleum Studies (CEPETRO), the Geologic Modeling of Reservoirs group (MGR), and the Research in Reservoir Simulation and Management group (UNISIM) from the University of Campinas for providing support to this research. The authors are also grateful to Schumberger and Geoactive for providing the academic licenses of Techlog and Interactive Petrophysics softwares, respectively.
Conflicts of Interest
The authors declare that this study received funding from Shell Brasil Petróleo Ltda. The funder was not involved in the study design, collection, analysis, interpretation of data, the writing of this article or the decision to submit it for publication. The authors declare no conflicts of interest. The funders had no role in the design of the study; in the collection, analyses, or interpretation of data; in the writing of the manuscript, or in the decision to publish the results.
Abbreviations
The following abbreviations and nomenclatures are used in this manuscript:
| Nuclear Magnetic Resonance | |
| Ultrasonic Borehole Image | |
| String of Beads Response | |
| Borehole Image Logs | |
| Barra Velha Formation | |
| Self Organizing Map | |
| Potential of Hydrogen | |
| Magnesium | |
| Photoelectric Factor | |
| Circumferential Borehole Imaging | |
| Fractional Porosity of the Rock | |
| v | Velocity of the Formation |
| Velocity of Interstitial Fluids | |
| Velocity of the Rock Matrix | |
| Matrix Porosity | |
| Acoustic Transit Time | |
| Acoustic Transit Time of Interstitial Fluids | |
| Acoustic Transit Time of the Rock Matrix | |
| t | Travel Time |
| Travel Time of Interstitial Fluids | |
| Travel Time of the Rock Matrix | |
| Total Porosity | |
| Matrix Density | |
| Formation Bulk Density | |
| Fluid Density | |
| D | Euclidean Distance |
| I | Input Vector |
| W | Weight Vector |
| Modification of Weight Vector | |
| Neighborhood Function | |
| c | Distance From The Winning Neuron |
| Neighborhood Radius | |
| Machine Learning | |
| Red, Green, Blue |
Appendix A. Description of the Codes
Two different computing languages were employed in this study: Python (version 3.11.5) and MATLAB® (version 6.5). The image processing techniques were developed using Python, while was implemented on the MATLAB® platform.
The codebase integrates the following:
- (a)
- with principal visual functionalities for image segmentation and automatic classification of data. The goal of image segmentation was the creation of a new log called vug_phi. Subsequently, was used to perform an automatic classification of data that included the new well log vug_phi and conventional well logs described in detail in the article. To do this, used Davies–Bouldin metrics and k-means clustering, including a statistical analysis of results.
- (b)
- Image processing techniques to analyze and quantify pore characteristics within a set of images. Primary functionalities encompass image enhancement, segmentation, and contour detection, followed by statistical analysis and result visualization.
Appendix A.1. Libraries Used
- numpy: For numerical operations and array handling.
- matplotlib.pyplot: For plotting and visualization.
- cv2 (OpenCV): For image processing tasks such as filtering, color space conversion, and contour detection.
- os: For directory and file manipulation.
- math: For mathematical operations.
- random: For generating random numbers.
- pandas: For data manipulation and analysis.
- seaborn: For statistical data visualization.
- toolbox for MATLAB: For the implementation of and visualization of results [76].
Appendix A.2. Workflow Components of SOM Implementation
- Loading LAS Files: The dataset may consist of .las files. In this case, the lasFileReader function is used to handle MATLAB’s structured LAS file data.
- Loading Image Files: The image function in MATLAB is utilized to load the image files. Due to the large size of the dataset, the unique function is applied to optimize the classification.
- SOM Classification: The Vesanto library facilitates automatic classification using the Davies–Bouldin criterion and k-means to determine the clusters of map nodes. The library provides various types of visualization maps. To automate the classification, the Davies–Bouldin Evaluation function is employed to identify the optimal number of groups based on k-means classification.
- Statistical Analysis: The ANOVA function in MATLAB allows for various statistical analyses.
Appendix A.2.1. Detailed Workflow for SOM Application for Vug_phi Curve Analysis
- Data Loading:
- –
- Load the borehole image log to be analyzed.
- –
- Resize the image to a single column to exclude the window for classification (classification is performed point by point).
- –
- Calculate the unique values to optimize the classification.
- SOM Implementation:
- –
- Define the size of the map.
- –
- Standardize the data.
- –
- Apply the .
- Definition of SOM Classes:
- –
- Define an interval of possible classes to analyze.
- –
- Apply k-means clustering under the Davies–Bouldin criterion to the Best Matching Units (s).
- –
- Select the minimum Davies–Bouldin index as the optimal number of classes.
- –
- Associate the group values with the entire dataset.
- Calculation of the Vug_phi Curve:
- –
- Identify the class associated with the vuggy class.
- –
- Calculate the frequency of the vuggy class occurrence per depth.
Appendix A.2.2. Detailed Workflow for SOM Application for Classification of Conventional Well Logs and Vug_phi
- Data Loading:
- –
- Load the .las data and select the desired curves for analysis.
- Integration of Vug_phi Curve with Analyzed Data:
- –
- Merge the datasets using the closest values, thus considering their different scales.
- SOM Implementation:
- –
- Define the size of the map.
- –
- Standardize the data.
- –
- Apply the .
- Definition of SOM Classes:
- –
- Define an interval of possible classes to analyze.
- –
- Apply k-means clustering under the Davies–Bouldin criterion to the s.
- –
- Select the minimum Davies–Bouldin index as the optimal number of classes.
- –
- Associate the group values with the entire dataset.
Appendix A.3. Main Workflow for Pore Size Analysis Using Image Processing
- Load Images:
- –
- Images and corresponding masks are loaded from specified directories.
- Image Enhancement:
- –
- The msrcp function is applied to enhance the images.
- Quantization:
- –
- Enhanced images are quantized based on a black vector within a specified threshold.
- Interval Identification:
- –
- Intervals in the mask images are identified to distinguish different classes of pores.
- Contour Detection:
- –
- Contours are detected in the quantized images for each interval.
- Measurement Calculation:
- –
- For each contour, measurements such as perimeter, area, and diameter are calculated.
- Classification and Visualization:
- –
- Pores are classified based on their diameters and visualized using various plots (e.g., bar plots, strip plots).
- Data Aggregation:
- –
- Measurements are aggregated into a DataFrame and saved as files. Various statistical analyses are performed, and the results are visualized using Seaborn.
A comprehensive explanation of the primary components of this workflow is provided below:
Appendix A.3.1. Image Preprocessing
- Loading Images and Masks:
- –
- The images and its corresponding masks are loaded utilizing OpenCV’s cv2.imread function. The masks facilitate the identification of various regions of interest within the images.
- Multiscale Retinex with Color Preservation (MSRCP):
- –
- The msrcp function is employed to enhance image contrast and detail. This function integrates the MultiScale Retinex () algorithm with color preservation techniques to augment image visibility.
- Quantization:
- –
- The image_qtz function executes color quantization to delineate regions of interest based on a specified vector and threshold. This process aids in isolating pore structures within the image.
Appendix A.3.2. Contour Detection
- Extracting Image Sections:
- –
- The image is segmented into sections according to intervals derived from the mask. Each section corresponds to a distinct depth or class.
- Finding Contours:
- –
- Contours are detected within each image section using the cv2.findContours function. These contours represent the boundaries of pore structures in the image.
References
- Pavičić, I.; Briševac, Z.; Vrbaški, A.; Grgasović, T.; Duić, Ž.; Šijak, D.; Dragičević, I. Geometric and fractal characterization of pore systems in the Upper Triassic dolomites based on image processing techniques (example from Žumberak Mts, NW Croatia). Sustainability 2021, 13, 7668. [Google Scholar] [CrossRef]
- Ran, Q.; Zhou, X.; Xu, M.; Dong, J.; Ren, D.; Li, R. Research on the Fracture Propagation Law of Separate Layered Fracturing in Unconventional Sandstone Reservoirs. Sustainability 2023, 15, 10444. [Google Scholar] [CrossRef]
- Reis, L.; Dimuccio, L.A.; Cunha, L. Assessing Endokarst Potential in the Northern Sector of Santo António Plateau (Estremadura Limestone Massif, Central Portugal). Sustainability 2023, 15, 15599. [Google Scholar] [CrossRef]
- Dvanajščak, D.; Ratej, J.; Jovičić, V. Sustainability of Water Resources in Karst Undermined by Tunneling: A Case Example. Sustainability 2022, 14, 732. [Google Scholar] [CrossRef]
- Gardiner, N.J.; Roberts, J.J.; Johnson, G.; Smith, D.J.; Bond, C.E.; Knipe, R.; Haszeldine, S.; Gordon, S.; O’Donnell, M. Geosciences and the energy transition. Earth Sci. Syst. Soc. 2023, 3, 10072. [Google Scholar] [CrossRef]
- Netto, P.R.; Pozo, M.; da Silva, M.D.; Gomes, M.E.B.; Mexias, A.; Ramnani, C.W.; Parizek-Silva, Y.; Borghi, L.; Rios-Netto, A.d.M. Paleoenvironmental implications of authigenic magnesian clay formation sequences in the Barra Velha Formation (Santos Basin, Brazil). Minerals 2022, 12, 200. [Google Scholar] [CrossRef]
- de Mello, V.L.; Lupinacci, W.M. Mineralogy based classification of carbonate rocks using elastic parameters: A case study from Buzios Field. J. Pet. Sci. Eng. 2022, 209, 109962. [Google Scholar] [CrossRef]
- Correa, R.; Pereira, C.; Cruz, F.; Lisboa, S.; Junior, M.; Souza, V.; Rocha, C.; Araujo, F.; de Carvalho, B.M. Integrated seismic-log-core-test fracture characterization and modelling, Barra Velha Formation, Pre-Salt of Santos Basin. In Proceedings of the 2019 AAPG Annual Convention and Exhibition, San Antonio, TX, USA, 19–22 May 2019. [Google Scholar]
- Correia, M.G.; Maschio, C.; Schiozer, D.J. Integration of multiscale carbonate reservoir heterogeneities in reservoir simulation. J. Pet. Sci. Eng. 2015, 131, 34–50. [Google Scholar] [CrossRef]
- Guan, C.; Zeng, L.; Yao, Y.; Zhang, H.; Zhang, J.; Liang, D. Natural Fractures and Their Contribution to Natural Gas Migration and Accumulation in Marine Carbonate Reservoirs: Lower Triassic Feixianguan Formation, Northeast Sichuan Basin, China. Sustainability 2023, 15, 16155. [Google Scholar] [CrossRef]
- Xu, C.; Di, B.; Wei, J. A physical modeling study of seismic features of karst cave reservoirs in the Tarim Basin, China. Geophysics 2016, 81, B31–B41. [Google Scholar] [CrossRef]
- Yu, J.; Li, Z.; Yang, L. Fault system impact on paleokarst distribution in the Ordovician Yingshan Formation in the central Tarim basin, northwest China. Mar. Pet. Geol. 2016, 71, 105–118. [Google Scholar] [CrossRef]
- Zhang, D. Production allocation method in numerical simulation for fractured vuggy reservoirs. Geoenergy Sci. Eng. 2023, 226, 211735. [Google Scholar] [CrossRef]
- Liu, B.; Yasin, Q.; Sohail, G.M.; Chen, G.; Ismail, A.; Ma, Y.; Fu, X. Seismic characterization of fault and fractures in deep buried carbonate reservoirs using CNN-LSTM based deep neural networks. Geoenergy Sci. Eng. 2023, 229, 212126. [Google Scholar] [CrossRef]
- Li, W.; Yue, D.; Colombera, L.; Duan, D.; Long, T.; Wu, S.; Liu, Y. A novel method for seismic-attribute optimization driven by forward modeling and machine learning in prediction of fluvial reservoirs. Geoenergy Sci. Eng. 2023, 227, 211952. [Google Scholar] [CrossRef]
- Duarte, S.B.; De Jesus, C.M.; Da Silva, V.F.; Arouca Sobreira, M.C.; Cristofaro, R.A.L.; de Lima, L.; De Mello E Silva, F.G.; Marques De Sa, C.H.; De Oliveira Berto, F.M.; Backheuser, Y.; et al. Artificial Intelligence Use To Predict Severe Fluid Losses in Pre-Salt Carbonates. In SPWLA Annual Logging Symposium; Society of Petrophysicists and Well Log Analysts: Houston, TX, USA, 2018; p. D043S008R002. [Google Scholar]
- Ek-Chacón, E.; Molino-Minero-Re, E.; Méndez-Monroy, P.E.; Neme, A.; Ángeles-Hernández, H. Semi-Supervised Training for (Pre-Stack) Seismic Data Analysis. Appl. Sci. 2024, 14, 4175. [Google Scholar] [CrossRef]
- Li, J.; Xu, T.; Zhang, W.; Liu, H.; Kang, Y.; Lv, W. A borehole porosity prediction method with focusing on local shape. Geoenergy Sci. Eng. 2023, 228, 211933. [Google Scholar] [CrossRef]
- Basso, M.; Souza, J.P.P.; Honório, B.C.Z.; Melani, L.H.; Chinelatto, G.F.; Belila, A.M.P.; Vidal, A.C. Acoustic image log facies and well log petrophysical evaluation of the Barra Velha Formation carbonate reservoir from the Santos Basin, offshore Brazil. Carbonates Evaporites 2022, 37, 50. [Google Scholar] [CrossRef]
- Soares, M.V.T.; da S. Bomfim, L.; Vidal, A.C.; Avansi, M.C.K.; Cunha, O.R.; García, R.G.V.; de Paiva Medeiros, R.S. Pre-salt carbonate cyclicity and depositional environment: NMR petrophysics and Markov cyclicity of lacustrine acoustic facies (Santos Basin, Brazil). Mar. Pet. Geol. 2023, 157, 106494. [Google Scholar] [CrossRef]
- Chen, W.; Yang, J.; Li, L.; Wang, H.; Huang, L.; Jia, Y.; Hu, Q.; Jiang, X.; Tang, J. Investigation of Mechanical Properties Evolution and Crack Initiation Mechanisms of Deep Carbonate Rocks Affected by Acid Erosion. Sustainability 2023, 15, 11807. [Google Scholar] [CrossRef]
- Zhou, X.; Wei, J.; Hadavimoghaddam, F.; Gayubov, A.; Ostadhassan, M.; Chen, Y.; Wang, Y.; Yang, B.; Pu, B.; Zhang, X.; et al. “Double sweet spot” identification method via cluster analysis of petrophysical properties from well logg data: A case study of a tight sandstone reservoir. Geoenergy Sci. Eng. 2023, 227, 211821. [Google Scholar] [CrossRef]
- Huang, F.; Huang, L.; Zhu, Z.; Zhang, M.; Zhang, W.; Jiang, X. A Logging Data Based Method for Evaluating the Fracability of a Gas Storage in Eastern China. Sustainability 2024, 16, 3165. [Google Scholar] [CrossRef]
- Aghli, G.; Moussavi-Harami, R.; Mortazavi, S.; Mohammadian, R. Evaluation of new method for estimation of fracture parameters using conventional petrophysical logs and ANFIS in the carbonate heterogeneous reservoirs. J. Pet. Sci. Eng. 2019, 172, 1092–1102. [Google Scholar] [CrossRef]
- Yasin, Q.; Ding, Y.; Baklouti, S.; Boateng, C.D.; Du, Q.; Golsanami, N. An integrated fracture parameter prediction and characterization method in deeply-buried carbonate reservoirs based on deep neural network. J. Pet. Sci. Eng. 2022, 208, 109346. [Google Scholar] [CrossRef]
- Zhao, W.; Liu, T.; Yang, J.; Zhang, Z.; Feng, C.; Tang, J. Approaches of Combining Machine Learning with NMR-Based Pore Structure Characterization for Reservoir Evaluation. Sustainability 2024, 16, 2774. [Google Scholar] [CrossRef]
- Zhu, B.; Meng, J.; Pan, R.; Song, C.; Zhu, Z.; Jin, J.; Zhang, C.; Liu, L.; Xu, L.; Zhou, X. Multi-scale characterization of organic matter pore space in deep marine shale combined with mathematical morphology. Geoenergy Sci. Eng. 2023, 223, 211539. [Google Scholar] [CrossRef]
- Mahjour, S.K.; Santos, A.A.S.; Correia, M.G.; Schiozer, D.J. Scenario reduction methodologies under uncertainties for reservoir development purposes: Distance-based clustering and metaheuristic algorithm. J. Pet. Explor. Prod. Technol. 2021, 11, 3079–3102. [Google Scholar] [CrossRef]
- Gavidia, J.C.R.; Chinelatto, G.F.; Basso, M.; da Ponte Souza, J.P.; Soltanmohammadi, R.; Vidal, A.C.; Goldstein, R.H.; Mohammadizadeh, S. Utilizing integrated artificial intelligence for characterizing mineralogy and facies in a pre-salt carbonate reservoir, Santos Basin, Brazil, using cores, wireline logs, and multi-mineral petrophysical evaluation. Geoenergy Sci. Eng. 2023, 231, 212303. [Google Scholar] [CrossRef]
- Zhao, L.; Zou, C.; Chen, Y.; Shen, W.; Wang, Y.; Chen, H.; Geng, J. Fluid and lithofacies prediction based on integration of well-log data and seismic inversion: A machine-learning approach. Geophysics 2021, 86, M151–M165. [Google Scholar] [CrossRef]
- Xing, Y.; Yang, H.; Yu, W. An approach for the classification of rock types using machine learning of core and log data. Sustainability 2023, 15, 8868. [Google Scholar] [CrossRef]
- Feng, J.; Wang, Q.; Li, M.; Li, X.; Zhou, K.; Tian, X.; Niu, J.; Yang, Z.; Zhang, Q.; Sun, M. Pore Pressure Prediction for High-Pressure Tight Sandstone in the Huizhou Sag, Pearl River Mouth Basin, China: A Machine Learning-Based Approach. J. Mar. Sci. Eng. 2024, 12, 703. [Google Scholar] [CrossRef]
- Gu, Y.; Li, Y.; Yang, Y.; Xiao, B.; Zhang, D.; Bao, Z. Classification pattern of lacustrine carbonate diagenetic facies and logging-based data-driven prediction via a generalized and robust ensemble learning: A demonstration of pre-salt profile, santos basin. Geoenergy Sci. Eng. 2023, 223, 211543. [Google Scholar] [CrossRef]
- Junior, A.N.; Queiroz, G.N.; Godoy, M.G.; da Silva Cardoso, V.; Cedrola, S.M.L.; Mansoldo, F.R.P.; Firpo, R.M.; Paiva, L.M.G.; Sohrabi, M.; Vermelho, A.B. Assessing EOR strategies for application in Brazilian pre-salt reservoirs. Geoenergy Sci. Eng. 2023, 223, 211508. [Google Scholar] [CrossRef]
- Mohriak, W.; Nemčok, M.; Enciso, G. South Atlantic divergent margin evolution: Rift-border uplift and salt tectonics in the basins of SE Brazil. Geol. Soc. Lond. Spec. Publ. 2008, 294, 365–398. [Google Scholar] [CrossRef]
- Moreira, J.L.P.; Madeira, C.V.; Gil, J.A.; Machado, M.A.P. Bacia de Santos. Bol. Geociencias Petrobras 2007, 15, 531–549. [Google Scholar]
- Gomes, J.; Bunevich, R.; Tedeschi, L.; Tucker, M.; Whitaker, F. Facies classification and patterns of lacustrine carbonate deposition of the Barra Velha Formation, Santos Basin, Brazilian Pre-salt. Mar. Pet. Geol. 2020, 113, 104176. [Google Scholar] [CrossRef]
- Wright, V.P.; Barnett, A. Critically evaluating the current depositional models for the pre-salt Barra Velha Formation, Offshore Brazil. AAPG Search Discov. Artic. 2017, 51439. Available online: https://www.searchanddiscovery.com/pdfz/documents/2017/51439wright/ndx_wright.pdf.html (accessed on 5 June 2024).
- Tosca, N.J.; Wright, V.P. Diagenetic pathways linked to labile Mg-clays in lacustrine carbonate reservoirs: A model for the origin of secondary porosity in the Cretaceous pre-salt Barra Velha Formation, offshore Brazil. Geol. Soc. Lond. Spec. Publ. 2018, 435, 33–46. [Google Scholar] [CrossRef]
- Poros, Z.; Jagniecki, E.; Luczaj, J.; Kenter, J.; Gal, B.; Correa, T.S.; Ferreira, E.; McFadden, K.A.; Elifritz, A.; Heumann, M.; et al. Origin of Silica in Pre-Salt Carbonates, Kwanza Basin, Angola. 2017. Available online: https://www.searchanddiscovery.com/pdfz/documents/2017/51413poros/ndx_poros.pdf.html (accessed on 11 December 2023).
- Wright, V.P.; Barnett, A.J. An abiotic model for the development of textures in some South Atlantic early Cretaceous lacustrine carbonates. Geol. Soc. Lond. Spec. Publ. 2015, 418, 209–219. [Google Scholar] [CrossRef]
- Minzoni, M.; Cantelli, A.; Thornton, J.; Wignall, B. Seismic-scale geometries and sequence-stratigraphic architecture of Early Cretaceous syn-post rift carbonate systems, Presalt Section, Brazil. In Seismic Characterization of Carbonate Platforms and Reservoirs; Special Publications; Geological Society: London, UK, 2021; pp. 105–126. [Google Scholar] [CrossRef]
- Pickell, J.J.; Heacock, J.G. Density logging. Geophysics 1960, 25, 891–904. [Google Scholar] [CrossRef]
- Bjorlykke, K. Petroleum Geoscience: From Sedimentary Environments to Rock Physics; Springer Science & Business Media: New York, NY, USA, 2010. [Google Scholar]
- Asquith, G.B.; Krygowski, D.; Gibson, C.R. Basic Well Log Analysis; American Association of Petroleum Geologists Tulsa: Tulsa, OK, USA, 2004; Volume 16. [Google Scholar] [CrossRef]
- Serra, O.; Serra, L. Well Logging. Data Acquisitions and Applications; U.S. Department of Energy Office of Scientific and Technical Information: Oak Ridge, TN, USA, 2004. [Google Scholar]
- Schlumberger. UBI: Advanced Borehole Imaging Independent of Mud Type. Available online: https://www.slb.com/products-and-services/innovating-in-oil-and-gas/reservoir-characterization/surface-and-downhole-logging/wireline-openhole-logging/ultrasonic-borehole-imager (accessed on 7 December 2023).
- Shahinpour, A. Borehole Image Log Analysis for Sedimentary Environment and Clay Volume Interpretation. Master’s Thesis, Institutt for Petroleumsteknologi og Anvendt Geofysikk, Trondheim, Norway, 2013. [Google Scholar]
- Nian, T.; Wang, G.; Xiao, C.; Zhou, L.; Deng, L.; Li, R. The in situ stress determination from borehole image logs in the Kuqa Depression. J. Nat. Gas Sci. Eng. 2016, 34, 1077–1084. [Google Scholar] [CrossRef]
- Zhou, Z.; Wang, W.; Liu, Y. Mathematical model of artificial fracture reinitiation in vugs of carbonate reservoirs. Geoenergy Sci. Eng. 2023, 221, 211366. [Google Scholar] [CrossRef]
- Wyllie, M.R.J.; Gregory, A.R.; Gardner, L.W. Elastic wave velocities in heterogeneous and porous media. Geophysics 1956, 21, 41–70. [Google Scholar] [CrossRef]
- Choquette, P.W.; Pray, L.C. Geologic nomenclature and classification of porosity in sedimentary carbonates. AAPG Bull. 1970, 54, 207–250. [Google Scholar] [CrossRef]
- de Jesus, C.M.; Compan, A.L.M.; Coêlho, J.R.P.; de Sá Silveira, A.E.; Blauth, M. Evaluation of Karst Porosity Morphological Properties through Borehole Image Logs–Correlation with Dynamic Reservoir Properties from a presalt Oil Field; Offshore Technology Conference (OTC): Houston, TX, USA, 2019; p. D021S026R002. [Google Scholar] [CrossRef]
- Bomfim, L.D.S.; Pedrini, H.; Vidal, A.C. A Combined Noisy Borehole Image Log Segmentation Method. In Proceedings of the 2023 30th International Conference on Systems, Signals and Image Processing (IWSSIP), Ohrid, North Macedonia, 27–29 June 2023; IEEE: Piscataway, NJ, USA, 2023; pp. 1–5. [Google Scholar]
- Jia, M.; Huang, W.; Li, Y. Quantitative Characterization of Pore Structure Parameters in Coal Based on Image Processing and SEM Technology. Energies 2023, 16, 1663. [Google Scholar] [CrossRef]
- de Jesus, C.M.; Martins Compan, A.L.; Surmas, R. Permeability estimation using ultrasonic borehole image logs in dual-porosity carbonate reservoirs. Petrophysics 2016, 57, 620–637. [Google Scholar]
- Mohammadizadeh, S.; Moghaddam, M.A.; Talebbeydokhti, N. Analysis of flow in porous media using combined pressurized-free surface network. J. Porous Media 2021, 24, 1–15. [Google Scholar] [CrossRef]
- Malki, M.L.; Saberi, M.R.; Kolawole, O.; Rasouli, V.; Sennaoui, B.; Ozotta, O. Underlying mechanisms and controlling factors of carbonate reservoir characterization from rock physics perspective: A comprehensive review. Geoenergy Sci. Eng. 2023, 226, 211793. [Google Scholar] [CrossRef]
- Zhao, X.; Chen, X.; Lan, Z.; Wang, X.; Yao, G. Pore pressure prediction assisted by machine learning models combined with interpretations: A case study of an HTHP gas field, Yinggehai Basin. Geoenergy Sci. Eng. 2023, 229, 212114. [Google Scholar] [CrossRef]
- Mahjour, S.K.; Soltanmohammadi, R.; Heidaryan, E.; Faroughi, S.A. Geosystems risk and uncertainty: The application of ChatGPT with targeted prompting. Geoenergy Sci. Eng. 2024, 238, 212889. [Google Scholar] [CrossRef]
- Guo, J.; Luo, Y.; Zeng, F.; Wang, R.; Yuan, C.; He, L.; Lu, C. Reconstruction of missing shear wave slowness in shale gas reservoir based on deep learning algorithm. Geoenergy Sci. Eng. 2023, 227, 211865. [Google Scholar] [CrossRef]
- Kohonen, T. Self-Organizing Maps; Springer: Berlin/Heidelberg, Germany, 2001. [Google Scholar] [CrossRef]
- Lofts, J.; Bourke, L. The recognition of artefacts from acoustic and resistivity borehole imaging devices. Geol. Soc. Lond. Spec. Publ. 1999, 159, 59–76. [Google Scholar] [CrossRef]
- Zhang, Z.; Han, W.; Steinsiek, R.; Patterson, D. Ultrasonic signal noise reduction processing in borehole imaging application. In Proceedings of the 2016 IEEE International Frequency Control Symposium (IFCS), New Orleans, LA, USA, 9–12 May 2016; IEEE: Piscataway, NJ, USA, 2016; pp. 1–6. [Google Scholar] [CrossRef]
- Aguilera, R. Analysis of naturally fractured reservoirs from conventional well logs (includes associated papers 6420 and 6421). J. Pet. Technol. 1976, 28, 764–772. [Google Scholar] [CrossRef]
- Wu, X.; Su, Y.; Zhang, C.; Xin, Y.; Chen, X.; Li, N.; Huang, R.; Tang, B.; Zhao, X. A novel evaluation method of dolomite reservoir using electrical image logs: The Cambrian dolomites in Tarim Basin, China. Geoenergy Sci. Eng. 2024, 233, 212509. [Google Scholar] [CrossRef]
- Lai, J.; Bai, T.; Zhao, Y.; Xiao, L.; He, Z.; Wang, C.; Wang, G.; Qin, Z. Unusually petrophysical behavior and geological significance of mudrocks. Geoenergy Sci. Eng. 2023, 230, 212171. [Google Scholar] [CrossRef]
- Fernández-Ibáñez, F.; Jones, G.D.; Mimoun, J.G.; Bowen, M.G.; Simo, J.; Marcon, V.; Esch, W.L. Excess permeability in the Brazil pre-Salt: Non-matrix types, concepts, diagnostic indicators, and reservoir implications. AAPG Bull. 2022, 106, 701–738. [Google Scholar] [CrossRef]
- Mohammadizadeh, S.; Dalfré Filho, J.G.; Descovi, C.S.; Bermúdez, L.F.M.; Sierra, D.A.; Perez, G.A.C. Assessing Cavitation Erosion on Solid Surfaces Using a Cavitation Jet Apparatus. HOLOS 2023, 5. [Google Scholar] [CrossRef]
- Li, Z.; Fan, C.; Sun, B.; Han, X.; Hui, X.; Deng, X.; Wang, A.; Wang, G. Characteristics, logging identification and major controlling factors of bedding-parallel fractures in tight sandstones. Geoenergy Sci. Eng. 2023, 228, 211956. [Google Scholar] [CrossRef]
- Hasan, M.L.; Tóth, T.M. Localization of potential migration pathways inside a fractured metamorphic hydrocarbon reservoir using well log evaluation (Mezősas field, Pannonian Basin). Geoenergy Sci. Eng. 2023, 225, 211710. [Google Scholar] [CrossRef]
- Tamoto, H.; dos Santos Gioria, R.; de Carvalho Carneiro, C. Prediction of nuclear magnetic resonance porosity well-logs in a carbonate reservoir using supervised machine learning models. J. Pet. Sci. Eng. 2023, 220, 111169. [Google Scholar] [CrossRef]
- Descovi, C.S.; Zuffo, A.C.; Mohammadizadeh, S.; Bermúdez, L.F.M.; Sierra, D.A. Utilizing long short-term memory (lstm) networks for river flow prediction in the brazilian pantanal basin. HOLOS 2023, 5. [Google Scholar] [CrossRef]
- Nikeghbali, P.; Omidvar, P.; Akbari, G.; Mohamadi, Z.S.M. The study on sediment motion and the model of dam break on the movable bed by sph method. In Proceedings of the International Conference on Coasts, Ports and Marine Structures (ICOPMAS), Tehran, Iran, 24–26 November 2014; Available online: https://sid.ir/paper/948560/en (accessed on 30 June 2024).
- Muniz, M.; Bosence, D. Lacustrine carbonate platforms: Facies, cycles, and tectonosedimentary models for the presalt Lagoa Feia Group (Lower Cretaceous), Campos Basin, Brazil. AAPG Bull. 2018, 102, 2569–2597. [Google Scholar] [CrossRef]
- Vesanto, J.; Alhoniemi, E.; Himberg, J.; Parhankangas, J. Self-Organizing Map in Matlab: The SOM Toolbox. In Proceedings of the Matlab DSP Conference, Espoo, Finland, 16–17 November 1999; pp. 35–40. Available online: http://www.cis.hut.fi/somtoolbox/documentation/ (accessed on 29 June 2024).
Disclaimer/Publisher’s Note: The statements, opinions and data contained in all publications are solely those of the individual author(s) and contributor(s) and not of MDPI and/or the editor(s). MDPI and/or the editor(s) disclaim responsibility for any injury to people or property resulting from any ideas, methods, instructions or products referred to in the content. |
© 2024 by the authors. Licensee MDPI, Basel, Switzerland. This article is an open access article distributed under the terms and conditions of the Creative Commons Attribution (CC BY) license (https://creativecommons.org/licenses/by/4.0/).