
Iron- and Nitrogen-Modified Biochar for Nitrate Adsorption from Aqueous Solution

 , , and
Abstract
:1. Introduction
2. Materials and Methods
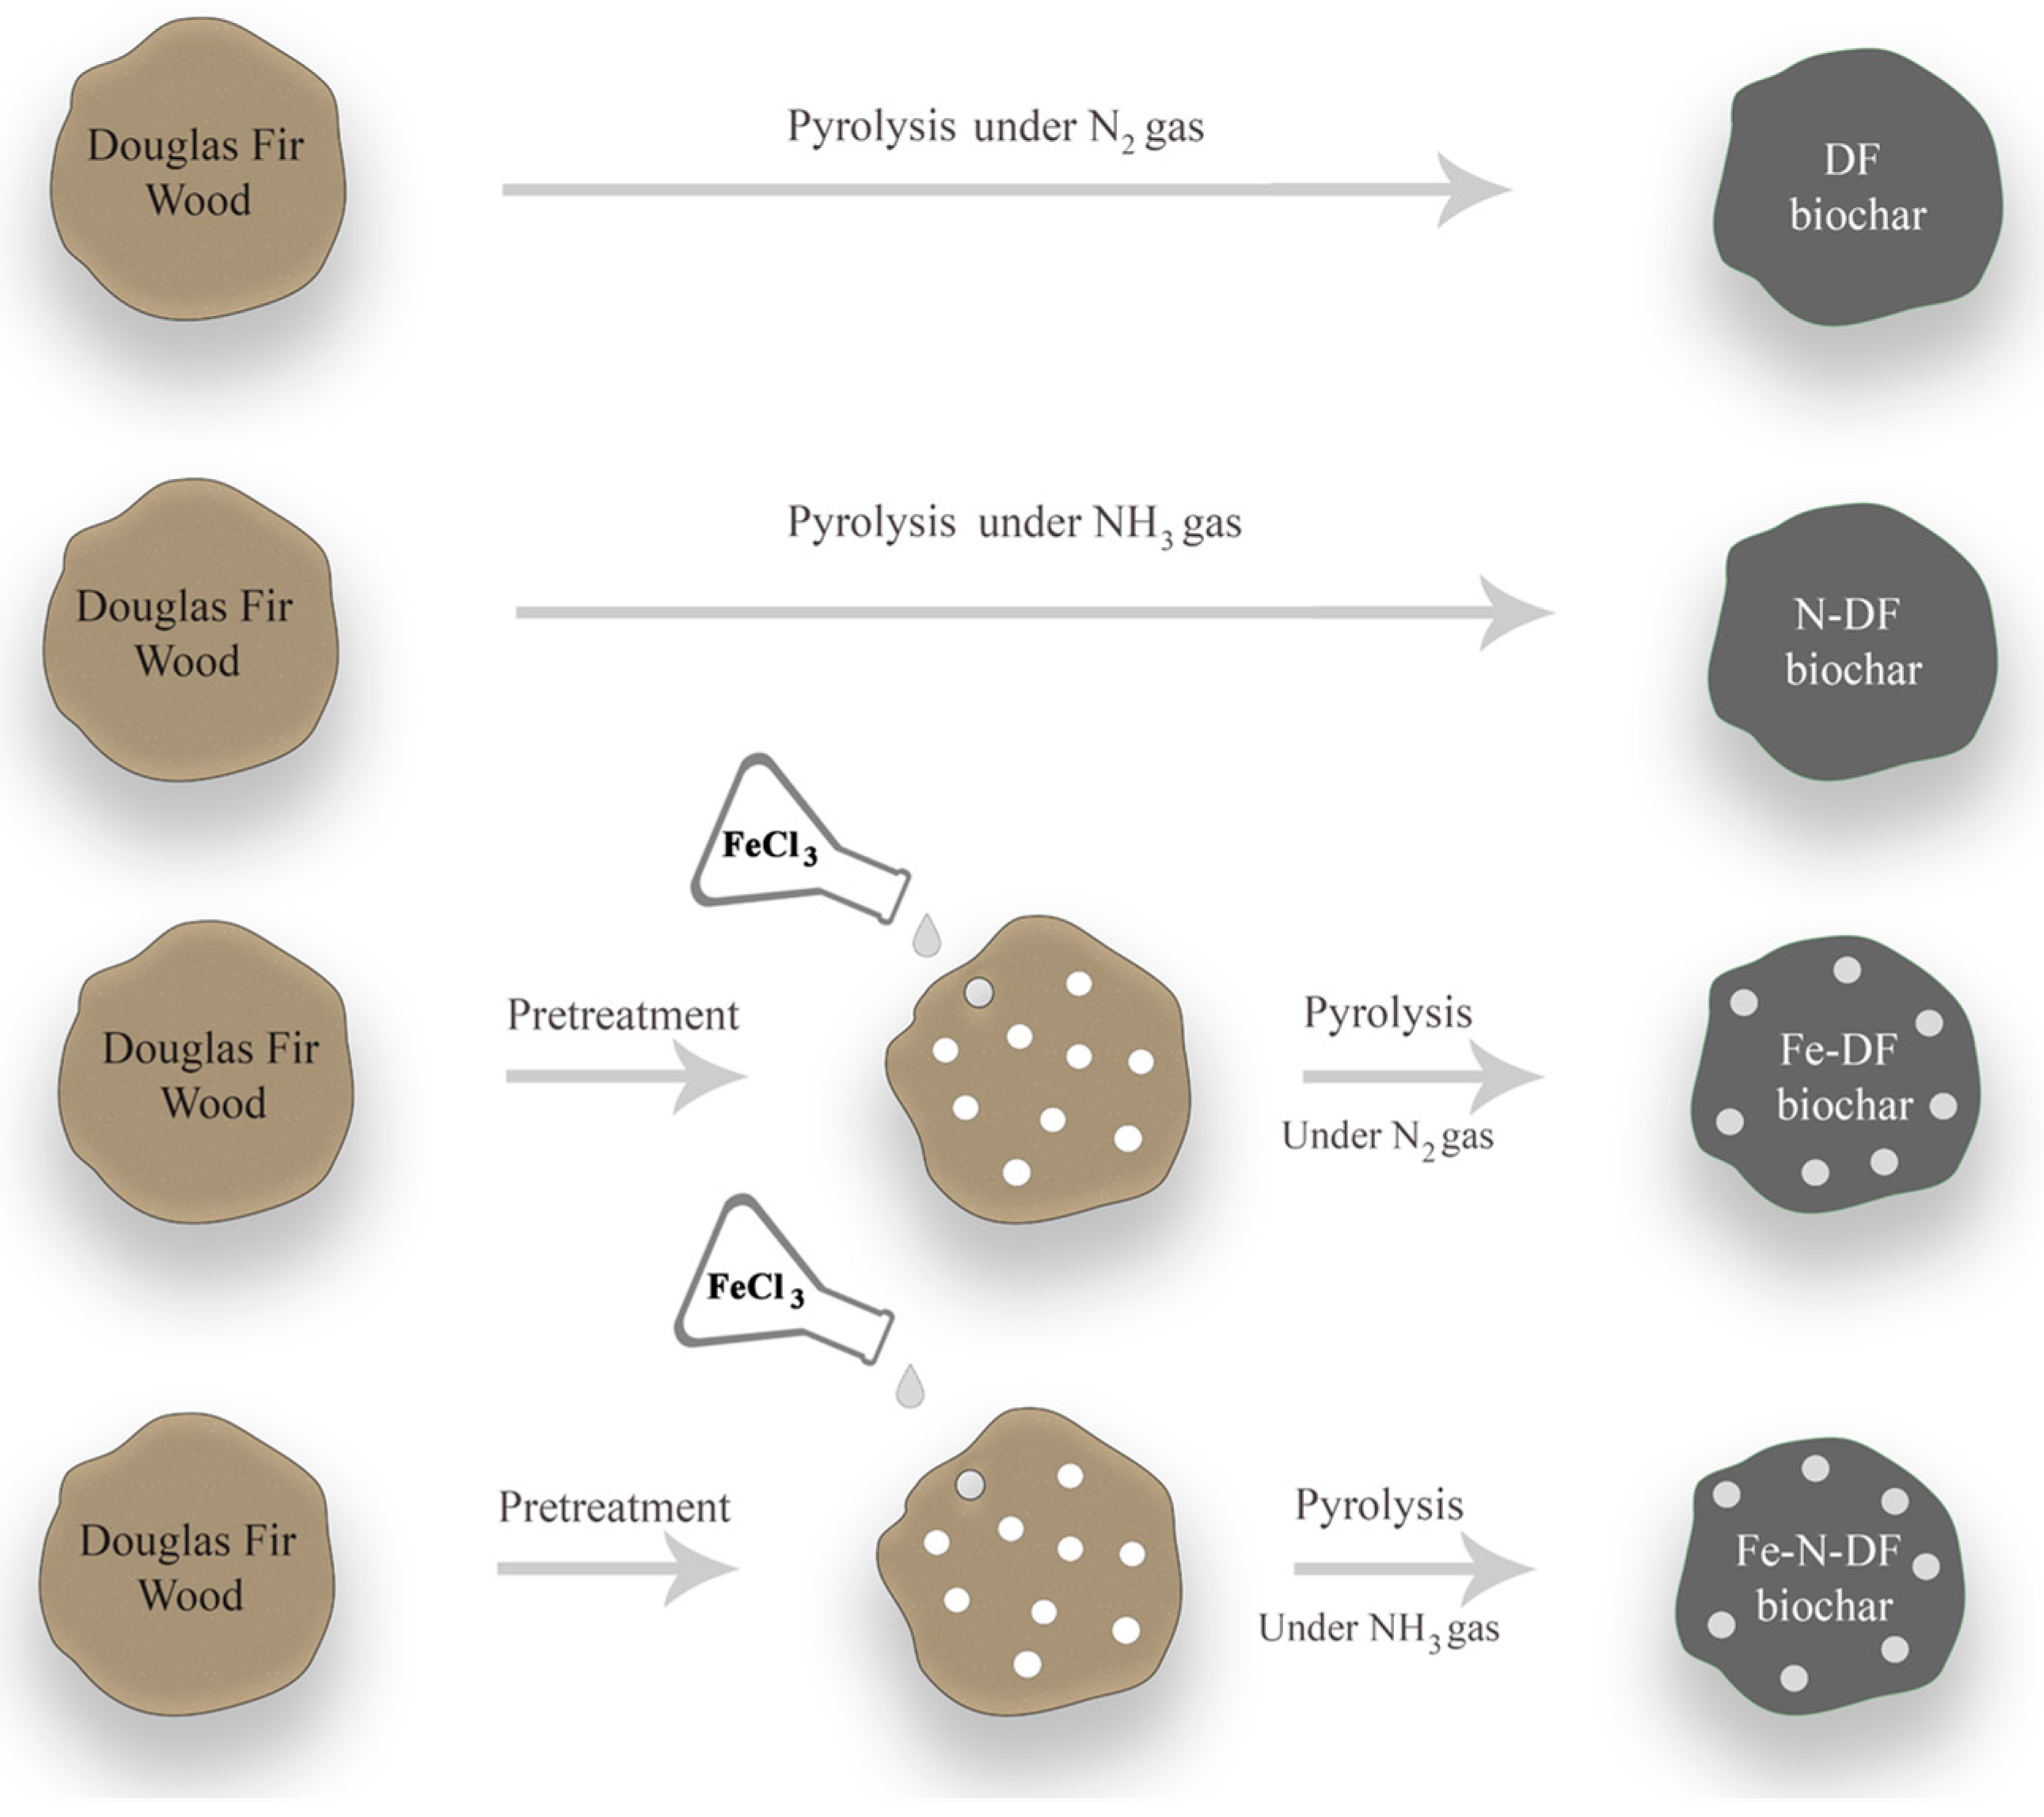
2.1. Biochar Production
2.2. Char Characterization
2.3. Nitrate Adsorption Study
2.4. Experimental Design
3. Results and Discussion
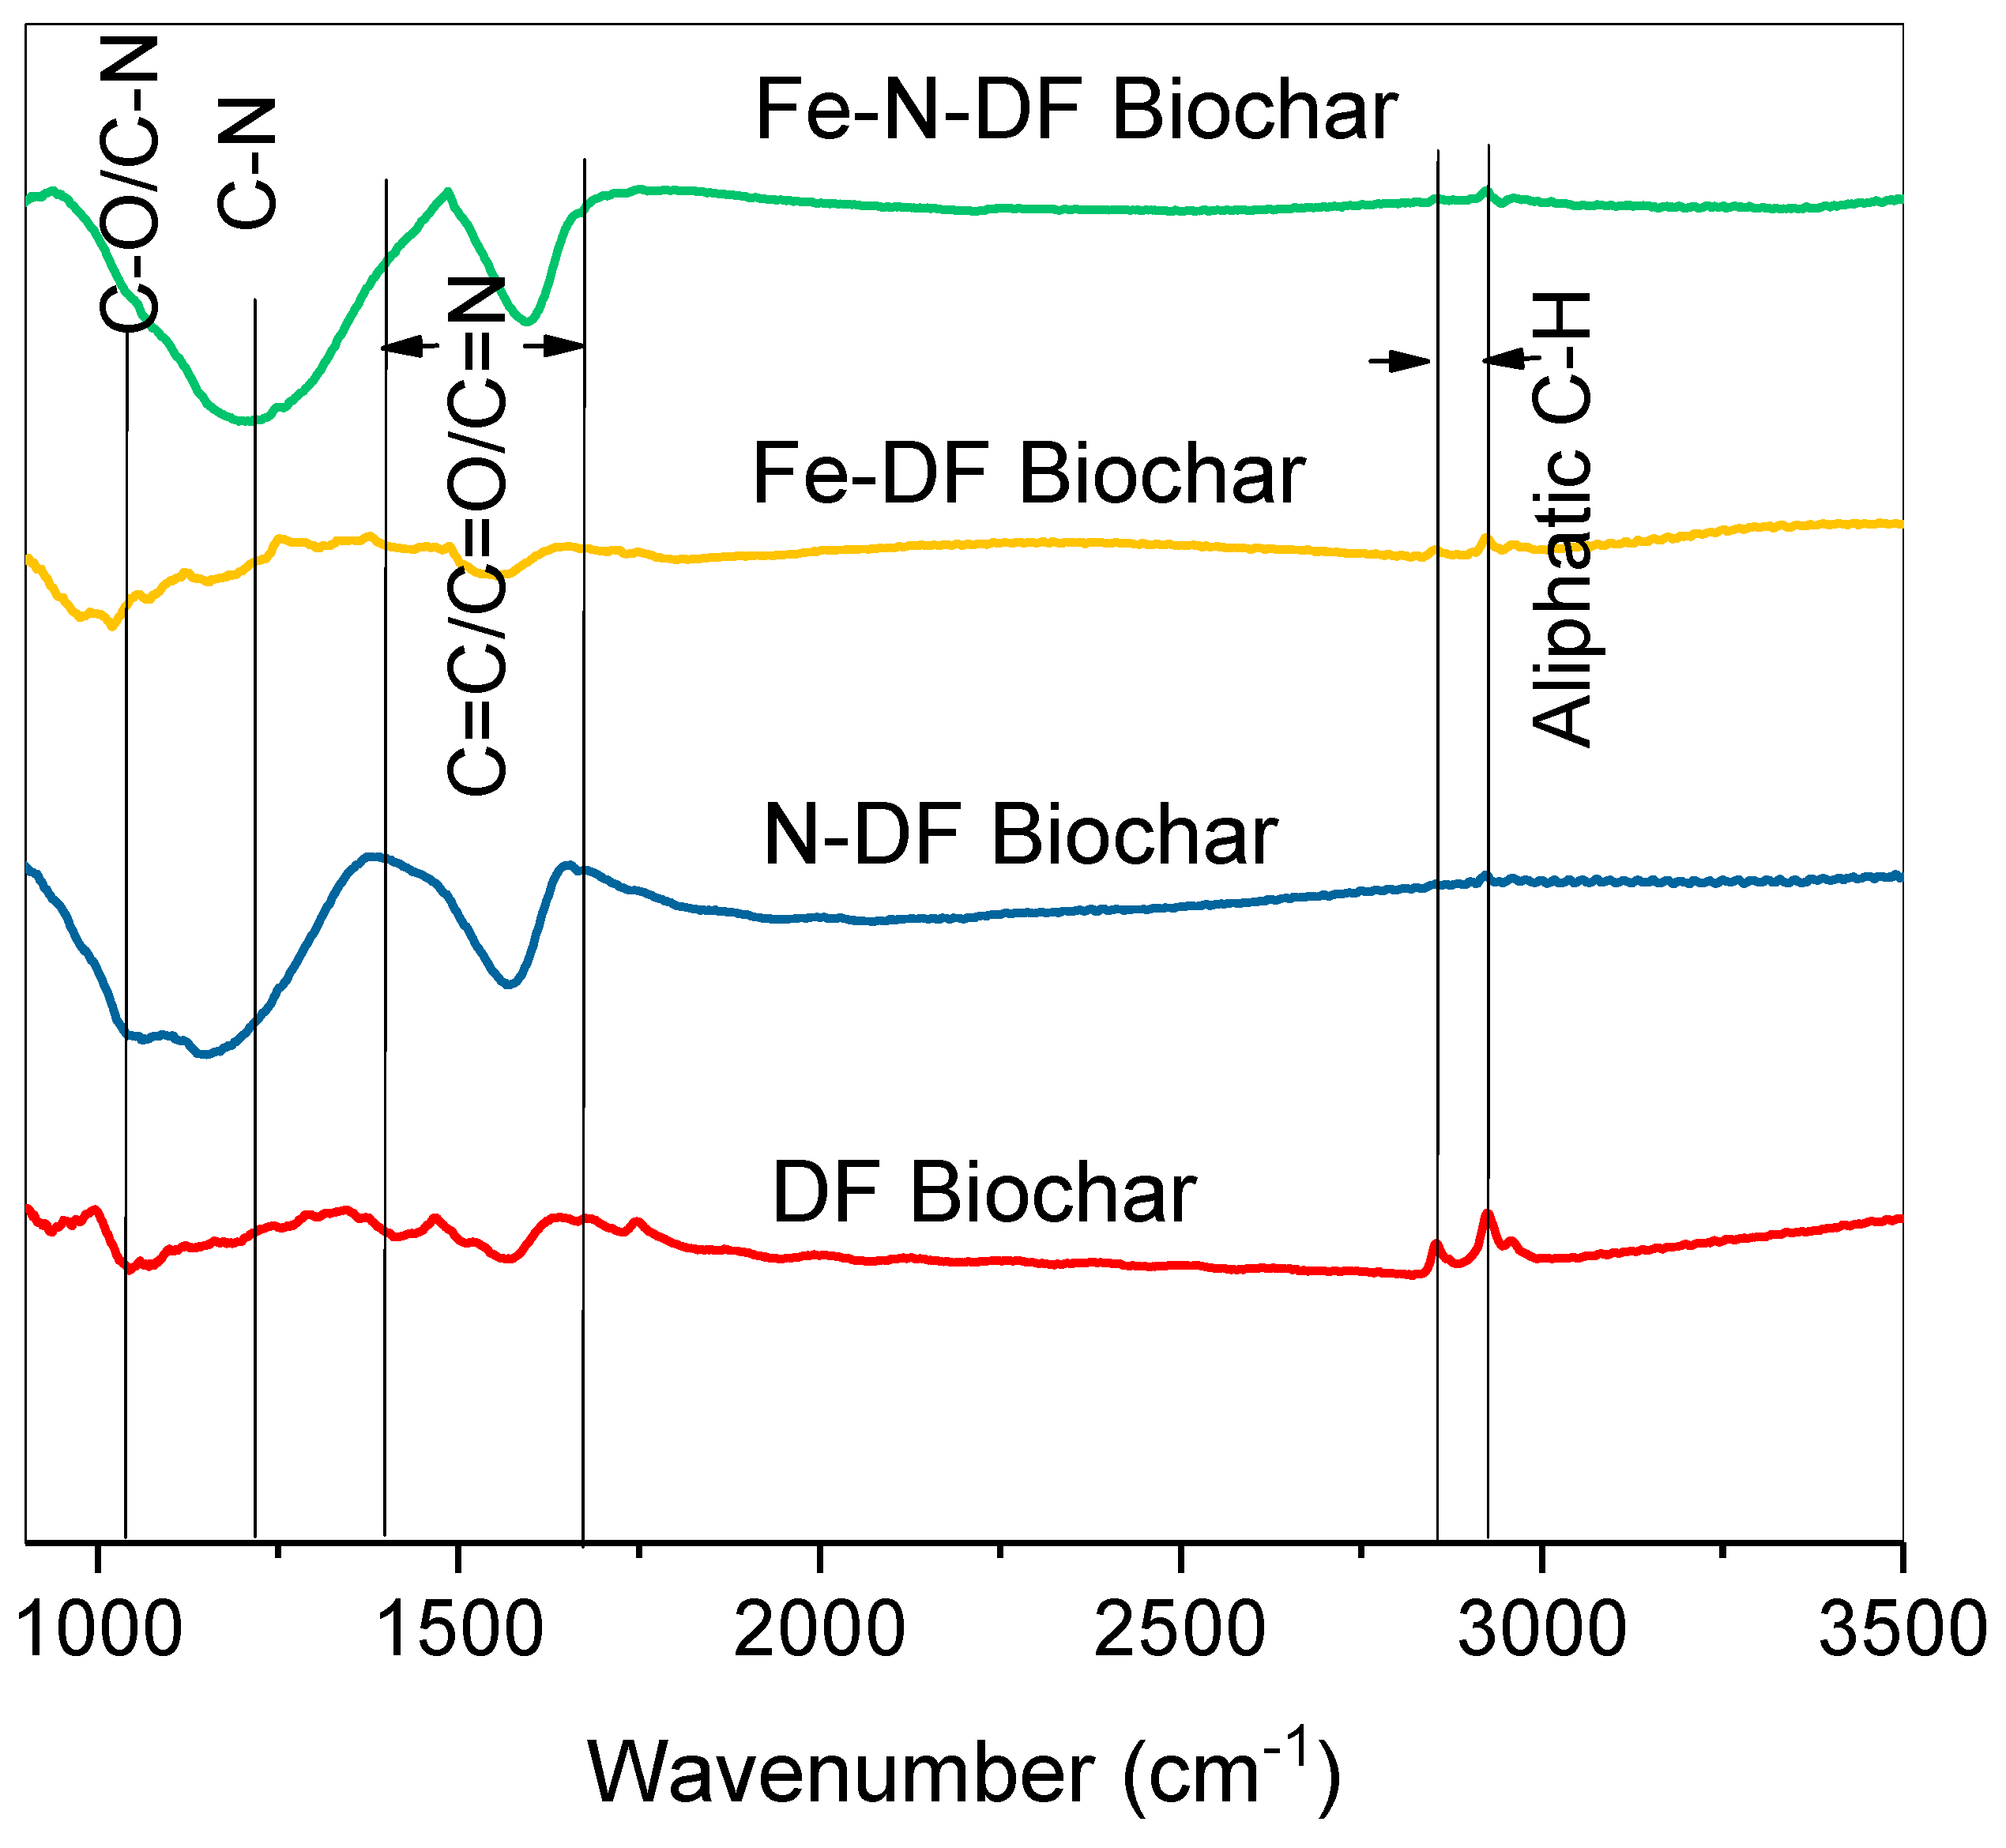
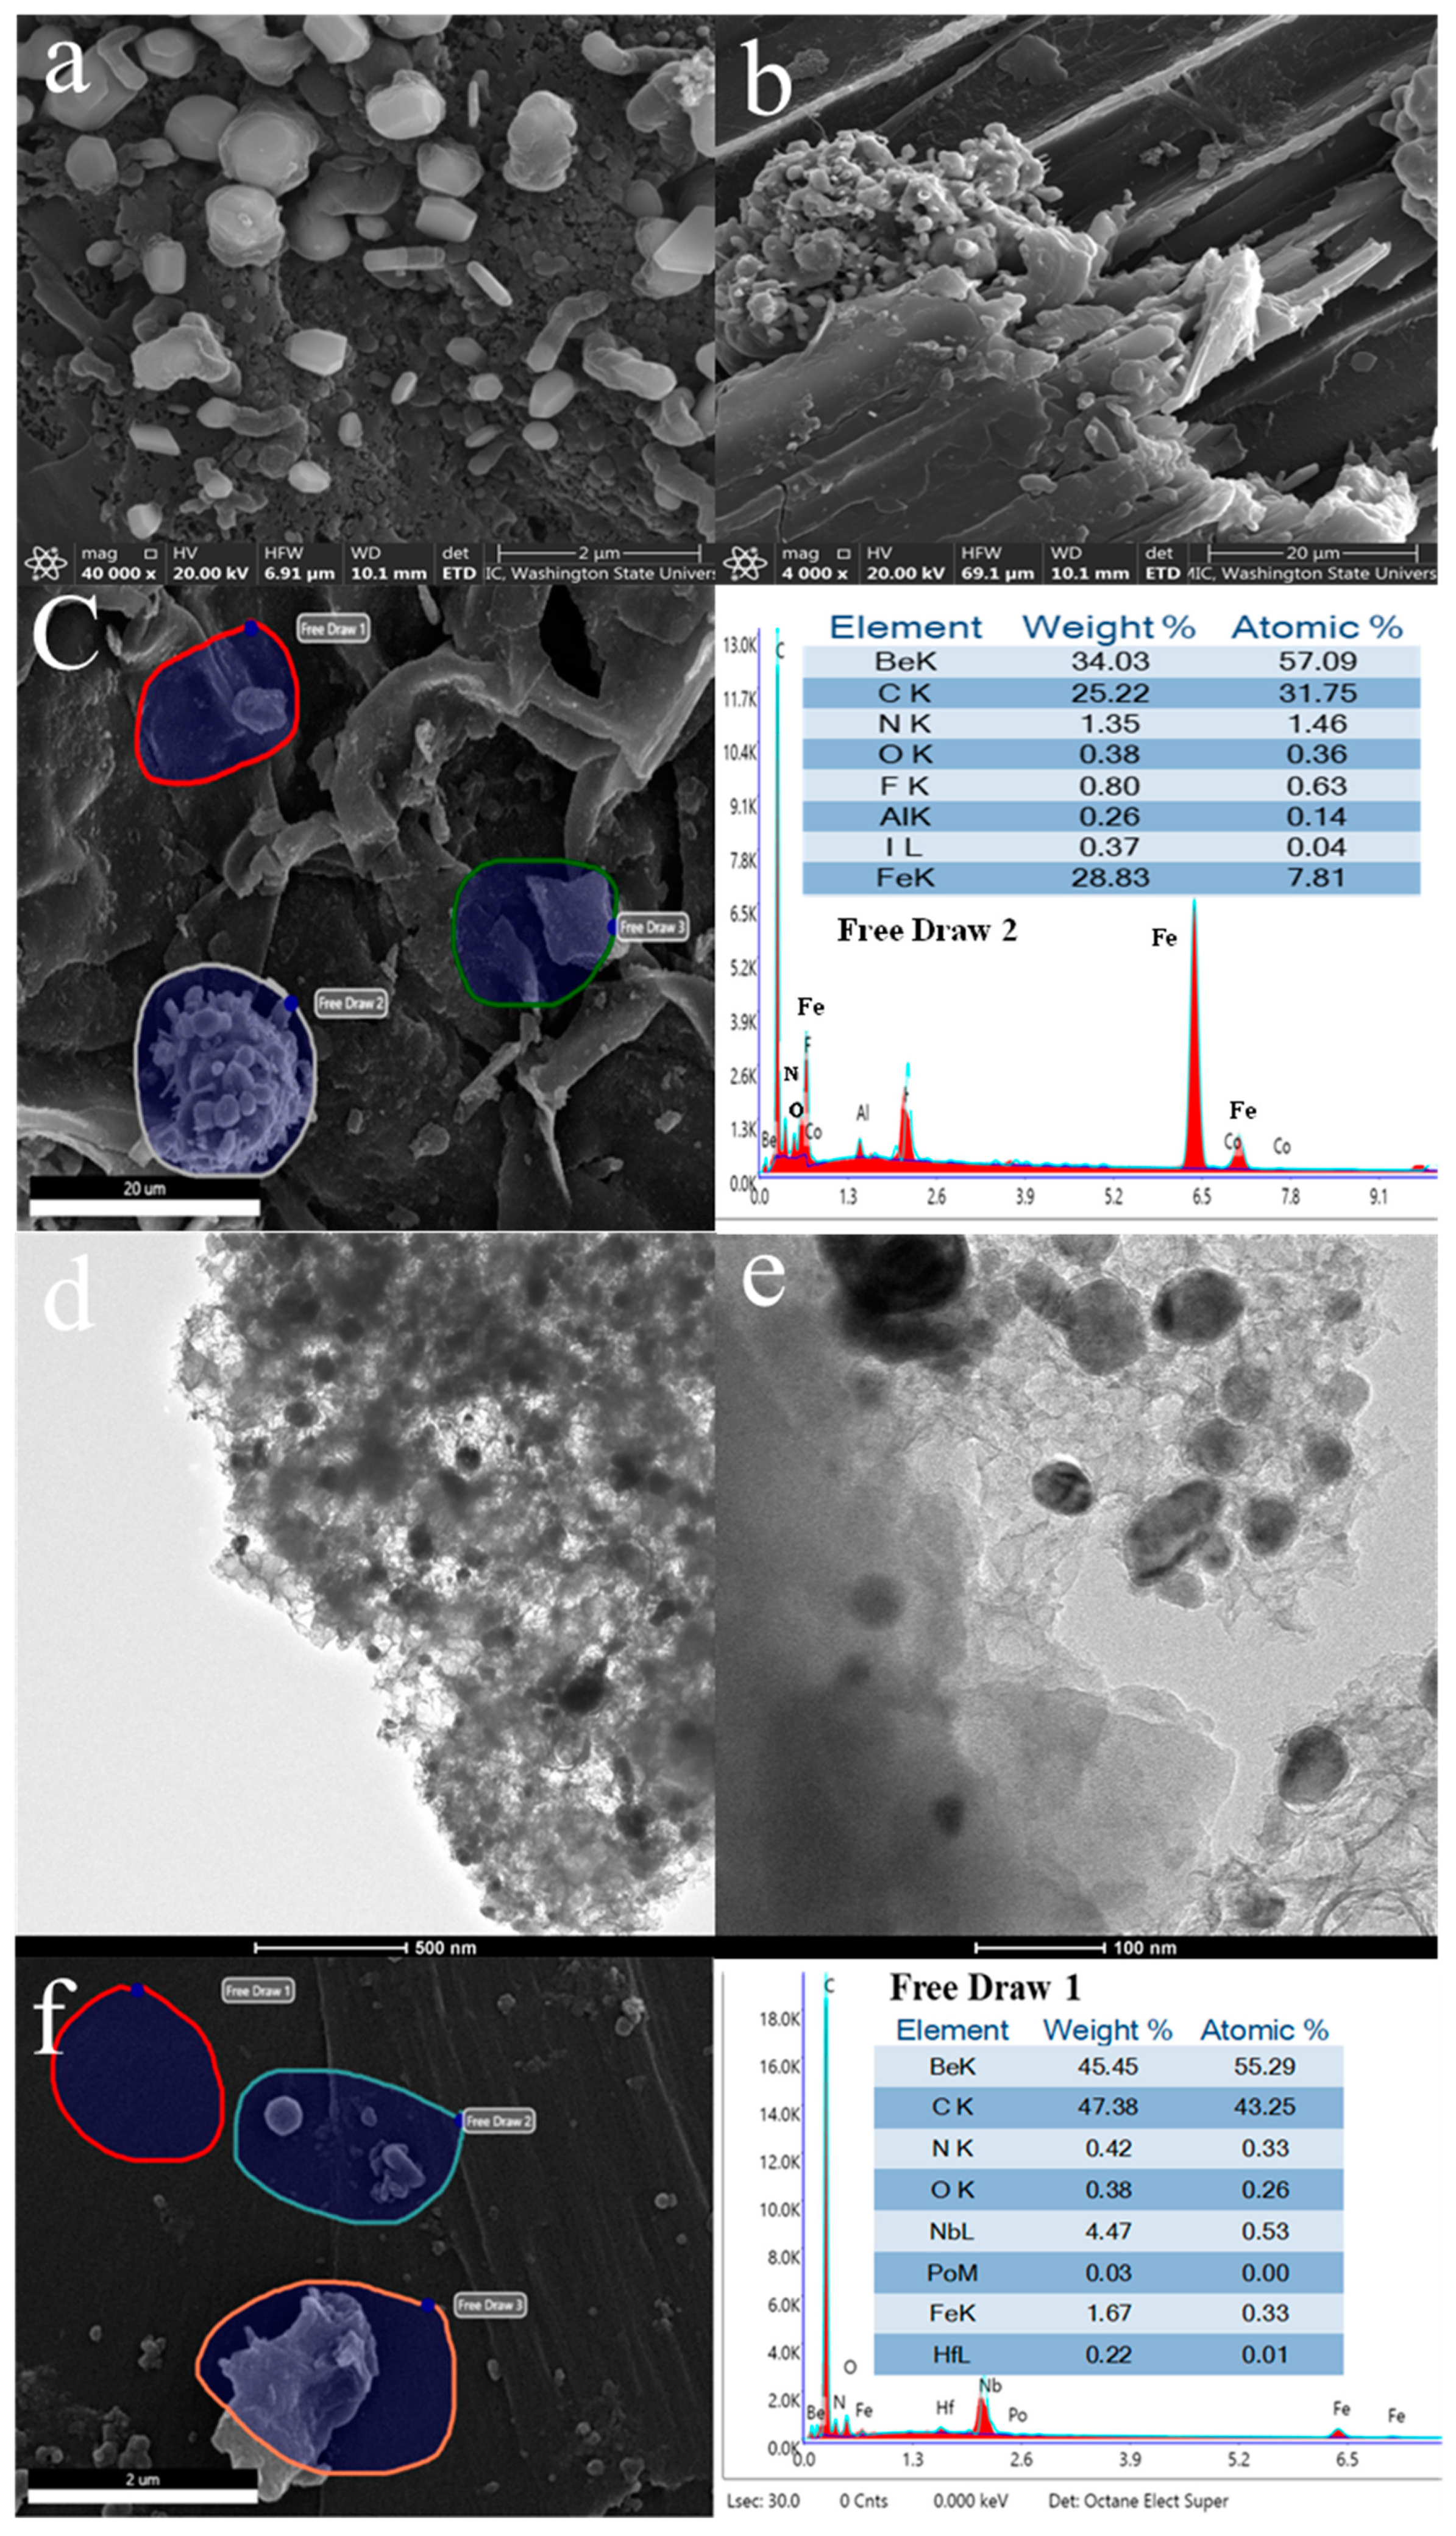
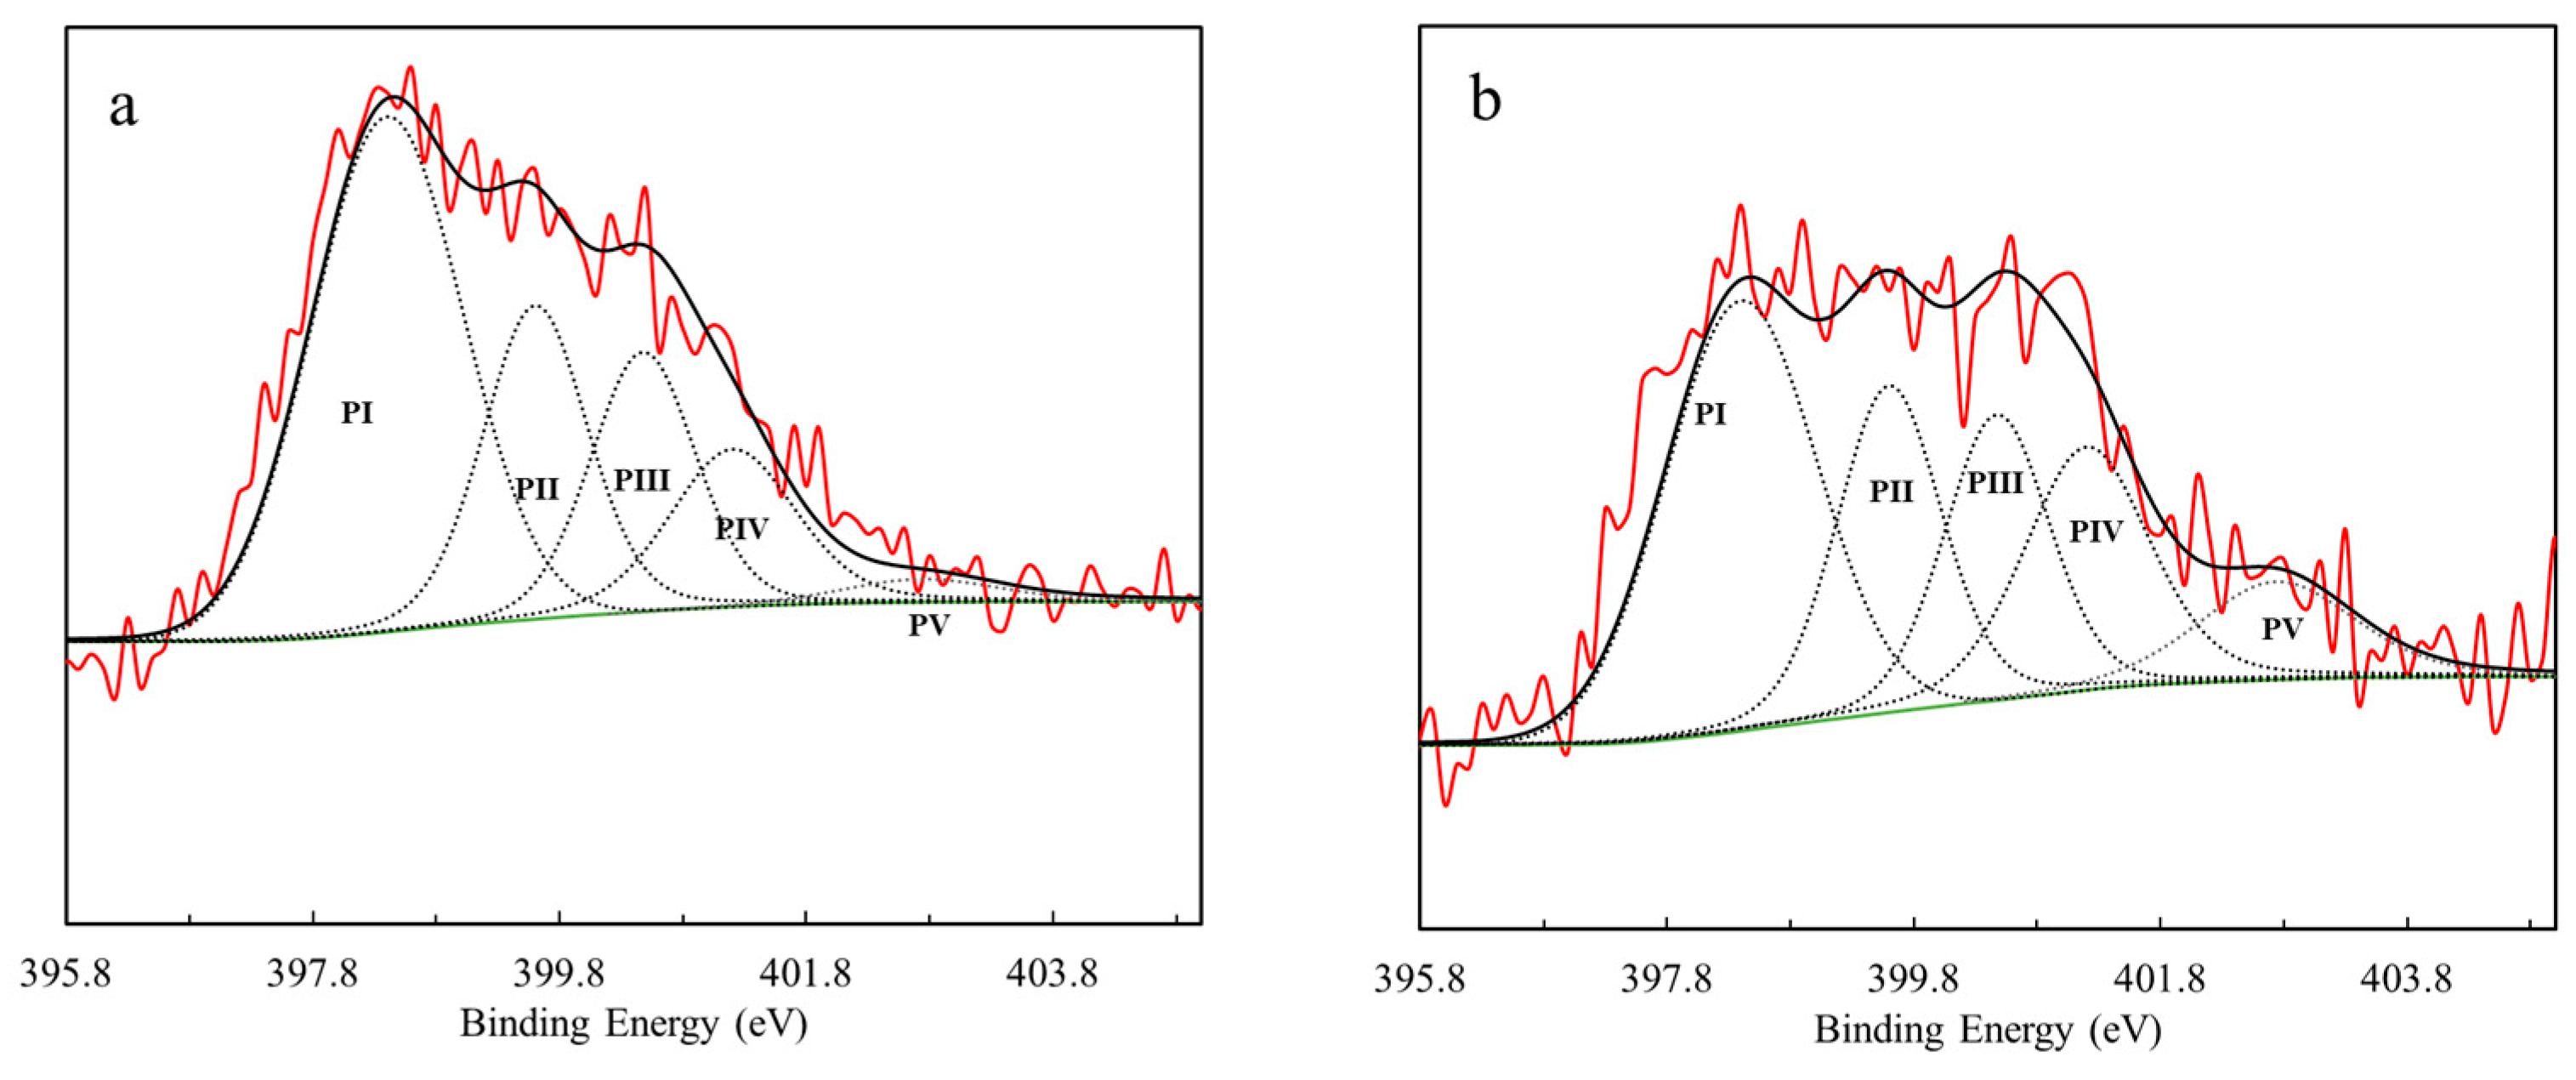
3.1. Biochar Production and Characterization
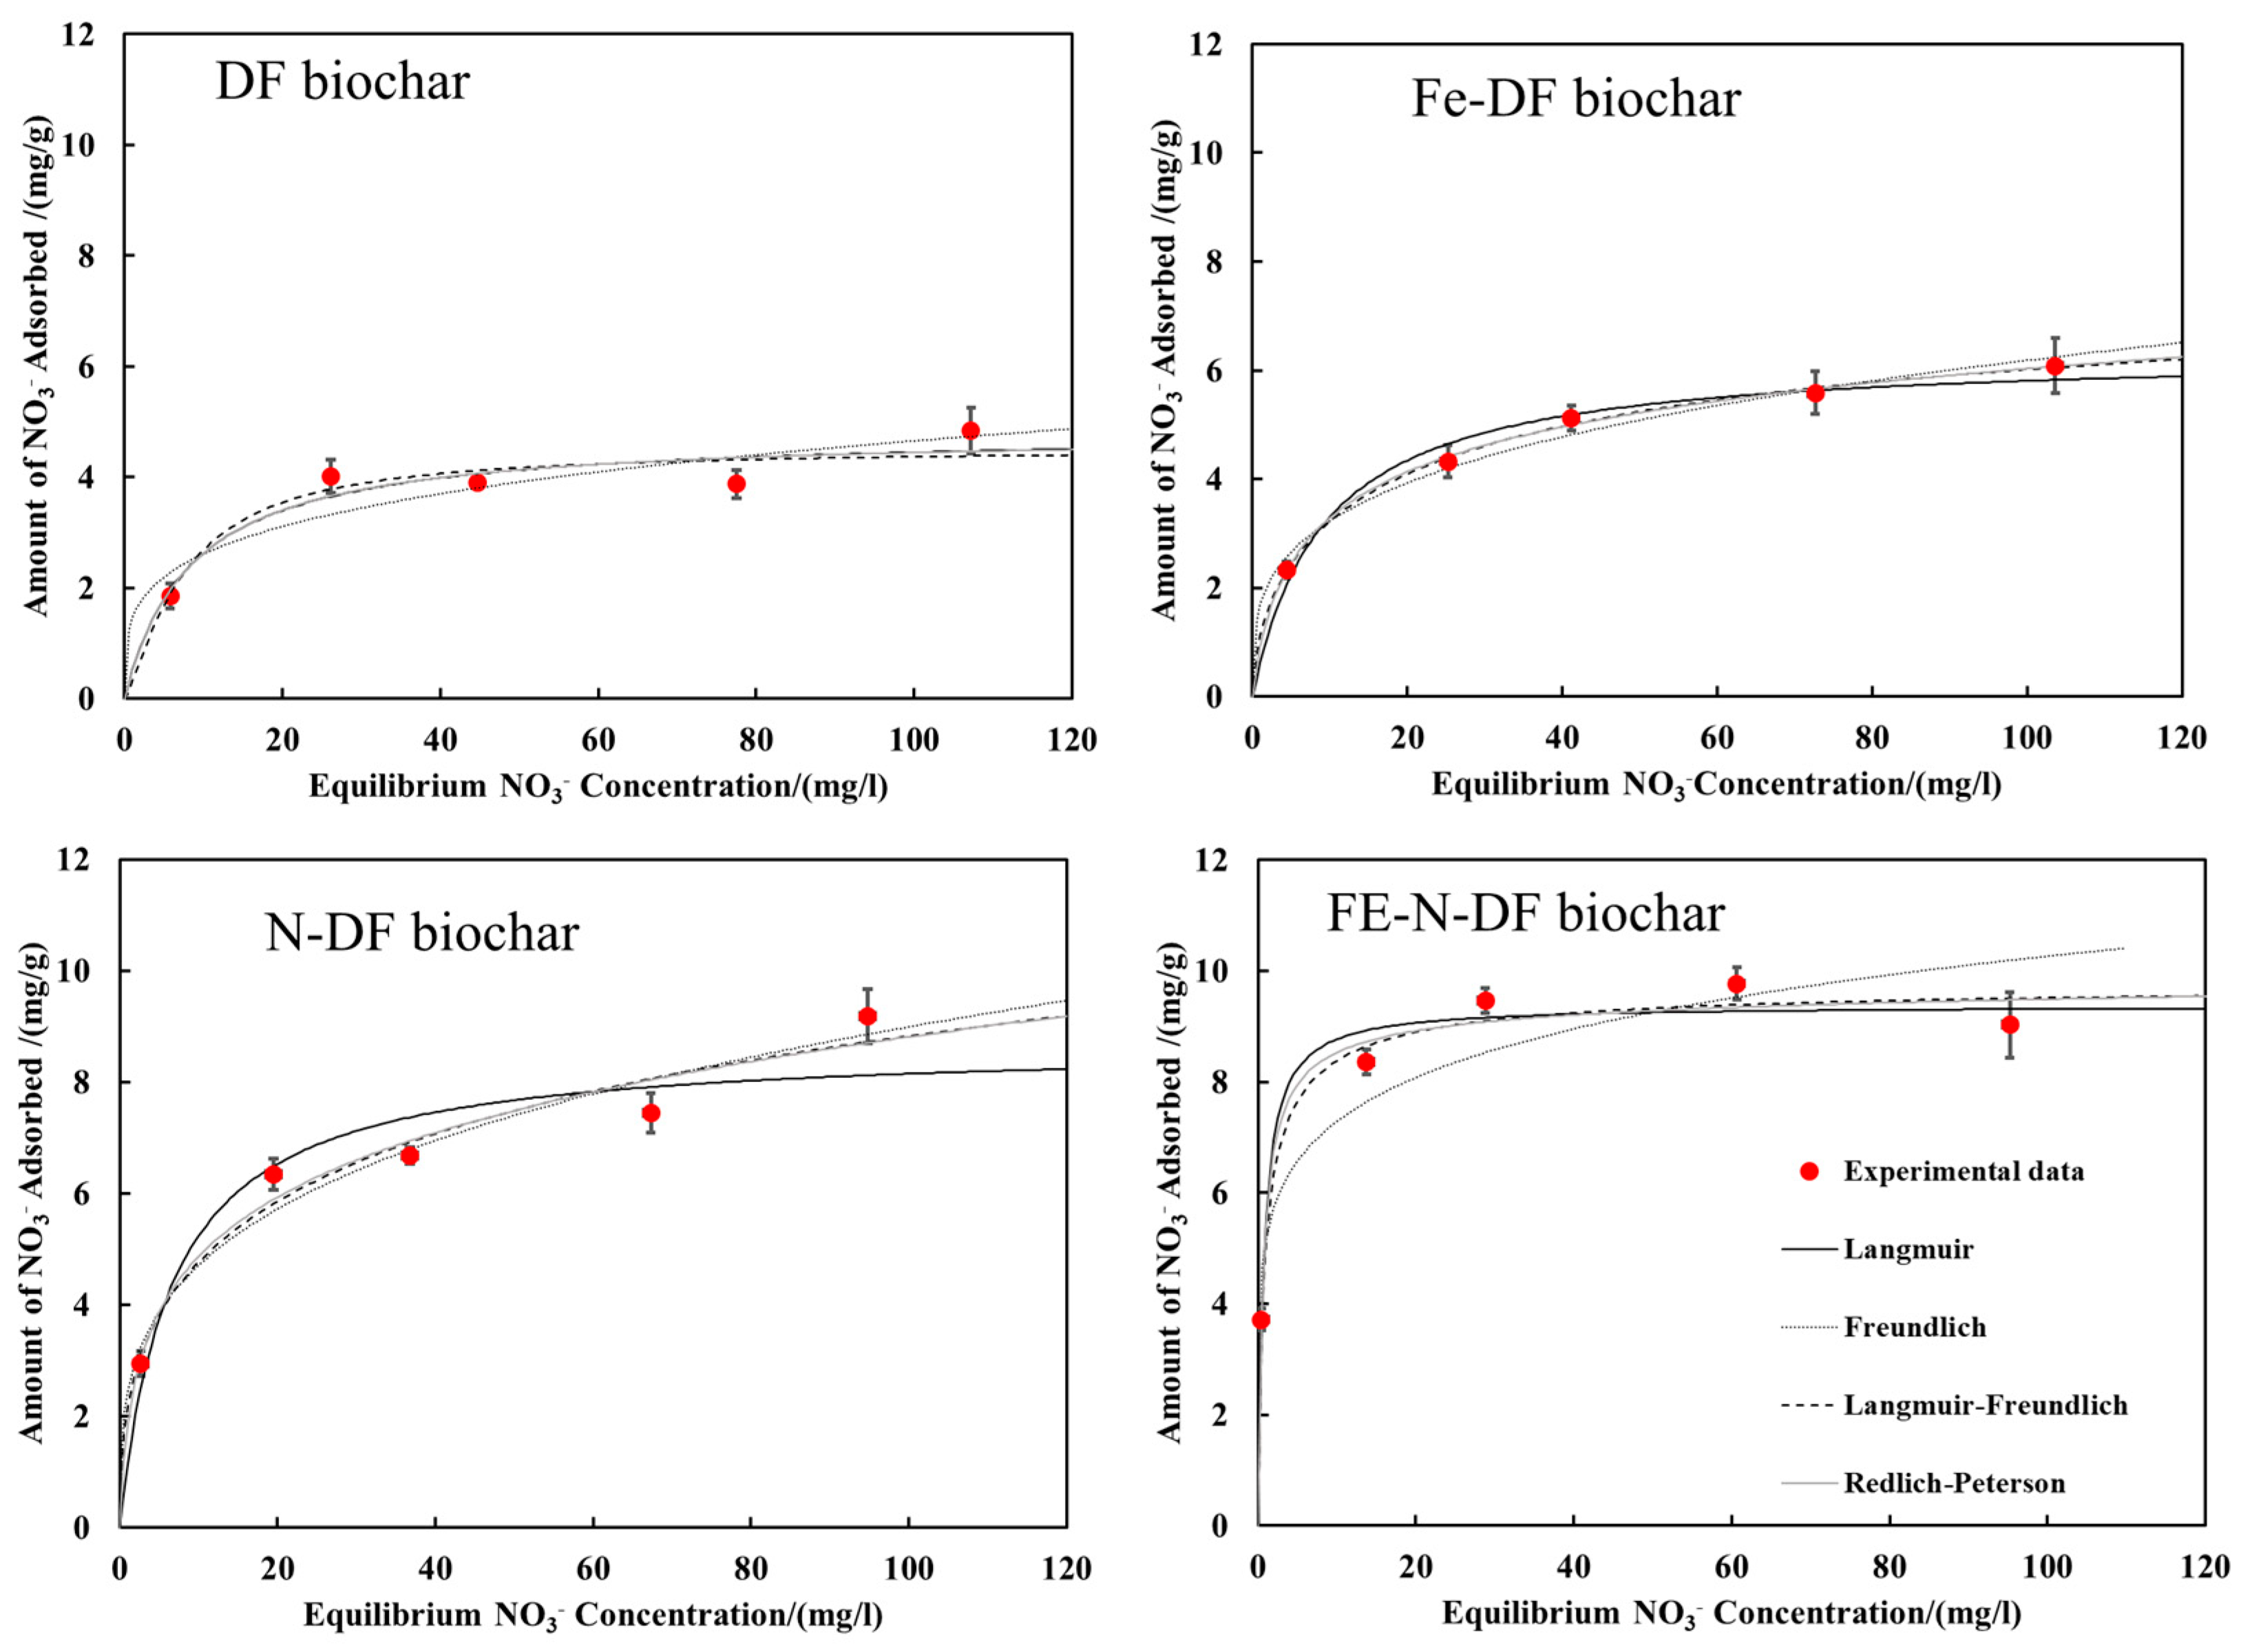
3.2. Nitrate Adsorption
4. Conclusions
Author Contributions
Funding
Institutional Review Board Statement
Informed Consent Statement
Data Availability Statement
Acknowledgments
Conflicts of Interest
References
- Yin, Q.; Ren, H.; Wang, R.; Zhao, Z. Evaluation of nitrate and phosphate adsorption on Al-modified biochar: Influence of Al content. Sci. Total Environ. 2018, 631–632, 895–903. [Google Scholar] [CrossRef]
- Hornung, M. 11—The Role of Nitrates in the Eutrophication and Acidification of Surface Waters. In Managing Risks of Nitrates to Humans and the Environment; Wilson, W.S., Ball, A.S., Hinton, R.H., Eds.; Woodhead Publishing: Sawston, UK, 1999; pp. 155–174. [Google Scholar]
- Loganathan, P.; Vigneswaran, S.; Kandasamy, J. Enhanced removal of nitrate from water using surface modification of adsorbents—A review. J. Environ. Manag. 2013, 131, 363–374. [Google Scholar] [CrossRef]
- Haghighi Mood, S. Contribution to Nutrient Recovery from Anaerobically Digested Liquid Effluent Using Engineered Biochar; Washington State University: Pullman, WA, USA, 2022. [Google Scholar]
- Hwang, S.-J. Eutrophication and the Ecological Health Risk. Int. J. Environ. Res. Public Health 2020, 17, 6332. [Google Scholar] [CrossRef]
- Liu, Y.; Zhang, X.; Wang, J. A critical review of various adsorbents for selective removal of nitrate from water: Structure, performance and mechanism. Chemosphere 2022, 291, 132728. [Google Scholar] [CrossRef]
- Bhatnagar, A.; Sillanpää, M. A review of emerging adsorbents for nitrate removal from water. Chem. Eng. J. 2011, 168, 493–504. [Google Scholar] [CrossRef]
- Chiu, H.-F.; Tsai, S.-S.; Yang, C.-Y. Nitrate in Drinking Water and Risk of Death from Bladder Cancer: An Ecological Case-Control Study in Taiwan. J. Toxicol. Environ. Health Part A 2007, 70, 1000–1004. [Google Scholar] [CrossRef]
- Majumdar, D.; Gupta, N. Nitrate pollution of groundwater and associated human health disorders. Indian J. Environ. Health 2000, 42, 28–39. [Google Scholar]
- EPA. 2018 Edition of the Drinking Water Standards and Health Advisories Tables; Environmental Protection Agency: Washington, DC, USA, 2018. [Google Scholar]
- WHO. Nitrate and Nitrite in Drinking-Water Background Document for Development of WHO Guidelines for Drinking-Water Quality; WHO: Geneva, Switzerland, 2016. [Google Scholar]
- Adimalla, N.; Qian, H. Groundwater chemistry, distribution and potential health risk appraisal of nitrate enriched groundwater: A case study from the semi-urban region of South India. Ecotoxicol. Environ. Saf. 2021, 207, 111277. [Google Scholar] [CrossRef]
- Liu, J.; Peng, Y.; Li, C.; Gao, Z.; Chen, S. Characterization of the hydrochemistry of water resources of the Weibei Plain, Northern China, as well as an assessment of the risk of high groundwater nitrate levels to human health. Environ. Pollut. 2021, 268, 115947. [Google Scholar] [CrossRef]
- Abascal, E.; Gómez-Coma, L.; Ortiz, I.; Ortiz, A. Global diagnosis of nitrate pollution in groundwater and review of removal technologies. Sci. Total Environ. 2022, 810, 152233. [Google Scholar] [CrossRef]
- Pennino, M.J.; Compton, J.E.; Leibowitz, S.G. Trends in Drinking Water Nitrate Violations Across the United States. Environ. Sci. Technol. 2017, 51, 13450–13460. [Google Scholar] [CrossRef]
- Harter, T.; Lund, J.R.; Darby, J.; Fogg, G.E.; Howitt, R.; Jessoe, K.K.; Pettygrove, G.S.; Quinn, J.F.; Viers, J.H.; Boyle, D.B.; et al. Addressing Nitrate in California’s Drinking Water with a Focus on Tulare Lake Basin and Salinas Valley Groundwater. In State Water Resources Control Board Report to the Legislature; Center for Watershed Sciences, University of California: Davis, CA, USA, 2012; 78p. [Google Scholar]
- Divband Hafshejani, L.; Hooshmand, A.; Naseri, A.A.; Mohammadi, A.S.; Abbasi, F.; Bhatnagar, A. Removal of nitrate from aqueous solution by modified sugarcane bagasse biochar. Ecol. Eng. 2016, 95, 101–111. [Google Scholar] [CrossRef]
- Pang, Y.; Wang, J. Various electron donors for biological nitrate removal: A review. Sci. Total Environ. 2021, 794, 148699. [Google Scholar] [CrossRef]
- Rajta, A.; Bhatia, R.; Setia, H.; Pathania, P. Role of heterotrophic aerobic denitrifying bacteria in nitrate removal from wastewater. J. Appl. Microbiol. 2020, 128, 1261–1278. [Google Scholar] [CrossRef]
- Demiral, H.; Gündüzoğlu, G. Removal of nitrate from aqueous solutions by activated carbon prepared from sugar beet bagasse. Bioresour. Technol. 2010, 101, 1675–1680. [Google Scholar] [CrossRef]
- Priya, E.; Kumar, S.; Verma, C.; Sarkar, S.; Maji, P.K. A comprehensive review on technological advances of adsorption for removing nitrate and phosphate from waste water. J. Water Process Eng. 2022, 49, 103159. [Google Scholar] [CrossRef]
- Araújo, R.; Castro, A.C.M.; Santos Baptista, J.; Fiúza, A. Nanosized iron based permeable reactive barriers for nitrate removal—Systematic review. Phys. Chem. Earth Parts A/B/C 2016, 94, 29–34. [Google Scholar] [CrossRef]
- Fernández-López, J.A.; Alacid, M.; Obón, J.M.; Martínez-Vives, R.; Angosto, J.M. Nitrate-Polluted Waterbodies Remediation: Global Insights into Treatments for Compliance. Appl. Sci. 2023, 13, 4154. [Google Scholar] [CrossRef]
- Mazarji, M.; Aminzadeh, B.; Baghdadi, M.; Bhatnagar, A. Removal of nitrate from aqueous solution using modified granular activated carbon. J. Mol. Liq. 2017, 233, 139–148. [Google Scholar] [CrossRef]
- Haghighi Mood, S.; Pelaez-Samaniego, M.R.; Garcia-Perez, M. Perspectives of Engineered Biochar for Environmental Applications: A Review. Energy Fuels 2022, 36, 7940–7986. [Google Scholar] [CrossRef]
- Gęca, M.; Khalil, A.M.; Tang, M.; Bhakta, A.K.; Snoussi, Y.; Nowicki, P.; Wiśniewska, M.; Chehimi, M.M. Surface Treatment of Biochar—Methods, Surface Analysis and Potential Applications: A Comprehensive Review. Surfaces 2023, 6, 179–213. [Google Scholar] [CrossRef]
- Wang, W.; Zhu, Q.; Huang, R.; Hu, Y. Adsorption of nitrate in water by CTAB-modified MgFe layered double hydroxide composite biochar at low temperature: Adsorption characteristics and mechanisms. J. Environ. Chem. Eng. 2023, 11, 109090. [Google Scholar] [CrossRef]
- Haghighi Mood, S.; Ayiania, M.; Cao, H.; Marin-Flores, O.; Milan, Y.J.; Garcia-Perez, M. Nitrogen and magnesium Co-doped biochar for phosphate adsorption. Biomass Convers. Biorefinery 2021, 14, 5923–5942. [Google Scholar] [CrossRef]
- Quinn, K.; Mood, S.H.; Cervantes, E.; Perez, M.G.; Abu-Lail, N.I. Forces Governing the Transport of Pathogenic and Nonpathogenic Escherichia coli in Nitrogen and Magnesium Doped Biochar Amended Sand Columns. Microbiol. Res. 2023, 14, 218–228. [Google Scholar] [CrossRef]
- Yin, Q.; Zhang, B.; Wang, R.; Zhao, Z. Biochar as an adsorbent for inorganic nitrogen and phosphorus removal from water: A review. Environ. Sci. Pollut. Res. 2017, 24, 26297–26309. [Google Scholar] [CrossRef]
- Haghighi Mood, S.; Mainalis, K.; Pelaez-Samaniego, M.R.; Garcia-Perez, M. Characteristics of biochar Micro- and nano-chemical properties and interactions. In Biochar for Environmental Management, 3rd ed.; Lehmann, J., Joseph, S., Eds.; Routledge: London, UK, 2024; p. 25. [Google Scholar]
- Saha, D.; Thorpe, R.; Van Bramer, S.E.; Alexander, N.; Hensley, D.K.; Orkoulas, G.; Chen, J. Synthesis of Nitrogen and Sulfur Codoped Nanoporous Carbons from Algae: Role in CO2 Separation. ACS Omega 2018, 3, 18592–18602. [Google Scholar] [CrossRef]
- Boehm, H.P. Some aspects of the surface chemistry of carbon blacks and other carbons. Carbon 1994, 32, 759–769. [Google Scholar] [CrossRef]
- Lawrinenko, M.; Laird, D.A. Anion exchange capacity of biochar. Green Chem. 2015, 17, 4628–4636. [Google Scholar] [CrossRef]
- Mood, S.H.; Ayiania, M.; Jefferson-Milan, Y.; Garcia-Perez, M. Nitrogen doped char from anaerobically digested fiber for phosphate removal in aqueous solutions. Chemosphere 2020, 240, 124889. [Google Scholar] [CrossRef]
- Mainali, K.; Mood, S.H.; Pelaez-Samaniego, M.R.; Sierra-Jimenez, V.; Garcia-Perez, M. Production and applications of N-doped carbons from bioresources: A review. Catal. Today 2023, 423, 114248. [Google Scholar] [CrossRef]
- Ding, D.; Yang, S.; Qian, X.; Chen, L.; Cai, T. Nitrogen-doping positively whilst sulfur-doping negatively affect the catalytic activity of biochar for the degradation of organic contaminant. Appl. Catal. B Environ. 2020, 263, 118348. [Google Scholar] [CrossRef]
- Yoo, P.; Amano, Y.; Machida, M. Adsorption of nitrate onto nitrogen-doped activated carbon fibers prepared by chemical vapor deposition. Korean J. Chem. Eng. 2018, 35, 2468–2473. [Google Scholar] [CrossRef]
- Iida, T.; Amano, Y.; Machida, M.; Imazeki, F. Effect of surface property of activated carbon on adsorption of nitrate ion. Chem. Pharm. Bull. 2013, 61, 1173–1177. [Google Scholar] [CrossRef]
- Jellali, S.; El-Bassi, L.; Charabi, Y.; Usman, M.; Khiari, B.; Al-Wardy, M.; Jeguirim, M. Recent advancements on biochars enrichment with ammonium and nitrates from wastewaters: A critical review on benefits for environment and agriculture. J. Environ. Manag. 2022, 305, 114368. [Google Scholar] [CrossRef]
- Long, L.; Xue, Y.; Hu, X.; Zhu, Y. Study on the influence of surface potential on the nitrate adsorption capacity of metal modified biochar. Environ. Sci. Pollut. Res. 2019, 26, 3065–3074. [Google Scholar] [CrossRef]
- Min, L.; Zhongsheng, Z.; Zhe, L.; Haitao, W. Removal of nitrogen and phosphorus pollutants from water by FeCl3- impregnated biochar. Ecol. Eng. 2020, 149, 105792. [Google Scholar] [CrossRef]
- Ahmad, M.; Ahmad, M.; Usman, A.R.A.; Al-Faraj, A.S.; Abduljabbar, A.S.; Al-Wabel, M.I. Biochar composites with nano zerovalent iron and eggshell powder for nitrate removal from aqueous solution with coexisting chloride ions. Environ. Sci. Pollut. Res. 2018, 25, 25757–25771. [Google Scholar] [CrossRef]
- Bombuwala Dewage, N.; Liyanage, A.S.; Pittman, C.U.; Mohan, D.; Mlsna, T. Fast nitrate and fluoride adsorption and magnetic separation from water on α-Fe2O3 and Fe3O4 dispersed on Douglas fir biochar. Bioresour. Technol. 2018, 263, 258–265. [Google Scholar] [CrossRef]
- Dubinin, M.M.; Zaverina, E.D.; Radushkevich, L.V. Sorption and structure of active carbons. I. Adsorption of organic vapors. Zhurnal Fiz. Khimii 1947, 21, 1351–1362. [Google Scholar]
- Dubinin, M.M.; Radushkevich, L. Equation of the characteristic curve of activated charcoal. Chem. Zentr. 1947, 1, 875. [Google Scholar]
- Ayiania, M.; Garcia, A.; Haghighi Mood, S.; McEwen, J.-S.; Garcia-Perez, M. Novel Amorphous Carbons for the Adsorption of Phosphate: Part I. Elucidation of Chemical Structure of N-Metal-Doped Chars. ACS Omega 2022, 7, 14490–14504. [Google Scholar] [CrossRef]
- Hach. Chromotropic Acid Method, Method 10020; Hach: Ames, IA, USA, 2015. [Google Scholar]
- Li, D.-C.; Ding, J.-W.; Qian, T.-T.; Zhang, S.; Jiang, H. Preparation of high adsorption performance and stable biochar granules by FeCl3-catalyzed fast pyrolysis. RSC Adv. 2016, 6, 12226–12234. [Google Scholar] [CrossRef]
- Wan, Z.; Sun, Y.; Tsang, D.C.W.; Khan, E.; Yip, A.C.K.; Ng, Y.H.; Rinklebe, J.; Ok, Y.S. Customised fabrication of nitrogen-doped biochar for environmental and energy applications. Chem. Eng. J. 2020, 401, 126136. [Google Scholar] [CrossRef]
- Luo, W.; Wang, B.; Heron, C.G.; Allen, M.J.; Morre, J.; Maier, C.S.; Stickle, W.F.; Ji, X. Pyrolysis of Cellulose under Ammonia Leads to Nitrogen-Doped Nanoporous Carbon Generated through Methane Formation. Nano Lett. 2014, 14, 2225–2229. [Google Scholar] [CrossRef]
- Khan, Z.H.; Gao, M.; Qiu, W.; Islam, M.S.; Song, Z. Mechanisms for cadmium adsorption by magnetic biochar composites in an aqueous solution. Chemosphere 2020, 246, 125701. [Google Scholar] [CrossRef]
- Yang, J.; Zhao, Y.; Ma, S.; Zhu, B.; Zhang, J.; Zheng, C. Mercury Removal by Magnetic Biochar Derived from Simultaneous Activation and Magnetization of Sawdust. Environ. Sci. Technol. 2016, 50, 12040–12047. [Google Scholar] [CrossRef]
- Zhao, J.; Xu, H.; Tang, D.; Mathews, J.P.; Li, S.; Tao, S. A comparative evaluation of coal specific surface area by CO2 and N2 adsorption and its influence on CH4 adsorption capacity at different pore sizes. Fuel 2016, 183, 420–431. [Google Scholar] [CrossRef]
- Jagiello, J.; Ania, C.; Parra, J.B.; Cook, C. Dual gas analysis of microporous carbons using 2D-NLDFT heterogeneous surface model and combined adsorption data of N2 and CO2. Carbon 2015, 91, 330–337. [Google Scholar] [CrossRef]
- Wang, Y.; Guo, W.; Chen, W.; Xu, G.; Zhu, G.; Xie, G.; Xu, L.; Dong, C.; Gao, S.; Chen, Y.; et al. Co-production of porous N-doped biochar and hydrogen-rich gas production from simultaneous pyrolysis-activation-nitrogen doping of biomass: Synergistic mechanism of KOH and NH3. Renew. Energy 2024, 229, 120777. [Google Scholar] [CrossRef]
- Li, D.; Chen, W.; Wu, J.; Jia, C.Q.; Jiang, X. The preparation of waste biomass-derived N-doped carbons and their application in acid gas removal: Focus on N functional groups. J. Mater. Chem. A 2020, 8, 24977–24995. [Google Scholar] [CrossRef]
- Wang, X.J.; Wang, Y.; Wang, X.; Liu, M.; Xia, S.Q.; Yin, D.Q.; Zhang, Y.L.; Zhao, J.F. Microwave-assisted preparation of bamboo charcoal-based iron-containing adsorbents for Cr(VI) removal. Chem. Eng. J. 2011, 174, 326–332. [Google Scholar] [CrossRef]
- Zhu, J.; Gu, H.; Guo, J.; Chen, M.; Wei, H.; Luo, Z.; Colorado, H.A.; Yerra, N.; Ding, D.; Ho, T.C.; et al. Mesoporous magnetic carbon nanocomposite fabrics for highly efficient Cr(vi) removal. J. Mater. Chem. A 2014, 2, 2256–2265. [Google Scholar] [CrossRef]
- Toncón-Leal, C.F.; Villarroel-Rocha, J.; Silva, M.T.P.; Braga, T.P.; Sapag, K. Characterization of mesoporous region by the scanning of the hysteresis loop in adsorption–desorption isotherms. Adsorption 2021, 27, 1109–1122. [Google Scholar] [CrossRef]
- Bi, F.; Feng, X.; Zhou, Z.; Zhang, Y.; Wei, J.; Yuan, L.; Liu, B.; Huang, Y.; Zhang, X. Mn-based catalysts derived from the non-thermal treatment of Mn-MIL-100 to enhance its water-resistance for toluene oxidation: Mechanism study. Chem. Eng. J. 2024, 485, 149776. [Google Scholar] [CrossRef]
- Feng, C.; Chen, C.; Wang, J.; Li, S.; Liu, F.; Pan, Y.; Lu, Y.; Liu, Y.; Li, X.; Liu, Y.; et al. Insights into the synergistic effect and catalytic mechanism in MnCeOx solid solution catalysts for low-temperature propane total oxidation. Surf. Interfaces 2024, 46, 104011. [Google Scholar] [CrossRef]
- Schneider, P. Adsorption isotherms of microporous-mesoporous solids revisited. Appl. Catal. A Gen. 1995, 129, 157–165. [Google Scholar] [CrossRef]
- Jiang, S.; Yan, L.; Wang, R.; Li, G.; Rao, P.; Ju, M.; Jian, L.; Guo, X.; Che, L. Recyclable nitrogen-doped biochar via low-temperature pyrolysis for enhanced lead(II) removal. Chemosphere 2022, 286, 131666. [Google Scholar] [CrossRef]
- Oh, W.-D.; Veksha, A.; Chen, X.; Adnan, R.; Lim, J.-W.; Leong, K.-H.; Lim, T.-T. Catalytically active nitrogen-doped porous carbon derived from biowastes for organics removal via peroxymonosulfate activation. Chem. Eng. J. 2019, 374, 947–957. [Google Scholar] [CrossRef]
- Alsewailem, F.D. Modified Correlations for Adsorption Isotherms. J. Chem. Eng. Data 2015, 60, 762–765. [Google Scholar] [CrossRef]
- Latour, R.A. The Langmuir isotherm: A commonly applied but misleading approach for the analysis of protein adsorption behavior. J. Biomed. Mater. Res. Part A 2015, 103, 949–958. [Google Scholar] [CrossRef]
- Ghosal, P.S.; Gupta, A.K. Development of a generalized adsorption isotherm model at solid-liquid interface: A novel approach. J. Mol. Liq. 2017, 240, 21–24. [Google Scholar] [CrossRef]
- Umpleby, R.J.; Baxter, S.C.; Chen, Y.; Shah, R.N.; Shimizu, K.D. Characterization of Molecularly Imprinted Polymers with the Langmuir−Freundlich Isotherm. Anal. Chem. 2001, 73, 4584–4591. [Google Scholar] [CrossRef] [PubMed]
- Saadi, R.; Saadi, Z.; Fazaeli, R.; Fard, N.E. Monolayer and multilayer adsorption isotherm models for sorption from aqueous media. Korean J. Chem. Eng. 2015, 32, 787–799. [Google Scholar] [CrossRef]
- Foo, K.Y.; Hameed, B.H. Insights into the modeling of adsorption isotherm systems. Chem. Eng. J. 2010, 156, 2–10. [Google Scholar] [CrossRef]
- Khoshkalam, E.; Fotovat, A.; Halajnia, A.; Kazemian, H.; Eshghi, H. Nitrate adsorption using green iron oxide nanoparticles synthesized by Eucalyptus leaf extracts: Kinetics and effects of pH, KCl salt, and anions competition. J. Mol. Liq. 2023, 375, 121366. [Google Scholar] [CrossRef]
- Liu, J.; Jiang, J.; Meng, Y.; Aihemaiti, A.; Xu, Y.; Xiang, H.; Gao, Y.; Chen, X. Preparation, environmental application and prospect of biochar-supported metal nanoparticles: A review. J. Hazard. Mater. 2020, 388, 122026. [Google Scholar] [CrossRef]
- Li, R.; Wang, J.J.; Zhou, B.; Awasthi, M.K.; Ali, A.; Zhang, Z.; Gaston, L.A.; Lahori, A.H.; Mahar, A. Enhancing phosphate adsorption by Mg/Al layered double hydroxide functionalized biochar with different Mg/Al ratios. Sci. Total Environ. 2016, 559, 121–129. [Google Scholar] [CrossRef] [PubMed]
- Li, W.; Pierre-Louis, A.-M.; Kwon, K.D.; Kubicki, J.D.; Strongin, D.R.; Phillips, B.L. Molecular level investigations of phosphate sorption on corundum (α-Al2O3) by 31P solid state NMR, ATR-FTIR and quantum chemical calculation. Geochim. Cosmochim. Acta 2013, 107, 252–266. [Google Scholar] [CrossRef]
- Petrovic, B.; Gorbounov, M.; Masoudi Soltani, S. Impact of Surface Functional Groups and Their Introduction Methods on the Mechanisms of CO2 Adsorption on Porous Carbonaceous Adsorbents. Carbon Capture Sci. Technol. 2022, 3, 100045. [Google Scholar] [CrossRef]
- Mei, Y.; Xu, J.; Zhang, Y.; Li, B.; Fan, S.; Xu, H. Effect of Fe–N modification on the properties of biochars and their adsorption behavior on tetracycline removal from aqueous solution. Bioresour. Technol. 2021, 325, 124732. [Google Scholar] [CrossRef]
- Yan, X.-H.; Xu, B.-Q. Mesoporous carbon material co-doped with nitrogen and iron (Fe–N–C): High-performance cathode catalyst for oxygen reduction reaction in alkaline electrolyte. J. Mater. Chem. A 2014, 2, 8617–8622. [Google Scholar] [CrossRef]
- Mian, M.M.; Liu, G.; Yousaf, B.; Fu, B.; Ullah, H.; Ali, M.U.; Abbas, Q.; Mujtaba Munir, M.A.; Ruijia, L. Simultaneous functionalization and magnetization of biochar via NH3 ambiance pyrolysis for efficient removal of Cr (VI). Chemosphere 2018, 208, 712–721. [Google Scholar] [CrossRef] [PubMed]
- Alkurdi, S.S.A.; Herath, I.; Bundschuh, J.; Al-Juboori, R.A.; Vithanage, M.; Mohan, D. Biochar versus bone char for a sustainable inorganic arsenic mitigation in water: What needs to be done in future research? Environ. Int. 2019, 127, 52–69. [Google Scholar] [CrossRef]
- Wang, Z.; Guo, H.; Shen, F.; Yang, G.; Zhang, Y.; Zeng, Y.; Wang, L.; Xiao, H.; Deng, S. Biochar produced from oak sawdust by Lanthanum (La)-involved pyrolysis for adsorption of ammonium (NH4+), nitrate (NO3−), and phosphate (PO43−). Chemosphere 2015, 119, 646–653. [Google Scholar] [CrossRef]
- Zhao, H.; Xue, Y.; Long, L.; Hu, X. Adsorption of nitrate onto biochar derived from agricultural residuals. Water Sci. Technol. 2017, 77, 548–554. [Google Scholar] [CrossRef] [PubMed]
- Viglašová, E.; Galamboš, M.; Danková, Z.; Krivosudský, L.; Lengauer, C.L.; Hood-Nowotny, R.; Soja, G.; Rompel, A.; Matík, M.; Briančin, J. Production, characterization and adsorption studies of bamboo-based biochar/montmorillonite composite for nitrate removal. Waste Manag. 2018, 79, 385–394. [Google Scholar] [CrossRef]
- Vijayaraghavan, K.; Balasubramanian, R. Application of pinewood waste-derived biochar for the removal of nitrate and phosphate from single and binary solutions. Chemosphere 2021, 278, 130361. [Google Scholar] [CrossRef]


| Factors | Codes | Coded Factors’ Level | ||
|---|---|---|---|---|
| Low (−1) | Center (0) | High (+1) | ||
| Pyrolysis temperature (°C) | A | 600 | 700 | 800 |
| Pyrolysis time (min) | B | 30 | 60 | 90 |
| Metal loading * (g/per 15 g of DF) | C | 2 | 4 | 6 |
| Sample | Volatile Matter | Fixed Carbon | Ash |
|---|---|---|---|
| DF biochar | 7.23 ± 0.18 | 92.23 ± 0.65 | 0.53 ± 0.47 |
| N-DF biochar | 7.06 ± 0.21 | 92.7 ± 0.25 | 0.24 ± 0.04 |
| Fe-DF biochar | 8.07 ± 0.02 | 89.01 ± 1.08 | 2.92 ± 0.07 |
| Fe-N-DF biochar | 13.40 ± 0.47 | 83.24 ± 0.62 | 3.37 ± 0.01 |
| Sample | C | H | N | O * | C/O | C/N |
|---|---|---|---|---|---|---|
| DF biochar | 93.62 ± 0.2 | 0.51 ± 0.04 | 0.60 ± 0.05 | 4.74 | 19.77 | 156.07 |
| N-DF biochar | 80.09 ± 0.1 | 0.93 ± 0.03 | 6.65 ± 0.05 | 12.08 | 6.63 | 12.05 |
| Fe-DF biochar | 91.91 ± 3.3 | 0.6 ± 0.02 | 0.61 ± 0.1 | 3.96 | 23.18 | 151.21 |
| Fe-N-DF biochar | 80.73 ± 1.2 | 0.85 ± 0.05 | 8.03 ± 0.1 | 7.02 | 11.5 | 10.05 |
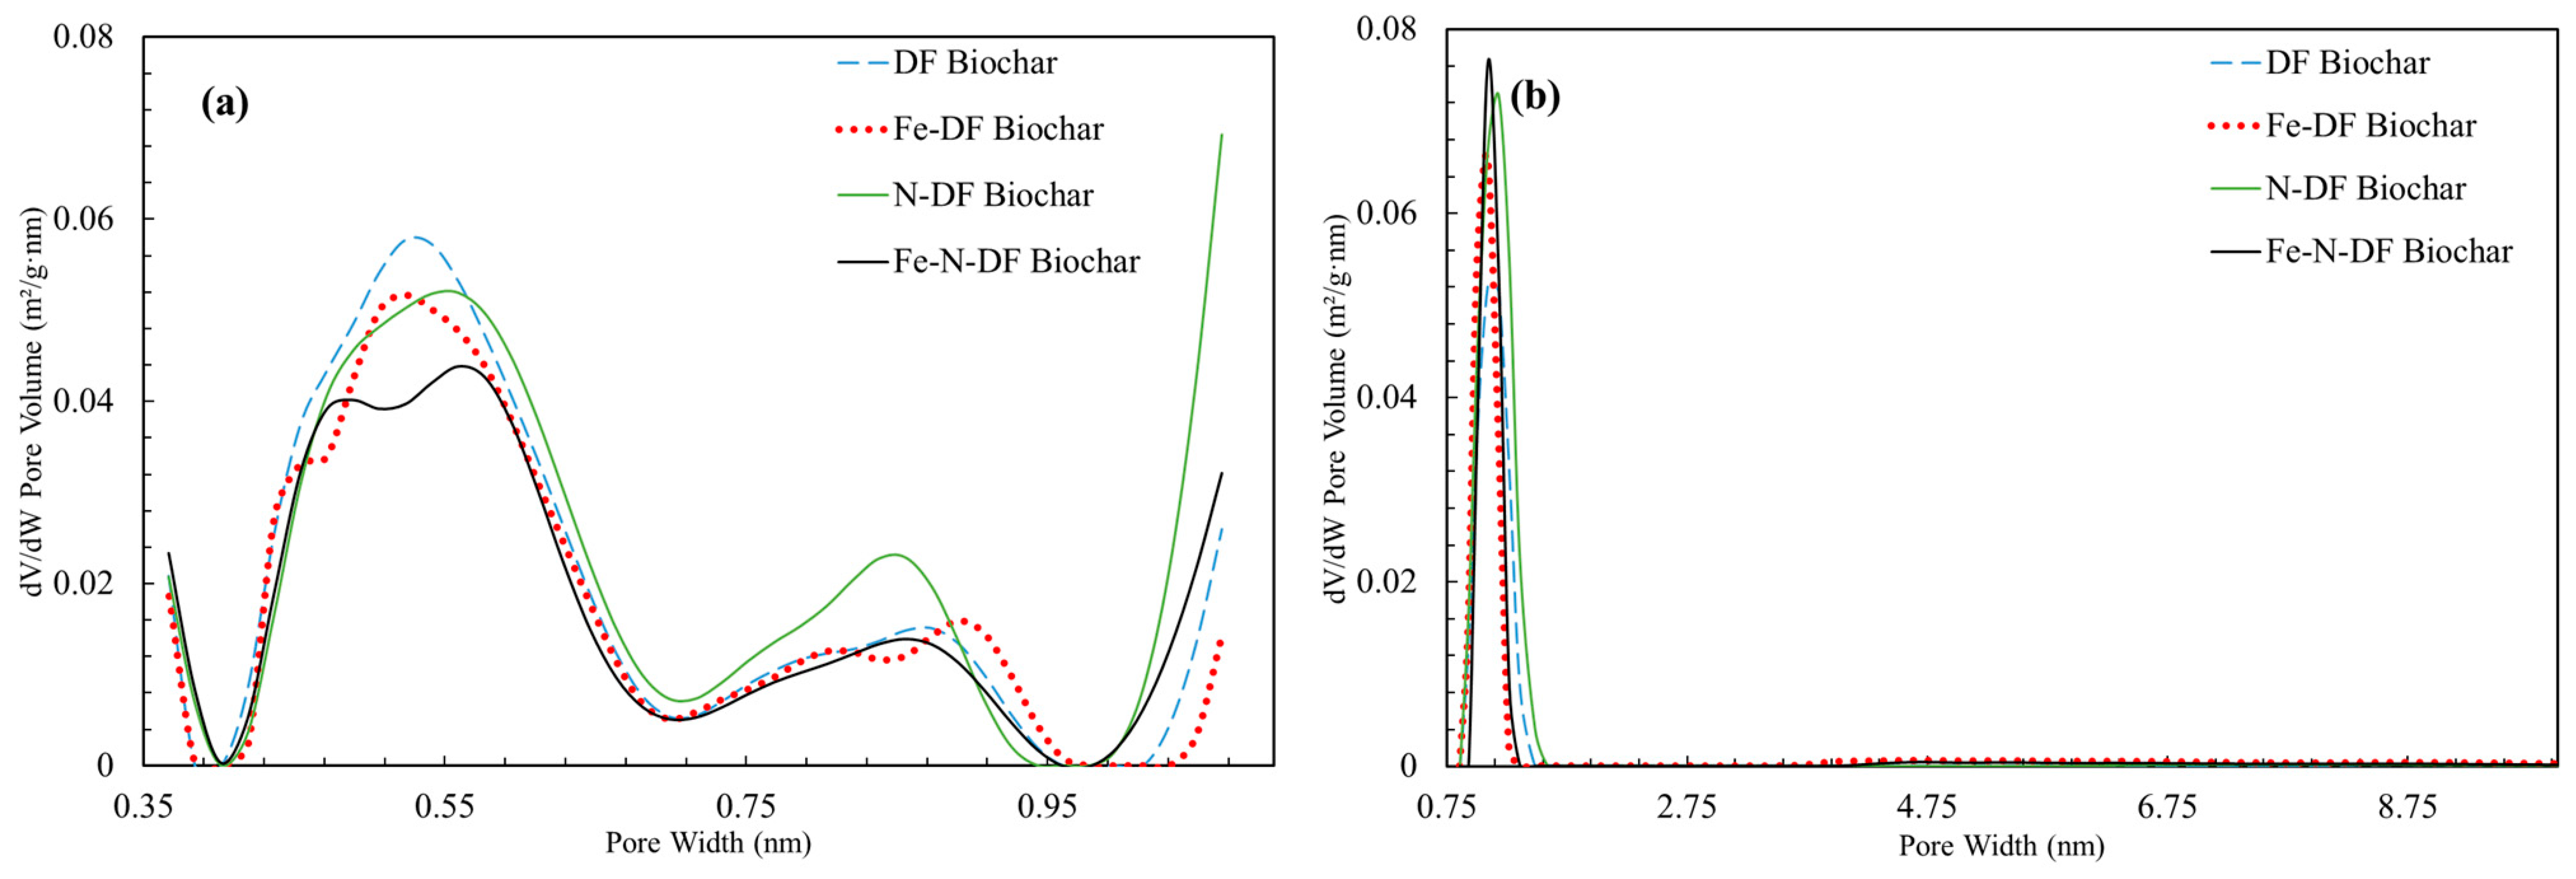
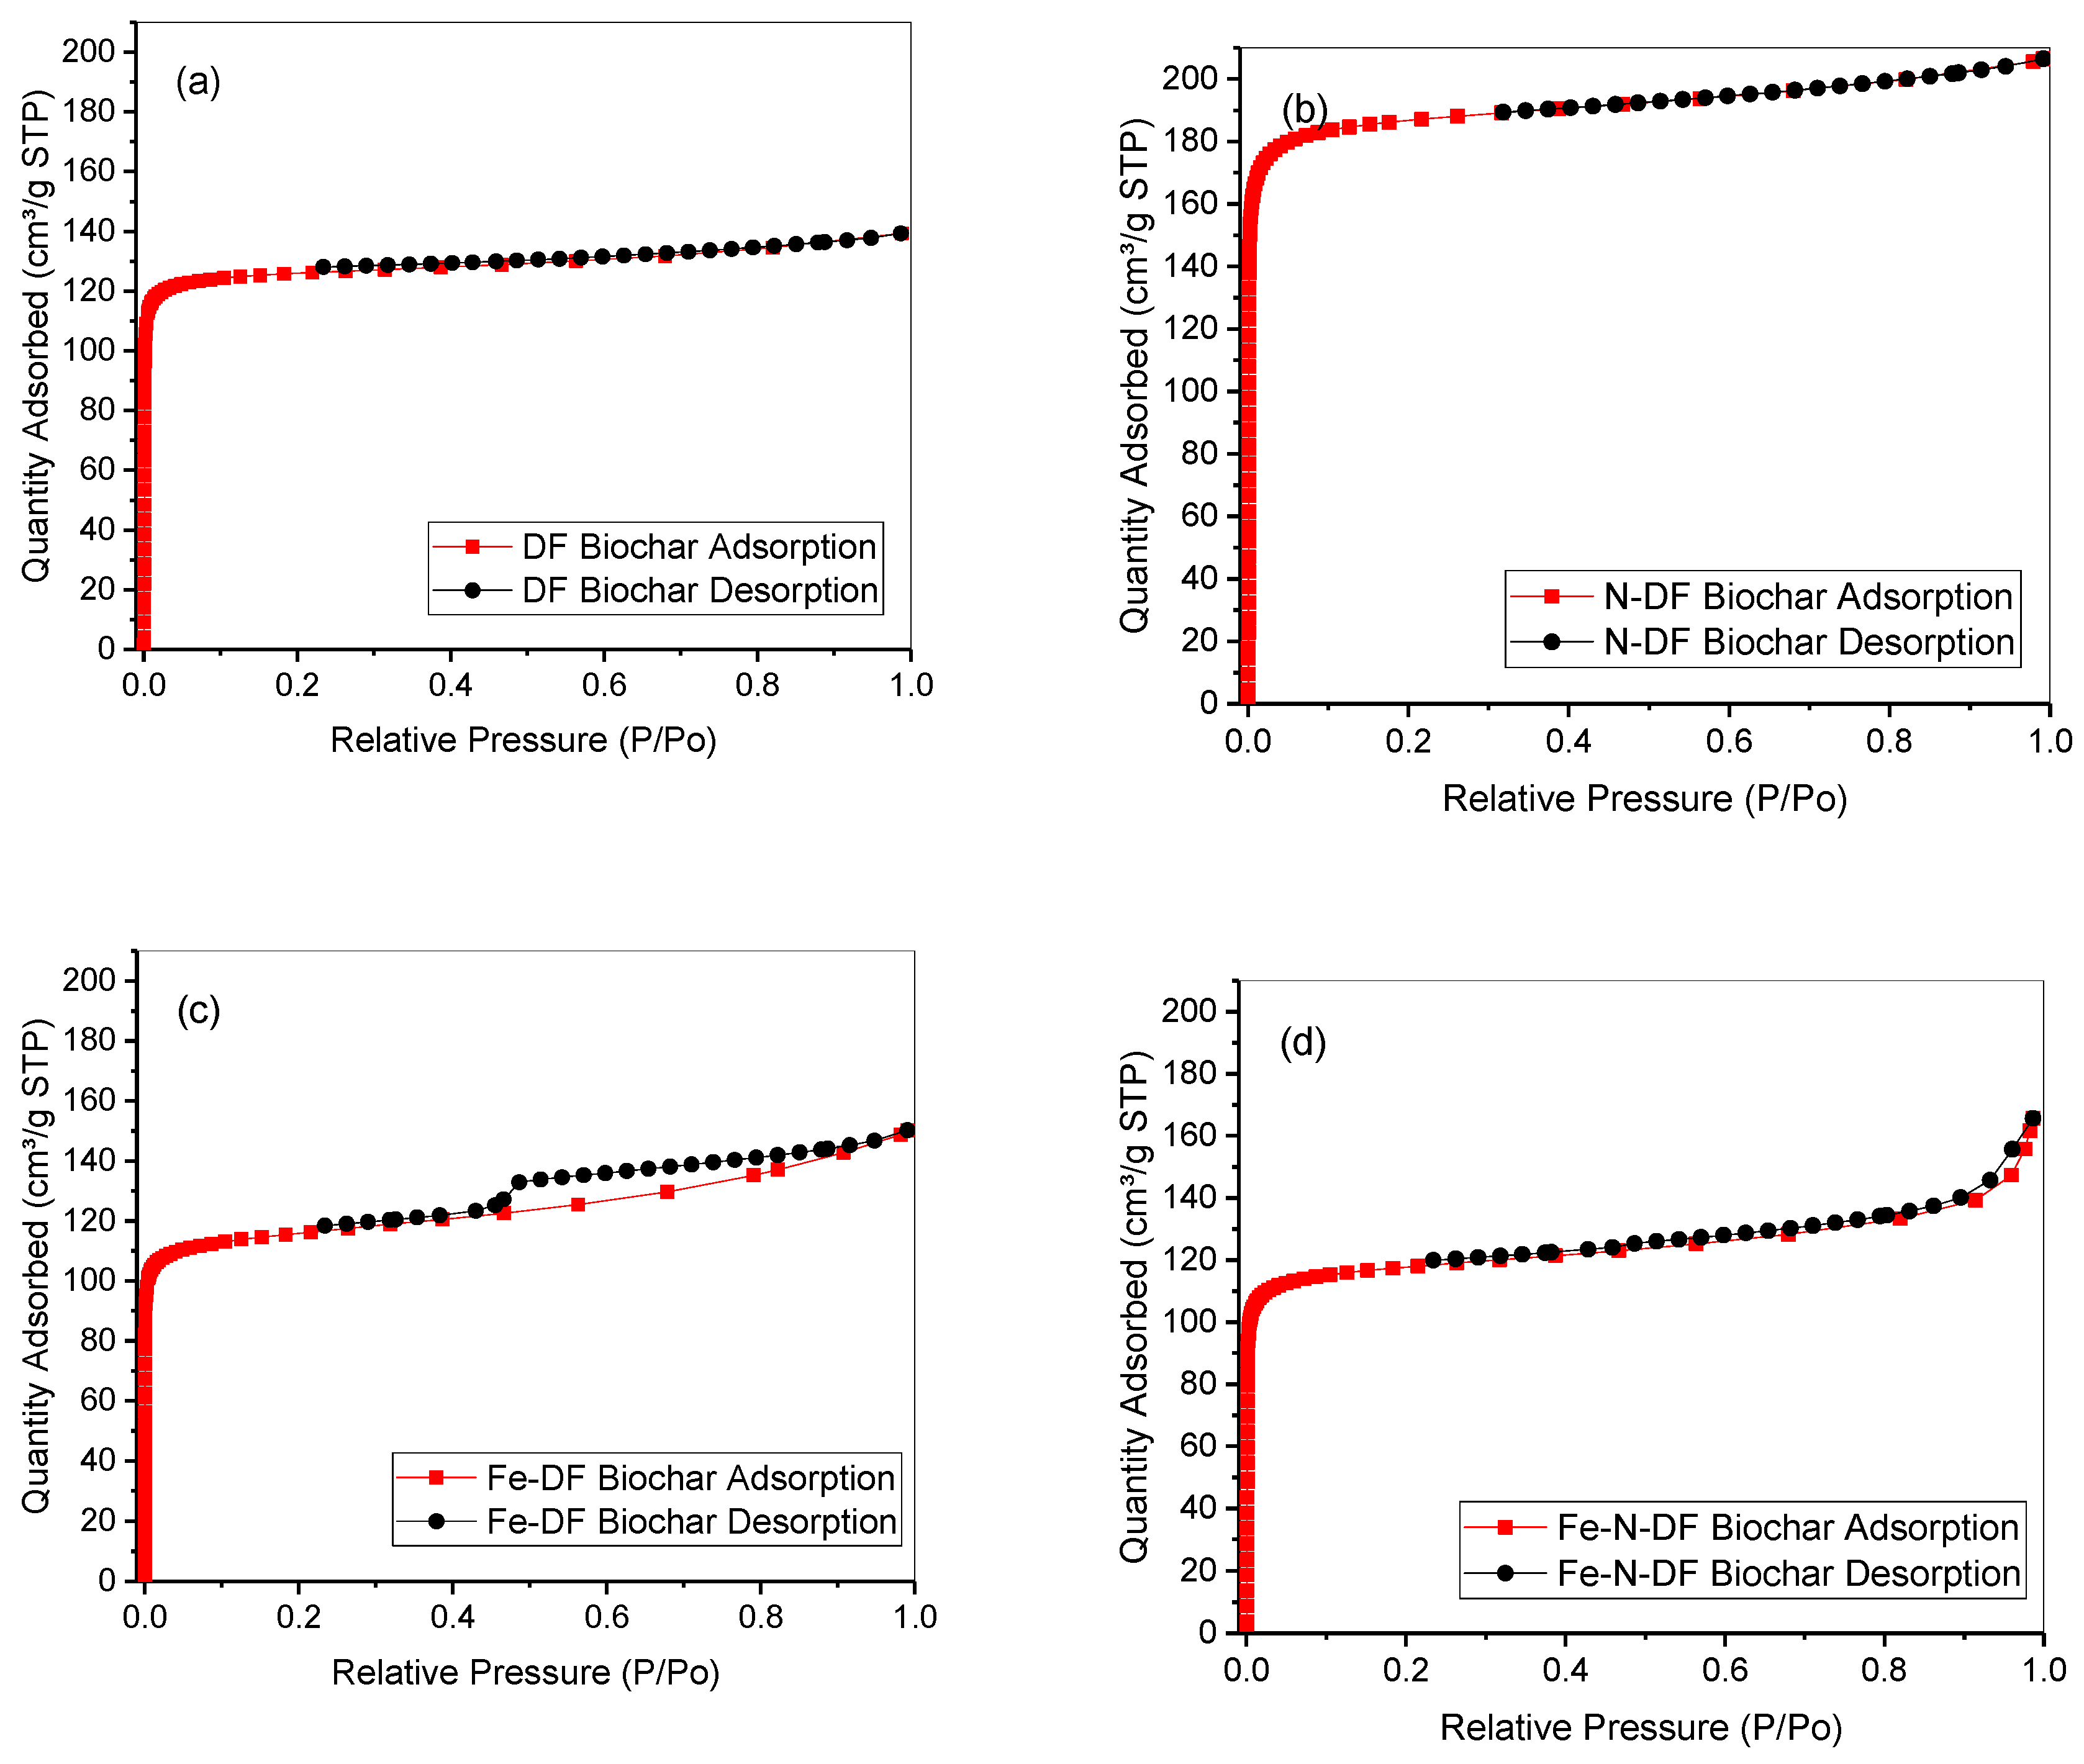
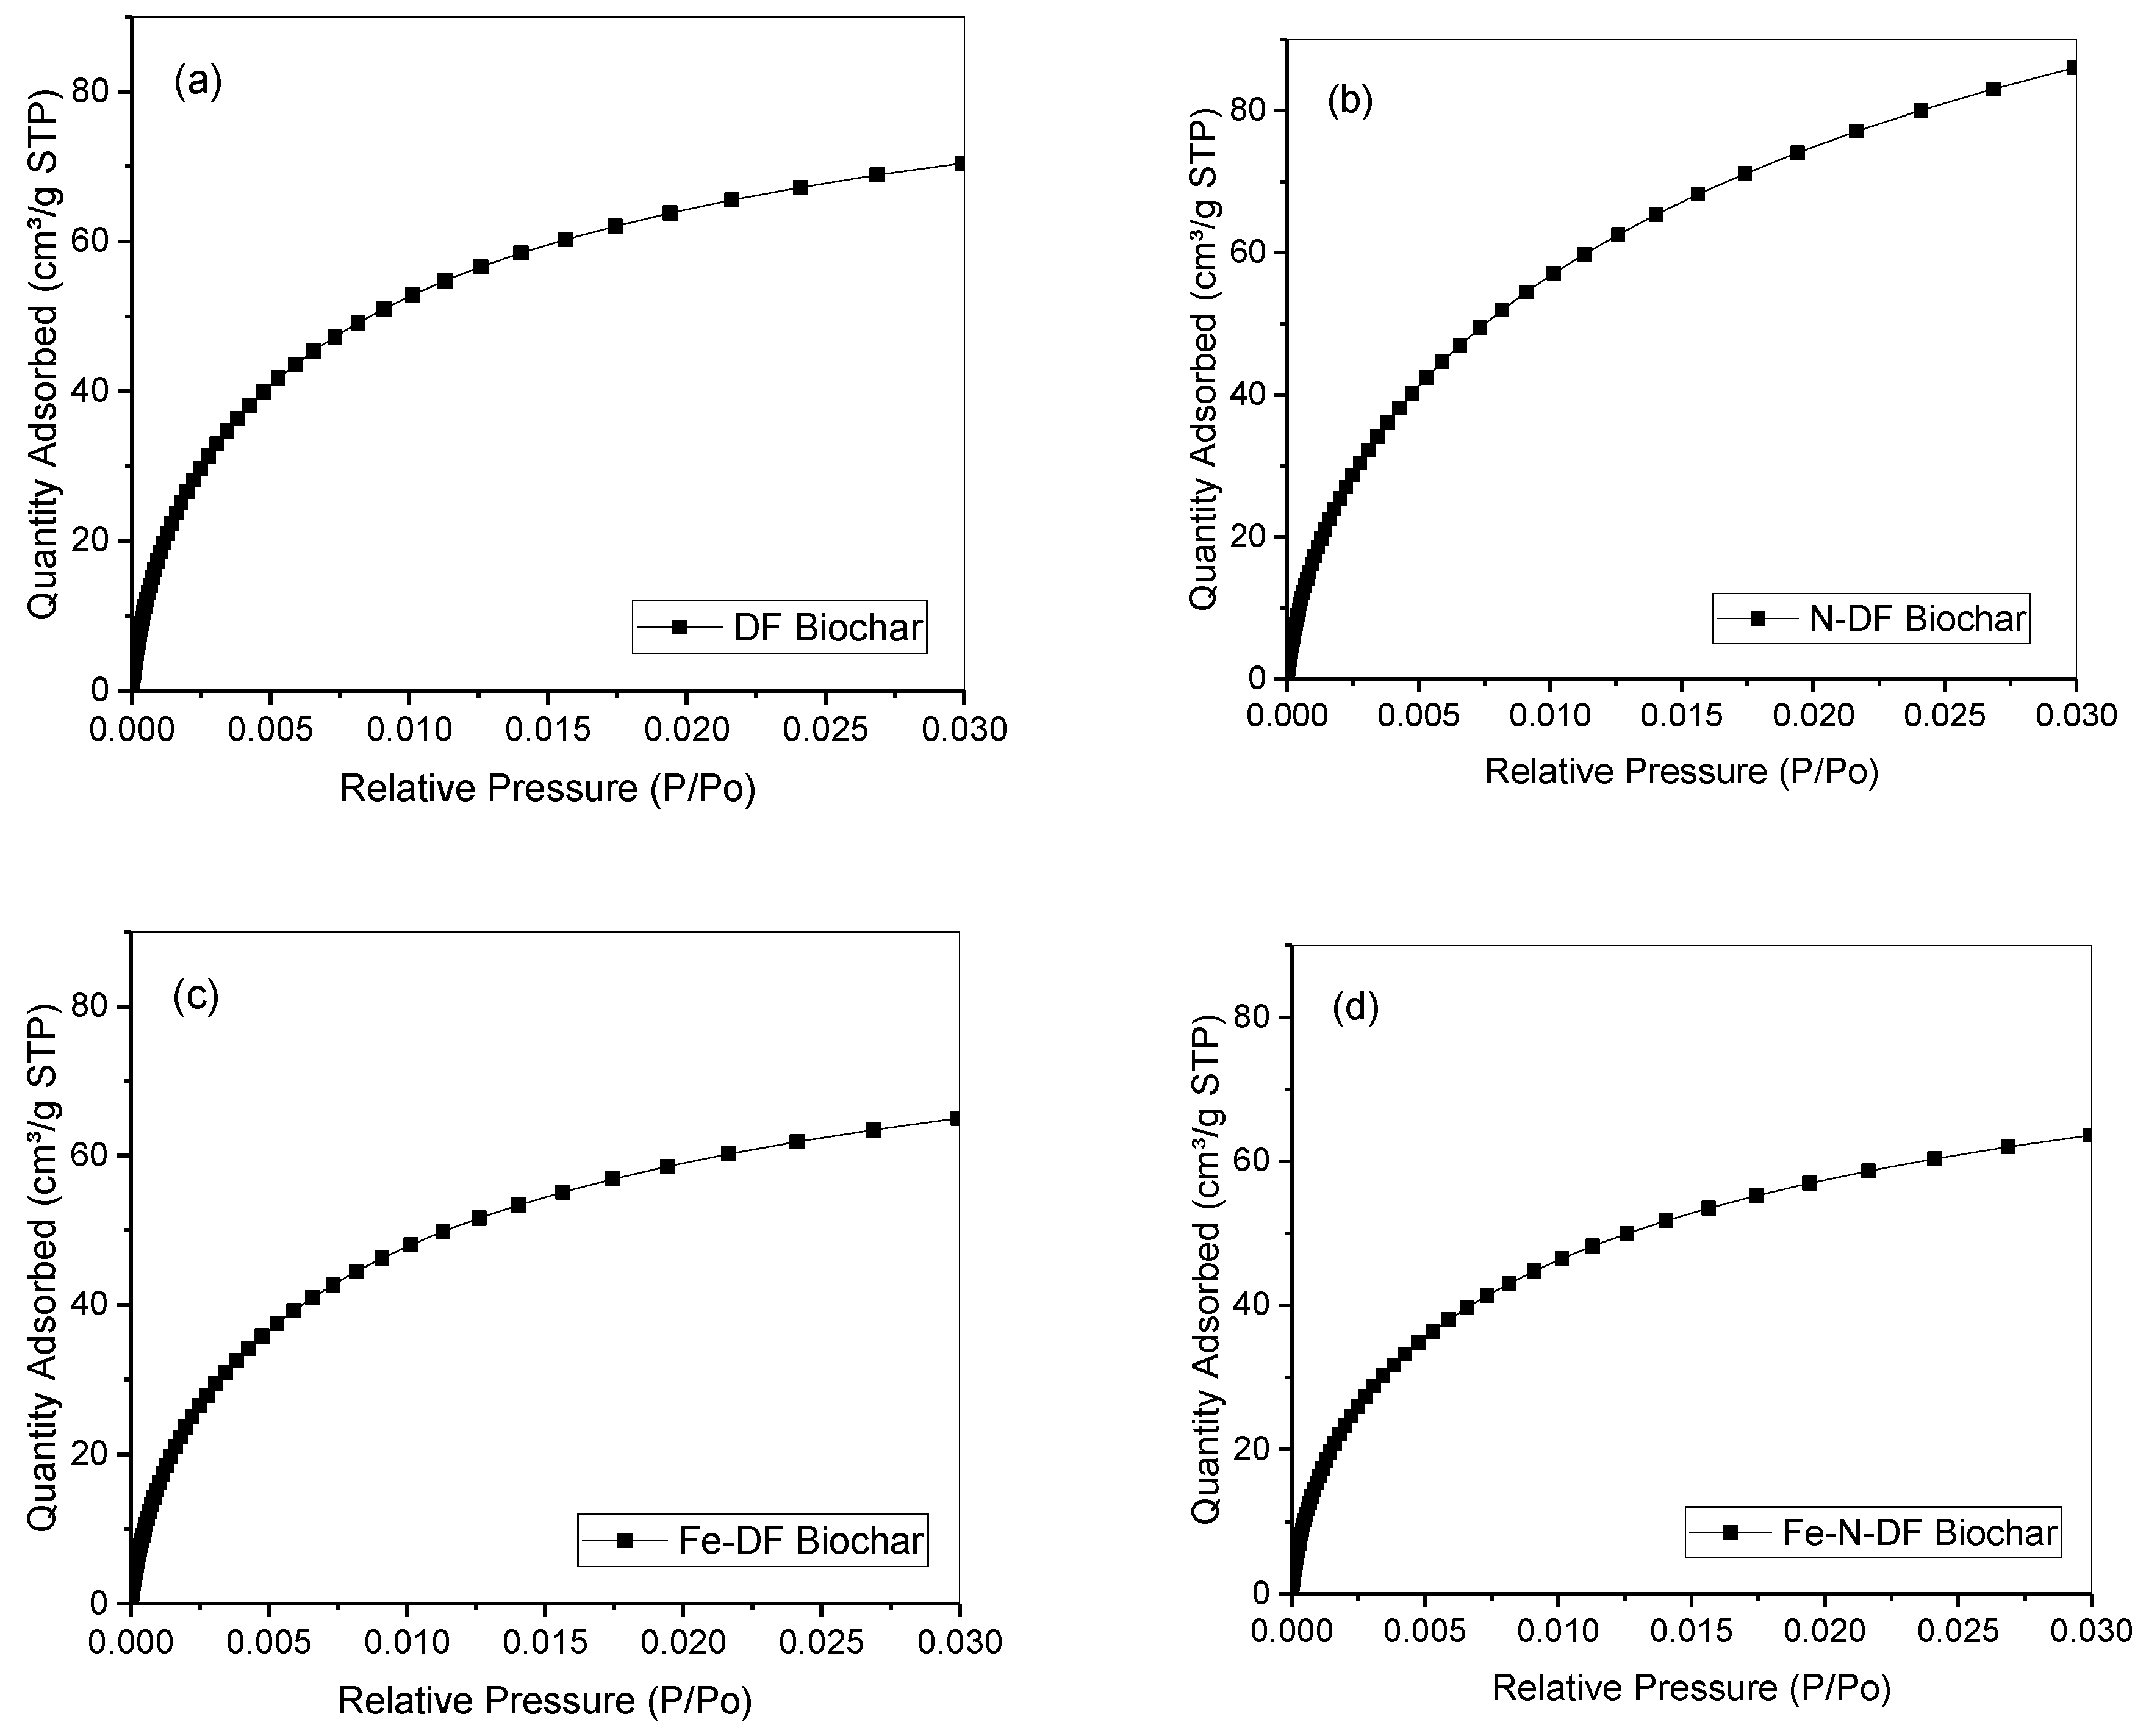
| Sample | SaN2 (m2 g−1) | SaCO2 (m2 g−1) | Micro Volume (cm3 g−1) |
|---|---|---|---|
| DF Biochar | 478 ± 9.8 | 533 | 0.21 |
| N-DF Biochar | 713 ± 14.6 | 694 | 0.28 |
| Fe-DF Biochar | 431 ± 5 | 494 | 0.20 |
| Fe-N-DF Biochar | 438 ± 4.1 | 477 | 0.19 |
| Biochar | pH | Langmuir | Freundlich | ||||||
| K (L mg−1) | Q (mg g−1) | R2 | K (mg(1−n) Ln g−1) | n | R2 | ||||
| DF | 3 | 0.28 | 17.0 | 0.98 | 6.06 | 0.23 | 0.86 | ||
| Fe-DF | 0.38 | 16.1 | 0.99 | 6.38 | 0.23 | 0.88 | |||
| N-DF | 0.40 | 18.9 | 0.97 | 7.26 | 0.24 | 0.87 | |||
| Fe-N-DF | 0.83 | 19.4 | 0.97 | 9.01 | 0.20 | 0.85 | |||
| DF | 7 | 0.12 | 4.8 | 0.88 | 1.47 | 0.25 | 0.81 | ||
| Fe-DF | 0.11 | 6.3 | 0.97 | 1.69 | 0.28 | 0.98 | |||
| N-DF | 0.15 | 8.7 | 0.90 | 2.47 | 0.28 | 0.95 | |||
| Fe-N-DF | 1.44 | 9.37 | 0.97 | 5.17 | 0.15 | 0.86 | |||
| DF | 8 | 0.09 | 3.5 | 0.88 | 0.94 | 0.27 | 0.87 | ||
| Fe-DF | 0.12 | 5.0 | 0.96 | 1.64 | 0.23 | 0.80 | |||
| N-DF | 0.39 | 6.3 | 0.83 | 2.94 | 0.18 | 0.90 | |||
| Fe-N-DF | 0.53 | 7.3 | 0.92 | 3.49 | 0.18 | 0.99 | |||
| Biochar | pH | Langmuir–Freundlich | Redlich–Peterson | ||||||
| K (Ln mg−n) | Q (mg g−1) | n | R2 | K (L g−1) | a (Ln mg−n) | n | R2 | ||
| DF | 3 | 0.23 | 16.1 | 1.3 | 0.99 | 4.37 | 0.22 | 1.04 | 0.98 |
| Fe-DF | 0.38 | 16.1 | 1.0 | 0.99 | 6.34 | 0.41 | 0.99 | 0.99 | |
| N-DF | 0.38 | 18.4 | 1.2 | 0.98 | 7.78 | 0.43 | 0.99 | 0.98 | |
| Fe-N-DF | 0.89 | 18.9 | 1.2 | 0.98 | 17.1 | 0.94 | 0.98 | 0.98 | |
| DF | 7 | 0.07 | 4.5 | 1.3 | 0.89 | 0.57 | 0.11 | 1.00 | 0.89 |
| Fe-DF | 0.15 | 8.4 | 0.6 | 0.99 | 1.28 | 0.41 | 0.84 | 0.99 | |
| N-DF | 0.13 | 19.4 | 0.4 | 0.95 | 4.13 | 1.22 | 0.79 | 0.96 | |
| Fe-N-DF | 1.09 | 9.8 | 0.7 | 0.98 | 14.83 | 1.73 | 0.98 | 0.97 | |
| DF | 8 | 0.14 | 4.1 | 0.7 | 0.90 | 0.44 | 0.21 | 0.90 | 0.89 |
| Fe-DF | 0.04 | 4.6 | 1.5 | 0.98 | 0.40 | 0.04 | 1.17 | 0.99 | |
| N-DF | 0.31 | 11.3 | 0.3 | 0.91 | 9.06 | 2.63 | 0.86 | 0.91 | |
| Fe-N-DF | 0.34 | 12.8 | 0.3 | 0.99 | 12.41 | 2.99 | 0.86 | 0.99 | |
| Feedstock | Treatment Method | Surface Area (m2 g−1) | pH of the Solution | Adsorption Capacity (mg.g−1) | References |
|---|---|---|---|---|---|
| Oak sawdust | Feedstock impregnated with LaCl2 | 23.08 | - | 8.7 | [81] |
| Oak sawdust | - | 24.94 | - | 2.81 | [81] |
| Sugarcane bagasse | Chemical modification using epichlorohydrin, N, N-dimethylformamide, ethylenediamine and trimethylamine | 41.67 | 4.64 | 28.21 | [17] |
| Corncob | - | - | - | 14.46 | [82] |
| Bamboo | - | 28 | 4 | 5 | [83] |
| Bamboo | Feedstock impregnated with Clay | 156 | 4 | 9 | [83] |
| Pinewood waste | - | 204.2 | 2 | 4.2 | [84] |
| Douglas fir | - | 478 | 7 | 4.8 | This study |
| Douglas fir | Ammonia treatment | 713 | 7 | 8.7 | This study |
| Douglas fir | Feedstock impregnated with FeCl3 | 431 | 7 | 6.3 | This study |
| Douglas fir | Feedstock was impregnated with FeCl3 and pyrolyzed under ammonia gas | 438 | 7 | 9.4 | This study |
| Douglas fir | Feedstock was impregnated with FeCl3 and pyrolyzed under ammonia gas | 438 | 3 | 20.67 | This study |
Disclaimer/Publisher’s Note: The statements, opinions and data contained in all publications are solely those of the individual author(s) and contributor(s) and not of MDPI and/or the editor(s). MDPI and/or the editor(s) disclaim responsibility for any injury to people or property resulting from any ideas, methods, instructions or products referred to in the content. |
© 2024 by the authors. Licensee MDPI, Basel, Switzerland. This article is an open access article distributed under the terms and conditions of the Creative Commons Attribution (CC BY) license (https://creativecommons.org/licenses/by/4.0/).
Share and Cite
Haghighi Mood, S.; Pelaez-Samaniego, M.R.; Han, Y.; Mainali, K.; Garcia-Perez, M. Iron- and Nitrogen-Modified Biochar for Nitrate Adsorption from Aqueous Solution. Sustainability 2024, 16, 5733. https://doi.org/10.3390/su16135733
Haghighi Mood S, Pelaez-Samaniego MR, Han Y, Mainali K, Garcia-Perez M. Iron- and Nitrogen-Modified Biochar for Nitrate Adsorption from Aqueous Solution. Sustainability. 2024; 16(13):5733. https://doi.org/10.3390/su16135733
Chicago/Turabian StyleHaghighi Mood, Sohrab, Manuel Raul Pelaez-Samaniego, Yinglei Han, Kalidas Mainali, and Manuel Garcia-Perez. 2024. "Iron- and Nitrogen-Modified Biochar for Nitrate Adsorption from Aqueous Solution" Sustainability 16, no. 13: 5733. https://doi.org/10.3390/su16135733