Article

Precision Farming Multimodal Technologies Using Optical Sensors for the Detection of Citrus Tristeza Virus Endemics

by
Athanasios V. Argyriou
1,2,
Nikolaos Tektonidis
1,
Evangelos Alevizos
3,
Konstantinos P. Ferentinos
4,
Nektarios N. Kourgialas
5,* and
Matthaios M. Mathioudakis
1,*
1
Plant Pathology Laboratory, Institute of Olive Tree, Subtropical Crops and Viticulture, ELGO-DIMITRA, Karamanlis Ave. 167, 73134 Chania, Greece
2
Laboratory of Geophysical-Satellite Remote Sensing and Archaeoenvironment, Institute for Mediterranean Studies, Foundation for Research and Technology-Hellas (FORTH), 74100 Rethymno, Greece
3
Institute des Substances et Organismes de la Mer (ISOMer), Nantes Universite, UR 2160, F-44000 Nantes, France
4
Department of Agricultural Engineering, Soil & Water Resources Institute, ELGO-DIMITRA, 61 Dimokratias Av., 13561 Athens, Greece
5
Water Recourses-Irrigation & Environmental Geoinformatics Laboratory, Institute of Olive Tree, Subtropical Crops and Viticulture, ELGO-DIMITRA, Karamanlis Ave. 167, 73134 Chania, Greece
*
Authors to whom correspondence should be addressed.
Sustainability 2024, 16(13), 5748; https://doi.org/10.3390/su16135748
Submission received: 17 April 2024 / Revised: 29 May 2024 / Accepted: 3 July 2024 / Published: 5 July 2024

Abstract

:
Citrus trees and their fruits have significant nutritional value and contain antioxidants that are important components of the Mediterranean diet. However, pathogenic diseases pose a threat to citriculture by reducing crop yield and quality. Therefore, there is a need for novel technologies to maintain healthy citrus crops and enable early and accurate detection of the related pathogens, such as the citrus tristeza virus (CTV). Remote sensing offers a non-destructive, cost effective and efficient method for assessing plant health dynamics. It can provide insights into chlorophyll content, water stress and disease presence. This study provides new insights by integrating a combination of remote sensing approaches (FCCs, NDVI, PCA), optical and proximal techniques with in situ field data collection as well as various serological/molecular technologies to detect CTV effectively and evaluate its temporal epidemiology pattern. In addition, the integration of the adopted techniques in case studies of known fields being infected by CTV provides the basis for remote sensing procedures, such as random forest machine learning algorithm, to become powerful in verifying and identifying new CTV-infected fields in a broader extent coverage area, reaching 89.7% accuracy assessment. Thus, it offers decision-makers a robust approach that contributes to CTV epidemiology monitoring and can aid in the development of effective and sustainable disease management strategies.

1. Introduction

Citrus species are one of the most important crops worldwide with an annual production of >140 million tons [1], and their fruits are particularly valued in the human food chain as a cornerstone of well-being and longevity due to their important role in the Mediterranean diet as a rich source for nutrients and antioxidants. However, citriculture is threatened by the occurrence of diseases, degrading the final product yield and quality, and increasing inputs [2]. Therefore, the application of management and prevention measures is necessary to sustain healthy crops and to develop new precise and reliable control strategies.
Like other crops, citrus is endangered by numerous pathogens, especially viruses, leading to serious damage to fruits and plant tissues. Citrus tristeza virus (CTV) is the causal agent of one of the most destructive citrus diseases, with an enormous economic impact worldwide [3,4]. CTV is a typical member of the genus Closterovirus (family Closteroviridae), with a single-stranded RNA of approximately 19.3 kb, consisting of 12 open reading frames [5], and depending on the virus genotype and the scion rootstock combination, CTV appears in three syndromes with variable severity and symptomatology: quick decline; stem pitting; and seedling yellows [4,6,7]. Up to date, 11 CTV genotypes have been officially reported, which may exist as a sole in a citrus plant, or they may occur together as a complex [8]. In Greece, citriculture accounted for more than 19 million trees in southern and northwestern country areas and is one of the three most important fruit crops, indicating its immense socioeconomic importance [9]. Except for the presence of various viruses and viroids [10,11,12,13], 20 years since the first report of the presence of CTV in oranges in Crete and Peloponnese (two of the main citrus-growing areas) [14], it is still considered a quarantine pathogen which led to the eradication of hundreds of trees to avoid the virus spread. Nowadays, CTV has gradually taken the form of endemics with a continuous emergence of new infection loci along with the invasion of new hosts, with the detection of three genotypes [15,16,17]. Annual surveys conducted during an ongoing multiannual governmental project to monitor and remove CTV-infected trees are not frequent enough to cover all the citrus-growing areas and thus prevent virus dispersal. In addition to biological indexing, various serological and molecular methodologies have been developed for the detection of CTV, such as ELISA, DIBA, electron and immunoelectron microscopy, RT-PCR and qPCR, RT-LAMP, IC-RT-LAMP, RT-RPA-LFICA [18]. Therefore, new technologies and methodologies nowadays need lower costs, time efficiency and accurate and early pathogen detection.
Plant health and pathogen in situ monitoring has become more and more effective through the years, but it is cost-intensive, time-consuming and often integrates subjective indicators [19]. Remote sensing is a powerful technology that can overcome certain limitations when assessing plant health with traditional methodologies. It is a non-destructive and effective method for gathering data regarding plant health across wide areas [20]. Remote sensing can offer useful insights into a variety of plant health indicators, such as chlorophyll content, water stress, nutritional deficiencies and disease presence, by evaluating the reflected or emitted radiation from plants [21,22]. As a result, agronomists and researchers can broadly and objectively monitor plant health conditions.
Remote sensing imageries, like multispectral and hyperspectral imaging, are widely used to collect spectral data from plants and obtain quantitative metrics of plant health indicators [23,24]. For example, vegetation indices like the Normalized Difference Vegetation Index (NDVI) can be measured to assess the overall vigor and greenness, which suggests vegetative health, with remotely sensed data [22]. Furthermore, remote sensing can provide prompt and efficient temporal and spatial information on plant health dynamics in a rapid and cost-effective manner covering large areas. By repeatedly monitoring the same area over time, researchers can track changes in plant health conditions and detect anomalies or stress patterns that may not be easily observed by traditional methods. This enables timely intervention and management decisions to be made, leading to improved crop yields and resource optimization. In addition, time scalability can be valuable in monitoring plant diseases. In recent studies, spectroscopy and remote sensing techniques in conjunction with field data collection have been applied for visual prediction and to monitor CTV but also other pathogens such as Candidatus Liberibacter spp. (Huanglongbing citrus disease; HLB), citrus decay, tobacco mosaic virus, Xylella fastidiosa and coconut cadang-cadang viroid [22,25,26,27,28,29,30,31,32,33]. Canopy defoliation, chlorosis and leaf wilting are some notable stages that suggest a disease impact that can be assessed on large-scale coverage from satellite imageries [34]. These characteristics are mainly related to vegetation stress and spatiotemporal changes detected by the satellite sensors. The application of vegetation indices, NDVI and Enhanced Vegetation Index (EVI), markers and time series have recently been applied to the evaluation of plant health and CTV epidemics by using remote sensing (e.g., MODIS satellite imageries) in Italy and Portugal [20,31]. Moreover, hyperspectral satellite imageries offer capabilities for the early detection of plant diseases through the detection of subtle changes in spectral reflectance of canopies or leaves, while recent studies report numerous machine learning algorithms to detect plant diseases with remarkable accuracies ranging from 60% to 95% [21]. In addition, Unmanned Autonomous Vehicles (UAVs) have been increasingly used to monitor crops, gather data and make better decisions about managing agricultural fields [35,36]. Particularly, crop monitoring is one of the major tasks that largely relies on multispectral UAV imagery. This is because UAVs with multispectral sensors provide an affordable tool for collecting centimeter-resolution imagery at frequent/on-demand time intervals depending on the growth stage of crops and the field conditions. In addition, multispectral sensors capture narrow-band images in the visible and infrared range which correspond to the wavelengths of satellite sensors, such as the Sentinel-2, allowing for inter-comparisons and data upscaling. Multispectral imagery has been routinely utilized for calculating various vegetation indices which serve as surrogates for assessing crop health, soil/water stress and nutrient deficiency [36].
Previous observations refer to the CTV presence in Crete and display its epidemiology in several infected locations [15,37]. In addition, the analysis of the retrieved annual data of sampling surveys at our laboratory for the detection of CTV in citrus orchard areas around the infected locations during multiannual monitoring suggests an ongoing spread of the disease and the need for detailed studies. The aim of the present work is the development of a methodological framework by using remote sensing, in conjunction with laboratory analyses, in order to achieve the detection of primary stages of CTV-infected trees and their temporal monitoring. The originality of this work lies in the fact that it offers, for the first time, an integrated management approach for the early and accurate detection of endemic CTV at the field level, through the combined use of satellite imagery analysis (FCCs, NDVI, PCA), optical and proximal techniques with in situ field data collection as well as various serological/molecular technologies, and its validation using UAV imagery. This verification process is a critical necessity for early visual identification of tree diseases such as CTV but is not always provided in publications, thus enhancing the applicability of remote sensing techniques as a valuable tool to procure a comprehensive assessment of CTV disease prevalence and progression over time.

2. Materials and Methods

2.1. Early Detection of Fields with CTV Using Remote Sensing

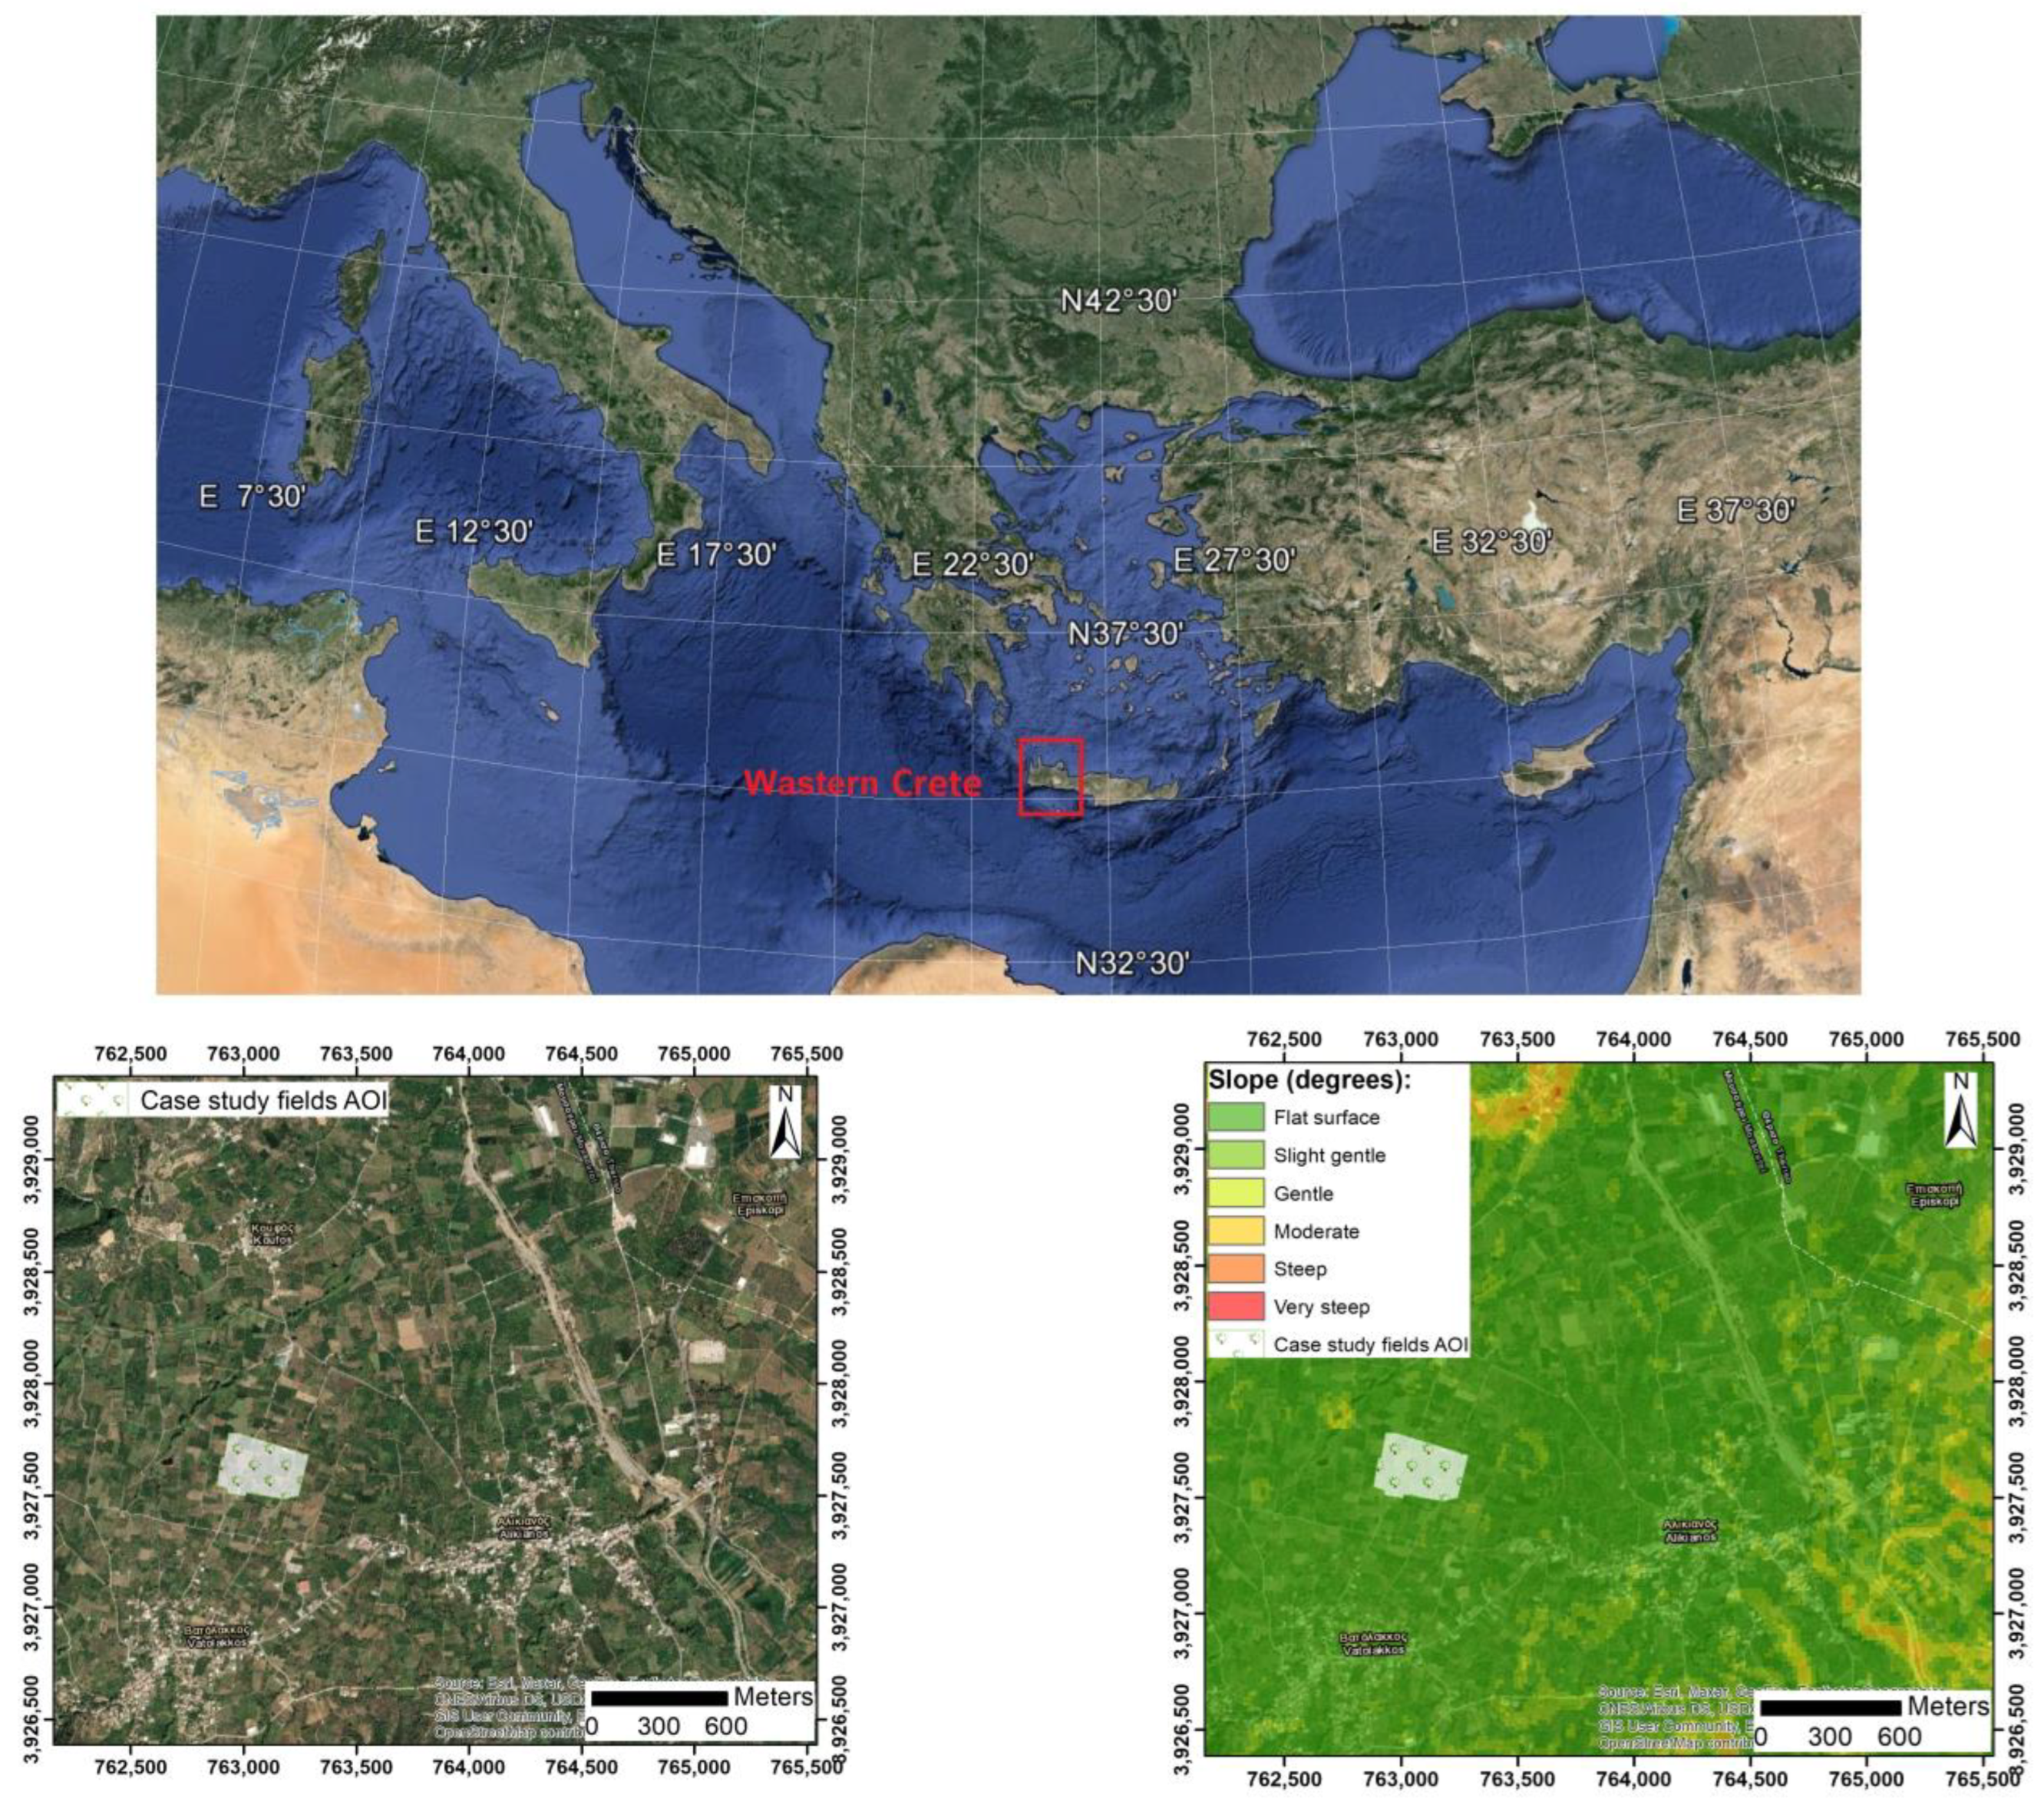
2.1.1. Case Study Infected Fields

The designated Area of Interest (AOI), the Vatolakos region of Chania on Crete Island, Greece (Latitude: 35°27.480′ N, Longitude: 23°53.995′ E), represents a lowland/plain region known for citrus cultivation, and it has been identified as the initial location in western Crete where CTV was reported (Figure 1) [15,37]. Over the years, CTV has remained an endemic pathogen in this area. In this study, four distinct citrus case study fields of 15–20 years orange (Citrus sinensis) orchards (Valencia and Washington navel varieties) were selected within the AOI, referred to as CF1 to CF4 (Figure 2). These data, which are reported herein for the first time, were retrieved during a former multiannual project concerning the annual surveillance of the endemic CTV and the detection of new infection areas around previously reported infected locations [15,37]. CTV was detected in these four fields (fields infected by genotypes T30/T385 and RB (closely related to the Taiwan stem pitting isolate JX266712)) in October 2020 (two fields, CF3 and CF4) and June 2021 (two fields, CF1 and CF2). Remote sensing has not been utilized up to now for determining CTV-infected fields in the region, so this study initially explored its applicability to detect the early stages of CTV presence in the referred fields (CF1 to CF4) (Table 1, Figure 3).

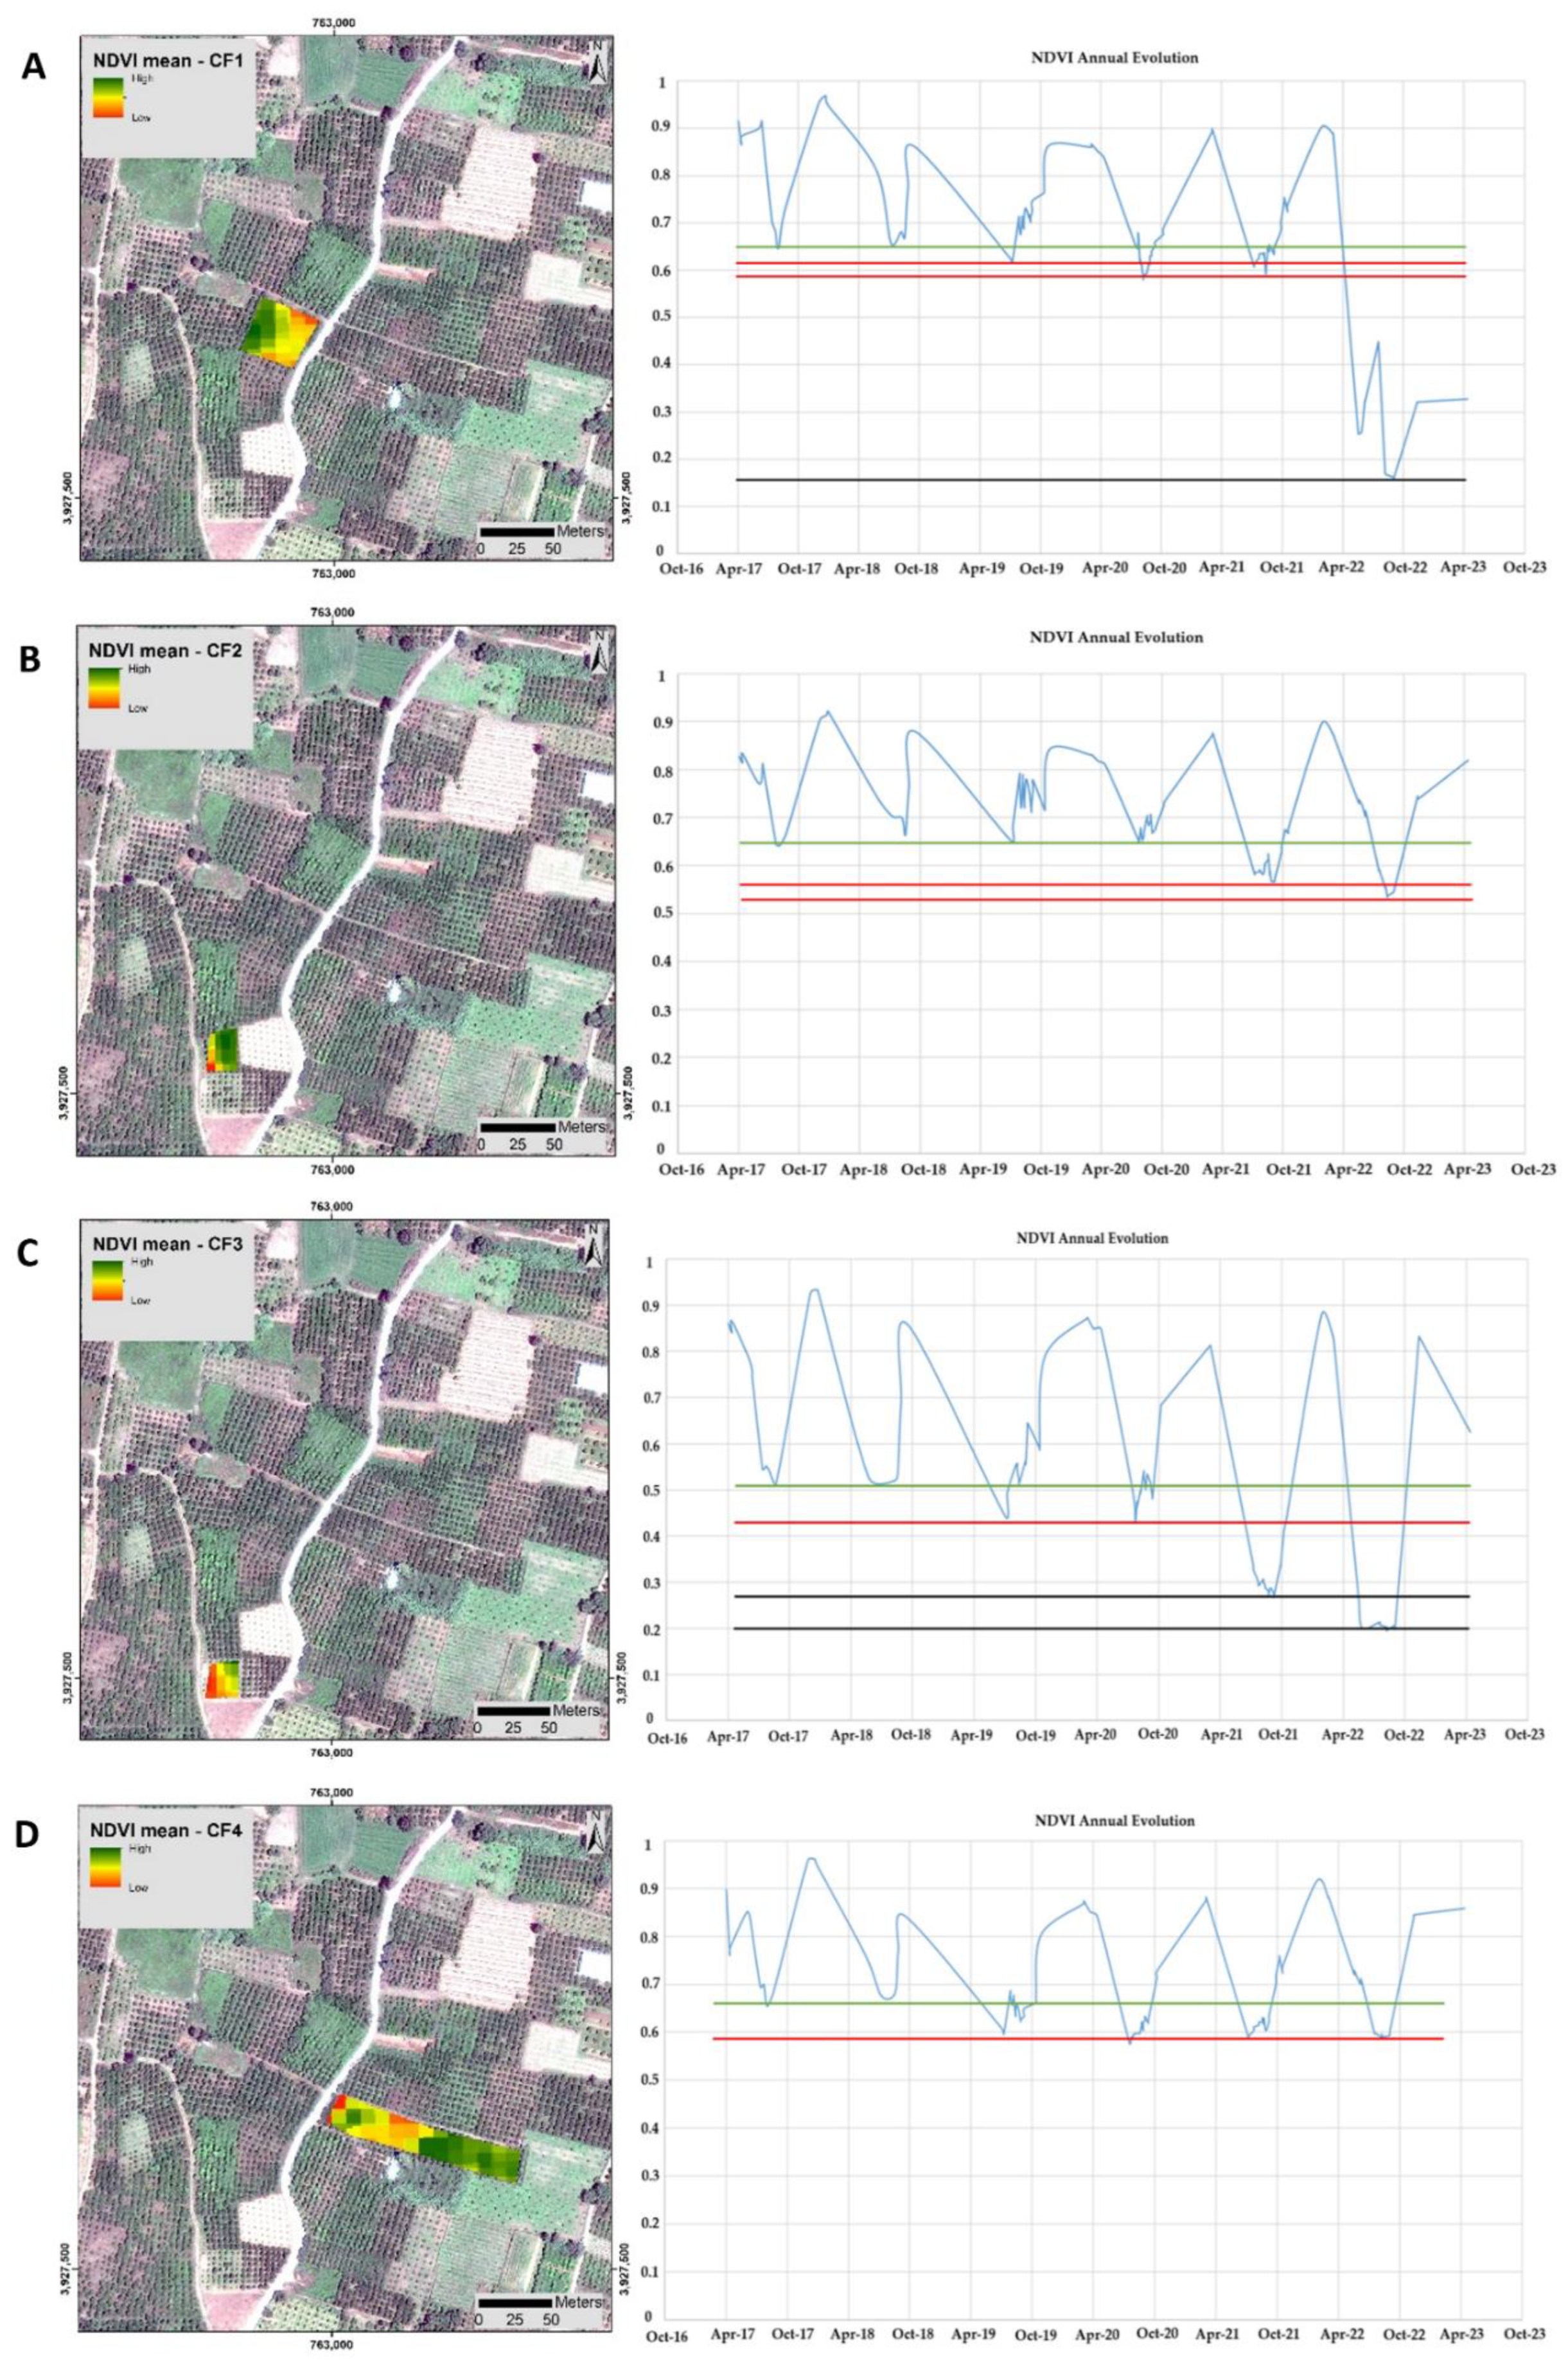
2.1.2. Time-Series Visualization of CTV Infection Using Remote Sensing

To assess the temporal evolution of the CTV duration and its early stage appearance in fields CF1 to CF4, a continuous time-series monitoring approach was adopted using freely available Sentinel-2 multispectral imageries with coarse spatial resolution (~10 m) (Table 1). The analysis focused on the period from 2017 to 2023, utilizing cloud-free imageries. The vegetation index NDVI was calculated for each cloud-free available Sentinel-2 imagery scene within this time frame (~63 scenes for each field). The spatiotemporal dynamics of the vegetation were evaluated for the referred infected fields (CF1 to CF4), which were detected as positive during 2020 and 2021 field survey inspections, and the retrieved temporal NDVI time-series values of each individual infected field plot are presented as a flowchart (Figure 3).
Anomalies or sudden changes in temporal NDVI values in a time-series flowchart during the high virus-titer peak period of CTV (spring to summer) could indicate the presence of infected CTV trees in the fields (CF1 to CF4). As the Sentinel-2 imageries have a coarser spatial resolution, their primary role in this study was to enable a long-term comparison of NDVI time series at a field-scale level. This will facilitate the identification of vegetation loss (lower NDVI values due to canopy defoliation by CTV) for the years 2017 to 2023 in these previously known CTV-infected fields. Moreover, the island is characterized by a warm, temperate climate with hot and dry summer periods and rainfall limited during the winter, with a mean annual temperature of 18.5 °C and mean annual precipitation of 327 mm in the proximity of coastal areas [38]. Thus, any NDVI temporal anomalies are not expected to be influenced by the climatic conditions (e.g., rainfall) during the spring-to-summer period in opposition to the winter one.

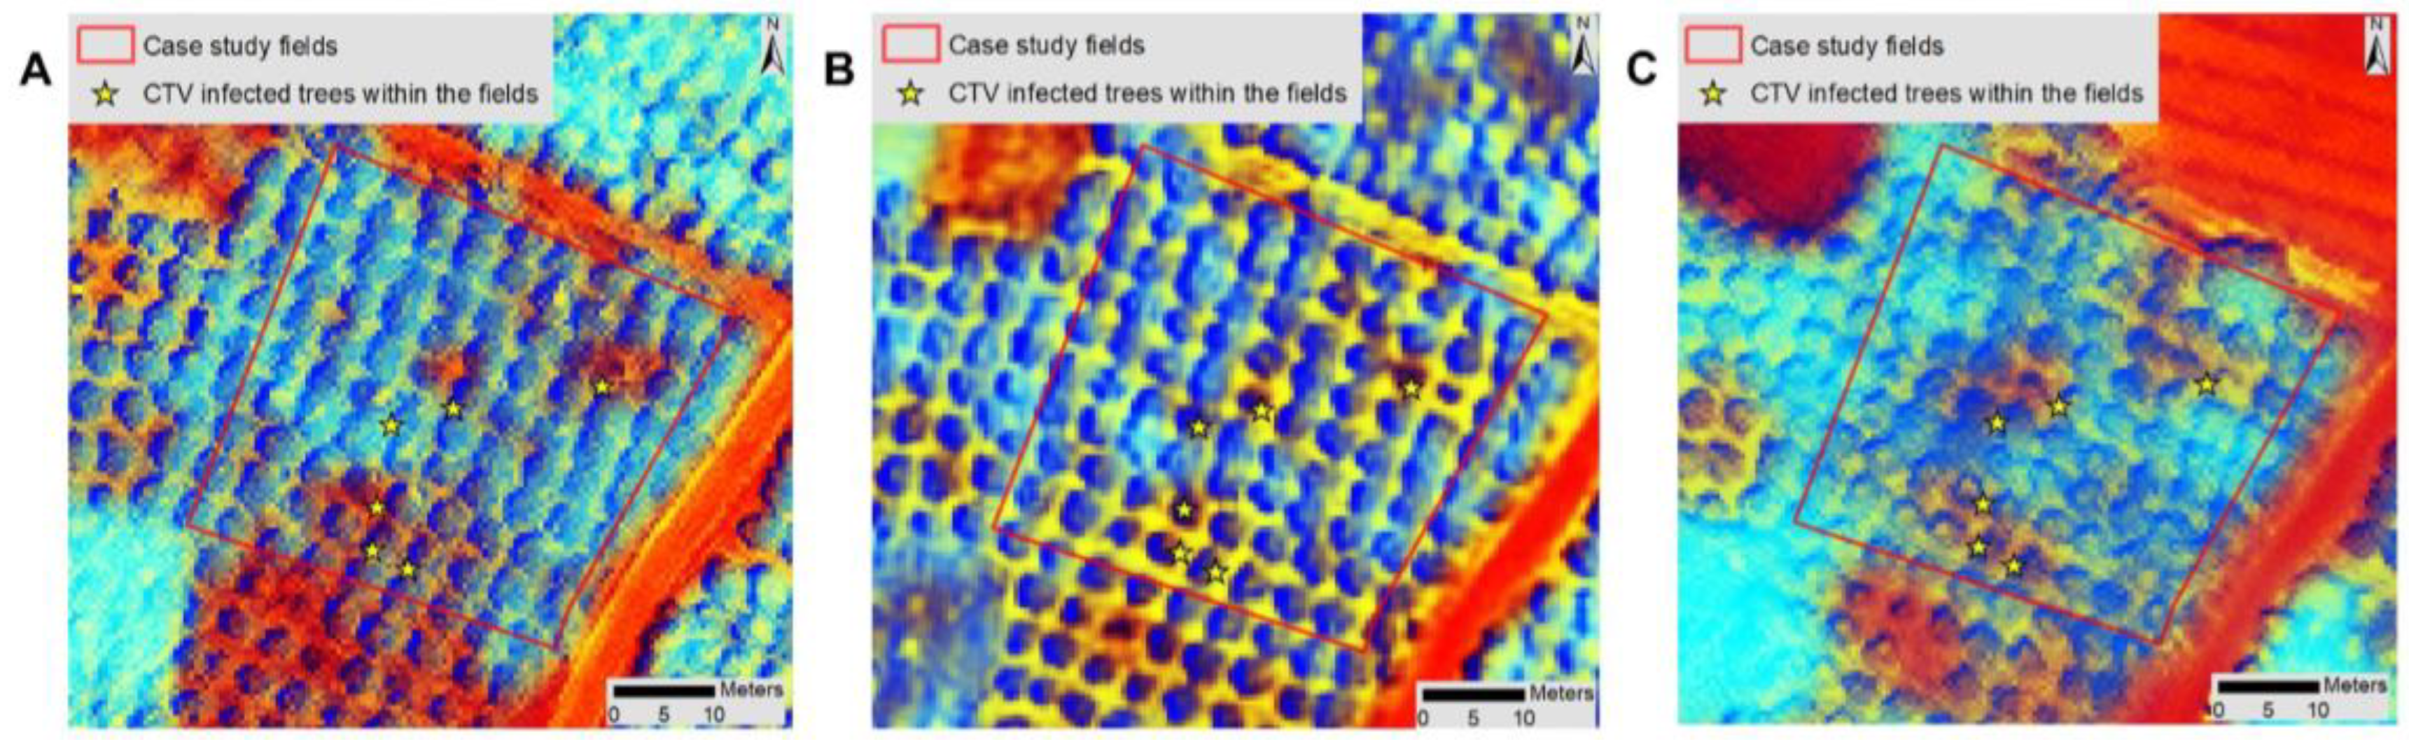
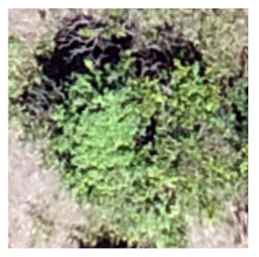
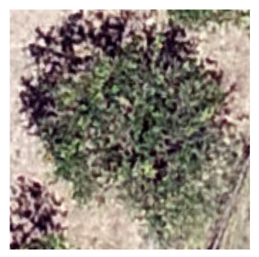
2.2. Detection and Monitoring of Trees with CTV Using Remote Sensing

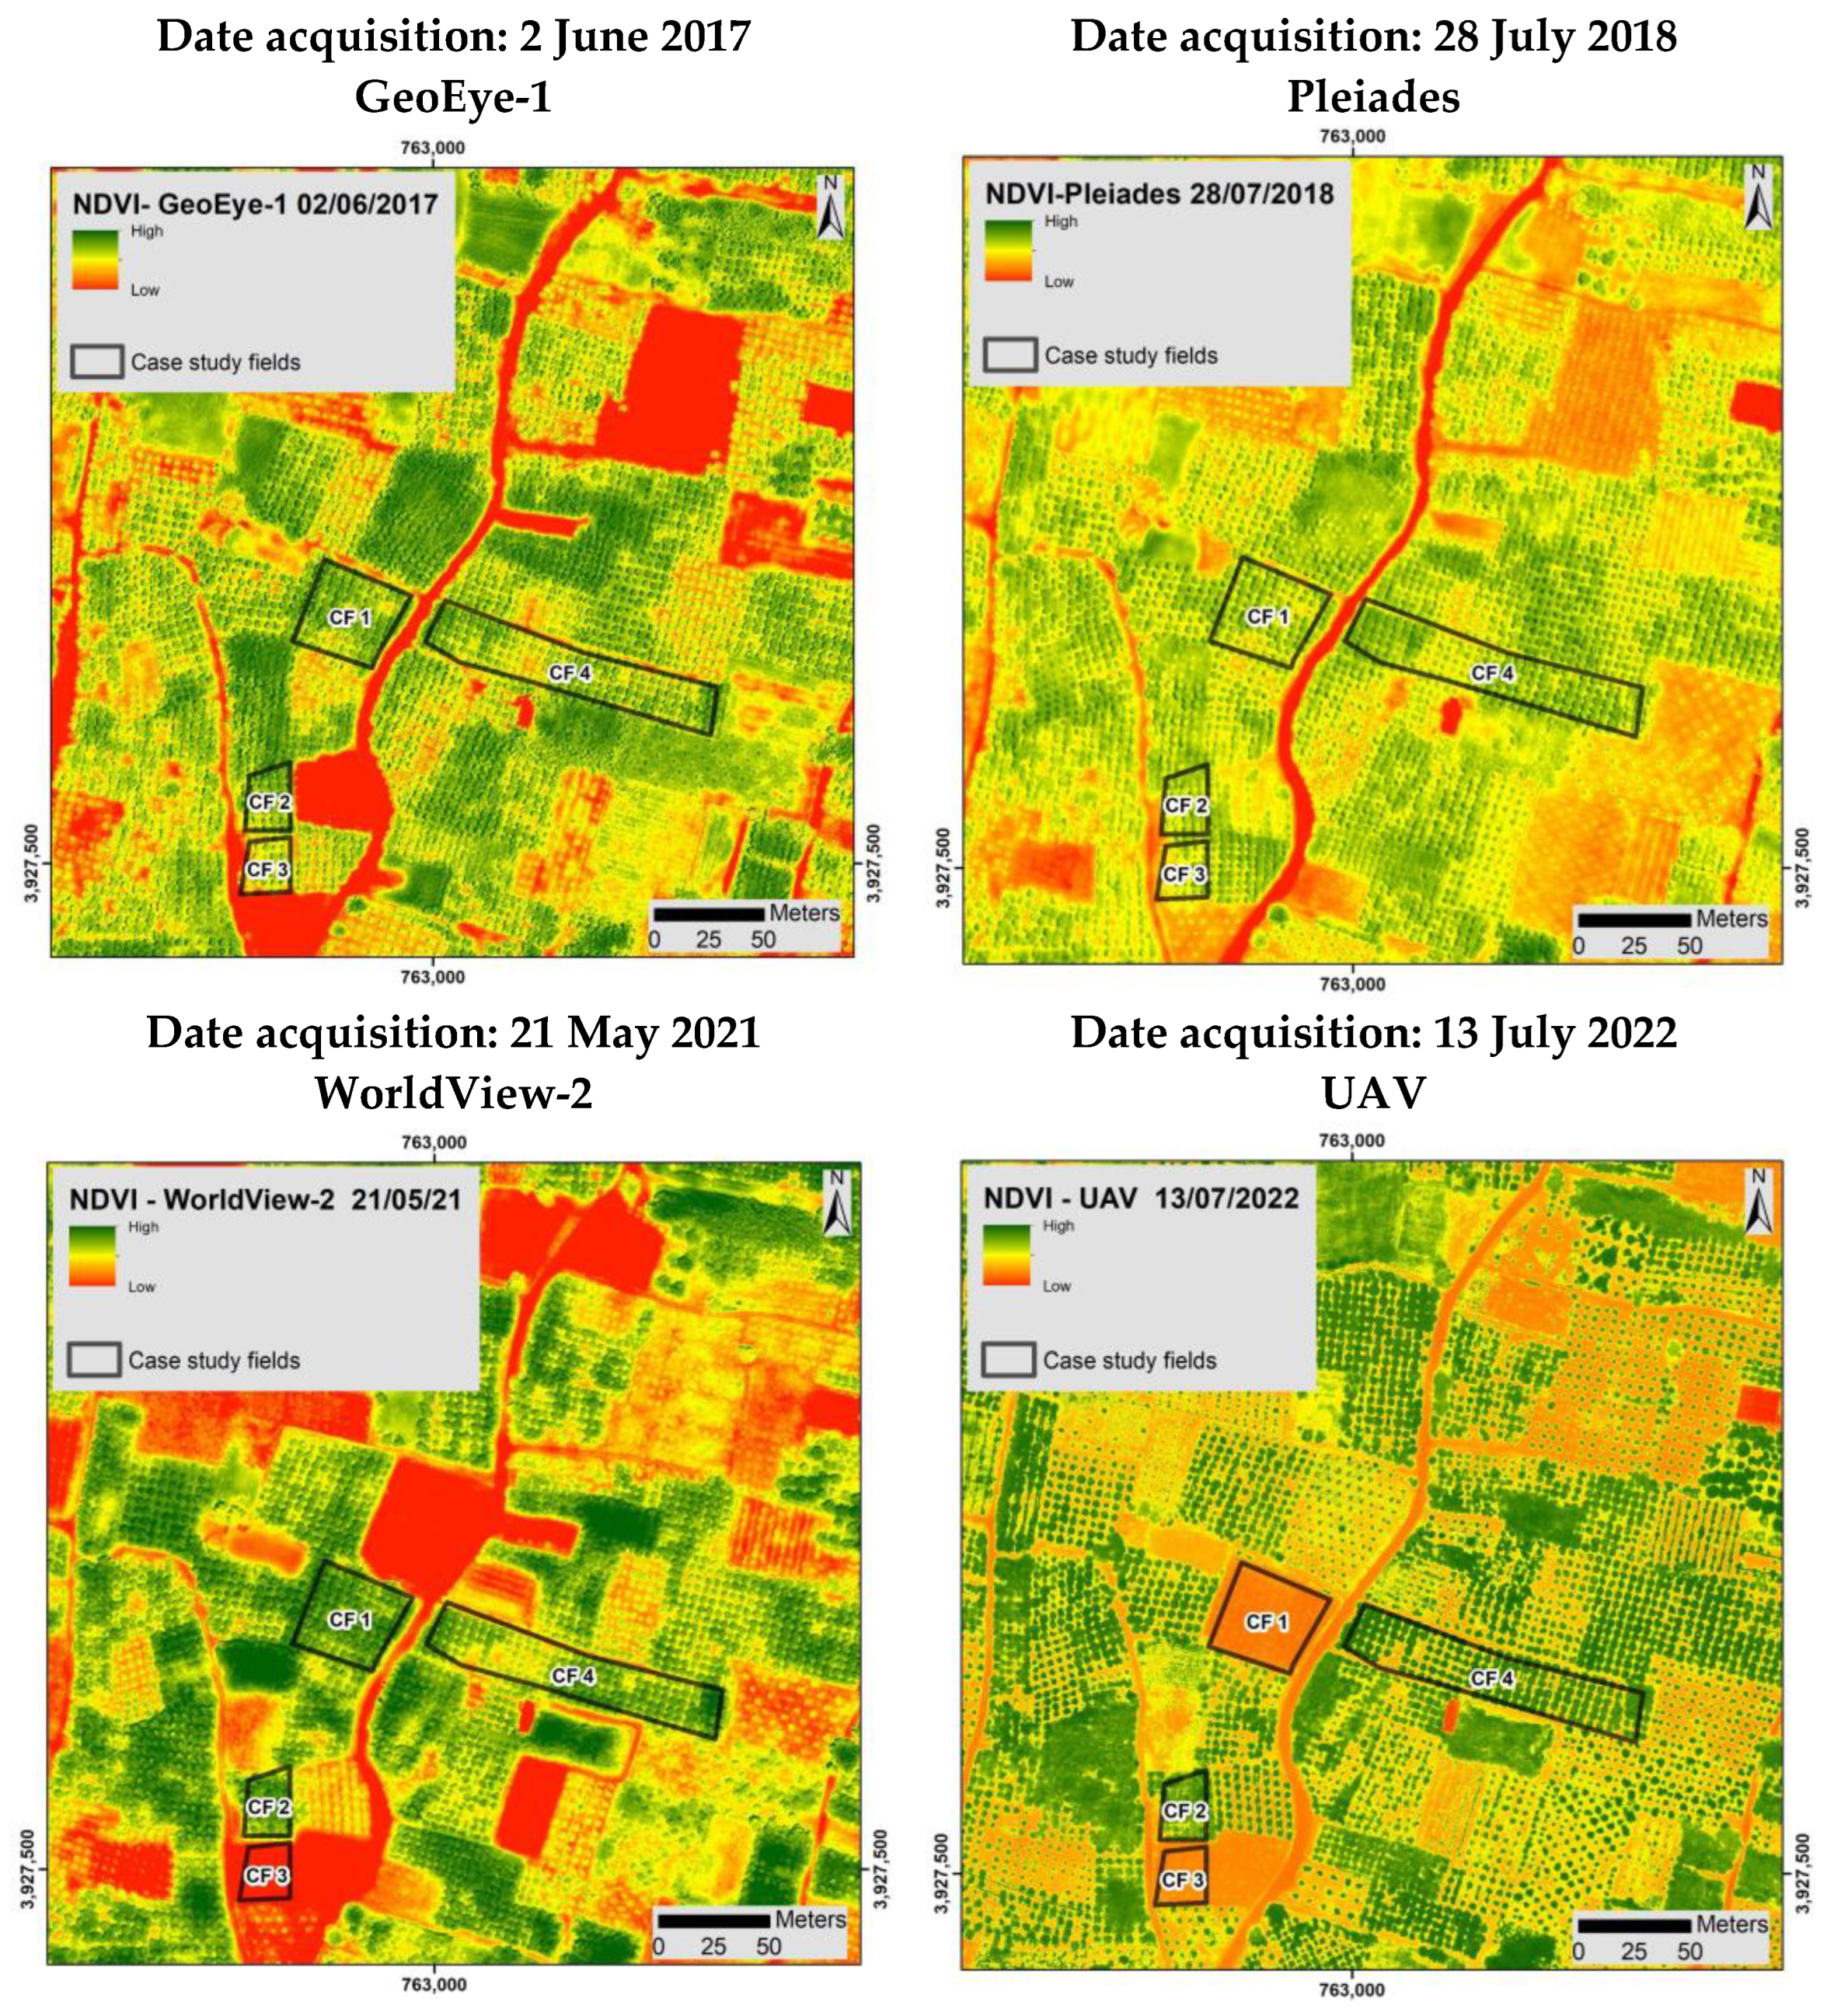
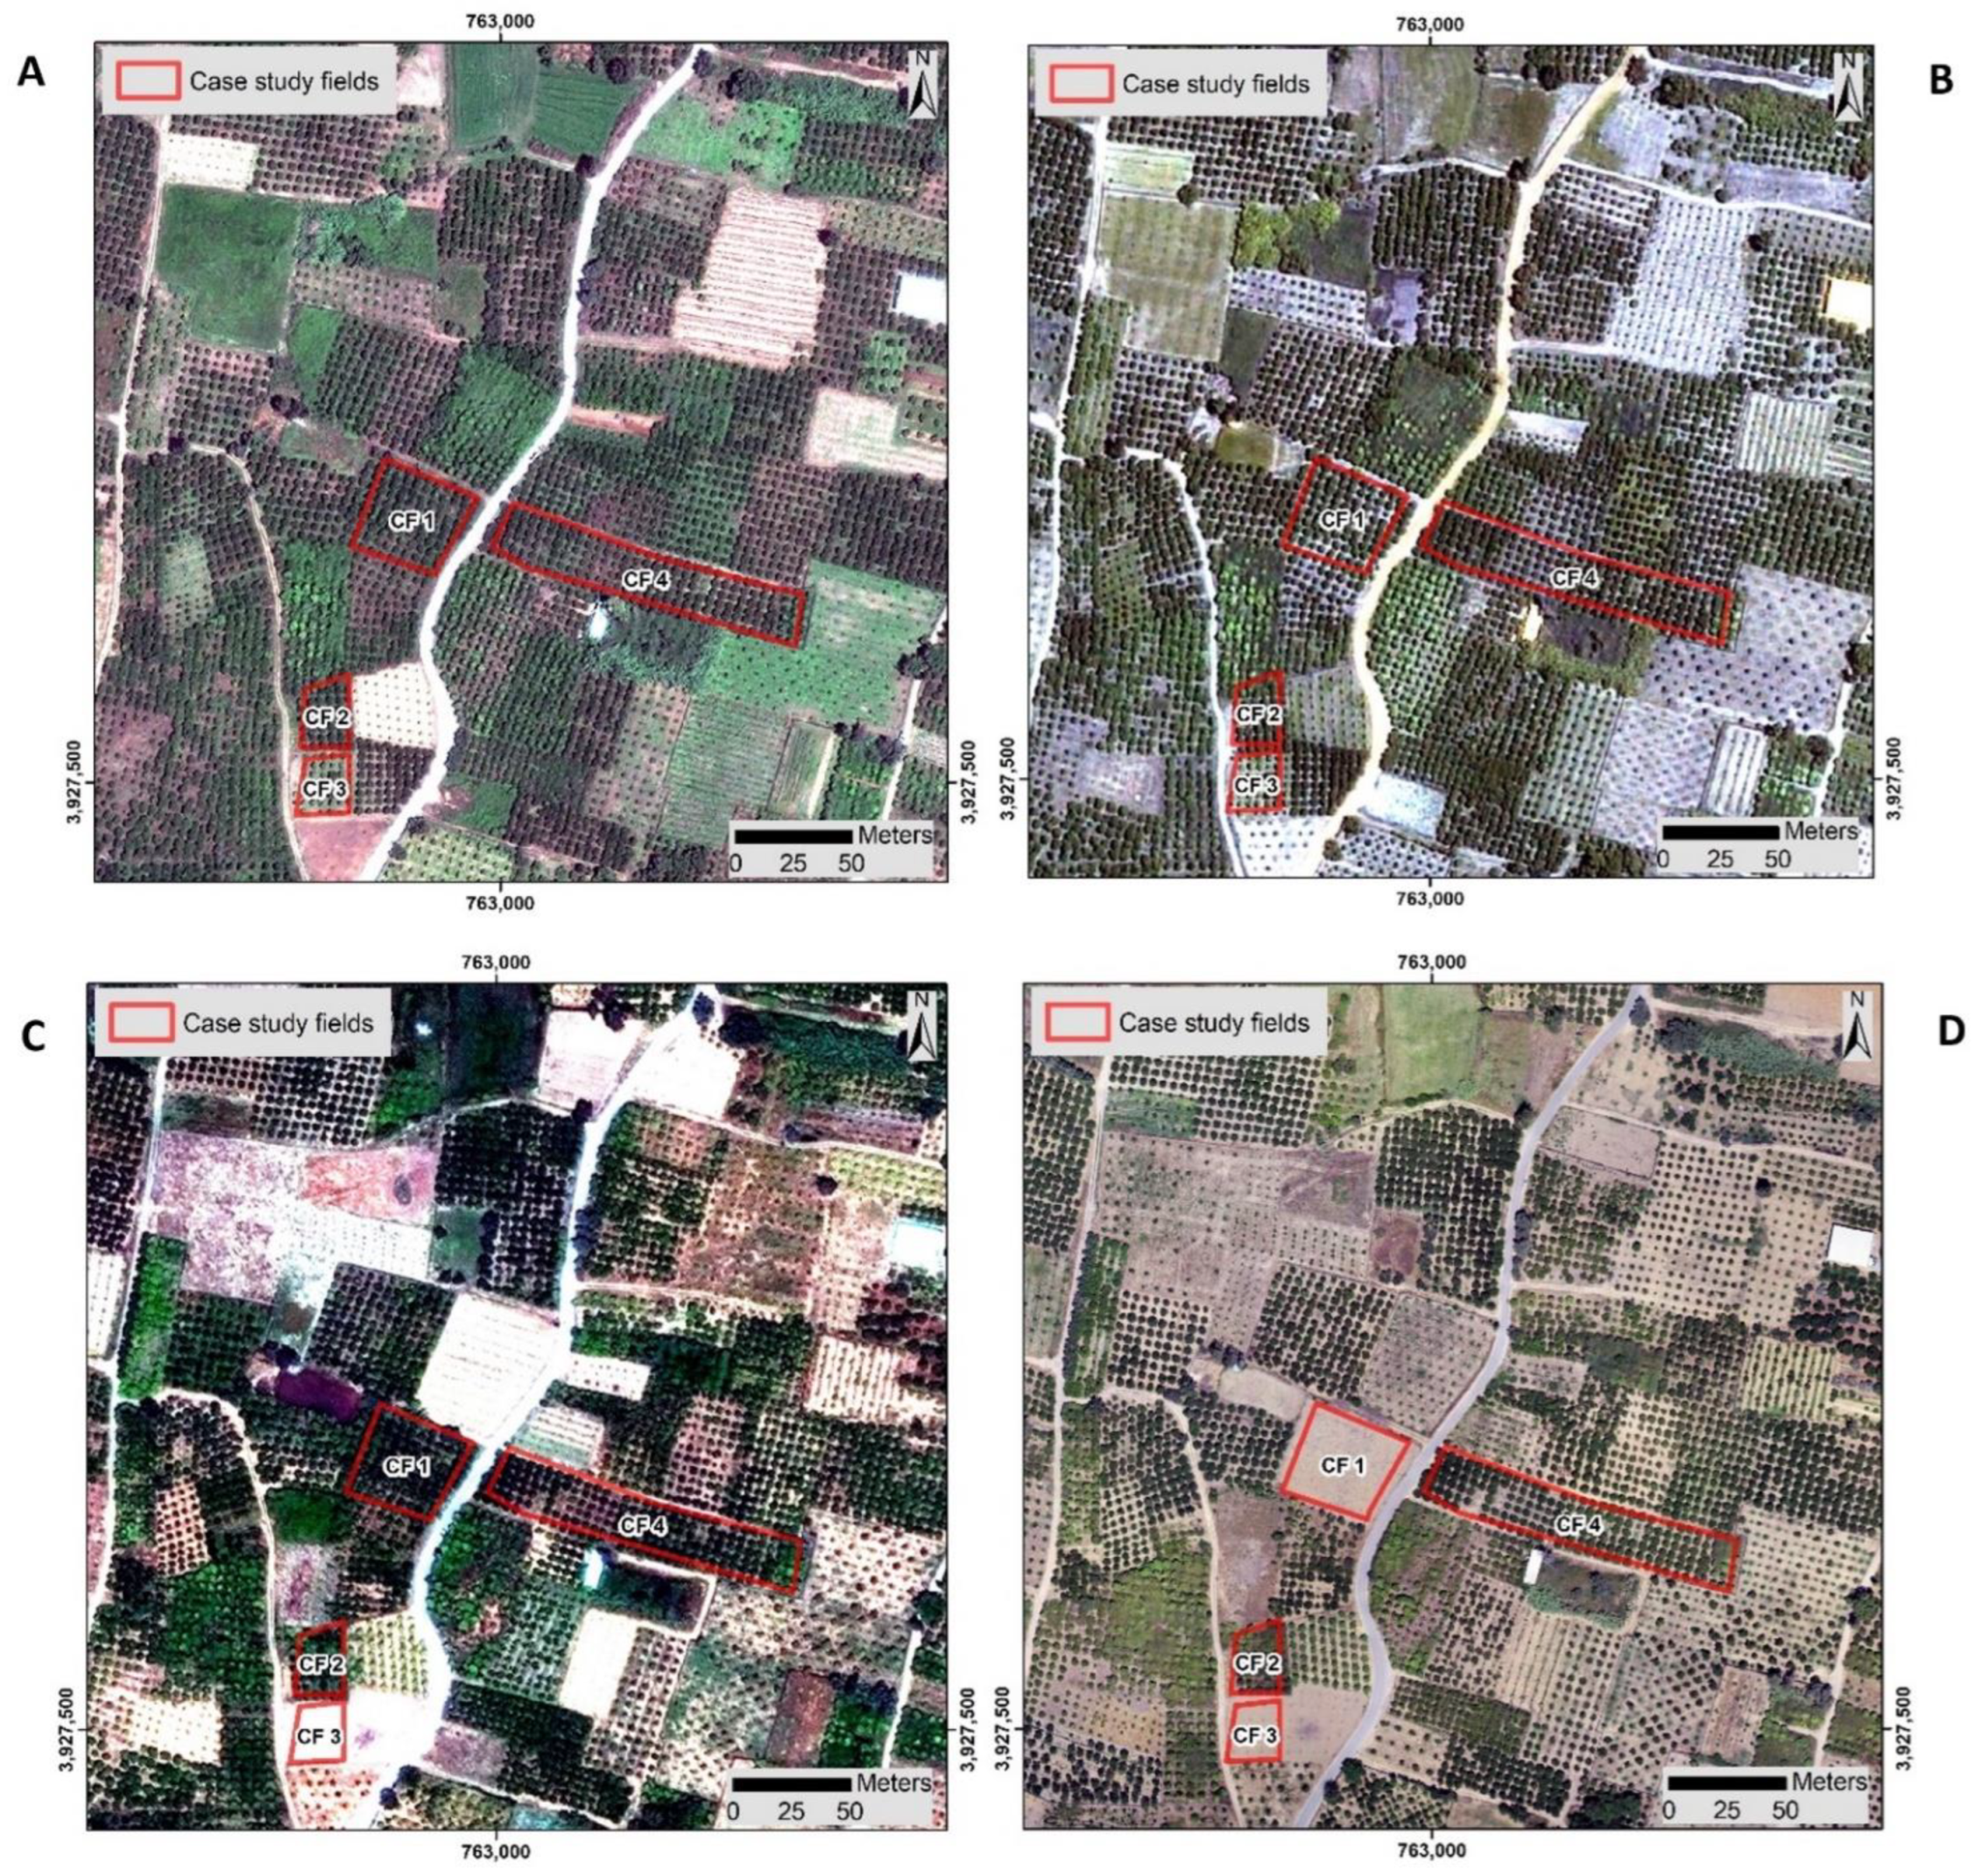
2.2.1. Satellite Imageries

The evolution of the CTV distribution and the determination of the infected trees within the four fields (CF1 to CF4) were monitored by high-spatial-resolution satellite imageries for the period between 2017 and 2021, based on the multimodal methodological framework of Table 1 and Figure 3. In this study, the acquisition of three high-spatial-resolution satellite imageries consisting of Worldview-2, Pleiades and GeoEye-1 (~0.5 m spatial resolution) took place. Those imageries were acquired with cloud-free coverage during the spring to summer period when the CTV titer appeared to be higher (Table 2). The satellite imageries were processed individually to cover temporal analysis between 2017 and 2021 and compared with each other to detect the distribution of infected CTV trees within the fields over time.
Initially, the satellite images were pre-processed, including geometric and radiometric corrections, minimizing the atmospheric conditions. Subsequently, a photointerpretation of diverse False Colour Composites (FCCs) was conducted to establish a correlation between the footprint of vegetation markers observed in the acquired high-spatial-resolution satellite images and the identified four distinct citrus case study fields (CF1 to CF4), which were previously found to have CTV-infected trees. An interesting finding of a vegetation marker, unrelated to the CTV, was observed through the FCCs and field trip campaigns—a strong reflectance from specific trees, particularly in the near-infrared band. These trees were primarily found in nearby abandoned fields and were associated with climbing plants growing on the citrus trees (Figure A3 in Appendix A). Building upon previous studies that utilized remote sensing for CTV detection in trees, a crucial step involved the calculation of specific vegetation indices, such as the widely used NDVI, which has extensive applicability in monitoring crop health [31,35].
The NDVI formula equation:
NDVI = (NIR − RED)/(NIR + RED),
where NIR and RED are the reflectance values in the near-infrared and red bands of the electromagnetic spectrum, respectively.
Vegetation indices have been proven to be highly sensitive to the presence of biotic symptoms, making them suitable for identifying trees that test positive for CTV based on their canopy spectral reflectance [39].
In addition, the application of Principal Component Analysis (PCA) to the high-spatial-resolution satellite imageries (specifically WorldView-2, GeoEye-1 and Pleiades) was employed to eliminate redundancy in the original datasets [40] (Table 1, Figure 3). PCA, a multivariate statistical and dimensionality reduction technique, compresses image data while enhancing features by removing redundancy and ensuring the transformed components are uncorrelated [40,41]. PCA was performed within the ERDAS IMAGINE® software (Version: ERDAS IMAGINE 2015) (Hexagon AB, Stockholm, Sweden).
To further explore the satellite imagery data, the original multispectral bands were stacked with the NDVI and PCA raster outcomes. This stacking enabled the creation of FCCs that incorporated all the respective raster band information (Figure 3). By employing the overall satellite image processing techniques described above, the spectral response of the identified infected trees from CF1 to CF4 fields on the images could be used as guidance to scale-up the method in the broader region. Thus, the detection of new candidate areas infected by CTV was identified by the satellite imagery outcomes, using the phenotype response as a reference and the variations in CTV-infected trees in comparison to the healthy ones observed in these four fields (Figure 3).

2.2.2. Unmanned Autonomous Vehicles (UAVs) Imageries

This study has also utilized the acquisition of UAV flights over the four infected case study fields to increase the accuracy of the spotted markers related to CTV via the satellite imageries (Table 1, Figure 3). The use of higher spatial resolution imagery will offer the identification of CTV with better clarity and efficiency than the satellite imageries, covering the temporal period 2017 to 2021 for the same purposes. In addition, following this methodology by comparing the UAV and satellite imageries will allow us to extend the detection of the CTV from the selected fields, covering a small-scale region, to a larger scale and its monitoring in a broader coverage range at tree level through the satellite imageries.
UAV images were collected during the summer of 2022 (July 2022) using a DJI Phantom 4 Pro drone (DJI, Frankfurt am Main, Germany), in order to capture the onset of the peak season for the disease outbreak. The UAV drone was equipped with a 1-inch, 20-megapixel CMOS sensor and a MicaSense RedEgde-MX multispectral camera (AgEagle, Kansas, USA). Both sensors were set to capture 5 images at nadir, with two-second intervals, along parallel flight tracks at a 100-m altitude above ground. Flights took place at midday local time when the sun elevation was maximum, which is considered standard timing for collecting spectral data on land [42]. The multispectral camera records five spectral bands simultaneously (Blue, 475 ± 20 nm; Green, 560 ± 20 nm; Red, 668 ± 10 nm; Red-edge, 717 ± 10 nm; and Near-infrared, 842 ± 40 nm). Additionally, it is integrated with an external Downwelling Light Sensor (DLS-2) module which records sun illumination parameters (i.e., angle, radiance) that are stored in the image metadata. These recordings are required during the radiometric correction processing of multispectral imagery. Moreover, the DLS-2 module provides GPS and altitude information for each acquired image, assisting in georeferencing and orthomosaicking of processed imagery. Ground-based images of the Micasense spectral calibration panel were acquired prior to each flight for accurate radiometric calibration of multispectral imagery during image processing. Image processing was performed with Pix4D proprietary software (Version 4.5.6), where both geometric and radiometric corrections were applied to multispectral images. Initially, the pixel values were compensated for sensor bias, such as the sensor black level, sensitivity, gain and exposure settings, and lens vignette effects, and then they were converted to radiance values (i.e., in units Wm-2sr-1nm-1, meaning watts per square meter per steradian per nanometer). Following, the radiance values were converted to spectral reflectance for each band, by incorporating the information from the Micasense reflectance panel and the DLS-2 sensor. Pix4D software produced the final orthomosaics for each band and calculated the NDVI, as described earlier, which was further applied in our analyses.
The visual photointerpretation of FCCs with these very high-spatial-resolution images (UAVs) in relation to the corresponding vegetation indices as well as the application of PCA algorithms from the processing stages applied in the satellite imageries (WorldView-2, GeoEye-1 and Pleiades) provided the capability to examine more accurately the evaluation of the trees being positive to the CTV (as detected by the field survey samplings). Moreover, the advantage of the UAV’s superior high-spatial-resolution to retrieve more accurate NDVI values in contrast to the satellite imageries could also be used for a sufficient comparison with the proximal spectroscopic NDVI measurements taking place at the following validation stage while determining the phenological variations of the infected trees in relation to healthy ones (Figure 3).

2.3. Validation

The results obtained by integrating various remote sensing techniques utilizing different satellite imageries upon previously infected case study fields served as the foundation for identifying new locations of infected trees. To validate these findings, Tissue-print ELISA and RT-PCR analyses, along with spectroscopic analyses, were employed. These additional methods were used to evaluate and confirm the presence of newly identified infected trees as detected through the satellite imageries.

2.3.1. Field Surveys and CTV Detection

Leaf Sampling Collection

Field surveys were carried out to new fields (indicated as candidate CTV-infected fields) by the outcomes from the integration of the diverse satellite and UAV imagery outcomes. Two surveys, one in early November 2021 and one in June 2022 in the surrounding area of Vatolakos, were conducted. In the first period, five different citrus candidate fields were surveyed, and in the second period, four, referred to as CdF1 to CdF9 (Table A1 in Appendix A). All citrus candidate fields were 15–20-year-old orange orchards (Washington navel and Valencia variety).
A total of 35 samples (14 in the first period and 21 in the second period) were either randomly collected from a wider potential infected loci/field or from specific trees that the satellite and UAV imageries had marked, respectively, as potential CTV-infected. Four fresh twigs (15–20 cm) with leaves of the annual vegetation from the four quarters of the tree were collected for further analysis.

Virus Detection and Sequencing

All the collected samples were initially serologically tested for the presence of CTV (Table 1, Figure 3). The immunodetection method of Tissue-print ELISA (PlantPrint Diagnostics, Valencia, Spain) was performed using two replica prints from the four collected stems. In addition, the molecular detection of CTV was carried out for all the collected samples after the isolation of total RNAs using the Trizol method, as previously described [43], from a mixture of leaves, petioles and bark. A template of 200 ng RNA was used in a one-step RT-PCR using specific CTV primers for the detection of the full genome of capsid protein (CP) using a slightly modified assay profile [44]. Briefly, the 25 μL RT-PCR reaction mix contained Green-Go Taq Flexi buffer (Promega, Madison, WI, USA), 1.5 mM MgCl2, 5 mM DTT, 0.25 mM dNTPs, 0.4 μM of each primer, 10 U RNase Inhibitor (NEB, Hitchin, England), 1.25 U MML-V (Minotech, Crete, Greece) and 1.5 U Go-Taq polymerase 6 (Promega, Madison, WI, USA), under the following cycling scheme: 50 °C for 60 min; 95 °C for 10 min; 40 cycles of 94 °C for 30 s; 51 °C for 30 s; 72 °C for 45 s; and a final step of 72 °C for 7 min. The size of the amplified RT-PCR products is expected to be around 670 bp.
Two RT-PCR amplicons raised from the CTV detection from different fields (CdF5, CdF9) were purified using a column gel extraction system (Macherey-Nagel, Düren, Germany) and were sequenced in both directions by the Sanger method (Macrogen, The Netherlands).

Spectroscopy Analysis

Leaves that were used for the RNA isolation and the molecular detection of CTV were further proximally examined in a spectroscopy analysis to measure the reflectance and NDVI using a leaf spectrometer (CI-710s SpectraVue Leaf, Bio-Science, Camas, WA, USA) (Table 1, Figure 3). The wavelength range of this spectrometer was 360–1100 nm, including on-board spectral analysis software. The CI-710s Leaf Spectrometer (CID Bio-Science, Inc., 1554 NE 3rd Ave, Camas, WA, USA) is a portable device that can operate in multiple measurement modes, including scope, reflectance, transmittance and absorbance mode. The leaf spectrometer was calibrated using the light and dark reflectance standard circles, and then the spectral reflectance and NDVI were measured on the upper side of a citrus leaf. Measurements were carried out on a set of four leaves from healthy trees and infected trees in the four case study fields and the nine candidate ones from the field surveys. Four independent measurements were conducted from each tree. In addition, measurements using the leaf spectrometer were taken three times per leaf, and the mean value of these three measurements was used for the analysis.

2.4. Semi-Automatic Machine Learning Procedure of CTV Detection and Accuracy Assessment

Recently, remote sensing parameters characterizing plant characteristics have been combined successfully with machine learning algorithms in the determination of plant diseases [45]. The suggested candidate CTV-infected trees within the determined fields will serve as training samples in a Random Forest (RF) machine learning (ML) algorithm within the Google Earth Engine (GEE) environment (Table 1, Figure 3). RF [46] is a powerful non-parametric ensemble classification and regression algorithm that utilizes multiple decision trees as base classifiers. It has been widely used in remote sensing applications, with great performance results [47,48], while, in many cases, it outperforms other successful ML approaches such as Support Vector Machines (SVMs) [49,50,51]. In the classification of plant diseases, in particular, RF has proven to be highly effective [52]. Moreover, it is well-suited to handle high-dimensional and multicollinear data, as it constructs trees based on subsets of training samples that can be selected multiple times or not selected at all [47].
The samples used for training the RF algorithm were identified to be positive by laboratory and spectroscopic analysis. The algorithm was applied to the UAV image, taking advantage of its superior spatial resolution, to reveal the distribution of the CTV-infected trees within the case study and candidate fields. Other training samples embedded within the RF algorithm, such as bare soil, shadows, vegetation and sparse vegetation, were derived from in situ validation and visual inspection of the UAV images. To evaluate the performance of the classified RF image outcome an accuracy assessment was conducted. This was based on a set of survey samplings from the suggested candidate fields, which were confirmed positive for CTV. These were employed for validation purposes in conjunction with samplings from healthy trees to assess the accuracy of the classified RF image. As training datasets, 80% of the samplings were used, while 20% of the samplings were used for validation and accuracy assessment (based on a stratified random selection from the 35 total samplings). The validation samples were used for the evaluation of the estimated positive and non-positive trees detected by molecular and serological analyses in relation to the satellite imageries outcomes of the classified RF image and its accuracy assessment of the classification map, including overall accuracy (OA), confusion matrix, kappa statistics, user’s and producer’s accuracy [53].

3. Results

3.1. Time-Series Early Visualization of CTV and Epidemiology Using Remote Sensing

The Sentinel-2 multispectral imageries were utilized to generate the NDVI time series spanning the period from 2017 to 2023 within the GEE environment (Figure 4). The NDVI values ranged from 0.15 to 0.97 in CF1, from 0.51 to 0.91 in CF2, from 0.19 to 0.92 in CF3 and from 0.55 to 0.96 in CF4 (Figure 4). The annual NDVI evolution chart revealed a noticeable decline during the summer periods, in the CF1-CF4 fields where the CTV-infected trees were first detected during 2020 and 2021. It is worth noting that the observed drop in NDVI values over the years served as an indicative marker for the initial presence of CTV infection in these particular fields which was marked in most cases from the summer of 2019 onwards, with the lowest values occurring around August (Figure 4). This temporal variation pattern, identified through the analysis of the Sentinel-2 imageries, provides valuable insights into the dynamics of CTV related vegetation health over the specified time period and its epidemiology evolution through the years in the broader area. Interestingly, during the winter period when the CTV titer is very low, the range of the NDVI values provided a similar trend through time (Figure 4).

3.2. Detection and Monitoring of Trees with CTV Using Remote Sensing

The natural color RGB composites of the high-spatial-resolution Worldview-2, Pleiades, and GeoEye-1 multispectral satellite and the UAV images, covering in total the period 2017–2022, are shown in Figure 5. Using the high-spatial-resolution multispectral satellite imageries, the NDVI vegetation index and PCA analysis were derived (Figure A1 and Figure A2, Table A2 and Table A3 in Appendix A). These results were then combined with the other multispectral bands to generate FCCs that better distinguished spotted markers, via visual inspection of the identified CTV-infected trees in the case study fields CF1–CF4. Among various combinations of FCCs examined, the composition consisting of RED-Principal Component 1-NDVI in an RGB combination provided superior highlighting of the specific trees infected by the CTV (Figure 6). In Figure 6, the healthy vegetation is presented in bluish hues, while the location of the infected trees is in darker brownish/yellowish hues. The above analysis successfully showed that the CTV-infected field parts at the macro-scale are marked with a phenotype that is different from the rest of the field pattern consisting of healthy trees. Additionally, the images taken during June 2017 show fewer infected trees than those from July 2018, while in May 2021 a higher coverage area of the spread of infected trees existed in comparison to the previous year’s images, even if the CTV was at its earlier stage of viral titer (2021 image acquired during May), whose symptoms were observed later during July to August as the Sentinel-2 NDVI time series revealed. Based on the analyses and outcomes derived from the satellite images, in conjunction with the acquired UAV images having a superior spatial resolution to achieve an enriched accuracy of the spotted markers and method’s efficiency, candidate CTV-infected fields (CdF1 to CdF9) were successfully identified within the broader area (Figure 7), and with the ability to point the infection at a specific tree level for the testing samplings.

3.3. Validation

To validate the above methodology, which was based on the case study infected-fields CF1–CF4, the candidate CTV-infected fields (CdF1 to CdF9), which were identified based on the outcomes of the satellite and UAV images, were visited to collect plant material for further laboratory analyses aimed at confirming the presence of CTV (Figure 7). In the validation process, the UAV image captured in July 2022 was specifically acknowledged to enable markers to be spotted associated with potential CTV-infected trees, mainly affecting their canopy (Figure 8). The detected markers in Figure 8 may vary due to the presence of different CTV genotypes in each infected tree, which may exist as a sole genotype in a citrus plant or occur together as a complex mixture [4,8].
From the 14 tree samples collected during the first survey from five candidate fields, six trees were found to be positive for CTV through immunodetection and RT-PCR analyses (Table A1 in Appendix A). As the collection period was at the beginning of November and the sampling material tended to be inappropriate, the samples were re-collected in June 2022 and tested along with the samples from the second survey. In total, 24 trees out of 35 (68.6%) were detected with CTV in 88.9% (eight out of nine) of the surveyed fields, as indicated by the remote sensing methodology. The CTV presence in these samples was confirmed by immunodetection and RT-PCR assays. None of the three trees collected from one field (November 2021) were found to be positive. Sequence analysis of two isolates derived from two different fields (denoted as VCRS-10 and VCRS-31 from CdF5 and CdF9 fields, respectively) confirmed the viral origin of CTV and both sequences shared high levels of nucleotide identities of 99% with the 33 Taiwan stem pitting isolate JX266712 (RB genotype) and was almost identical (99.9% nt identity) to the Greek endemic isolate KF962601. The two obtained Greek isolates shared 100% identity. The sequences were deposited in GenBank under the accession numbers OR233838–OR233839.
The analysis of leaves collected from infected and healthy trees using the spectroscopy method showed that the mean value of the NDVI measurements was highly related to the NDVI measurements derived from the UAV imagery acquisition, as shown in Table 3.

3.4. Semi-Automatic Machine Learning Procedure of CTV Detection and Accuracy Assessment

The RF algorithm was applied to a UAV image, with the reddish hues in Figure 9 as the RF outcome, indicating the CTV-infected trees. A number of survey samples of leaves from the trees were derived during the two field surveys (November 2021 and June 2022) within the suggested candidate fields. The laboratory analyses revealed positively infected trees that coincided with the RF outcomes. Phenotype diversity corresponding to CTV was detectable. From the collected in situ samplings, samples consisting of healthy and confirmed CTV-infected trees were randomly selected for the accuracy assessment of the RF-classified image (80% of total samplings as training samples and 20% for validation). The overall accuracy (OA) reached a percentage of 89.7%, with Kappa statistics being 0.85 (Table A4 in Appendix A). This result indicates that the RF algorithm was effective with good agreement in detecting CTV-infected trees by using UAV imagery.

4. Discussion

Vegetation indices like the NDVI index are commonly used to quantify abnormalities in vegetation greenness (health and density) due to abiotic and biotic factors [22]. In this study, freely available Sentinel-2 satellite multispectral images were used to analyze the temporal epidemiology of CTV over a period of 7 years (2017–2023) in four case study fields (CF1–CF4) which had been positively detected during 2020–2021. In most cases, the NDVI time-series value flowcharts exhibited the lowest values (below 0.6) during the period from June to August, which correlates with the peak of the visual canopy symptoms to the infected trees, while the maximum values appeared from December to February. These results are almost in accordance (approximately a month offset) with MODIS NDVI time-series outcomes for case studies with infected CTV trees in Italy [31]. The fact that CF2 and CF4 showed slightly higher NDVI values during the summertime of 2018 could be due to other factors such as rainfall period, temperature and soil type, which need to be further examined for the moisture levels in those fields and their interrelationships, regardless of the presence of CTV trees occurring or not. Notably, an advantage of using Sentinel-2 NDVI time-series satellite images in this study was the specific indication of the temporal progression of CTV infection as the lower NDVI values may reflect plant physiology stress due to the virus titer, which seems higher during these months (July to August). This trend was slightly different from a case study in Italy, where May seemed to be the peak period of the symptoms of the CTV-infected trees [28]. Moreover, the utilization of Sentinel-2 time-series images enhanced the visualization of the year of infection at earlier stages. In fact, it was found that all fields had a declining trend of reduced NDVI values lower than 0.6, one to two years earlier than the date of their official detection by laboratory diagnostic tools after their sampling due to the presence of visual symptoms. Although the reliability of this approach for the early detection of CTV is weakened in cases of a low number of existing and spreading infected trees along the field, as its coarse–spatial resolution is low (~10 m; a pixel covers more than one tree minimizing the strong visibility of infected trees) and the NDVI cannot directly be linked with CTV presence, it can serve as a preliminary guideline for monitoring the epidemiology of the CTV based on the observed decline trends in NDVI temporal analysis. Moreover, it provides decision-makers with a helpful and low-cost tool to spot early outbreaks, enabling specialists and authorities to visit and collect samples from those fields and apply mitigation activities before the virus spreads throughout the entire area in subsequent years.
The utilization of remote sensing technologies by multispectral or hyperspectral images from satellite platforms provides a powerful alternative tool for plant disease management [20,23]. Hyperspectral images contain richer spectral information due to their numerous bands across the electromagnetic spectrum in contrast to the few discrete bands of the multispectral sensors and can be more effective in plant health status and diagnosis of plant diseases in their early or asymptomatic stage [54]. However, there are a few limitations in hyperspectral imaging systems that make multispectral imageries more applicable. For instance, there are fewer freely available or commercial satellite hyperspectral sensor systems with coarser spatial resolution and temporal coverage, limiting their use in plant disease monitoring, so there is a need for a respective UAV hyperspectral image system, which costs more and covers smaller coverage areas [19]. Herein, high-spatial-resolution satellite multispectral images were successfully processed for temporal analysis of the visual identification of CTV in four known infected fields (CF1–CF4). In particular, GeoEye-1 and WorldView-2 offered slightly better spatial resolution compared to Pleiades for an accurate and effective metric construction of the spectral response characteristics from various FCCs combinations. The NDVI and FCCs, including PCA components, and particularly the RGB combination of RED-PC1-NDVI, have highlighted with high accuracy the specific trees infected by the CTV, as they have been identified in those case study fields. Similar studies have applied PCA in hyperspectral images of leaves in in vitro inoculated plants, which discriminated against asymptomatic plants infected by CTV and tomato spotted wilt virus [25,55]. In this study, the very high-spatial-resolution satellite imageries are dependent on only one scene for the respective individual years due to their cost, and it seems that more images within the summer period of an individual year are needed to monitor the distribution of CTV and its peak within an infected field.
Furthermore, UAV images played a vital role in this study, significantly enhancing the accuracy of identifying markers, particularly affecting their canopy. This knowledge is important for interpreting and using the outcomes as references when exploring spectral information and phenotype variations in satellite imageries with coarser spatial resolution. The use of a UAV image enabled us to quantify the markers, such as canopy defoliation, more effectively and allowed us a more precise identification of potential CTV-infected trees in relation to the satellite imageries.
The adopted methodology using remote sensing based on satellite and UAV images successfully identified candidate CTV-infected trees within the broader investigated area. Subsequent sampling visits to these candidate fields (CdF1 to CdF9) confirmed CTV presence by laboratory diagnostic assays, highlighting their high agreement with the satellite imagery outcomes. These laboratory results further confirmed the efficiency of the remote sensing-based methodology, as it indicated candidate CTV-infected trees with low virus titer, which were detected only by RT-PCR and not by serological assays (Table A1 in Appendix A). Moreover, the proximal spectroscopic NDVI measurements were found to be very similar to the NDVI values acquired from the UAV images, with a standard deviation between 0.002 and 0.11. These spectroscopic devices can be a useful, fast tool for direct in-field inspections of high accuracy when the specific metric range of values for vegetation indices (e.g., NDVI) have been estimated from remote sensing satellite/UAV-based platforms. The collection of positive CTV samples was found to be dependent on the virus’s peak symptom period, which seems to occur mainly during the late spring to summer and less during autumn to winter time. Therefore, scheduling samplings in alignment with the acquisition of satellite imagery is recommended to optimize the interrelationships between these data sources. Similar works have also shown the use of UAV-based remote sensing methodologies for the detection of plant viruses, like potato virus Y, tomato mosaic virus and tomato yellow leaf curl virus, as well as fungi and bacteria [56,57,58,59] to be effective. Despite the advantages of UAV images, they can only cover small areas and can act as a supplementary validation tool for the use of satellite images capable of covering a broader area for detecting infected trees.
The application of RF machine learning to the UAV imagery, by using training samples based on their canopy phenology from previously known CTV-infected trees and the positive ones confirmed by laboratory analyses regarding the suggested candidates, provided reliable outcomes for determining CTV-positive trees at a broader scale. The accuracy assessment of the RF-classified image reached an overall accuracy (OA) of 89.7%, a percentage level similar to other studies [24], indicating the capability of machine learning algorithms when applied to remote sensing data and applied efficiently in plant disease detection and monitoring. Future forthcoming surveys to achieve a more enriched training samples repository could feed and improve this RF algorithm to reach even higher accuracies for determining the investigated pathogen and reduce any inconsistencies while enabling a more discrete and accurate ensemble learning classification of the CTV using diverse satellite imagery sensors. For instance, the presence of CTV in asymptomatic samples based on time-series leaf hyperspectral data has reached variable accuracies between 60% and 90% using the K-Nearest Neighbors machine learning algorithm [25].

5. Conclusions

The findings of this study highlighted the potential of remote sensing as a valuable tool for the early detection and monitoring of CTV disease in citrus orchards. It can represent a rapid and non-destructive tool alternative to molecular techniques for plant disease detection. The ability to identify CTV-infected trees at an early stage can significantly contribute to effective disease management and control measures. Thus, alternative actions should be offered rather than the eradication of trees that have reached a severe stage of CTV infection with intense symptoms and visual indicators, resulting in in situ sampling to take place for validation. In general, this study highlights the applicability of multidisciplinary approaches to detect signals of CTV presence by acknowledging their interrelationships to increase the reliability of the individual procedures. The reliability varies in each case as particular factors play their role, but time and cost are also important. Surely, lab-based tests provide higher reliability for detecting CTV-infected trees in relation to remote sensing datasets, which offer lower costs and processing time but often decrease reliability. Similarly, factors such as spatial resolution also affect the scalability of optical and proximal sensing outcomes with regard to time, coverage area, reliability and cost. The analysis of satellite imageries and the NDVI time series allowed us to mark the decline in NDVI values in vegetation health dynamics through the years and served as a reliable marker for the respective year of affection. Other factors can have an impact on the NDVI values, such as drought or nutrient deficiencies, but the detected infected fields in conjunction with a decline in NDVI can be an initiative marker for further investigation of the limitations that can arise from their interrelationships. This study offers, through the integration of diverse approaches, a low-cost procedure toward the determination of markers for CTV presence and epidemiology in satellite imageries in a broad coverage area, providing decision-makers with the means to take action in advance, such as control measures. Overall, the integration of remote sensing techniques into CTV disease management holds promise for enhancing the resilience and sustainability of citrus orchards. This study can also provide crucial information and the means for developing sophisticated algorithms to be embedded within precision agriculture and smart agriculture systems at a smaller scale to monitor individual fields in detail.
As a future step, this study aimed to apply the Object-Based Image Analysis (OBIA) approach across the entire extent of the imagery to automatically detect and extract trees and their canopies, which seemed to be highly effective, facilitating subsequent image processing stages by reducing any spectral effects by low-lying sparse vegetation. Considering the high costs for acquiring high-spatial-resolution satellite imagery on a regular basis or the use of UAVs covering small-scale coverage areas, the use of low-cost alternative satellite imageries, like PlanetScope (Planet Labs, Berlin, Germany), will be explored to extend the temporal range of monitoring infected fields and further reduce costs. Their daily coverage can offer the capability to monitor and spot markers of CTV-infected fields in their early stages while determining their peak period more accurately, even within the week that it might occur. In addition, UAV hyperspectral imagery exploitation can be advantageous, as it consists of hundreds of spectral bands that can detect subtle changes in spectral reflectance and discriminate variations in canopies potentially related to earlier stages of plant diseases. That can be advantageous for more detailed statistical analysis and the examination of the correlations between the proximal spectroscopy outcomes and the phenotype variations in the optical satellite images to determine whether the genotype’s action is sole or a group combination.

Author Contributions

Conceptualization, A.V.A. and M.M.M.; methodology, A.V.A.; software, A.V.A., E.A. and M.M.M.; validation, A.V.A., N.T. and M.M.M.; formal analysis, A.V.A., N.T., E.A., K.P.F. and M.M.M.; investigation, A.V.A. and M.M.M.; resources, N.N.K. and M.M.M.; data curation, A.V.A., N.T., E.A. and M.M.M.; writing—original draft preparation, A.V.A. and M.M.M.; writing—review and editing, A.V.A., K.P.F., N.N.K. and M.M.M.; visualization, A.V.A., K.P.F., N.N.K. and M.M.M.; supervision, N.N.K.; project administration, M.M.M.; funding acquisition, M.M.M. All authors have read and agreed to the published version of the manuscript.

Funding

This study was funded in part by the European Regional Development Fund of the European Union and Greek national funds through the Operational Program Competitiveness, Entrepreneurship, and Innovation [RESEARCH—CREATE—INNOVATE, T2EDK-00431, 2020]; and in part by the European Union (NextGenerationEU) and Greek national funds through the National Recovery and Resilience Plan (Greece 2.0) [Flagship actions in interdisciplinary scientific areas with a special interest in the connection with the productive sector, TAEDR-0535675, 2023].

Institutional Review Board Statement

Not applicable.

Informed Consent Statement

Not applicable.

Data Availability Statement

The data presented in this study are available on request from the corresponding author.

Conflicts of Interest

The authors declare no conflicts of interest.

Appendix A

The ancillary datasets corresponding to NDVI and PCA outcomes are presented in Figure A1 and Figure A2, respectively.
Figure A1. The individual NDVI for the diverse satellite and UAV sensors for CF1 to CF4 CTV-infected fields. Greenish hues highlight healthy vegetation, while yellowish hues are unhealthy, such as the ones infected by CTV.
Sustainability 16 05748 g0a1
Figure A2. The individual PCA analysis for the diverse satellite sensors for CF1 to CF4 CTV-infected fields, with most of the information being compressed within Principal Component 1 (PC1).
Sustainability 16 05748 g0a2
Figure A3. In the proximity of the case study fields, there were trees, primarily found in nearby abandoned fields, with an observed strong reflectance in the near-infrared band which was associated with climbing plants growing on the citrus trees. For instance, (a) FCC 321, in the 2017 GeoEye-1 satellite image; (b) Near-infrared band (high values in black color) in the 2017 GeoEye-1 satellite image; (c) FCC 321, in the Pleiades satellite image; (d) Near-infrared band (high values in black color), in the Pleiades satellite image.
Sustainability 16 05748 g0a3aSustainability 16 05748 g0a3b
Table A1. Candidate CTV-infected fields based on the remote sensing satellite imageries methodology, host, number of collected samples and year of survey, and results of the CTV detection from all the samples. The RT-PCR results are presented as the number of infected samples per total number of collected samples and the infection frequency (%) is given in parenthesis. n.a.: not available samples.
Candidate FieldSurvey YearHostNo. Collected Samples20212022
Tissue-Print ELISART-PCRTissue-Print ELISART-PCR
CdF12021 autumnOrange30000
CdF22021 autumnOrange31 (33.4%)1 (33.4%)2 (66.7%)2 (66.7%)
CdF32021 autumnOrange2001 (50%)1 (50%)
CdF42021 autumnOrange32 (66.7%)2 (66.7%)3 (100%)3 (100%)
CdF52021 autumnOrange31 (33.4%)3 (100%)2 (66.7%)3 (100%)
CdF62022 springOrange2n.an.a1 (50%)1 (50%)
CdF72022 springOrange6n.an.a4 (66.6%)5 (83.4%)
CdF82022 springOrange8n.an.a4 (50%)6 (75%)
CdF92022 springOrange5n.an.a2 (40%)3 (60%)
Percentage of candidate CTV-infected trees being infected based on laboratory analyses354/14
(28.5%)
6/14
(43%)
19/35
(54.3%)
24/35
(68.57%)
Table A2. The eigenvalues for the individual multispectral satellite imageries and the percentage of covariance. PC 1 has the highest % of covariance.
WorldView-2Eigenvalues% of covariance
PC 18984.8666.58
PC 24343.1832.18
PC 3147.421
PC 418.010.1
Sum13,493.17100
PleiadesEigenvalues% of covariance
PC 1343,505.973.4
PC 21,200,056.8825.65
PC 33994.880.85
PC 4372.20.08
Sum467,928.88100
GeoEye-1Eigenvalues% of covariance
PC 142,036.7467
PC 220,359.2332.46
PC 3270.380.43
PC 453.930.08
Sum62,720.28100
Table A3. The factor loadings calculated for the individual multispectral satellite imageries WorldView-2 (A), Pleiades (B), Geoeye-1 (C).
A. WorldView-2
Factor loadingsPC 1PC 2PC 3PC 4
Band 10.350.05−0.370.85
Band 20.640.18−0.53−0.51
Band 30.650.010.750.04
Band 4−0.150.980.10.04
B. Pleiades
Factor loadingsPC 1PC 2PC 3PC 4
Band 10.66−0.43−0.60.054
Band 20.44−0.210.57−0.66
Band 30.33−0.160.540.74
Band 40.50.85−0.060.01
C. GeoEye-1
Factor loadingsPC 1PC 2PC 3PC 4
Band 10.12−0.46−0.510.7
Band 20.16−0.47−0.5−0.7
Band 30.12−0.710.690.012
Band 40.970.220.0630.03
Table A4. The confusion matrix, overall accuracy, kappa statistics, user’s and producer’s accuracy.
Confusion MatrixBuildingVegetationBare SoilShadowCTV-Infected TreesSparse Vegetation
Vegetation0410100
Bare soil0058000
Shadow0003000
CTV infection076013913
Sparse vegetation0010316
Overall Accuracy (OA)0.897
Kappa statistics0.85
User’s accuracy Producer’s accuracy
Vegetation0.97 Vegetation0.85
Bare soil0.96 Bare soil0.89
Shadow1 Shadow0.96
CTV infection0.84 CTV infection0.97
Sparse vegetation0.8 Sparse vegetation0.52

References

  1. FAO. FAOSTAT Database. 2020. Available online: http://www.fao.org/faostat/en/#data (accessed on 20 December 2023).
  2. Tennant, P.F.; Robinson, D.; Fisher, L.; Bennett, S.M.; Hutton, D.; Coates-Beckford, P.; McLaughlin, W. Diseases and pests of citrus (Citrus spp.). Tree For. Sci. Biotechnol. 2009, 3, 81–107. [Google Scholar]
  3. Bar-Joseph, M.; Marcus, R.; Lee, R.F. The continuous challenge of Citrus tristeza virus control. Annu. Rev. Phytopathol. 1989, 27, 291–316. [Google Scholar] [CrossRef]
  4. Moreno, P.; Ambrós, S.; Albiach-Martí, M.R.; Guerri, J.; Peña, L. Citrus tristeza virus: A pathogen that changed the course of the citrus industry. Mol. Plant Pathol. 2008, 9, 251–268. [Google Scholar] [CrossRef]
  5. Karasev, A.; Boyko, V.; Gowda, S.; Nikolaeva, O.; Hilf, M.; Koonin, E.; Niblett, C.; Cline, K.; Gumpf, D.; Lee, R.; et al. Complete Sequence of the Citrus Tristeza Virus RNA Genome. Virology 1995, 208, 511–520. [Google Scholar] [CrossRef] [PubMed]
  6. Sabade, A.; López, C.; Rubio, L.; Flores, R.; Guerri, J.; Moreno, P. Polymorphism of a specific region in gene p23 of Citrus tristeza virus allows discrimination between mild and severe isolates. Arch. Virol. 2003, 148, 2325–2340. [Google Scholar] [CrossRef] [PubMed]
  7. Sagheer, A.; Zhou, C.Y.; Zhou, Y.; Cao, M.J.; Wang, X.F. Distribution and research advances in Citrus tristeza virus. J. Integr. Agric. 2012, 11, 346–358. [Google Scholar]
  8. Bester, R.; Cook, G.; Maree, H.J. Citrus Tristeza Virus Genotype Detection Using High-Throughput Sequencing. Viruses 2021, 13, 168. [Google Scholar] [CrossRef] [PubMed]
  9. ELSTAT. 2019. Available online: http://www.statistics.gr/el/statistics/agr (accessed on 15 January 2024).
  10. Beris, D.; Malandraki, I.; Vassilakos, N.; Theologidis, I.; Rampou, A.; Kektsidou, O.; Massart, S.; Varveri, C. Association of Citrus Virus A to Citrus Impietratura Disease Symptoms. Phytopathology 2021, 111, 1782–1789. [Google Scholar] [CrossRef]
  11. Mathioudakis, M.M.; Tektonidis, N.; Karagianni, A.; Mikalef, L.; Gómez, P.; Hasiów-Jaroszewska, B. Incidence and Epidemiology of Citrus Viroids in Greece: Role of Host and Cultivar in Epidemiological Characteristics. Viruses 2023, 15, 605. [Google Scholar] [CrossRef]
  12. Katsarou, K.; Chiumenti, M.; Kalantidis, K.; Mathioudakis, M.M. First Report of Citrus Viroids Infecting Persian (Tahiti) Lime in Greece. Plant Dis. 2020, 104, 998. [Google Scholar] [CrossRef]
  13. Kyriakopoulou, P.E. Virus and virus like diseases of citrus in Greece and the Greek certification program. Int. Organ. Citrus Virol. Conf. Proc. 2002, 15, 408–411. [Google Scholar] [CrossRef]
  14. Dimou, D.; Drossopoulou, J.; Moschos, E.; Varveri, C.; Bem, F. First report of Citrus tristeza virus in Greece. Plant Dis. 2002, 86, 329. [Google Scholar] [CrossRef] [PubMed]
  15. Owen, C.; Mathioudakis, Μ.M.; Gazivoda, A.; Gal, P.; Nol, N.; Kalliampakou, K.; Figas, A.; Bellan, A.; Iparaguirre, A.; Rubio, L.; et al. Evolution and molecular epidemiology of Citrus tristeza virus on Crete: Recent introduction of a severe strain. J. Phytopathol. 2014, 162, 839–843. [Google Scholar] [CrossRef]
  16. Chatzivassiliou, E.K.; Nolasco, G. Detection of a new variant of Citrus tristeza virus in Greek citrus crops. Phytopathol. Mediterr. 2015, 53, 140–147. [Google Scholar]
  17. Varveri, C.; Olmos, A.; Pina, J.A.; Marroquín, C.; Cambra, M. Biological and molecular characterization of a distinct Citrus tristeza virus isolate originating from a lemon tree in Greece. Plant Pathol. 2015, 64, 792–798. [Google Scholar] [CrossRef]
  18. Ghosh, D.K.; Kokane, S.B.; Gowda, S. Development of a reverse transcription recombinase polymerase based isothermal amplification coupled with lateral flow immunochromatographic assay (CTV-RT-RPA-LFICA) for rapid detection of Citrus tristeza virus. Sci. Rep. 2020, 10, 20593. [Google Scholar] [CrossRef]
  19. Wang, Y.M.; Ostendorf, B.; Gautam, D.; Habili, N.; Pagay, V. Plant Viral Disease Detection: From Molecular Diagnosis to Optical Sensing Technology—A Multidisciplinary Review. Remote Sens. 2022, 14, 1542. [Google Scholar] [CrossRef]
  20. Beck, P.S.; Martínez Sanchez, A.L.; Di Leo, M.; Chemin, Y.; Caudullo, G.; de la Fuente, B.; Zarco-Tejada, P.J. Remote Sensing in support of Plant Health Measures. In Findings from the Canopy Health Monitoring (CanHeMon) Project; EUR 29724 EN; Publications Office of the European Union: Luxembourg, 2019; ISBN 978-92-76-02051-6. JRC115403. [Google Scholar] [CrossRef]
  21. Terentev, A.; Dolzhenko, V.; Fedotov, A.; Eremenko, D. Current State of Hyperspectral Remote Sensing for Early Plant Disease Detection: A Review. Sensors 2022, 22, 757. [Google Scholar] [CrossRef]
  22. Zhang, J.; Huang, Y.; Pu, R.; Gonzalez-Moreno, P.; Yuan, L.; Wu, K.; Huang, W. Monitoring plant diseases and pests through remote sensing technology: A review. Comput. Electron. Agric. 2019, 165, 104943. [Google Scholar] [CrossRef]
  23. Gualano, S.; Santoro, F.; Djelouah, K.; D’Onghia, A.M. Proximal and remote sensing in the monitoring of Citrus Tristeza Virus (CTV) infected trees: Preliminary results. In Proceedings of the XXVIII International Horticultural Congress on Science and Horticulture for People (IHC2010): International Symposium on the Challenge for a Sustainable Production, Protection and Consumption of Mediterranean Fruits and Nuts, Lisbon, Portugal, 22–27 August 2010; Article number: 940_88. pp. 641–646. [Google Scholar]
  24. Janssen, L.L.F.; Bakker, W.H. Principles of Remote Sensing: An Introductory Textbook, 2nd ed.; ITC Educational Textbook Series; International Institute for Aerospace Survey and Earth Sciences: Enschede, The Netherlands, 2001; p. 180. [Google Scholar]
  25. Afonso, A.M.; Guerra, R.; Cavaco, A.M.; Pinto, P.; Andrade, A.; Duarte, A.; Power, D.M.; Marques, N.T. Identification of asymptomatic plants infected with Citrus tristeza virus from a time series of leaf spectral characteristics. Comput. Electron. Agric. 2017, 141, 340–350. [Google Scholar] [CrossRef]
  26. Deng, X.; Zhu, Z.; Yang, J.; Zheng, Z.; Huang, Z.; Yin, X.; Wei, S.; Lan, Y. Detection of Citrus Huanglongbing Based on Multi-Input Neural Network Model of UAV HRS. Remote Sens. 2020, 12, 2678. [Google Scholar] [CrossRef]
  27. Golhani, K.; Balasundram, S.K.; Vadamalai, G.; Pradhan, B. Use of reflectance spectroscopy as a tool for screening viroid-inoculated oil palm seedlings. OAJAR 2017, 2, 1–4. [Google Scholar]
  28. Santoro, F.; Gualano, S.; Djelouah, K.; Guario, A.; D’Onghia, A.M. Remote sensing to support the monitoring of Citrus tristeza virus (CTV) infected areas. In Citrus Tristeza Virus and Toxoptera Citricidus: A Serious Threat to the Mediterranean Citrus Industry; D’Onghia, A.M., Djelouah, K., Roistacher, C.N., Eds.; Options Méditerranéennes: Série B. Etudes et Recherches; n. 65; CIHEAM: Bari, Italy, 2009; pp. 165–171. [Google Scholar]
  29. Selvaraja, S.; Balasundram, S.K.; Vadamalai, G.; Husni, M.H.A.; Khosla, R. Remote Sensing as a Tool to Assess Orange Spotting Disease in Oil Palm (Elaies guineensis). Mitt. Klosterneubg. 2014, 64, 12–26. [Google Scholar]
  30. Tian, X.; Fan, S.; Huang, W.; Wang, Z.; Li, J. Detection of early decay on citrus using hyperspectral transmittance imaging technology coupled with principal component analysis and improved watershed segmentation algorithms. Postharvest Biol. Technol. 2020, 161, 111071. [Google Scholar] [CrossRef]
  31. Vanella, D.; Consoli, S.; Ramírez-Cuesta, J.M.; Tessitori, M. Suitability of the MODIS-NDVI Time-Series for a Posteriori Evaluation of the Citrus Tristeza Virus Epidemic. Remote Sens. 2020, 12, 1965. [Google Scholar] [CrossRef]
  32. Zarco-Tejada, P.J.; Camino, C.; Beck, P.S.A.; Calderon, R.; Hornero, A.; Hernandez-Clemente, R.; Kattenborn, T.; Montes-Borrego, M.; Susca, L.; Morelli, M.; et al. Previsual symptoms of Xylella fastidiosa infections revealed in spectral plant-trait alterations. Nat. Plants 2018, 4, 432–439. [Google Scholar] [CrossRef] [PubMed]
  33. Zhu, H.; Chu, B.; Zhang, C.; Liu, F.; Jiang, L.; He, Y. Hyperspectral imaging for presymptomatic detection of tobacco disease with successive projections algorithm and machine-learning classifiers. Sci. Rep. 2017, 7, 4125. [Google Scholar] [CrossRef]
  34. Calderon, R.; Navas-Cortes, J.A.; Lucena, C.; Zarco-Tejada, P.J. High resolution airborne hyperspectral and thermal imagery for early detection of Verticillium wilt of olive using fluorescence, temperature and narrow-band spectral indices. Remote Sens. Environ. 2013, 139, 231–245. [Google Scholar] [CrossRef]
  35. Zhang, C.; Kovacs, J.M. The application of small unmanned aerial systems for precision agriculture: A review. Precis. Agric. 2012, 13, 693–712. [Google Scholar] [CrossRef]
  36. Radoglou-Grammatikis, P.; Sarigiannidis, P.; Lagkas, T.; Moscholios, I. A compilation of UAV applications for precision agriculture. Comput. Netw. 2020, 172, 107148. [Google Scholar] [CrossRef]
  37. Shegani, M.; Tsikou, D.; Velimirovic, A.; Afifi, H.; Karayianni, A.; Gazivoda, A.; Manevska, K.; Manakos, I.; Livieratos, I.C. Citrus tristeza virus on the island of Crete: A survey and detection protocol applications. J. Plant Pathol. 2012, 94, 71–78. [Google Scholar]
  38. Argyriou, A.V.; Sarris, A.; Teeuw, R.M. Using geoinformatics and geomorphometrics to quantify the geodiversity of Crete, Greece. Int. J. Appl. Earth Obs. Geoinf. 2016, 51, 47–59. [Google Scholar] [CrossRef]
  39. Fletcher, R.S.; Skaria, M. Response of ratio vegetation indices to foot rot-infected citrus trees. Evaluating airborne normalized difference vegetation index imagery for citrus orchard surveys. Int. J. Remote Sens. 2004, 25, 3967–3972. [Google Scholar] [CrossRef]
  40. Singh, A. Principal components analysis in remote sensing. In Proceedings of the IGARSS 93—IEEE International Geoscience and Remote Sensing Symposium, Tokyo, Japan, 18–21 August 1993; Volume 4, pp. 1680–1682. [Google Scholar] [CrossRef]
  41. Gonzalez, R.C.; Wintz, P. Digital Image Processing; Addison-Wesley: Boston, MA, USA, 1977. [Google Scholar]
  42. Ortega-Terol, D.; Hernandez-Lopez, D.; Ballesteros, R.; Gonzalez-Aguilera, D. Automatic Hotspot and Sun Glint Detection in UAV Multispectral Images. Sensors 2017, 17, 2352. [Google Scholar] [CrossRef] [PubMed]
  43. Mathioudakis, Μ.Μ.; Saponari, M.; Hasiów-Jaroszewska, B.; Elbeaino, T.; Koubouris, G. Detection of viruses in olive cultivars in Greece, using a rapid and effective RNA extraction method, for certification of virus-tested propagation material. Phytopathol. Mediterr. 2020, 59, 203–211. [Google Scholar] [CrossRef]
  44. Nolasco, G.; Sequeira, Z.; Soares, C.; Mansinho, A.; Bailey, A.M.; Niblett, C.L. Asymmetric PCR ELISA: Increased sensitivity and reduced costs for the detection of plant viruses. Eur. J. Plant Pathol. 2002, 108, 293–298. [Google Scholar] [CrossRef]
  45. Zarco-Tejada, P.J.; Hornero, A.; Beck, P.S.A.; Kattenborn, T.; Kempeneers, P.; Hernández-Clemente, R. Chlorophyll content estimation in an open-canopy conifer forest with Sentinel-2A and hyperspectral imagery in the context of forest decline. Remote Sens. Environ. 2019, 223, 320–335. [Google Scholar] [CrossRef]
  46. Breiman, L. Random Forests. Mach. Learn. 2001, 45, 5–32. [Google Scholar] [CrossRef]
  47. Belgiu, M.; Dragut, L. Random forest in remote sensing: A review of applications and future directions. ISPRS J. Photogramm. Remote Sens. 2016, 114, 24–31. [Google Scholar] [CrossRef]
  48. Chan, J.C.W.; Paelinckx, D. Evaluation of Random Forest and Adaboost tree-based ensemble classification and spectral band selection for ecotope mapping using airborne hyperspectral imagery. Remote Sens. Environ. 2008, 112, 2999–3011. [Google Scholar] [CrossRef]
  49. Feng, L.; Guo, M.; Wang, W.; Chen, Y.; Shi, Q.; Guo, W.; Lou, Y.; Kang, H.; Chen, Z.; Zhu, Y. Comparative Analysis of Machine Learning Methods and a Physical Model for Shallow Landslide Risk Modeling. Sustainability 2023, 15, 6. [Google Scholar] [CrossRef]
  50. Sheykhmousa, M.; Mahdianpari, M.; Ghanbari, H.; Mohammadimanesh, F.; Ghamisi, P.; Homayouni, S. Support vector machine versus random forest for remote sensing image classification: A meta-analysis and systematic review. IEEE J. Sel. Top. Appl. Earth Obs. Remote Sens. 2020, 13, 6308–6325. [Google Scholar] [CrossRef]
  51. Wei, X.; Johnson, M.A.; Langston, D.B., Jr.; Mehl, H.L.; Li, S. Identifying optimal wavelengths as disease signatures using hyperspectral sensor and machine learning. Remote Sens. 2021, 13, 2833. [Google Scholar] [CrossRef]
  52. Adelabu, S.; Mutanga, O.; Adam, E. Evaluating the impact of red-edge band from Rapideye image for classifying insect defoliation levels. ISPRS J. Photogramm. Remote Sens. 2014, 95, 34–41. [Google Scholar] [CrossRef]
  53. Feng, Z.; Zhang, H.; Duan, J.; He, L.; Yuan, X.; Gao, Y.; Liu, W.; Li, X.; Feng, W. Improved Spectral Detection of Nitrogen Deficiency and Yellow Mosaic Disease Stresses in Wheat Using a Soil Effect Removal Algorithm and Machine Learning. Remote Sens. 2023, 15, 2513. [Google Scholar] [CrossRef]
  54. Thenkabail, P.S.; Lyon, J.G.; Huete, A. Advances in hyperspectral remote sensing of vegetation and agricultural croplands. In Hyperspectral Remote Sensing of Vegetation; Thenkabail, P.S., Lyon, J.G., Huete, A., Eds.; CRC Press: Boca Raton, FL, USA, 2011; pp. 3–35. [Google Scholar]
  55. Wang, D.; Vinson, R.; Holmes, M.; Seibel, G.; Bechar, A.; Nof, S.; Tao, Y. Early Detection of Tomato Spotted Wilt Virus by Hyperspectral Imaging and Outlier Removal Auxiliary Classifier Generative Adversarial Nets (OR-AC-GAN). Sci. Rep. 2019, 9, 4377. [Google Scholar] [CrossRef]
  56. Kouadio, L.; El Jarroudi, M.; Belabess, Z.; Laasli, S.-E.; Roni, M.Z.K.; Amine, I.D.I.; Mokhtari, N.; Mokrini, F.; Junk, J.; Lahlali, R. A Review on UAV-Based Applications for Plant Disease Detection and Monitoring. Remote Sens. 2023, 15, 4273. [Google Scholar] [CrossRef]
  57. Siebring, J.; Valente, J.; Franceschini, M.H.D.; Kamp, J.; Kooistra, L. Object-based image analysis applied to low altitude aerial imagery for potato plant trait retrieval and pathogen detection. Sensors 2019, 19, 5477. [Google Scholar] [CrossRef]
  58. Yamamoto, K.; Togami, T.; Yamaguchi, N. Super-resolution of plant disease images for the acceleration of image-based phenotyping and vigor diagnosis in agriculture. Sensors 2017, 17, 2557. [Google Scholar] [CrossRef]
  59. Abdulridha, J.; Ampatzidis, Y.; Qureshi, J.; Roberts, P. Laboratory and UAV-based identification and classification of tomato yellow leaf curl, bacterial spot, and target spot diseases in tomato utilizing hyperspectral imaging and machine learning. Remote Sens. 2020, 12, 2732. [Google Scholar] [CrossRef]
Figure 1. The Area of Interest (AOI), Vatolakos region, in western area of Crete Island, Greece (Source: Google Earth, 2024). The AOI and the primary case study fields to be examined are characterized by flat surface terrain as derived by the Digital Elevation Model (DEM) of ALOS-Palsar (12.5 m spatial resolution).
Sustainability 16 05748 g001
Figure 2. The four fields (CF1 to CF4) selected as case studies, in which infected trees with CTV were determined from previous field surveys and laboratory analysis during the years 2020 and 2021 (Source: UAV imagery, date acquisition: 13 July 2022).
Sustainability 16 05748 g002
Figure 3. Flowchart of the methodological framework.
Sustainability 16 05748 g003
Figure 4. Visualization of the NDVI mean values in a UAV image and the Sentinel-2 NDVI time-series flowcharts during the period 1 January 2017–14 June 2023 for the infected case study fields (A) CF1, (B) CF2, (C) CF3 and (D) CF4. In the figures (left) the reddish hues, with lower NDVI mean values, indicate the distribution of unhealthy vegetation within the field. In the graphs (right), a drop in the NDVI mean average values was observed in the latter years during summertime. CTV was detected during (A) 2021 in CF1, while the NDVI time series indicated a drop in NDVI values during the summer of 2019 onwards (red line), (B) 2021 in CF2, while the NDVI time series indicated a drop in NDVI values during the summer of 2021 onwards (red line), (C) 2020 in CF3, while the NDVI time series indicated a drop in NDVI values during the summer of 2019 onwards (red line) and (D) 2020 in CF4, while the NDVI time series indicated a drop in NDVI values during the summer of 2019 onwards (red line). The black line indicates the abrupt drop in NDVI values due to the eradication of the field ((A) after 2022, (C) during summer 2021). The green line indicates the healthy status of the field from 2017 to 2018 (A,C,D) or 2017 to 2020 (B).
Sustainability 16 05748 g004
Figure 5. The False Color Composite (FCCs) of natural color (RGB 321) for the satellite imageries (A) GeoEye-1 (acquisition: 2 June 2017), (B) Pleiades (acquisition: 28 July 2018), (C) Worldview-2 (acquisition: 21 May 2021) and (D) the UAV image (acquisition: 13 July 2022) (D). Case study fields CF1 to CF4 are indicated in red boxes.
Sustainability 16 05748 g005
Figure 6. FCCs of three different satellite images in Zoom, (A) GeoEye-1 (acquisition date: 2 June 2017), (B) Pleiades (acquisition date: 28 July 2018), (C) WorldView-2 (acquisition date: 21 May 2021) consisting of the RED-Principal Component 1-NDVI in an RGB composition highlighting specific trees infected by CTV virus from the case study field CF1 (in red box). In the yellow asterisk, the CTV-infected trees were detected as positive during 2020 and 2021. Healthy vegetation appears in bluish hues, while the infected trees are in darker brownish/yellowish hues.
Sustainability 16 05748 g006
Figure 7. The initial four case study fields (CF1 to CF4) in conjunction with the nine candidate fields with CTV-infected trees (CdF1 to CdF9), as suggested by the satellite/UAV imageries techniques, overlaid in WorldView-2 (date: May 2021) RGB combination Red-PC1-NDVI.
Sustainability 16 05748 g007
Figure 8. Suggested AOI with potential markers of infected CTV trees, as shown in (A) in RGB 321 (natural color), (B) in NDVI visualization (green hues show healthy vegetation) from UAV imagery (acquisition date July 2022). The variations of the detected markers might indicate the number of genotypes present on each infected tree, either existing as sole or more than one.
Sustainability 16 05748 g008
Figure 9. The UAV image (acquisition date 13 July 2022) visualization with FCC (RGB 321) (left images) and the RF outcomes (right images) for the case study filed. (A) CF2, and candidate fields (B) CdF4, (C) CdF6, (D) CdF7, all infected with CTV. Reddish hues indicate the CTV-infected trees.
Sustainability 16 05748 g009
Table 1. The individual stages and datasets of the methodological framework.
StageDatasetsMethodsOutcomes
Early detection of fields with CTV using remote sensingSentinel-2Time-series of vegetation index NDVIVegetation dynamics related to CTV-infected fields
Detection and monitoring of trees with CTV using remote sensingGeoEye-1
Pleiades
WorldView-2
UAV
-
Vegetation index (NDVI)
-
Principal Component Analysis (PCA)
Detection of candidate CTV-infected trees with FCCs
ValidationLeaf samples
-
Field survey sampling
-
Serological and molecular test
-
Spectroscopic analysis
Positive candidate CTV-infected trees
Semi-automatic machine learning procedure of CTV detection and accuracy assessmentTraining samples of CTV-infected trees
-
Random Forest (RF) machine learning
Semi-automatic detection of CTV-infected trees based on training samples
Table 2. The acquisition of the high-spatial-resolution satellite imageries used for the CTV monitoring.
Satellite SensorDate of AcquisitionSatellite Sensor Spatial Resolution (in Meters) and WavelengthsCoordinate System
GeoEye-12 June 20170.41 m in panchromatic
1.65 m in multispectral bands
Blue: 450–510 nm, Green: 520–580 nm, Red: 655–690 nm, Near-infrared: 780–920 nm
WGS UTM Zone 34N
Pleiades28 July 20180.7 m in panchromatic
2.8 m in multispectral bands
Blue: 450–530 nm, Green: 510–590 nm, Red: 620–700 nm, Near-infrared: 775–915 nm
WGS UTM Zone 34N
Worldview-221 May 20210.41 m in panchromatic
1.64 m in multispectral bands
Blue: 450–510 nm, Green: 510–580 nm, Red: 630–690 nm, Near-infrared: 770–895 nm
WGS UTM Zone 34N
Table 3. The NDVI measurements were taken through the spectroscopy analysis of the leaf sample collected in the field in relation to the ones derived from the UAV imagery (date acquisition: July 2022).
NDVIGround Truth
UAV July 2022-RGB321SpectroscopyUAVStandard DeviationInfected by CTV
Sustainability 16 05748 i0010.7300.7600.018No
(healthy sample)
Sustainability 16 05748 i0020.6400.4900.110Yes
Sustainability 16 05748 i0030.6200.7000.056Yes
Sustainability 16 05748 i0040.5870.5850.002Yes
Sustainability 16 05748 i0050.5200.5800.040Yes
Sustainability 16 05748 i0060.6700.7000.025Yes
Sustainability 16 05748 i0070.6300.6600.022Yes
Disclaimer/Publisher’s Note: The statements, opinions and data contained in all publications are solely those of the individual author(s) and contributor(s) and not of MDPI and/or the editor(s). MDPI and/or the editor(s) disclaim responsibility for any injury to people or property resulting from any ideas, methods, instructions or products referred to in the content.

