Article

The Effect of Carbon Quota Policy on Environmental Sustainability of Power Supply Chain

Shenzhen International Graduate School, Tsinghua University, 2279 Lishui Road, Shenzhen 518055, China
*
Author to whom correspondence should be addressed.
Sustainability 2024, 16(13), 5787; https://doi.org/10.3390/su16135787
Submission received: 31 May 2024 / Revised: 22 June 2024 / Accepted: 2 July 2024 / Published: 7 July 2024

Abstract

:
As is well known, limiting carbon emissions is an important link in mitigating global climate change. Carbon quotas are a widely used policy tool by governments around the world without increasing the financial burden on the government. To study the impact of carbon quota policies on the clean transformation of the key carbon emitting industry—the power industry, we established a duopoly model and conducted an analysis and numerical simulation. The research has found that the effectiveness of carbon quota policies is closely related to the level of competition within the power supply chain and is also influenced by the market share of clean energy power generation enterprises. Moreover, in some cases, it may have the opposite effect.

1. Introduction

Global climate change is one of the most important challenges of the 21st century [1]. It is characterized by rising global temperatures, melting permafrost [2], habitat loss for animals, increased frequency of extreme weather events, and rising sea levels. These changes have significant consequences for natural ecosystems [3,4], human health, and economic stability. For instance, the increase in global temperatures leads to the melting of polar ice caps, contributing to sea level rise and the subsequent displacement of coastal communities. Extreme weather events, such as hurricanes, floods, and droughts, are becoming more frequent and severe, causing widespread damage to infrastructure and agriculture [5,6].
The green transformation of supply chains is essential for addressing climate change, especially in extended supply chains involving stakeholders in developing countries. These countries often have lower awareness and adoption of green technologies due to economic and developmental constraints. Addressing climate change requires a systematic approach that includes the green transition of stakeholders globally, not just in developed regions like Europe [7,8,9]. A comprehensive global strategy is needed to ensure all parts of the supply chain adopt sustainable practices [10,11,12].
The use of fossil fuels (including coal, natural gas, oil, etc.) has greatly increased the emissions of global greenhouse gases, and the global warming caused by it also leads to the melting of permafrost, which releases a large amount of carbon solidified by permafrost into the environment, promoting the process of global warming and forming a very unfavorable vicious circle [2,13]. In order to break this vicious cycle, reducing industrial carbon emissions so that the total carbon emissions can turn to a downward trend is the most feasible behavior for humans to curb greenhouse gas emissions. Modeling and other findings by some scholars point to a troubling problem: based on the existing natural conditions and greenhouse gas emissions data, large amounts of greenhouse gases released from permafrost could hinder the goal set by the Paris Climate Agreement to limit the increase in world temperature to 1.5 degrees Celsius [14,15].
Greening the power sector is a key part of reducing carbon emissions. Its green transformation can not only reduce the carbon emissions brought by power generation but also affect the green transformation process of its downstream industries. For example, the transition to electric vehicles (EVs) is a key component of reducing carbon emissions in the transport sector. However, this transition requires the development of an extensive charging infrastructure, which, in turn, requires significant energy resources. Building a supply chain model to provide enough environmentally acceptable power for EV charging stations is a complex challenge. In addition, the expansion in demand for clean energy from electric vehicles to other electricity consumers, such as the artificial intelligence industry, emphasizes the need for reliable renewable energy supplies [16,17,18].
In the context of the growing maturity of clean energy generation technology, green energy, that is, energy that does not produce greenhouse gas emissions during use, including solar, wind, water, etc., is being used more efficiently. Most countries and regions in the world have introduced relevant policies to control carbon emissions from industries with a greater impact on the environment [19,20]. With electricity as a secondary energy, the current main production methods include burning fossil energy to produce energy thermal power generation and, through the use of clean energy generation technology (including solar photovoltaic technology, high-altitude wind power technology, etc.), to convert clean energy into electricity. Today, the main components of the electricity supply chain include raw material suppliers (fossil energy producers and clean energy generation technology and equipment providers), power generation companies (thermal power companies, clean energy generation companies), and electricity consumers [21,22,23]. In this supply chain, the main greenhouse gas emissions come from thermal power generation enterprises, so this paper focuses on the transformation of power generation enterprises in the power supply chain under the influence of policies.
Compared with another widely used carbon tax policy, the policy of carbon quota and the establishment of the carbon trading market, carbon trading directly points to carbon emissions, and the effect of emission reduction is more clear. The introduction and adjustment of the policy almost does not involve complicated administrative processes such as legislation, and the procedure is relatively simple, the adjustment is faster, and the policy is more flexible. In addition, the establishment of the carbon trading market makes carbon quota a market exchangeable product so that it has the natural attributes of finance; can attract more participation from banks, funds, and enterprises; and improve the efficiency of resource allocation. More importantly, as a global market, the carbon trading market can better prevent enterprises from moving to countries with loose environmental policies due to carbon tax, resulting in industrial outflow from countries with carbon tax policies [24].
As the power industry is a pillar industry for the people’s livelihood, it may be subject to strong government regulation [25]. In this study, a three-level coordination game model [26,27] is proposed, including a two-level supply chain and government decision-making body composed of thermal power generation enterprises and clean energy power generation enterprises as suppliers and transmission and distribution grids as retailers. In the process of slowing down the demand growth of the electricity market, gradually increasing the competition within the electricity supply chain, gradually promoting the carbon quota policy, and establishing and improving the carbon trading market, the optimal carbon quota level of the government and the clean transformation degree of the power supply chain made by the power generation enterprises in the power supply chain are determined. In the competition within the supply chain, due to the rapid development of clean energy power generation and policy support, it will be a leader in determining the level of its technology investment and influencing the decision-making of the government.
While the previous research has extensively examined the implications of carbon quota policies on the power industry, focusing on economic and environmental outcomes [28,29], there remains a significant gap in understanding the dynamic interactions between these policies and the internal competition within power supply chains. The existing studies often overlook the varying levels of competition between thermal and clean energy power generation enterprises and the influence of these policies on technological innovation and market share distribution within the power supply chain. To address these gaps, this study aims to analyze the competitive dynamics within the power supply chain under carbon quota policies by establishing a Stackelberg model. Specifically, we hypothesize the following:
  • The implementation of carbon quota policies increases the level of technological innovation investment in clean energy power generation enterprises more than in thermal power generation enterprises.
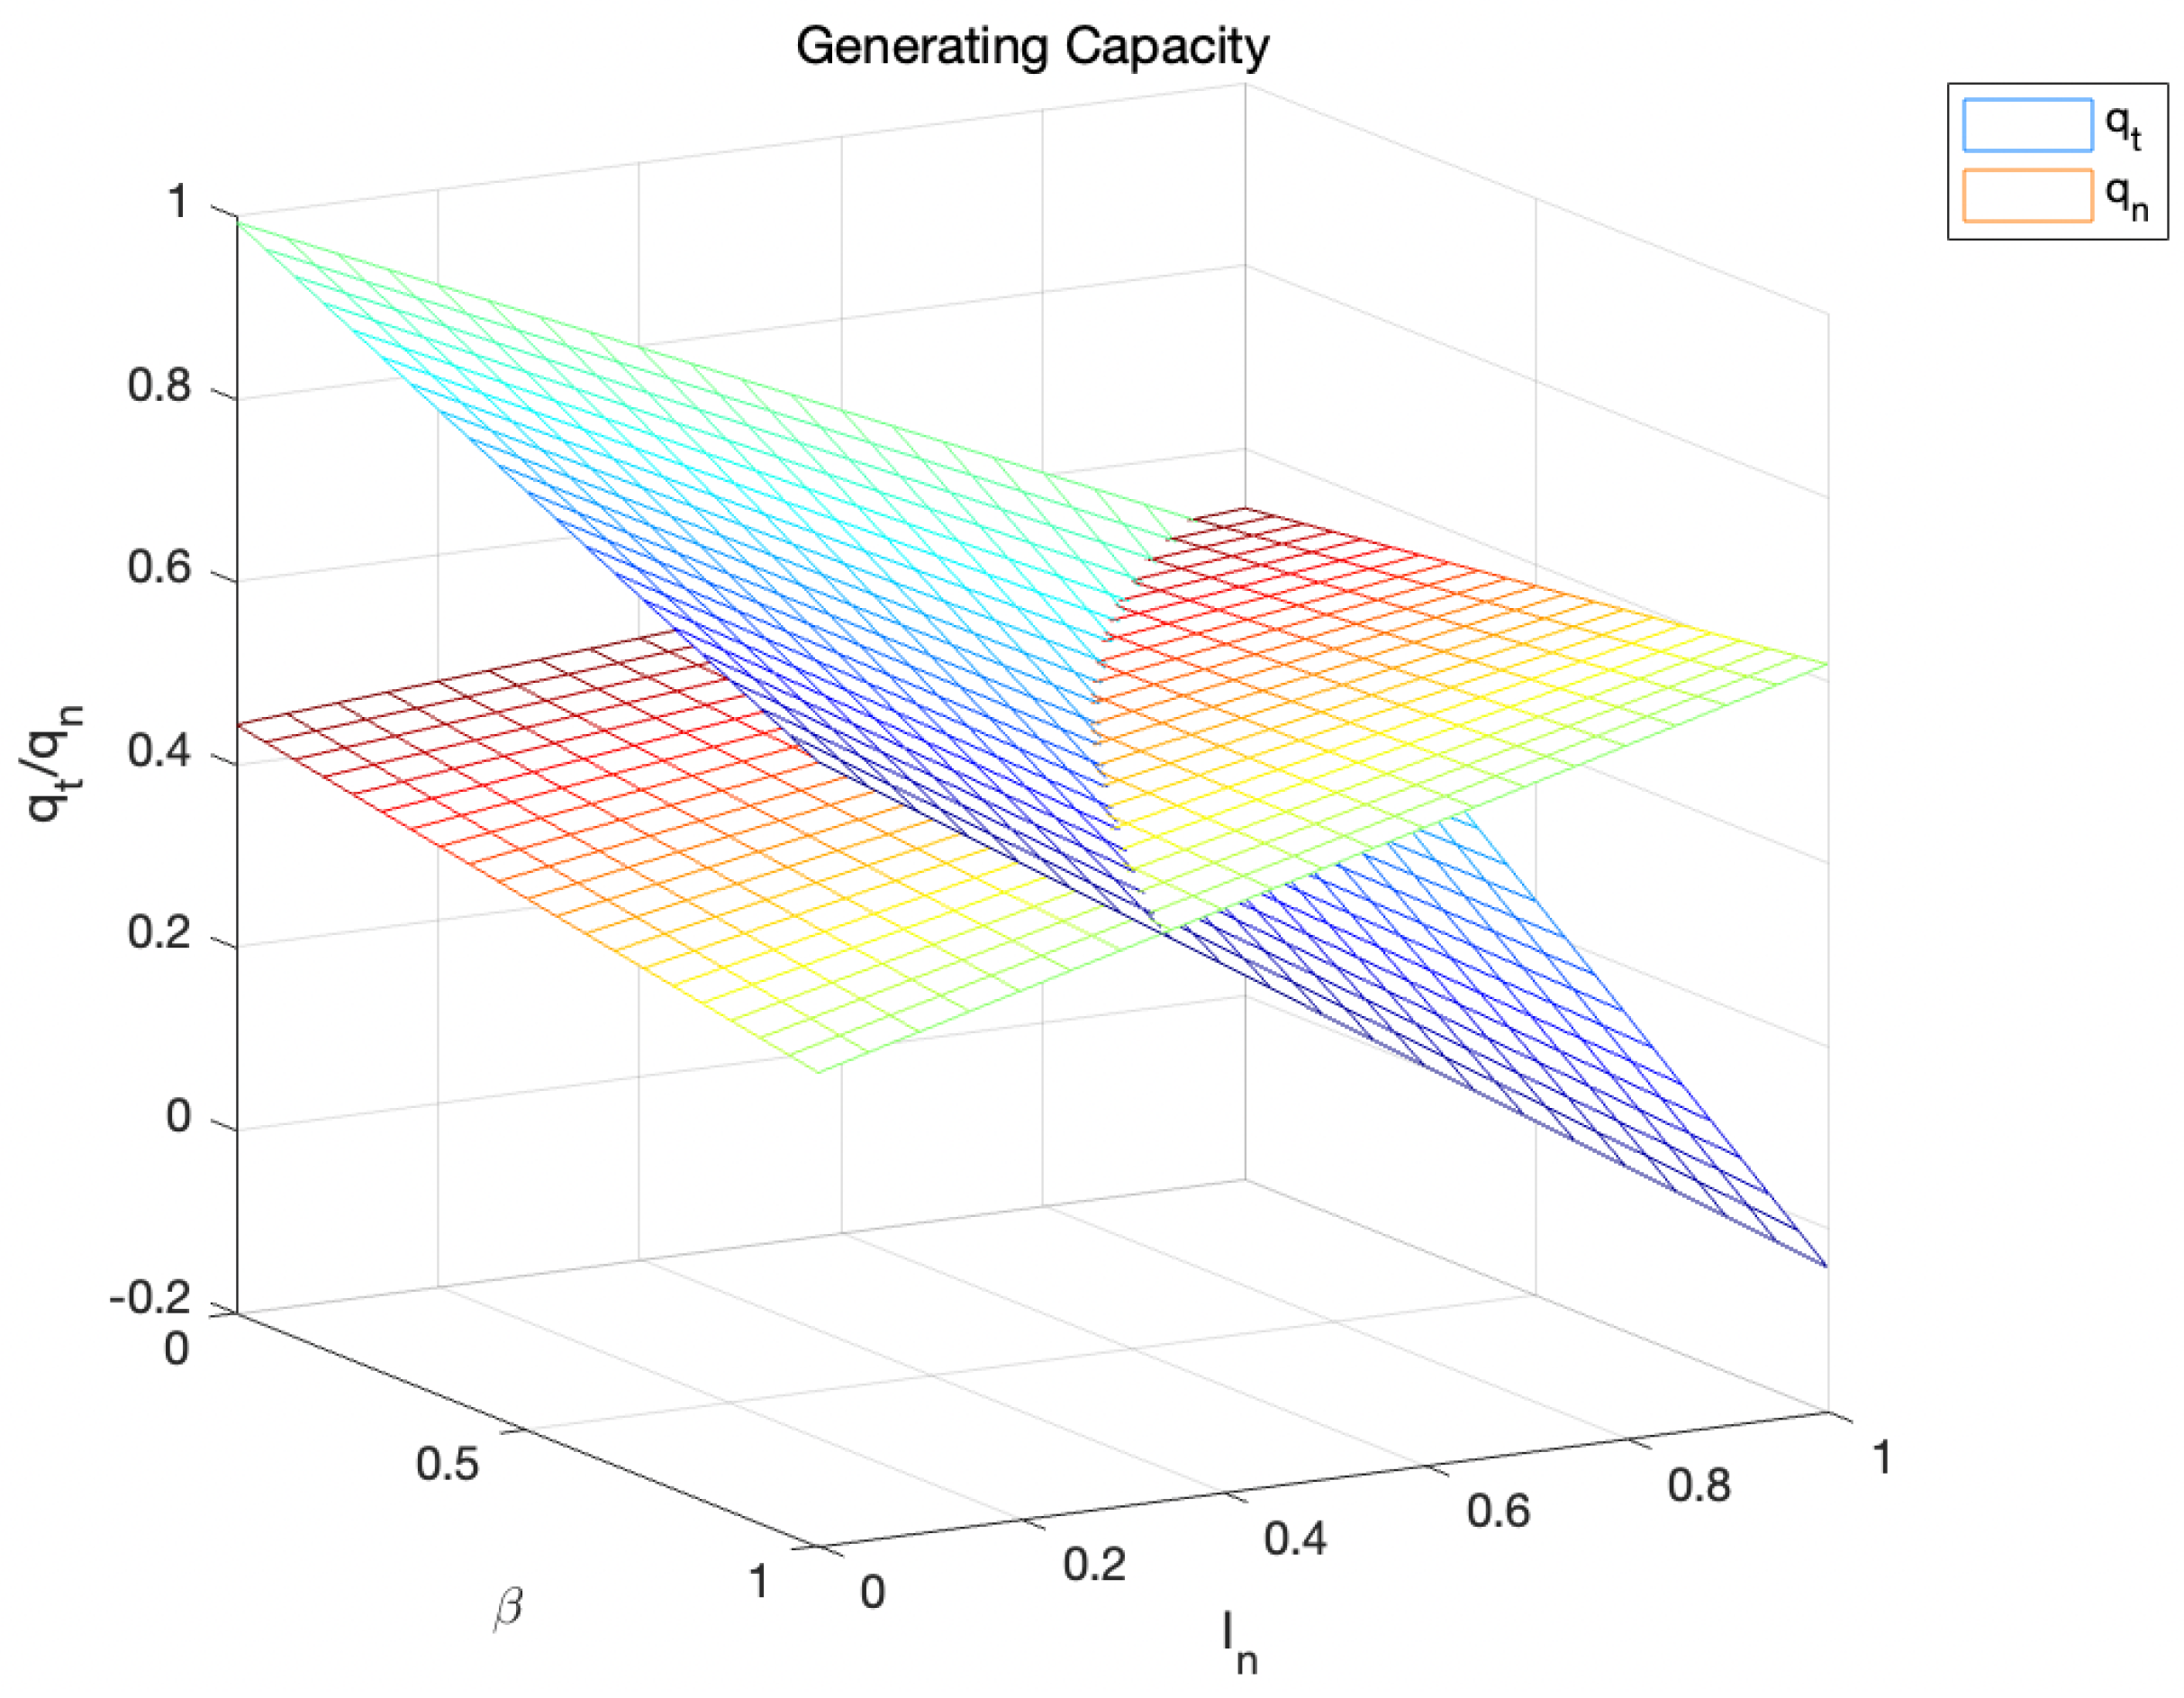
  • Higher levels of competition within the power supply chain reduce the overall production output of thermal power generation enterprises but do not significantly affect the output of clean energy power generation enterprises.
  • The implementation of a carbon quota policy will effectively reduce the environmental cost borne by the power supply chain.
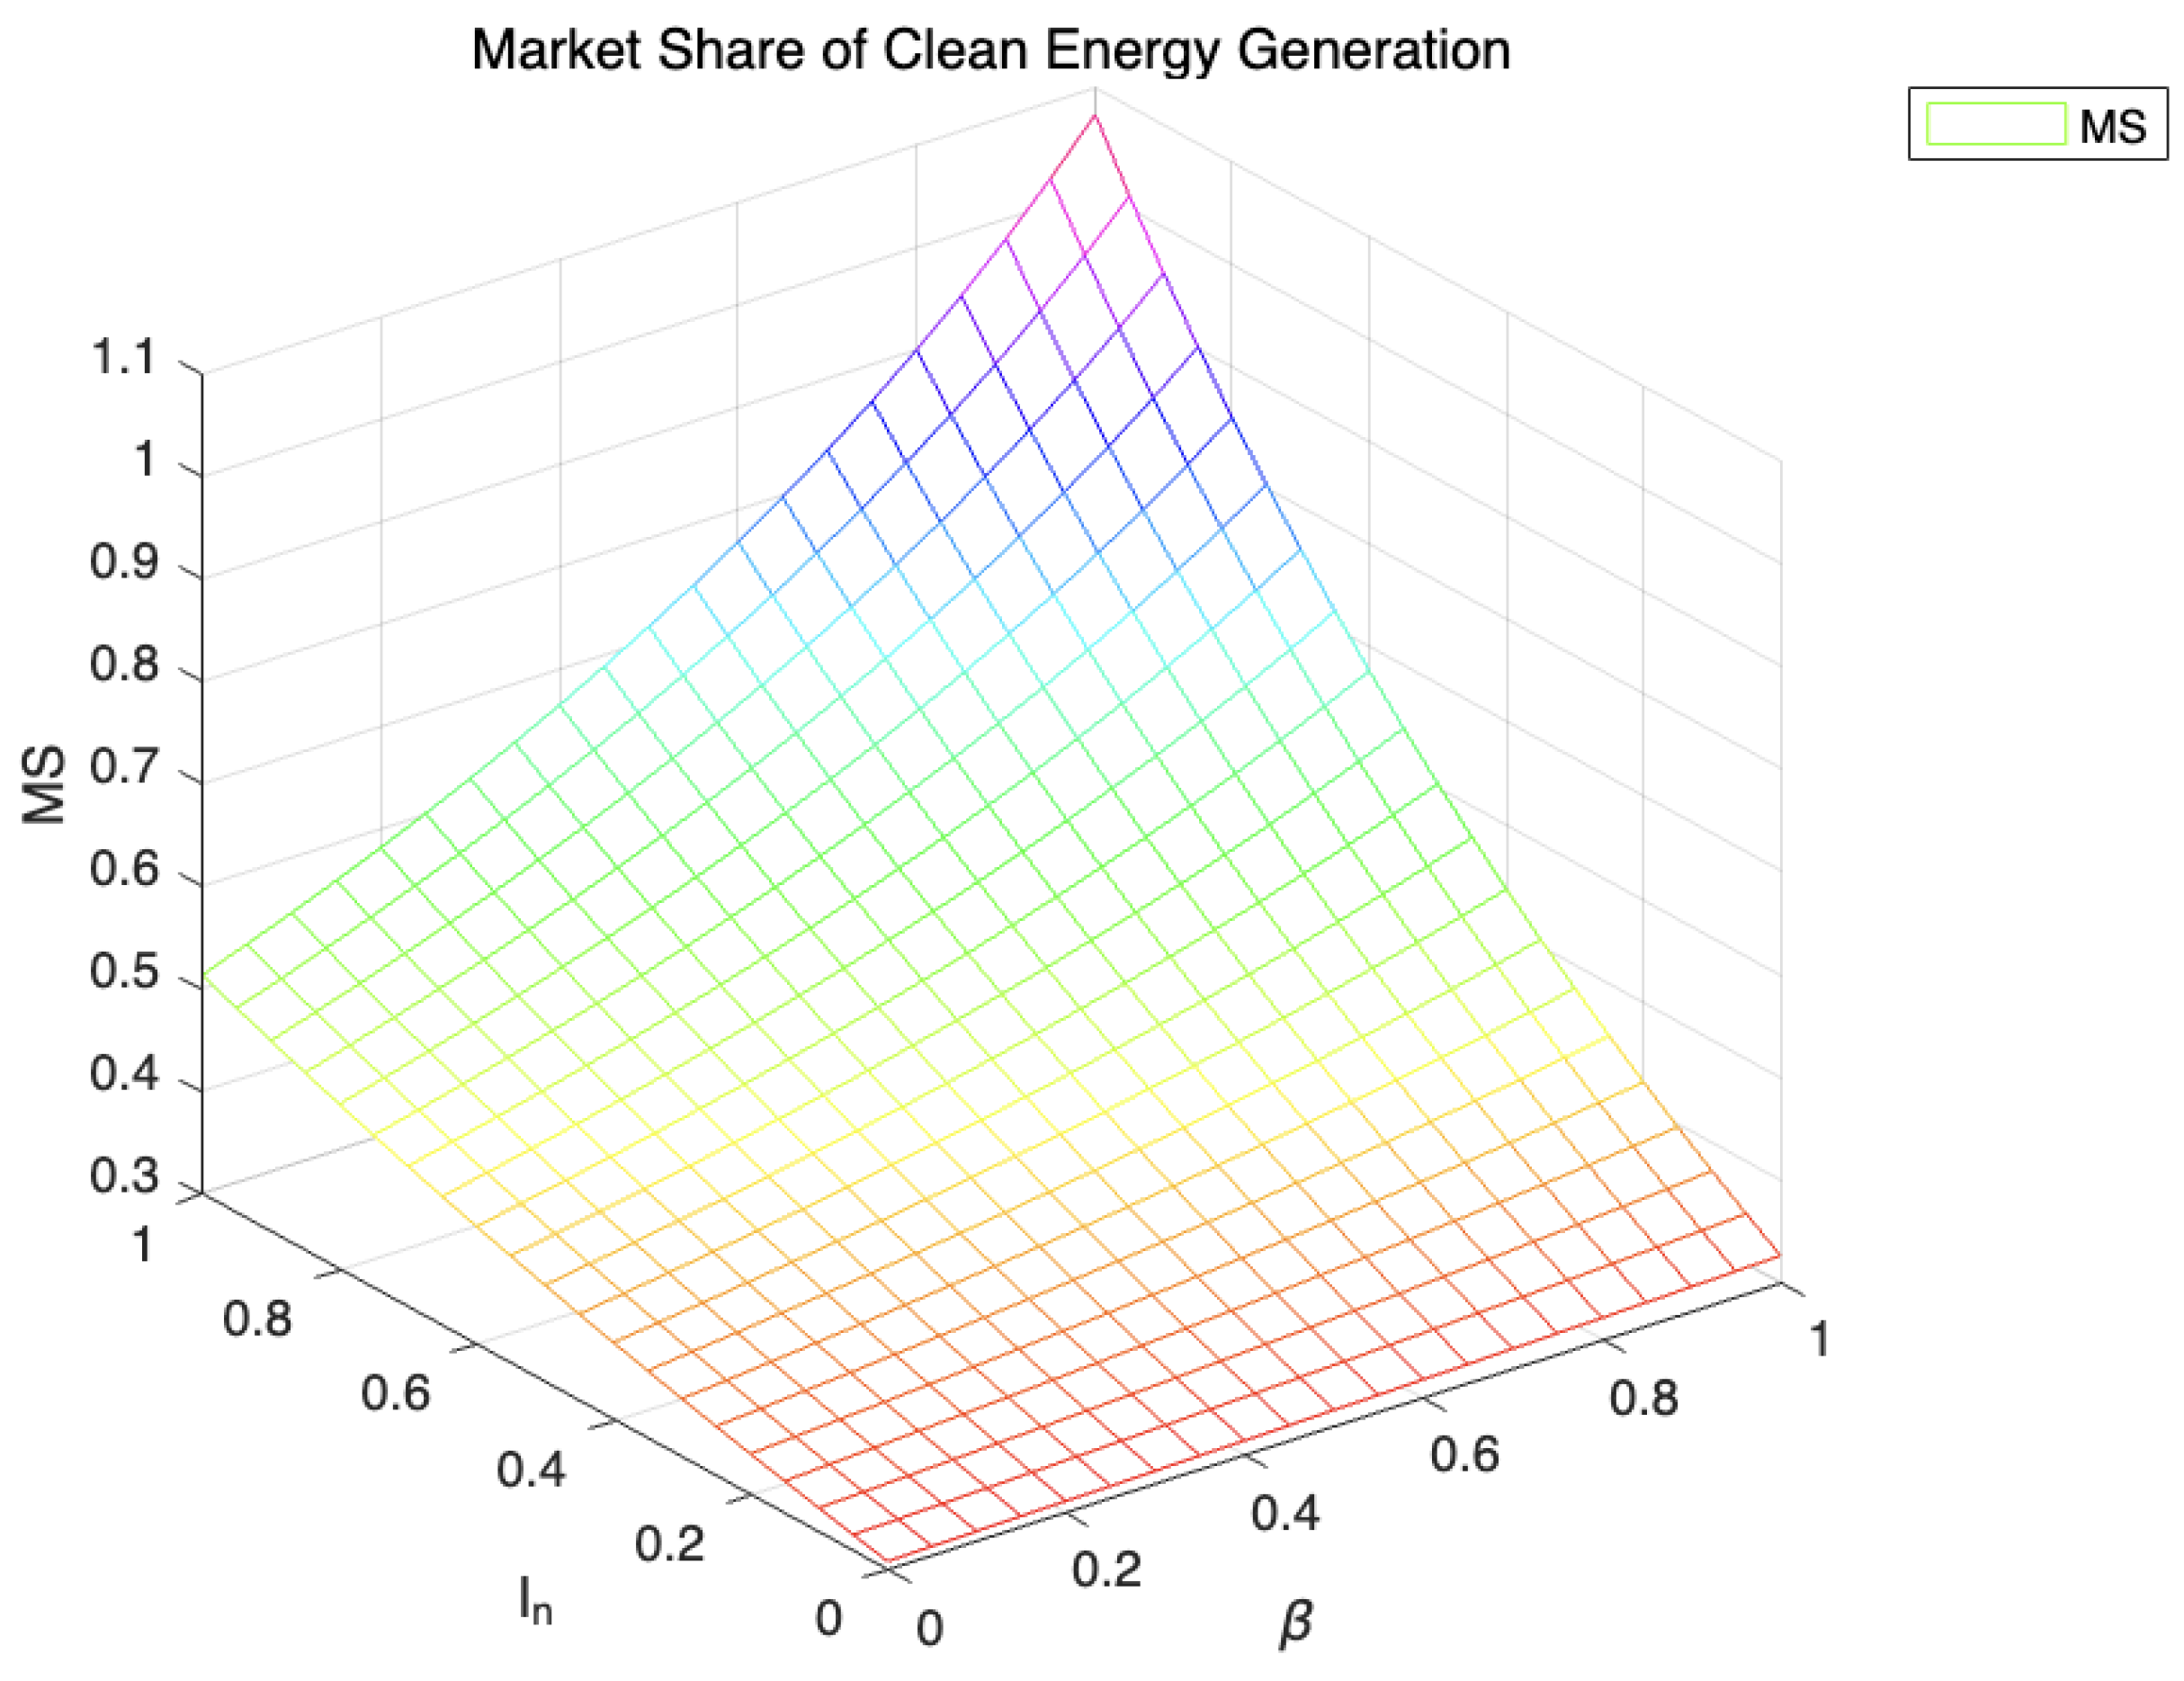
  • The market share of clean energy power generation enterprises increases as a result of carbon quota policies, especially in environments with higher competition levels.
The rest of this article is organized as follows. In Section 2, we reviewed the previous research literature, and based on this, we established a detailed Stackelberg game model in Section 3 to analyze the impact of the establishment of carbon quota and carbon trading market on the clean transformation of the power supply chain. In Section 4, the optimal solution of the power supply chain game is analyzed, and the specific impact of the implementation of a carbon quota policy and the change in carbon price in the carbon trading market on the profit of the power supply chain, the level of technological innovation, and the progress of the clean transformation of the power supply chain is compared. Section 5 verifies the validity of the conclusions obtained in Section 4 through numerical simulation analysis, and the research findings and conclusions of this paper are summarized in Section 6, hoping to give some suggestions to power generation enterprises, government agencies, and other relevant departments in corporate decision-making and policy formulation. The proof of Theorems in this paper is given in Appendix A, and the proof of Propositions is given in Appendix B.

2. Literature Review

2.1. Carbon Quota Policy

As early as the last century, the marketization of carbon emission rights entered the academic field of vision [30]. Nowadays, countries have introduced relevant policies to limit carbon emissions. This prompted relevant enterprises to start to formulate new development strategies according to policy changes and promoted the progress of relevant research [31,32]. At present, the carbon quota [33,34,35,36] and the carbon tax [37,38,39] policy are the most widely used carbon emission reduction policy means that do not increase government financial expenditure. The effects of the two are different in different aspects, but both have limitations that may not achieve the expected emission reduction effect due to their uncertain impact on profits [40] and will have an impact on enterprises’ willingness to invest in low-carbon production technologies [41,42].
The impact of policies such as carbon quotas on the production of enterprises has also received widespread attention [43,44,45]. The previous studies have shown that the implementation of carbon trading will increase the price of electricity and promote the proportion of renewable energy generation, helping the power sector to reduce emissions [46]. At the same time, the implementation of carbon policies will promote the low-carbon transformation of the industry and improve the level of industrial sustainability [47,48], and this is often accompanied by an increase in the level of relevant technology [49].

2.2. Supply Chain Modeling and Analysis

In the study of supply chain sustainability, some scholars are committed to establishing an optimization model for integrating renewable energy into the power supply chain to better analyze and plan the supply chain [50]. Environmental indicators such as carbon emissions are an important reference for exploring supply chain sustainability [51]. The use of game theory for model building has always been an important research direction in this field; therefore, Vasnani et al. (2018) [52] discussed the current trends and applications of game theory in supply chain management, emphasized the relevance of game theory in the decision-making process, and emphasized the integration of game theory with different supply chain structures, decisions, and the status quo. Because carbon quota policy needs the carbon trading market as the basis to function, the change in carbon price will affect the effectiveness of the carbon quota policy. Through the analysis of relevant models, different enterprises have different sensitivity and intensity of response to relevant policies [53,54].
Since the main sources of power generation are fossil energy and clean energy, the duopoly model is more suitable as a tool to analyze the change in the power supply chain [55,56]. Although carbon tax is not the main content of this study, the supply chain model based on carbon tax policy in the relevant literature is also worth referring to. The incentive effect of carbon dioxide emission tax policy on sustainable pricing and production policy is studied in some articles [57]. Zheng et al. studied the impact of the emission allocation scheme in the early stage of a cap-and-trade system in a duopoly market and analyzed the corporate and social effects of the different schemes [58]. In addition, by establishing the system dynamics model of the clean energy market, the influence of carbon quota price on the emission reduction effect and cost-effectiveness of clean energy market can also be studied [59].

3. Model Establishment and Analysis

3.1. Initial State of the Power Generation Enterprise

Under the duopoly market environment, we established a two-level supply chain [60] consisting of thermal power generation enterprises and clean energy power generation enterprises as suppliers, power grids as retailers that considers the regulatory role of the government in the implementation of carbon quota policy [61,62].
Among them, the unit power generation of thermal power generation enterprise (t) is a, and the unit power generation of clean energy power generation enterprise (n) is b, respectively. Considering that the pricing rule of China’s electricity market is the conventional on-grid price, both of them supply the generated electricity to the power grid at the price P (this paper assumes that all the electricity generated by the power generation enterprise can be sold to the power grid).
At the same time, in order to improve power generation efficiency and assume social responsibilities including reducing greenhouse gas emissions, power generation enterprises will carry out technological innovation investment at the level of e t , e n , and the cost coefficient of technological innovation investment is λ t , λ n . Under a certain level of investment, the power generation enterprises will increase production commensurate with the level of investment. Based on the reality that China’s economy has turned to high-quality development and power demand has shifted from a high-speed increase to stable and rising, the market will not be able to fully absorb the increase in power generation; that is, there is a market competition level β within the power supply chain. Therefore, when a company is expanding its market scale, it will partially reduce the market share of its competitors, which is regarded in this paper as a reduction in the output of its competitors; that is, competition will cause a decrease in the output of the two power generation enterprises. Figure 1 shows the relationship between decision makers, and all the variables involved in this study and their meanings will be summarized in Table 1.

3.2. Carbon Emission Cost

In the carbon trading market, carbon price k is the floating price in the market, and there is no fixed price. When the carbon quota obtained by the thermal power generation enterprise is I t , the carbon quota required for its production is 1 I t q t . Under the current policy, clean energy power generation enterprises assume that the carbon emission of power generation is 0 in reality, but the government still issues corresponding carbon quotas I n for their operation. When the carbon quota level 1 + I n q n is obtained, that can be traded or sold in the carbon trading market and converted into corporate profits.
In this model, the carbon quota is allocated to the two types of power generation enterprises at the total level of a + b . According to the status of the carbon trading market, the carbon quota in thermal power generation enterprises will reduce carbon purchases, and the carbon quota in clean energy power generation enterprises will increase their carbon credits that can be traded in the carbon trading market. Accordingly, the carbon trading income and costs borne by enterprises of the two power generation modes are as follows:
E n = k 1 + I n q n
E t = k 1 I t q t

3.3. Decision-Making of Power Generation Enterprises

The profit functions for the power generation enterprises are
π n = b p e n β e t + 1 e n 2 λ n 2 + b k I n + 1 e n β e t + 1
π t = I n a k e t + β e n 1 a p e t + β e n 1 e t 2 λ t 2

3.4. Government Decisions—Total Environmental Costs

The problem facing the government is to set the optimal implementation level of the carbon quota policy to achieve the minimum carbon emission cost (maximum carbon emission benefit) of the power supply chain so as to reduce the negative impact of the power supply chain on climate issues and promote the clean transformation of the power supply chain. In this paper, the total cost of carbon emissions in the electricity supply chain is E = E n + E t .

3.5. Market Share

In order to better represent the degree of clean transformation of the power supply chain during the implementation of the carbon quota policy, we establish a simple market share function to represent the market share of clean energy power generation enterprises in the power supply chain and evaluate the effectiveness of the carbon quota policy on this basis. Market share function of clean energy power generation enterprises:
MS = q n q t + q n

4. Optimal Decisions

Since this paper mainly examines the impact of internal supply chain competition and carbon quota policy on the power supply chain, in order to simplify the calculation without losing universality, the assumption is λ t = 1 , λ n = 1 , a = 1 − b, I t = 1− I n .

4.1. Optimal Decision of Power Generation Enterprise

Due to the support for the development of clean energy caused by climate change and other reasons, as well as the maturity of clean energy power generation technology, clean energy power generation is being popularized at a very high speed. Therefore, in the Stackelberg game model of this paper, clean energy power generation enterprises are assumed to be game leaders. The technological innovation investment level is determined according to the technological innovation investment decision made by the thermal power generation enterprises.
Theorem 1. 
When the government implements the carbon quota policy, the profit, output, and technological innovation level of the power generation enterprises are
π n * = b k + p + I n k b k + b p 2 β p + I n b k + 2 I n β k + 2 b β p 2 I n b β k + 2 2
π t * = ( b 1 ) p I n k I n k p + b p I n b k + 2 b β k + 2 b β p + 2 I n b β k 2 2
q n * = b b p + β ( b 1 ) p I n k + b k I n + 1 + 1
q t * = ( b 1 ) ( b 1 ) p I n k + β b p + b k I n + 1 1
e n * = b p + b k I n + 1
e t * = ( b 1 ) p I n k
Proposition 1. 
By analyzing Theorem 1, we can obtain three important inferences:
1. 
e n * > 0 ; When I n p k ,   e t * > 0 ;   I n > P k ,   e t * < 0 .
2. 
When the level of competition β increases, q t * declines. The increased level of β helps increase q n * when I n > P k . Conversely, q n * declines.
3. 
When I n p k , Π n * , Π t * decreases with the increase in β, conversely, Π n * , Π t * increases.
Proposition 1 reveals that when the government intervenes in the power supply chain through the carbon quota policy, the power generation enterprises will not take the current market competition environment as the basis for their decision-making to determine their technological innovation input but mainly make strategic decisions based on government policies. Moreover, clean energy power generation enterprises will always invest in technological innovation, and with the allocation of carbon quotas to them, their technological innovation investment level will also increase, showing the advantages of carbon quota policy in promoting technological innovation in the field of clean energy power generation.
However, the implementation of the carbon quota policy will reduce the enthusiasm for technological innovation investment of thermal power generation enterprises in a specific environment and even cause technological retrogression in thermal power generation enterprises, which is not conducive to the technological update of the power supply chain.
At the same time, in the process of implementing carbon quota policy, the change in competition level within the supply chain also affects the output and profit indicators of the power supply chain. (1) It is found that after the implementation of carbon quota policy, competition leads to a continuous decline in power generation in thermal power generation enterprises, which means that thermal power generation enterprises lose competitiveness in the competition within the supply chain after the implementation of the carbon quota policy. For clean energy power generation enterprises, competition also damages their competitiveness under certain circumstances. (2) We find that although the power generation of thermal power generation enterprises under the carbon quota policy will decrease with the intensification of competition, their profits will not necessarily be affected. When the carbon quota reaches a certain level, its profits and clean energy power generation enterprises will rise, but the power generation of clean energy power generation enterprises will also rise at the same time.

4.2. Environmental Cost

The function of the electric power environmental cost in the supply chain game is
E * = I n k ( b 1 ) ( b 1 ) p I n k + β b p + b k I n + 1 1 b k I n + 1 ( b p + β ( b 1 ) p I n k + b k I n + 1 + 1
Theorem 2. 
The environmental cost has a maximum value under the parameter conditions assumed in this paper. When the maximum value is achieved, I n * = 2 b p + 2 b p + 2 b 2 k + 2 b β k 2 b 2 β k 1 2 k 4 b k + 4 b 2 k + 4 b β k 4 b 2 β k . If 0 < I n < k k ( k + 2 p ) 2 k , the increase in competition level increases the total environmental cost of the power supply chain. When I n > k k ( k + 2 p ) 2 k , the increase in competition level reduces the total environmental cost of the power supply chain.
The overall environmental cost of the power supply chain does not only depend on the allocation of carbon allowances but is affected by the level of internal competition. The influence direction of the carbon quota policy on the environmental cost of the power supply chain is affected by competition level. Changes in the level of competition also affect the total environmental cost of the power supply chain, but their effects are limited by carbon quotas. This illustrates the interaction between the implementation of carbon quota policies and competition within the electricity supply chain in their impact on total environmental costs.
Theorem 2 suggests that the implementation of a carbon quota policy and the level of competition within the power supply chain have dual effects on the environmental cost of the power supply chain, but they do not necessarily contribute to the control of the environmental cost of the power supply chain.
On the other hand, we find that the environmental cost of the power supply chain is not necessarily positive; that is, when the carbon quota policy is implemented in the power supply chain, the environmental cost brought by the carbon emission of the thermal power generation enterprise is less than the environmental benefit brought by the carbon emission saving of the clean energy power generation enterprise. This provides some basis for the realization of the international environmental protection vision of “reaching the peak of carbon and carbon neutrality”.
Theorem 2 also suggests that when the government is playing games with enterprises in the power supply chain to reduce the environmental cost of the industry and promote the transformation of the power supply chain, it should focus on the internal competition of the power supply chain when formulating carbon quota policies.

4.3. Market Share of Clean Energy Power Generation Enterprises

Theorem 3. 
After the implementation of the carbon quota policy, the optimal market share of clean energy power generation enterprises in the power supply chain is
M S * = σ 1 σ 1 + ( b 1 ) ( b 1 ) p I n k + β b p + b k I n + 1 1
σ 1 = b b p + β ( b 1 ) p I n k + b k I n + 1 + 1
Proposition 2. 
When b > 0.5 , the level of competition will decrease MS in ( I n 1 , I n 2 ), promote MS in β I n 1 , β I n 2 ; when b < 0.5 , the level of competition will increase by MS in I n 1 , I n 2 , decrease MS in β I n 1 , β I n 2 . When b = 0.5 , β will constantly improve the power supply chain market share. In the above conclusions, I n 1 = p + b k + 1 k 2 b k , I n 2 = b k p + 2 b p k .
Proposition 2 shows that the change in competition level affects the implementation effect of the carbon quota policy, and the initial market state of the power supply chain before the implementation of carbon quotas (the initial market share of renewable energy power generation enterprises) also affects the effect of policy implementation. When the market share of the renewable energy power generation enterprises is larger than that of the thermal power generation enterprises, the same level of policy and competition may cause completely opposite effects. It shows that the change in competition level affects the implementation effect of the carbon quota policy.
Meanwhile, the initial market state of the power supply chain before the implementation of carbon quotas (the initial market share of renewable energy power generation enterprises) also affects the effect of policy implementation. When the market share of renewable energy power generation enterprises is larger than that of thermal power generation enterprises, the same level of policy and competition may cause completely opposite effects.

5. Numerical Analysis

In the numerical comparison simulation process of decentralized decision making and centralized decision making, the parameter values λ n , λ t = 1 used in the simulation process of the decentralized decision making model are still used. According to the current market share statistics of thermal power generation and clean energy power generation in China, assume that a = 0.7, b = 0.3. In order to ensure that point I n = P k can exist in the process of numerical simulation ( 0 I n 1 is assumed in this paper), assume P = 0.6, k = 1 . In this section, we will use MATLAB (R2023b) to conduct numerical simulations (see Supplementary Materials) and draw relevant images.

5.1. Changes in Power Generation of Power Generation Enterprises

Figure 2 clearly shows the process of the change in competition level on the output of clean energy power generation enterprises from negative to positive under the influence of the carbon quota policy. It can be found that the implementation of a carbon quota policy has sustained restrictions on thermal power generation enterprises under the competition level 0 < β < 1 . Furthermore, the higher the competition level, the greater the reduction rate of power generation under the carbon quota policy. At the same time, when I n > 0.6 , the increase in the level of competition has had a positive effect for clean energy power generation enterprises to increase their power generation. On the contrary, when I n < 0.6 , the increase in the level of competition reduces the power generation of clean energy power generation enterprises.

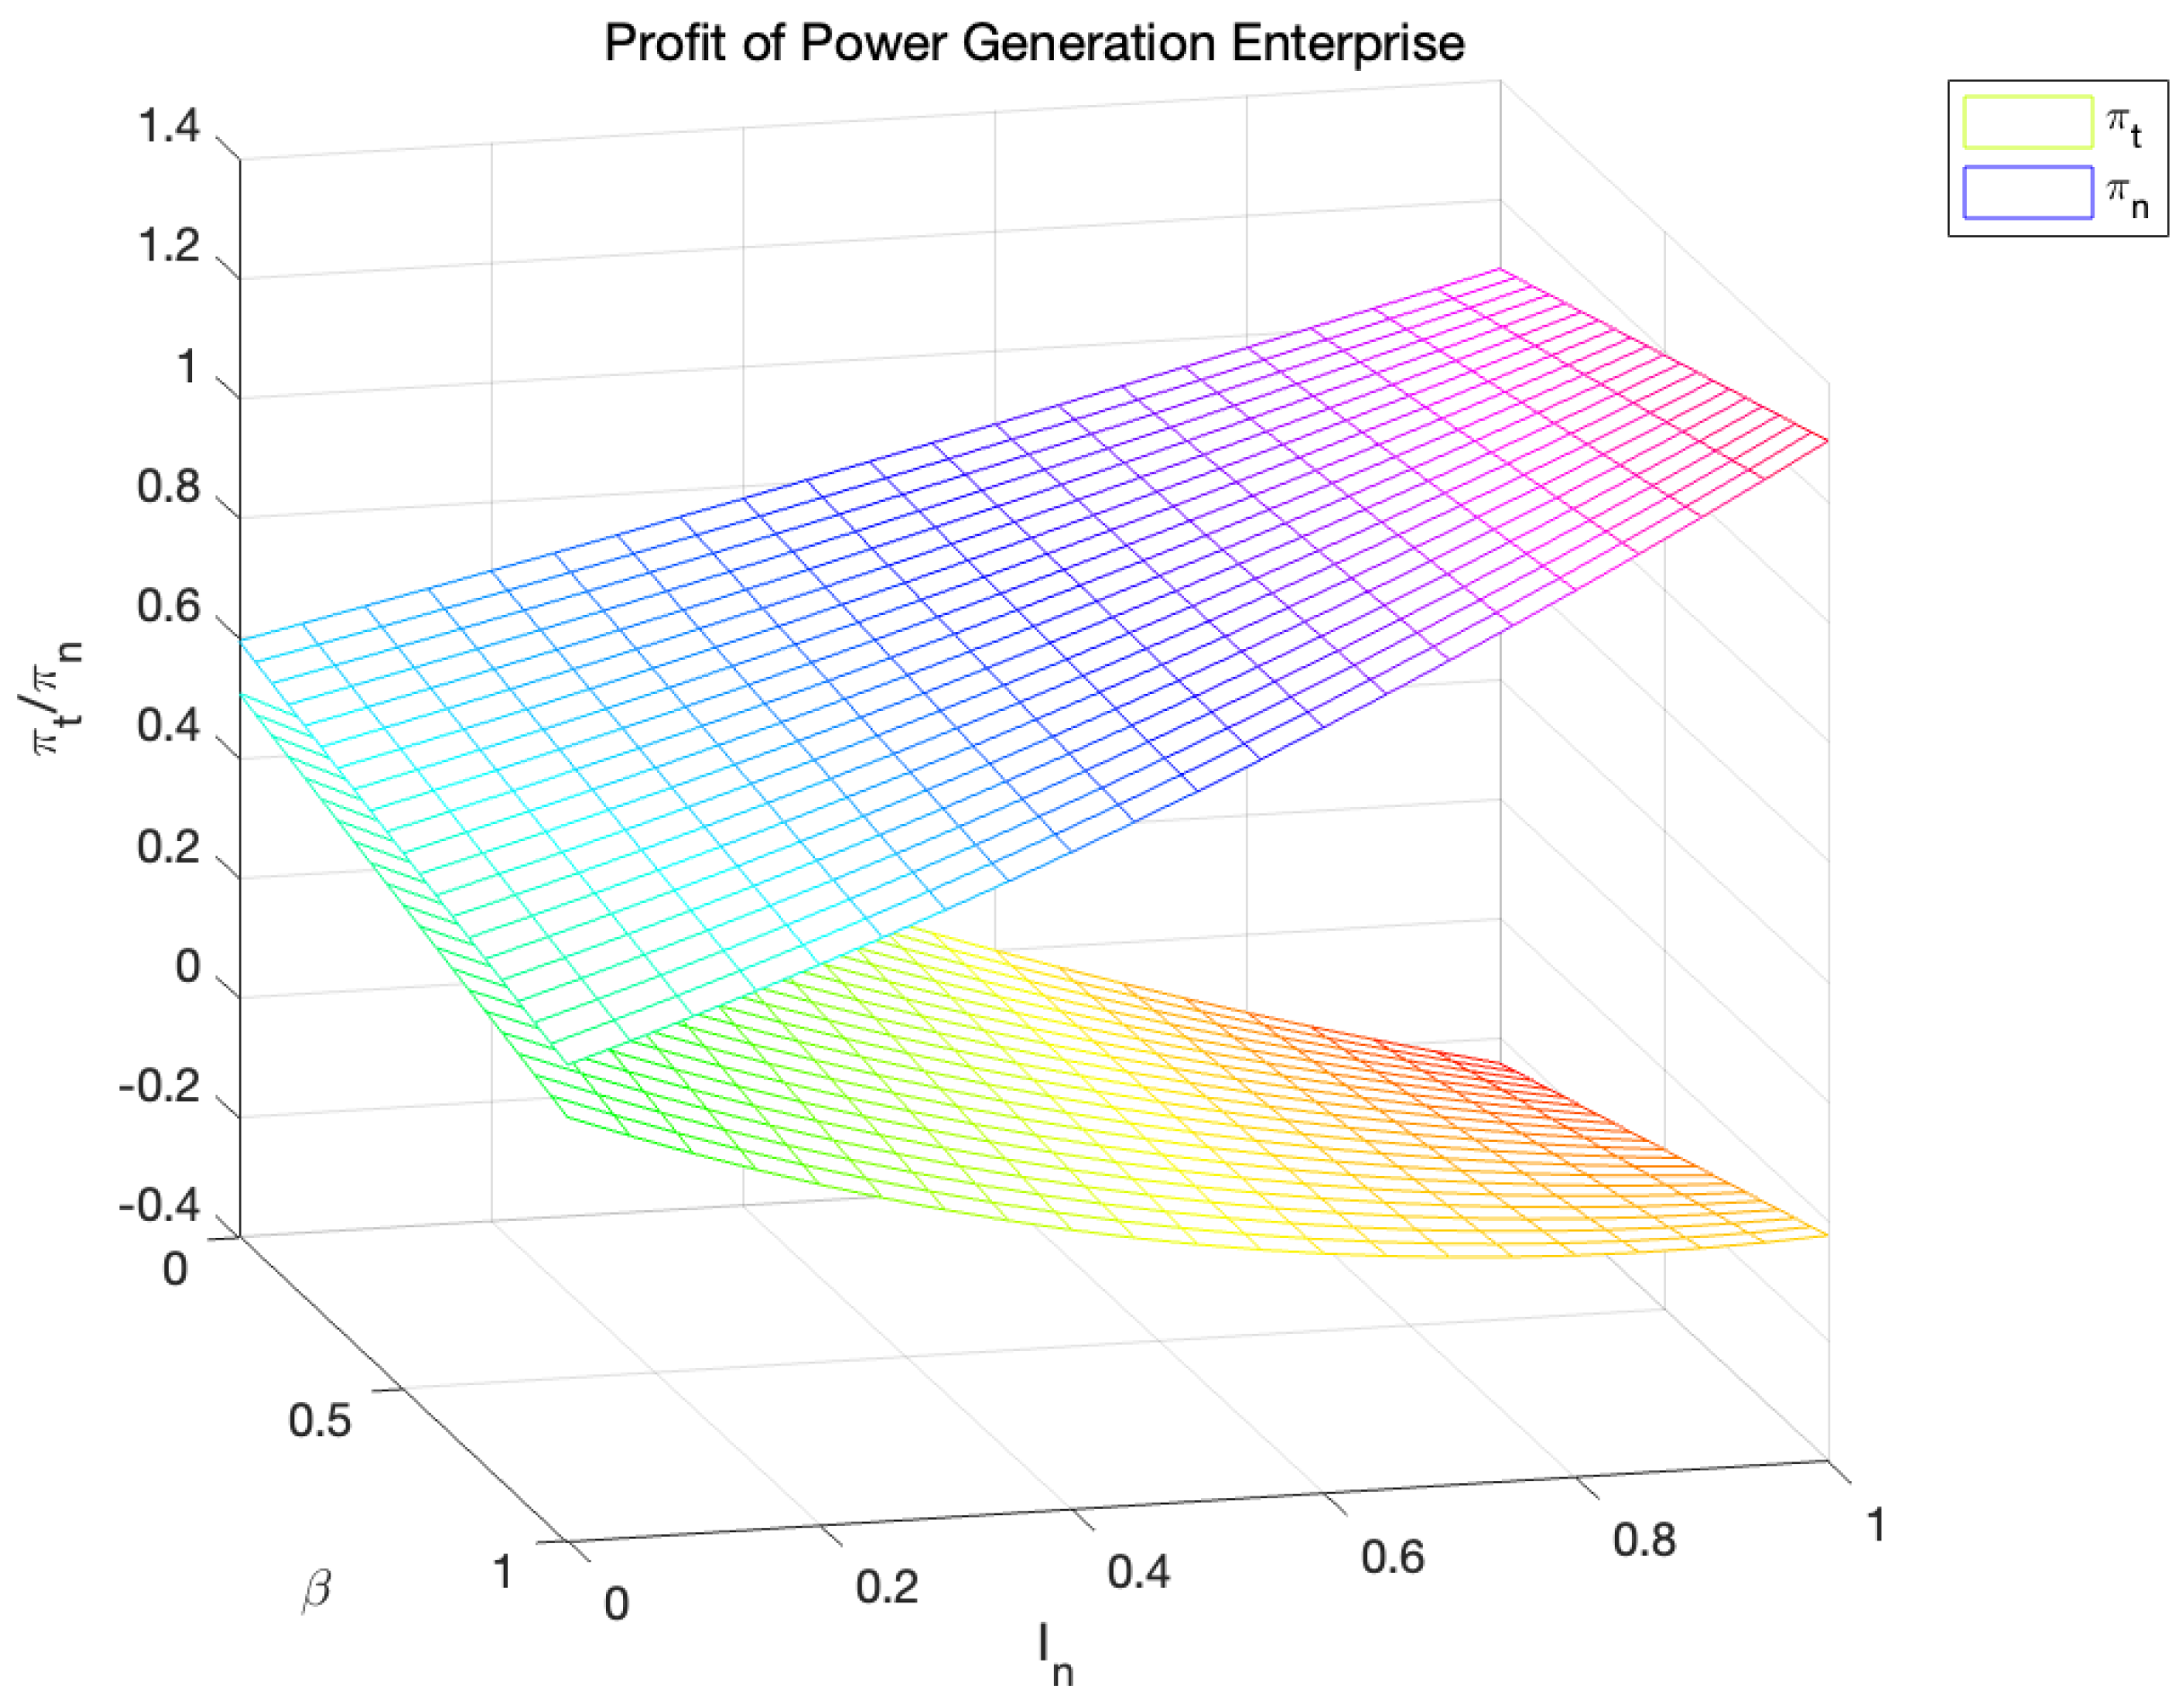
5.2. Changes in the Profits of Power Generation Enterprises

Figure 3 reveals that the change in competition level always increases the profits of clean energy power generation enterprises under the influence of the carbon quota policy, but when the competition level is high, the carbon quota policy has a greater impact on the profits of clean energy power generation enterprises. When I n > 0.6 , the improvement in the competition level has contributed a positive impact on the improvement of the optimal profit level of various power generation enterprises, but when I n < 0.6 , the improvement of the competition level is not conducive to the higher profits of power generation enterprises.
Furthermore, we find that when the carbon price level is higher than the electricity price, when the government implements the carbon quota policy, the profits of thermal power generation enterprises will be very low and will continue to decrease when the carbon quota is allocated to clean energy power generation enterprises, but if the carbon quota of clean energy power generation enterprises is increased, their profit decline rate will slow down, and the profit growth of clean energy power generation enterprises will also slow down.

5.3. Environmental Cost

Figure 4 indicates that when the government makes decisions related to carbon quota policy, the level of competition within the power supply chain affects the effect of policy implementation. We find that when the level of competition within the supply chain is low, the implementation of carbon quota policy may only slow down the added value of the environmental cost caused by the increase in output of thermal power generation enterprises and can only slow down its growth trend. When the level of competition increases, the effect of carbon quota policies is more obvious, and there are opportunities to contain and reverse the increase in environmental costs within their feasible areas.

5.4. Market Share

Figure 5 simulates the situation in which the market share of the initial thermal power generation enterprise is higher than that of the clean energy power generation enterprise in the hypothesis in this paper, and it can be found that the improvement in competition level promotes the clean transformation of the power supply chain.
When the carbon quota of clean energy power generation enterprises is low, its market share growth rate is also low in the competitive environment, which is consistent with the analysis results in Proposition 2 (In the hypothesis made in this section I n 1 , I n 2 = ( 0.06 , 4.75 ) , when the carbon quota is approaching 0, the transformation caused by competition is also less obvious).

6. Conclusions

In our research, the biggest difficulties stem from how to quantify the environmental costs of electricity supply chain operations and how to determine the market share of clean energy generators. Since the environmental damage caused by the producer is mainly due to the greenhouse gas emissions generated in the production process, under the current conditions of the marketization of carbon emission allowances, we believe that the cost of purchasing the negotiated allowances required for production is more reasonable as the environmental cost. In addition, in this study, we assume that the total output of the source enterprise is the total market demand, so that the market share of clean energy power generation enterprises can be obtained through proportional calculation.
The results of our analysis reveal several key insights into the impact of carbon quota policies on the power supply chain. Our findings support Hypothesis 1, showing a significant increase in technological innovation investment in clean energy enterprises following the implementation of carbon quota policies, which is consistent with the results of Cao et al. [19] and Liu et al. [40]. More importantly, this result is not affected by competition within the power supply chain.
Furthermore, the reduction in production output for thermal power generation enterprises (Hypothesis 2) suggests that carbon quota policies are effective in curbing emissions from the most polluting sources. However, the increasing output levels in clean energy enterprises indicate that these policies create a favorable environment for cleaner technologies to thrive.
In the study of the environmental cost of the electricity supply chain (Hypothesis 3), we found that the effect of the carbon quota policy made by the government is affected by the level of competition within the supply chain, and there are local maximum and minimum values but nonlinear or single extreme values. This implies the uncertainty and duality of the effect of the carbon quota policy, which is not necessarily conducive to controlling the environmental cost of the supply chain and puts forward higher requirements for the scientific nature of government policy formulation.
The research on the market share of clean energy power generation enterprises affected by carbon quota policy (Hypothesis 4) found that changes in competition level have uncertain effects on the clean transformation of supply chain guided by carbon quota policy. When the market share of clean energy power generation enterprises is at a specific level, the change in competition level is not conducive to the clean transformation of the supply chain; in the opposite premise, similar to the results of Chen et al. and Shen et al. [43,47], competition is beneficial to the clean transformation of the supply chain.
In addition, in the process of research, we found that in some cases, the profits of the two kinds of enterprises decline with the increase in competition level. This is similar to what Hossain et al. and Ma et al. found [63,64], which partly supports the conclusion in the introduction that a systematic approach is needed to deal with climate change and also highlights the necessity of including competition level in the analysis of carbon quota policy in this study.
The results show that under certain circumstances, the effect of carbon quota policy is affected by the level of competition within the power supply chain and the correlation between the purchase price and carbon price from the current transmission and distribution grid. When the carbon quota is higher than a certain critical value, thermal power generation enterprises will stop innovation, and even produce technical level retrogression, while clean energy power generation enterprises will always invest in technological innovation after the implementation of carbon quota policy. At the same time, when the carbon quota is below a certain level, the competition will make the two kinds of power generation enterprises make decisions to reduce their power generation, which challenges the power generation enterprises to maintain the stability of the energy supply, and at this level, the profits of power generation enterprises also decrease, which has a negative impact on the operation of the enterprises. When the carbon quota is higher than this level, the clean energy power generation enterprises increase their output to take up the reduced output of the thermal power generation enterprises, the profits of both types of power generation enterprises are increased, which is more conducive to the stability of the power supply chain.
Policy experience, such as the US’s cap and trade [65], EU Emission Trading Scheme (EU-ETS) [66], and China’s carbon emissions trading (CET) [67] policy, provides practical examples of successful carbon management strategies for the green transformation of the electricity supply chain [32]. To further reduce emissions and promote clean energy, we recommend the adoption of policies including increasing incentives for innovation in clean energy generation technologies, a competitive market framework for the electricity supply chain, and dynamic carbon quota policies consistent with the level of competition within the supply chain to help the power sector transition to a low-carbon future.
The conclusions of this paper provide valuable insights into the impact of carbon quota policies on the power supply chain, highlighting the role of carbon quota policies in promoting clean energy and reducing emissions from thermal power generation. Our findings suggest that carbon quota policies not only incentivize technological innovation by clean energy companies but also shift market share to cleaner technologies. However, in the process, we found that the change in carbon price may have a negative impact on the profits of the generating enterprises, which may affect the stability of the power supply chain and slow down the process of green transformation. This provides a reference for the government or relevant institutions to influence the transformation of the power supply chain by controlling carbon price or to determine a better time for policy implementation. At the same time, this paper focuses on the competition within the supply chain, which has received less attention in the study of carbon emission policies, finds out the influence of competition level on the effect of quota policy, and provides suggestions for the specific level of carbon quota policy formulation by governments in the future.
In the future, the main research directions will be as follows. First of all, this paper studies the static carbon quota policy. Since the government’s decision is adjusted according to the current situation of the power supply chain, the dynamic game model can be considered to study the direction of the government’s policy in the dynamic change in the power supply chain in the future. Second, because the market-oriented reform of the electric power industry has not been completed, the premise of government pricing is still used in this study, and the change in electricity price is not considered. The future studies should pay attention to the current situation of the electric power industry and make dynamic adjustments to electricity price and carbon price. Third, this study did not consider the relevant requirements for the stability of the power supply chain. As an important energy source for national production and life, the stability of electricity is very important for economic and social stability, so it is possible to add constraints to ensure the stability of the power supply. Finally, we study the influence of the supply chain game and carbon quota policy through analytical modeling. In the future, empirical analysis can be carried out to determine the reliability of the conclusion and improve and optimize the model in this paper.

Supplementary Materials

The following supporting information can be downloaded at: https://www.mdpi.com/article/10.3390/su16135787/s1.

Author Contributions

Conceptualization, B.G. and G.S.; methodology, B.G. and G.S.; software, G.S.; writing—original draft preparation, G.S.; writing—review and editing, B.G.; visualization, G.S. All authors have read and agreed to the published version of the manuscript.

Funding

This research received no external funding.

Institutional Review Board Statement

This study did not require ethical approval.

Informed Consent Statement

This study did not involve humans.

Data Availability Statement

The conclusions in our study were obtained through numerical simulation and did not involve actual research data.

Acknowledgments

All authors would like to thank the anonymous commenters for their suggestions and constructive comments.

Conflicts of Interest

The authors declare no conflicts of interest.

Appendix A

Matlab (R2023b) software is used in all the solving and proving procedures in this appendix, and the relevant codes are attached.

Appendix A.1

Proof of Theorem 1. 
Since the two power generation enterprises are competitive, we use the solution step of decentralized decision making to solve the problem.
In decentralized decision-making, the profits of the two power generation enterprises are determined by the level of investment in technological innovation. Since renewable energy power generation enterprises are the leaders, the first order partial derivation of the profits of thermal power generation enterprises and technological innovation level is π t e t = I n k ( b 1 ) p ( b 1 ) e t . Its second partial derivative is π t 2 e t 2 = 1 . It can be determined that there is an optimal level of technical investment in thermal power generation enterprises e t * , when π t e t = 0 , e t * = ( b 1 ) p I n k .
Bringing e t * in the output function of renewable energy power generation enterprises, we can see that after the thermal power generation enterprises make investment decisions, the output of renewable energy power generation enterprises is
q n 1 = b e n + β ( b 1 ) p I n k + 1
Plug in the profit function:
π n 1 = b p e n + β ( b 1 ) p I n k + 1 e n 2 2 + b k I n + 1 e n + β ( b 1 ) p I n k + 1
Find the first and second partial derivatives of Π n 1 with respect to e n , respectively: π n 1 e n = b p e n λ n + b k I n + 1 ; π n 1 2 e n 2 = 1 . It can be determined that there is an optimal level of technical investment in renewable energy power generation enterprises e n * = b p + b k I n + 1 . By plugging x and y into the output function and the profit function, we can obtain
q n * = b b p + β ( b 1 ) p I n k + b k I n + 1 + 1
q t * = ( b 1 ) ( b 1 ) p I n k + β b p + b k I n + 1 1
π n * = b k + p + I n k b k + b p 2 β p + I n b k + 2 I n β k + 2 b β p 2 I n b β k + 2 2
π t * = ( b 1 ) p I n k I n k p + b p I n b k + 2 b β k + 2 b β p + 2 I n b β k 2 2

Appendix A.2

Proof of Theorem 2. 
First, calculate the first partial derivatives of E * with respect to I n , β :
E * I n = k 2 b k + k p 2 I n k 2 2 b 2 k 2 4 I n b 2 k 2 + 2 b 2 β k 2 2 b k p + 4 I n b k 2 2 b β k 2 4 I n b β k 2 + 4 I n b 2 β k 2
E * β = I n k b p + b k I n + 1 ( b 1 ) b k I n + 1 ( b 1 ) p I n k
It can be concluded that the coefficient of I n in Formula (A7) is 4 b k 2 2 k 2 4 b 2 k 2 + 4 b 2 β k 2 4 b β k 2 , it is a function of β . When β > 2 b 2 2 b + 1 2 b 2 b 2 , 4 b k 2 2 k 2 4 b 2 k 2 + 4 b 2 β k 2 4 b β k 2 < 0 . In this paper, we assume that there is competition within the power supply chain, which means β > 0 , but 2 b 2 2 b + 1 2 b 2 b 2 < 0 , so we can assume that the coefficient of I n is less than 0.
If we set (A7) to zero, we can find
I n * = 2 b p + 2 b p + 2 b 2 k + 2 b β k 2 b 2 β k 1 2 k 4 b k + 4 b 2 k + 4 b β k 4 b 2 β k
When I n > I n * , E * I n < 0 , the increase in carbon quota increases the environmental cost of the power supply chain; if I n < I n * , E * I n > 0 , the increase in carbon quota is conducive to reducing the environmental cost of the power supply chain.
According to the assumptions in this paper, we find that (A8) is a quadratic equation with respect to I n , and its coefficient is less than 0. If we solve this equation, we obtain:
I n = ( k k ( k + 2 p ) 2 k k + k ( k + 2 p ) 2 k )
Since this paper assumes that carbon price k > 0, we can find that if 0 < I n < k k ( k + 2 p ) 2 k , the increase in competition level increases the total environmental cost of the power supply chain. When I n > k k ( k + 2 p ) 2 k , the increase in competition level reduces the total environmental cost of the power supply chain. □

Appendix A.3

Proof of Theorem 3. 
Since Theorem 3 is derived from the conclusion in Theorem 1, it can be derived from Theorem 1. □

Appendix B

Appendix B.1

Proof of Propositions 1. 
(1) Due to the carbon quota assumed in this paper I n 0 , e n * in Theorem 1 is a formula composed of positive numbers, We know that e n * > 0 . In Theorem 1, b 1 < 0 , when I n P k , p I n k 0 , e t * > 0 ; conversely, e t * < 0 .
(2) Take the partial derivative of q t * and q n * with respect to β , we obtain
q t 1 * β = b p + b k I n + 1 ( b 1 )
q n 1 * β = b ( b 1 ) p I n k
As this paper assumes b 1 , we can see that the increased level of competition hurts q t * . When I n > P k , the first partial derivative of q n * with respect to β is always greater than 0; the competition level β increases q n * .
(3) The partial derivative of Π t * , Π n * with respect to β , respectively, can be obtained: π t 1 * β = ( b 1 ) p I n k 2 b k + 2 b p + 2 I n b k 2 ; π n 1 * β = b k + p + I n k 2 p 2 I n k 2 b p + 2 I n b k 2 .
Since 2 bk + 2 bp + 2 I n b k > 0 , b 1 0 , when I n P k , π t 1 * β is less than 0, and vice versa is greater than 0. Meanwhile, as k + p + I n k > 0 , b 0 , π n 1 * β can be simplified to discuss the positive and negative properties of ( b 1 ) p I n k . When I n P k , π n 1 * β <0, vice versa, greater than 0. □

Appendix B.2

Proof of Propositions 2. 
Taking the first partial derivative of M S * yields
M S * β = b ( b 1 ) I n k p + b k + 2 b p p I n k + b k + 2 I n b k + 1 p I n k 2 b p + b 2 k + 2 b 2 p + 2 I n b k b β k 2 b β p + b 2 β k + 2 b 2 β p + 1 2
Since its denominator is always greater than 0, we only need to analyze
x = b ( b 1 ) I n k p + b k + 2 b p p I n k + b k + 2 I n b k + 1
When b > 0.5 , the quadratic coefficient of the quadratic function is greater than 0; 0 < b 0.5 , the quadratic coefficient of the quadratic function is less than 0. To solve the quadratic function, obtain I n 1 = p + b k + 1 k 2 b k , I n 2 = b k p + 2 b p k (When k = 4 p b 2 + 4 p b + 1 2 b 2 b 2 , this quadratic function has a unique solution, but at this time, k < 0 . According to the hypothesis k > 0 in this paper, the function has two different solutions in the feasible domain. Therefore, when b > 0.5 , In I n 1 , I n 2 , x < 0 , M S * will decrease; In 0 , I n 1 , I n 2 , 1 , x > 0 , M S * will increase. When b 0.5 , In I n 1 , I n 2 , x > 0 , M S * will increase; In 0 , I n 1 , I n 2 , 1 , x < 0 , M S * will increase. □

References

  1. Allen, M.R.; Frame, D.J.; Huntingford, C.; Jones, C.D.; Meinshausen, N. Warming caused by cumulative carbon emissions towards the trillionth tonne. Nature 2009, 458, 1163–1166. [Google Scholar] [CrossRef] [PubMed]
  2. Gasser, T.; Kechiar, M.; Ciais, P.; Burke, E.J.; Kleinen, T.; Zhu, D.; Huang, Y.; Ekici, A.; Obersteiner, M. Path-dependent reductions in CO2 emission budgets caused by permafrost carbon release. Nat. Geoence 2018, 11, 830. [Google Scholar] [CrossRef]
  3. Travis, J.M.J. Climate change and habitat destruction: A deadly anthropogenic cocktail. Proc. R. Soc. B Biol. Sci. 2003, 270, 467–473. [Google Scholar] [CrossRef] [PubMed]
  4. Church, J.A.; White, N.J.; Coleman, R.; Lambeck, K.; Mitrovica, J.X. Estimates of the regional distribution of sea level rise over the 1950–2000 period. J. Clim. 2004, 17, 2609–2625. [Google Scholar] [CrossRef]
  5. Cline, W. Global warming and agriculture: Impact estimates by country. J. Clean. Prod. 2008, 46, 448–450. [Google Scholar]
  6. Sanghi, A.; Mendelsohn, R. The impacts of global warming on farmers in Brazil and India. Glob. Environ. Chang. 2008, 18, 655–665. [Google Scholar] [CrossRef]
  7. Bhardwaj, B.R. Role of green policy on sustainable supply chain management: A model for implementing corporate social responsibility (CSR). Benchmarking Int. J. 2016, 23, 456–468. [Google Scholar] [CrossRef]
  8. Zhang, D.; Shi, L.; Liu, G. Supply chain in transition navigating economic growth and environmental sustainability through education. Environ. Sci. Pollut. Res. 2024, 31, 12321–12339. [Google Scholar] [CrossRef] [PubMed]
  9. Yang, C.L.; Lien, S. Governance Mechanisms for Green Supply Chain Partnership. Sustainability 2018, 10, 2681. [Google Scholar] [CrossRef]
  10. Bello, M.O.; Solarin, S.A.; Yen, Y.Y. Hydropower and potential for interfuel substitution: The case of electricity sector in malaysia. Energy 2018, 151, 966–983. [Google Scholar] [CrossRef]
  11. Raza, M.; Lin, B. Renewable energy substitution and energy technology impact in a transitional economy: A perspective from pakistan. J. Clean. Prod. 2022, 360, 132163. [Google Scholar] [CrossRef]
  12. Papageorgiou, C.; Saam, M.; Schulte, P. Substitution between Clean and Dirty Energy Inputs: A Macroeconomic Perspective. Rev. Econ. Stat. 2017, 99, 281–290. [Google Scholar] [CrossRef]
  13. Macdougall, A.H.; Zickfeld, K.; Knutti, R.; Matthews, H.D. Sensitivity of carbon budgets to permafrost carbon feedbacks and non-CO2 forcings. Environ. Res. Lett. 2015, 10, 125003. [Google Scholar] [CrossRef]
  14. Kuramochi, T.; Höhne, N.; Schaeffer, M.; Cantzler, J.; Hare, B.; Deng, Y.; Sterl, S.; Hagemann, M.; Rocha, M.; Yanguas-Parra, P.A.; et al. Ten key short-term sectoral benchmarks to limit warming to 1.5 °C. Clim. Policy 2018, 18, 287–305. [Google Scholar] [CrossRef]
  15. Jewell, J.; Cherp, A. On the political feasibility of climate change mitigation pathways: Is it too late to keep warming below 1.5 °C? Wiley Interdiscip. Rev. Clim. Chang. 2019, 11, 6309. [Google Scholar] [CrossRef]
  16. Bernow, S.; Dougherty, W.; Duckworth, M.; Browne, J. An integrated approach to climate policy in the US electric power sector. Energy Policy 1998, 26, 375–393. [Google Scholar] [CrossRef]
  17. Zhai, Q.; Cao, H.; Zhao, X.; Yuan, C. Cost benefit analysis of using clean energy supplies to reduce greenhouse gas emissions of global automotive manufacturing. Energies 2011, 4, 1478–1494. [Google Scholar] [CrossRef]
  18. Jgemann, C.; Michaela, F.; Hagspiel, S.; Nagl, S. Decarbonizing europe’s power sector by 2050—Analyzing the economic implications of alternative decarbonization pathways. Energy Econ. 2013, 40, 622–636. [Google Scholar] [CrossRef]
  19. Cao, K.; Xu, X.; Wu, Q.; Zhang, Q. Optimal production and carbon emission reduction level under cap-and-trade and low carbon subsidy policies. J. Clean. Prod. 2017, 167, 505–513. [Google Scholar] [CrossRef]
  20. Sinayi, M.; Rasti-Barzoki, M. A game theoretic approach for pricing, greening, and social welfare policies in a supply chain with government intervention. J. Clean. Prod. 2018, 196, 1443–1458. [Google Scholar] [CrossRef]
  21. Aslani, A.; Mohaghar, A. Business structure in renewable energy industry: Key areas. Renew. Sustain. Energy Rev. 2013, 27, 569–575. [Google Scholar] [CrossRef]
  22. Jiang, Y.Z.; Yang, Y.Z.; Guo, Q.W. China power source structure and CO2 emissions reduction. Adv. Mater. Res. 2012, 17, 946–953. [Google Scholar]
  23. Liu, H.T.; Liu, W.J. The analysis of effects of clean energy power generation. Energy Procedia 2018, 152, 947–952. [Google Scholar]
  24. Gerbelova, H.; Amorim, F.; Pina, A.; Melo, M.; Ioakimidis, C.; Ferrao, P. Potential of CO2 (carbon dioxide) taxes as a policy measure towards low-carbon Portuguese electricity sector by 2050. Energy 2014, 69, 113–119. [Google Scholar] [CrossRef]
  25. Liu, J. China’s renewable energy law and policy: A critical review. Renew. Sustain. Energy Rev. 2019, 99, 212–219. [Google Scholar] [CrossRef]
  26. Fareeduddin, M.; Hassan, A.; Syed, M.N.; Selim, S.Z. The impact of carbon policies on closed-loop supply chain network design. Procedia CIRP 2015, 26, 335–340. [Google Scholar] [CrossRef]
  27. Wang, Z.; Wang, C. How carbon offsetting scheme impacts the duopoly output in production and abatement: Analysis in the context of carbon cap-and-trade. J. Clean. Prod. 2015, 103, 715–723. [Google Scholar] [CrossRef]
  28. Khan, K.; Khurshid, A.; Cifuentesfaura, J.; Xianjun, D.; Beecher, J. Does renewable energy development enhance energy security? Util. Policy 2024, 87, 101725. [Google Scholar] [CrossRef]
  29. Mao, H.Y.; Wang, W.B.; Liu, C.H.; Xu, Y.; Zhao, S.Y. Effects of the carbon emission quota policy on the quality and sales of manufactured and remanufactured products. Int. J. Prod. Econ. 2023, 266, 109058. [Google Scholar] [CrossRef]
  30. Rose, A.; Stevens, B. The efficiency and equality of marketable permits for CO2 emission. Resour. Energy Econ. 1993, 15, 117–146. [Google Scholar] [CrossRef]
  31. Zhou, P.; Wen, W. Carbon-constrained firm decisions: From business strategies to operations modeling. Eur. J. Oper. Res. 2020, 281, 1–15. [Google Scholar] [CrossRef]
  32. Narassimhan, E.; Gallagher, K.S.; Koester, S.; Alejo, J.R. Carbon pricing in practice: A review of existing emissions trading systems. Clim. Policy 2018, 18, 967–991. [Google Scholar] [CrossRef]
  33. Wang, L.; Liu, C.; Yang, X. Research on Carbon Emission Reduction Effect of China’s Carbon Trading Pilot. Adv. Soc. Sci. Res. J. 2020, 7, 240–250. [Google Scholar] [CrossRef]
  34. Wang, B.J.; Zhao, J.L.; Wei, Y.X. Carbon emission quota allocating on coal and electric power enterprises under carbon trading pilot in China: Mathematical formulation and solution technique. J. Clean. Prod. 2019, 239, 118104.1–118104.12. [Google Scholar] [CrossRef]
  35. Qi, C.; Choi, Y. A study on the CO2 marginal abatement cost of coal-fueled power plants: Is the current price of China pilot carbon emission trading market rational? Carbon Manag. 2020, 11, 1–12. [Google Scholar] [CrossRef]
  36. Chen, P.; Dagestani, A.A. Urban planning policy and clean energy development Harmony—Evidence from smart city pilot policy in China. Renew. Energy 2023, 210, 251–257. [Google Scholar] [CrossRef]
  37. Wesseh, P.K.; Lin, B.Q.; Atsagli, P. Carbon taxes, industrial production, welfare and the environment. Energy 2017, 123, 305–313. [Google Scholar] [CrossRef]
  38. Bristow, A.L.; Wardman, M.; Zanni, A.M.; Chintakayala, P.K. Public acceptability of personal carbon trading and carbon tax. Ecol. Econ. 2010, 69, 1824–1837. [Google Scholar] [CrossRef]
  39. Wu, W.; Ren, Y.; Shi, L. Comparison of Renewable Energy Policy Based on Electricity Supply Chain Benefit. China Popul. Resour. Environ. 2013, 23, 44–48. [Google Scholar]
  40. Liu, X.; He, H.; Ma, C.; Zhang, H. Pricing decisions of two products with carbon emissions trading and green technology investment. In Proceedings of the 2016 International Conference on Logistics, Informatics and Service Sciences (LISS), Sydney, Australia, 24–27 July 2016. [Google Scholar]
  41. Dou, X.; Li, Y.; Wang, B.; Xue, C. Power supply chain incentive mechanism based on overall profit. Electr. Power Autom. Equip. 2010, 30, 58–62. [Google Scholar]
  42. Zeng, S.; Jiang, C.; Ma, C.; Su, B. Investment efficiency of the new energy industry in China. Energy Econ. 2018, 70, 536–544. [Google Scholar] [CrossRef]
  43. Chen, W.; Zhao, H. Integrated impact of the carbon quota constraints on enterprises within supply chain: Direct cost and indirect cost. Renew. Sustain. Energy Rev. 2018, 92, 774–783. [Google Scholar]
  44. Sun, J.; Li, G.; Wang, Z. Optimizing China’s energy consumption structure under energy and carbon constraints. Struct. Change Econ. Dyn. 2018, 47, 57–72. [Google Scholar] [CrossRef]
  45. Xia, C.; Wang, Z.; Xia, Y. The drivers of China’s national and regional energy consumption structure under environmental regulation. J. Clean. Prod. 2021, 285, 124913. [Google Scholar] [CrossRef]
  46. Cong, R.G.; Wei, Y.M. Potential impact of (CET) carbon emissions trading on China’s power sector: A perspective from different allowance allocation options. Energy 2010, 35, 3921–3931. [Google Scholar] [CrossRef]
  47. Shen, B.; Yang, X.; Xu, Y.; Ge, W.; Liu, G.; Su, X.; Zhao, S.; Dagestani, A.A.; Ran, Q. Can carbon emission trading pilot policy drive industrial structure low carbon restructuring: New evidence from China. Environ. Sci. Pollut. Res. 2023, 30, 41553–41569. [Google Scholar] [CrossRef]
  48. Apergis, N.; Payne, J.E. Renewable and non-renewable electricity consumption–growth nexus: Evidence from emerging market economies. Appl. Energy 2011, 10, 5226–5230. [Google Scholar] [CrossRef]
  49. Frondel, M.; Ritter, N.; Schmidt, C.M.; Vance, C. Economic impacts from the promotion of renewable energy technologies: The German experience. Energy Policy 2010, 38, 4048–4056. [Google Scholar] [CrossRef]
  50. Al-Nory, M.T. Optimal decision guidance for the electricity supply chain integration with renewable energy: Aligning smart cities research with sustainable development goals. IEEE Access 2019, 7, 74996–75006. [Google Scholar] [CrossRef]
  51. Barari, S.; Agarwal, G.; Zhang, W.J.C.; Mahanty, B.; Tiwari, M.K. A decision framework for the analysis of green supply chain contracts: An evolutionary game approach. Expert Syst. Appl. 2012, 39, 2965–2976. [Google Scholar] [CrossRef]
  52. Vasnani, N.N.; Chua, F.L.S.; Ocampo, L.A.; Pacio, L.B.M. Game theory in supply chain management: Current trends and applications. Int. J. Appl. Decis. Sci. 2018, 12, 56. [Google Scholar] [CrossRef]
  53. Huang, C.; Du, S.; Wang, B.; Tang, W. Accelerate or hinder it? Manufacturer transformation under competition and carbon emission trading. Int. J. Prod. Res. 2023, 61, 6230–6250. [Google Scholar] [CrossRef]
  54. Xia, T.; Wang, Y.; Lv, L.; Shen, L.; Cheng, T.C.E. Financing decisions of low-carbon supply Chain under Chain-to-Chain competition. Int. J. Prod. Res. 2023, 61, 6153–6176. [Google Scholar] [CrossRef]
  55. Jian, M.; He, H.; Ma, C.; Wu, Y.; Yang, H. Reducing greenhouse gas emissions: A duopoly market pricing competition and cooperation under the carbon emissions cap. Environ. Sci. Pollut. Res. 2019, 26, 16847–16854. [Google Scholar] [CrossRef] [PubMed]
  56. Zhao, L.; Zhang, J. Analysis of a duopoly game with heterogeneous players participating in carbon emission trading. Nonlinear Anal. Model. Control 2014, 19, 118–131. [Google Scholar] [CrossRef]
  57. Chen, X.; Hao, G. Sustainable pricing and production policies for two competing firms with carbon emissions tax. Int. J. Prod. Res. 2014, 53, 6408–6420. [Google Scholar] [CrossRef]
  58. Zheng, Y.; Zhou, W.; Chen, X.; Huang, W. The effect of emission permit allocation in an early-stage cap-and-trade for a duopoly market. Int. J. Prod. Res. 2021, 59, 909–925. [Google Scholar] [CrossRef]
  59. Zhao, X.G.; Chen, H.; Hu, S.; Zhou, Y. The impact of carbon quota allocation and low-carbon technology innovation on carbon market effectiveness: A system dynamics analysis. Environ. Sci. Pollut. Res. 2023, 30, 96424–96440. [Google Scholar] [CrossRef] [PubMed]
  60. Poddar, S.; Banerjee (Chatterjee), T.; Banerjee, S. Taxation on duopoly e-commerce platforms and their search environments. Bus. Econ. 2023, 3, 140. [Google Scholar] [CrossRef]
  61. Belleflamme, P.; Toulemonde, E. Tax incidence on competing two-sided platforms. J. Public Econ. Theory 2018, 20, 9–21. [Google Scholar] [CrossRef]
  62. Giri, B.C.; Mondal, C.; Maiti, T. Analysing a closed-loop supply chain with selling price, warranty period and green sensitive consumer demand under revenue sharing contract. J. Clean. Prod. 2018, 190, 822–837. [Google Scholar] [CrossRef]
  63. Hossain, M.R.; Singh, S.; Sharma, G.D.; Apostu, S.A.; Bansal, P. Overcoming the shock of energy depletion for energy policy? Tracing the missing link between energy depletion, renewable energy development and decarbonization in the USA. Energy Policy 2023, 174, 113469. [Google Scholar] [CrossRef]
  64. Ma, C.; Tan, L.; Zhou, S.; Wang, X.; Zhang, X. Joint production and pricing strategy under carbon cap-and-trade policy. In Proceedings of the 2014 International Conference on Logistics Engineering and Management. System Planning, Supply Chain Management and Safety (ICLEM 2014), Shanghai, China, 9–11 October 2014; pp. 427–433. [Google Scholar]
  65. What Is Emissions Trading? Available online: https://www.epa.gov/emissions-trading-resources/what-emissions-trading (accessed on 17 June 2024).
  66. EU Emissions Trading System (EU ETS). Available online: https://climate.ec.europa.eu/eu-action/eu-emissions-trading-system-eu-ets_en (accessed on 15 June 2024).
  67. Zhang, Y.J.; Wang, W. How does china’s carbon emissions trading (cet) policy affect the investment of cet-covered enterprises? Energy Econ. 2021, 98, 105224. [Google Scholar] [CrossRef]
Figure 1. Relationships between Decision Makers.
Sustainability 16 05787 g001
Figure 2. Generating Capacity.
Sustainability 16 05787 g002
Figure 3. Profit of Power Generation Enterprise.
Sustainability 16 05787 g003
Figure 4. Environmental Cost of Power Supply Chain.
Sustainability 16 05787 g004
Figure 5. Market Share of Clean Energy Generation.
Sustainability 16 05787 g005
Table 1. Parameter comparison table.
SymbolImplication
aUnit output of thermal power generation
bUnit output of clean energy power generation
β Power supply chain competition level
PUnit electricity price
kUnit carbon price
e t Technological innovation investment level of thermal power generation
e n Technological innovation investment level of clean energy power generation
q t Actual output of thermal power generation
q n Actual output of renewable energy generating
λ t Cost coefficient of technological innovation in thermal power generation
λ n Cost coefficient of technological innovation in clean energy power generation
π t Profits of thermal power
π n Profits of clean energy power
I t Unit carbon quota of thermal power generation
I n Unit carbon quota of clean energy power generation
E t Environment cost of thermal power generation
E n Environment cost of clean energy power generation
ETotal environmental cost of electricity supply chain
M S Market share of clean energy generation
Disclaimer/Publisher’s Note: The statements, opinions and data contained in all publications are solely those of the individual author(s) and contributor(s) and not of MDPI and/or the editor(s). MDPI and/or the editor(s) disclaim responsibility for any injury to people or property resulting from any ideas, methods, instructions or products referred to in the content.

