Article

Decomposition Analysis of Carbon Emission Drivers and Peaking Pathways for Key Sectors under China’s Dual Carbon Goals: A Case Study of Jiangxi Province, China

1
School of Economics and Management, Nanchang Hangkong University, Nanchang 330063, China
2
Institute of Civil-Military Integration and Aviation Development, Nanchang Hangkong University, Nanchang 330063, China
3
Jiangxi Regional Economy and Competitiveness Research Center, Nanchang Hangkong University, Nanchang 330063, China
*
Author to whom correspondence should be addressed.
Sustainability 2024, 16(13), 5811; https://doi.org/10.3390/su16135811
Submission received: 3 June 2024 / Revised: 23 June 2024 / Accepted: 5 July 2024 / Published: 8 July 2024

Abstract

:
Clarifying the factors influencing CO2 emissions and their peaking pathways in major sectors holds significant practical importance for achieving regional dual-carbon goals. This paper takes Jiangxi, a less developed demonstration zone in central China, as an example. It pioneeringly combines the LMDI method, Tapio decoupling model, and LEAP model to multi-dimensionally analyze the driving mechanisms, evolution patterns, and dynamic relationships with the economic development of carbon emissions in Jiangxi’s key sectors from 2007 to 2021. It also explores the future carbon emission trends and peaking potentials of various sectors under different scenarios. Our results show that (1) Carbon emissions in various sectors in Jiangxi have continued to grow over the past fifteen years, and although some sectors have seen a slowdown in emission growth, most still rely on traditional fossil fuels; (2) Economic growth and industrial structure effects are the main drivers of carbon emission increases, with a general trend towards decoupling achieved across sectors, while agriculture, forestry, animal husbandry and fishery, and ferrous metal smelting have shown a decline in their decoupling status; (3) In the carbon reduction and low-carbon scenarios, the carbon emission peaks in Jiangxi are estimated to be 227.5 Mt and 216.4 Mt, respectively, and targeted strategies for high-emission industries will facilitate a phased peak across sectors and enhance emissions reduction benefits. This has significant reference value for the central region and even globally in formulating differentiated, phased, sector-specific carbon peaking plans, and exploring pathways for high-quality economic development in tandem with ecological civilization construction.

1. Introduction

In recent years, the continuous increase in carbon dioxide and other greenhouse gases due to human activities has led to the impact of extreme adverse meteorological disasters in many parts of the world, posing a significant threat to human society’s living environment [1] and economic and social development [2], and arousing widespread concern in the international community [3,4,5]. Coal, natural gas, and petroleum, as the primary fossil fuels, represent significant impediments to the global economic decarbonization process [6]. Their use extends beyond powering the electric grid, heating buildings, and fueling transportation systems; these fuels are also integral to the production of a wide array of everyday products, including plastics, textiles, packaging, and pharmaceuticals [7]. The pervasive presence of these fossil fuels indicates that decarbonization efforts will encounter substantial resistance at both the micro and macro levels [8,9,10]. Consequently, understanding the energy consumption patterns of various sectors and the associated carbon emissions they produce is crucial. Key sectors not only serve as major sources of greenhouse gas emissions but also represent critical focal points for meeting carbon reduction targets [11,12,13]. The carbon emission characteristics of different industries and their impact on economic activities have significant differences, and accurately grasping the current situation of carbon emissions in various sectors, key driving factors, and their relationship with economic development, are of great significance for formulating targeted emission reduction policies and promoting the green and low-carbon transformation of the economy and society [14]. China, as the world’s largest developing country and a major carbon emitter, has seen rapid economic growth accompanied by a significant increase in energy consumption and carbon emissions in recent years [15]. Facing the dual challenges of economic development and ecological civilization, the Chinese government established a “1 + N” policy system, which is guided by the “Working Guidance for Carbon Dioxide Peaking and Carbon Neutrality in Full and Faithful Implementation of the New Development” and the “Action Plan for Peaking Carbon Emissions Before 2030”, with corresponding implementation plans formulated for various sectors and industries. As the implementation timeline for this “dual carbon” strategy draws near, accurately grasping the driving factors and evolution patterns of carbon emissions in different regions, and formulating differentiated carbon peaking roadmaps and policy measures according to local conditions, are the real challenges China must face to achieve its carbon peaking goal. On the one hand, the characteristics of China’s industrial structure determine the dominant position of the industrial sector, especially high-energy-consuming industries in carbon emissions [16], and the high proportion of traditional fossil energy makes the task of carbon emission reduction arduous [17]; on the other hand, as the industrialization and urbanization process continues to advance, the carbon emissions of transportation, construction, and other service industries have grown rapidly, becoming increasingly prominent [18]. Meanwhile, in China’s vast territory and unbalanced regional development, significant differences exist among the eastern, central, and western regions in terms of resource endowment, industrial structure, and energy consumption patterns [19]. This regional disparity poses higher demands on China’s formulation of a national carbon peaking plan and the coordinated implementation of carbon emission reduction actions in various regions [20]. Due to more developed economies and a larger proportion of the tertiary industry, the eastern coastal areas have relatively lower carbon emission intensity per unit of GDP, while the central and western regions, characterized by a higher proportion of heavy industry and coal consumption, exhibit a more pronounced dependency of carbon emissions on economic growth [21], facing more severe emission reduction challenges.
Jiangxi Province, as a key province in Central China and a national inland open economic pilot zone, is in the midst of rapid industrialization and urbanization. In 2022, the province’s gross regional product exceeded three trillion yuan for the first time, demonstrating robust economic growth. However, Jiangxi’s economic structure is characterized by a high proportion of energy-intensive and high-emission industries, with increasing energy consumption heavily reliant on coal and petroleum. This rapid development trajectory raises concerns about potential environmental repercussions and a consequent rise in carbon emissions. Despite these challenges, Jiangxi’s total carbon emissions and per capita emissions remain the lowest among the six central provinces, only representing 60% and 75% of the national average, respectively. This underscores Jiangxi’s unique advantages and potential to serve as a model for achieving carbon peaking and carbon neutrality goals. As a province with rapid development potential in the central region, Jiangxi shares certain similarities with other central provinces in terms of the level of economic development, industrial structure, and resource endowment [22]. A thorough analysis of the leading driving factors of CO2 reduction in Jiangxi Province and exploring the path to achieving carbon peaking as early as possible while maintaining rapid economic growth have typical significance for identifying the key points of energy saving and emission reduction in the central region and leading regional green and low-carbon development. Therefore, as the only province that is both a national ecological civilization pilot zone and a pilot for the realization mechanism of the ecological product value, Jiangxi Province has a long way to go in exploring the path of coordinated development of high-quality economic growth and ecological civilization construction.
Current research on the factors influencing carbon emissions primarily employs the STIRPAT model [23], spatial econometric models [24], and decomposition analysis [25,26] to conduct rich discussions from various perspectives. The common themes emerging from these studies are that the carbon emissions from key sectors such as agriculture [27], industry [28], construction [29], transportation [30], and electricity [31], among others, are influenced by a combination of factors including policies, economy, population, energy consumption intensity, industrial structure, and energy mix [32,33]. However, despite the widespread recognition of the potential contradictions between economic growth and carbon reduction, how to achieve the early peaking of carbon emissions while maintaining stable economic growth remains a significant challenge [34]. It is worth noting that existing research on the factors affecting regional industry carbon emissions and peaking pathways has several differences and limitations [35]. Firstly, most studies are based on national [36,37] or multiple regional scales [38], often overlooking the lessons from pioneering cities; Secondly, most of the literature discusses carbon-peaking pathways from the perspective of a single specific industrial sector, while research on differentiated synergistic peaking across various major sectors remains relatively weak. Thirdly, existing research tends to focus on the mechanisms of carbon emission influences from a static perspective, lacking sufficient attention to the dynamic evolution of carbon emission driving effects at different stages of development. In fact, achieving carbon peaking does not require all sectors to peak simultaneously but involves ensuring stable economic operation while gradually achieving staged peaking in various sectors, ultimately reaching the goal of comprehensive carbon peaking. Therefore, it is more necessary to clarify the emission reduction mechanisms and effects of each sector and to plan resources rationally [39]. Further research to clarify the factors influencing carbon emissions in regional sectors and whether there is a decoupling relationship with economic growth, as well as to predict future trends in carbon emissions and peaking situations in various sectors, have become particularly urgent and important.
This paper takes Jiangxi Province as an example and innovatively combines three methods: the Logarithmic Mean Divisia Index (LMDI), the Tapio decoupling model, and the Long-range Energy Alternatives Planning (LEAP) system model. The LMDI decomposition reveals the underlying emission drivers, the Tapio model evaluates the evolution patterns of the emission-economy decoupling, and the LEAP model further scientifically designs future scenarios to quantitatively assess the trends and peaking potentials of carbon emissions in various sectors (Figure 1). This integrated framework provides theoretical and practical insights for Jiangxi Province to explore differentiated and phased sector-specific carbon peaking pathways aligned with its “dual carbon” goals, thereby promoting green and low-carbon regional development. The remainder of this paper is organized as follows. Section 2 describes the research methods and data sources utilized in this study. Section 3 presents and discusses the empirical analysis results, including sector-specific carbon emissions, energy consumption trends, factors influencing emissions, and decoupling from economic growth, alongside future emission scenarios until 2050. Finally, Section 4 summarizes the main conclusions, discusses the implications for regional carbon peaking strategies, and offers recommendations for future policy and research.

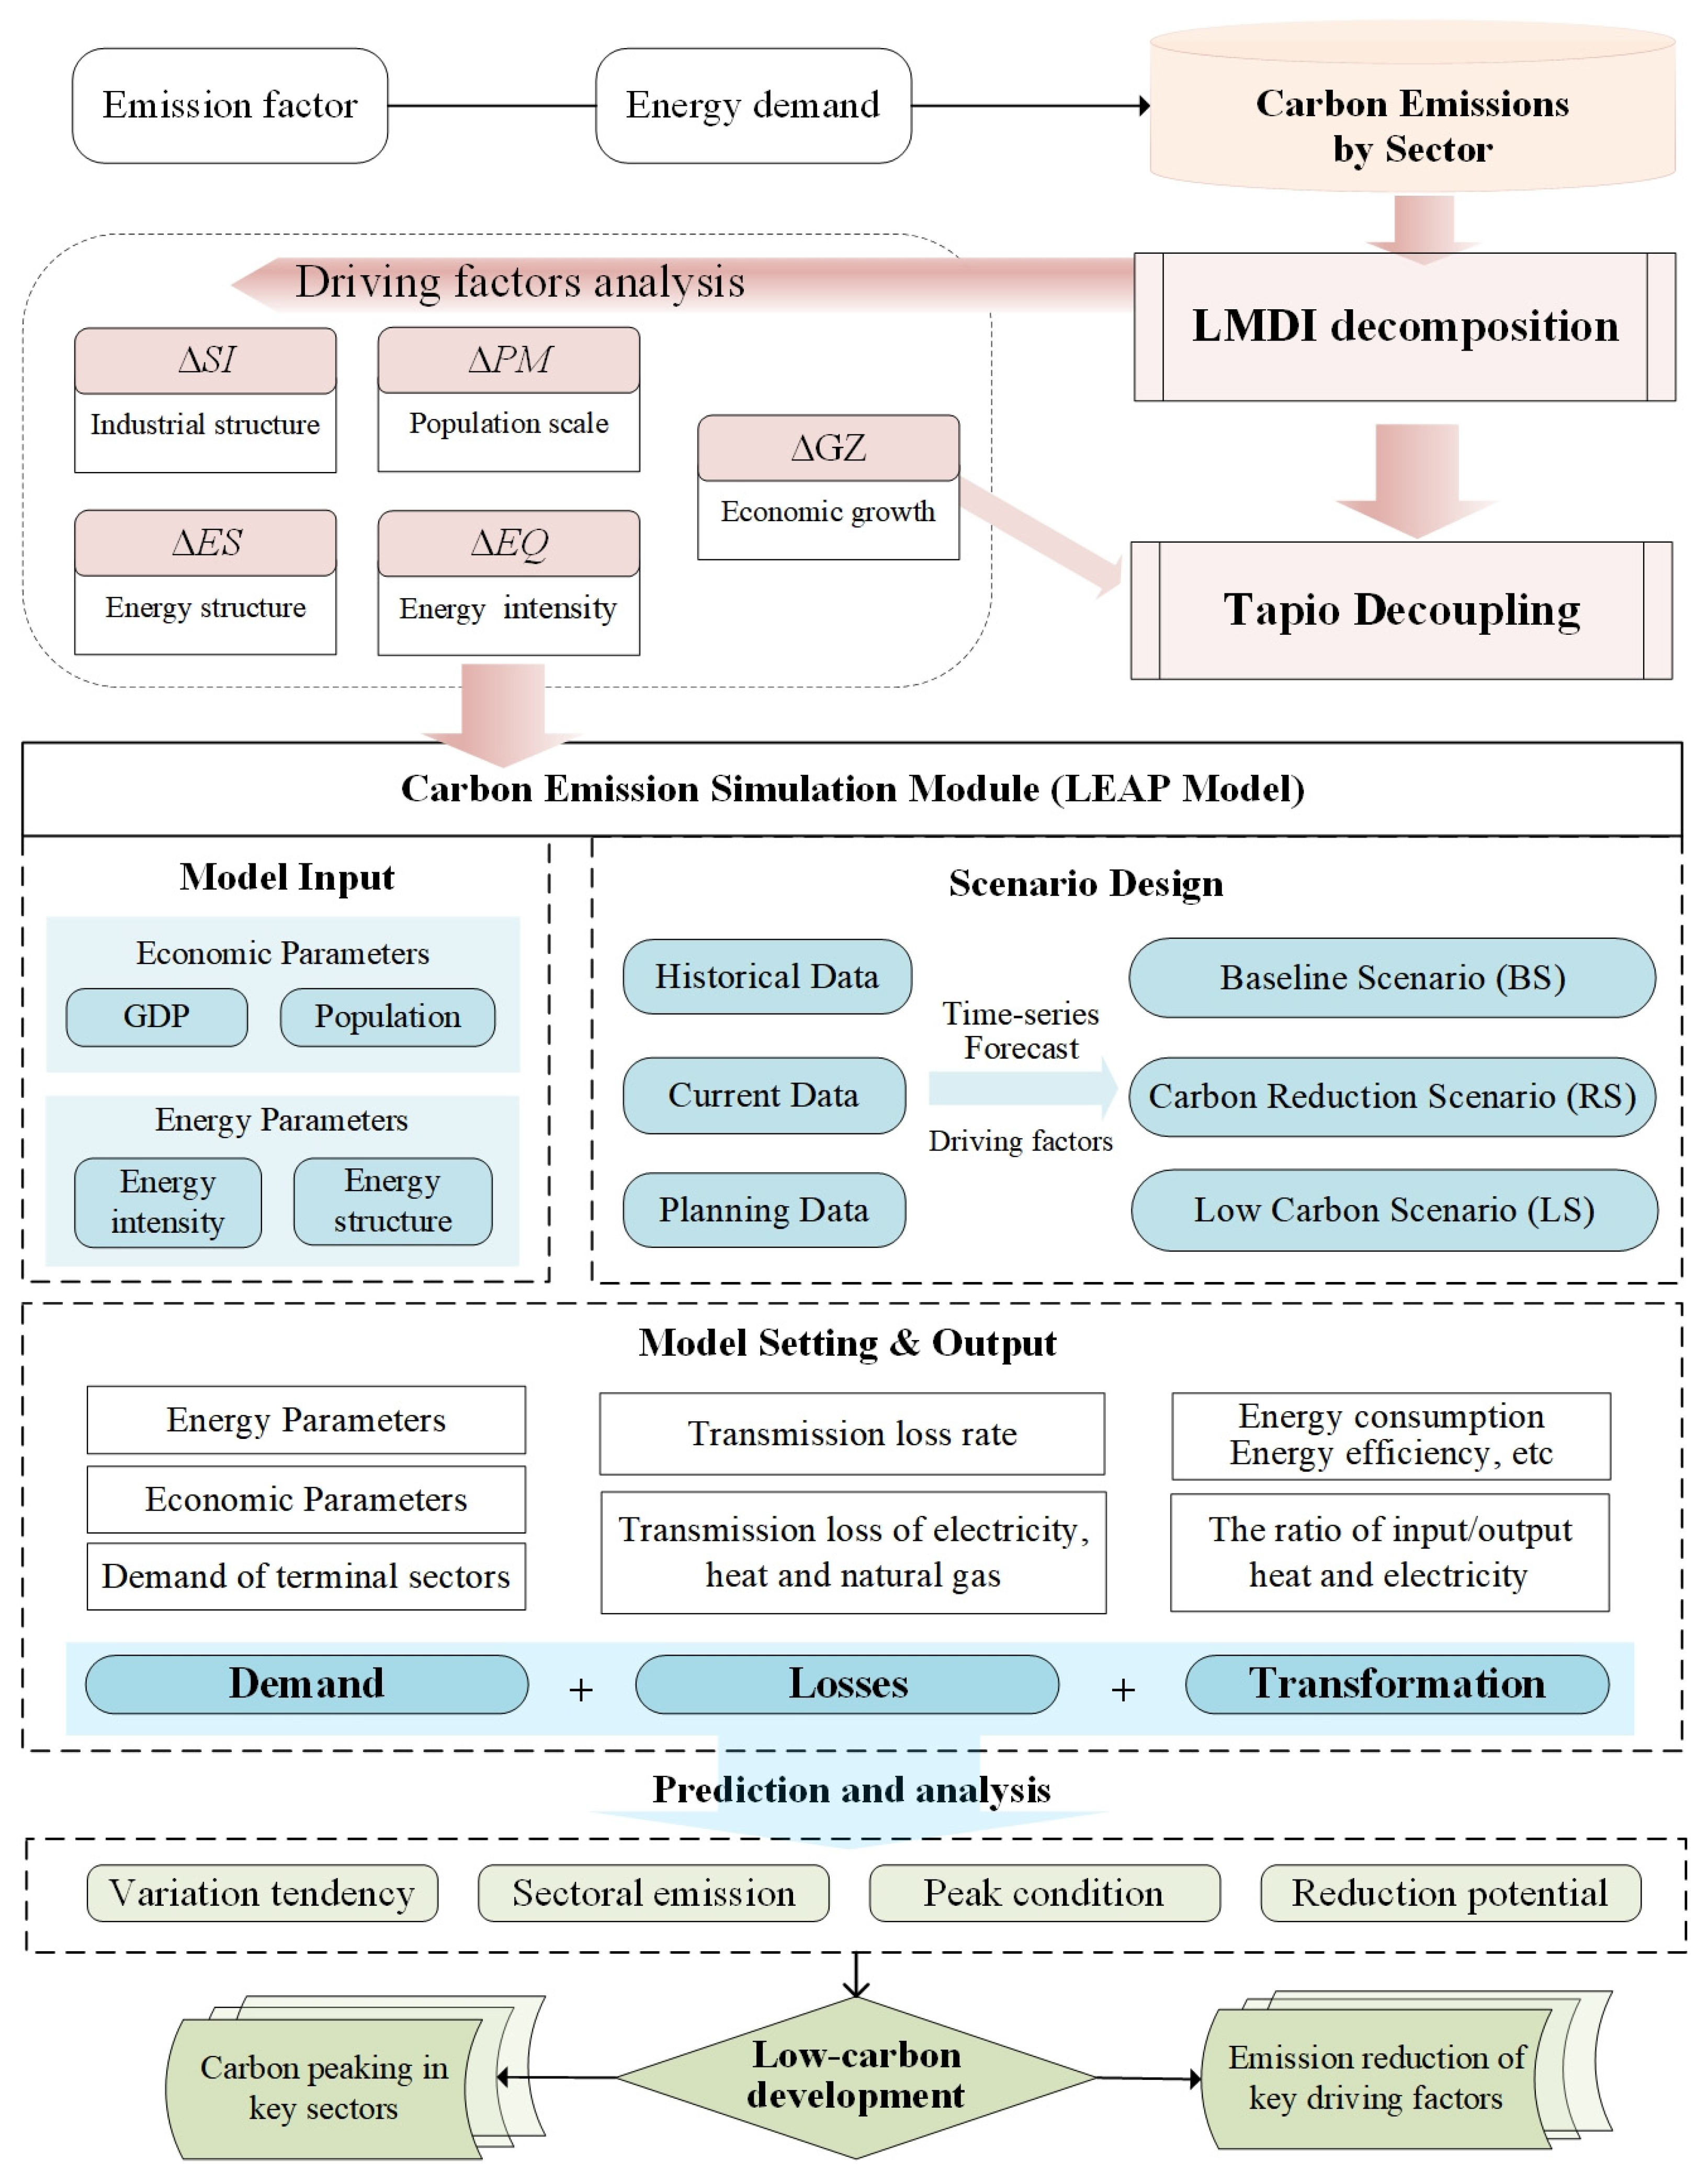
2. Materials and Methods
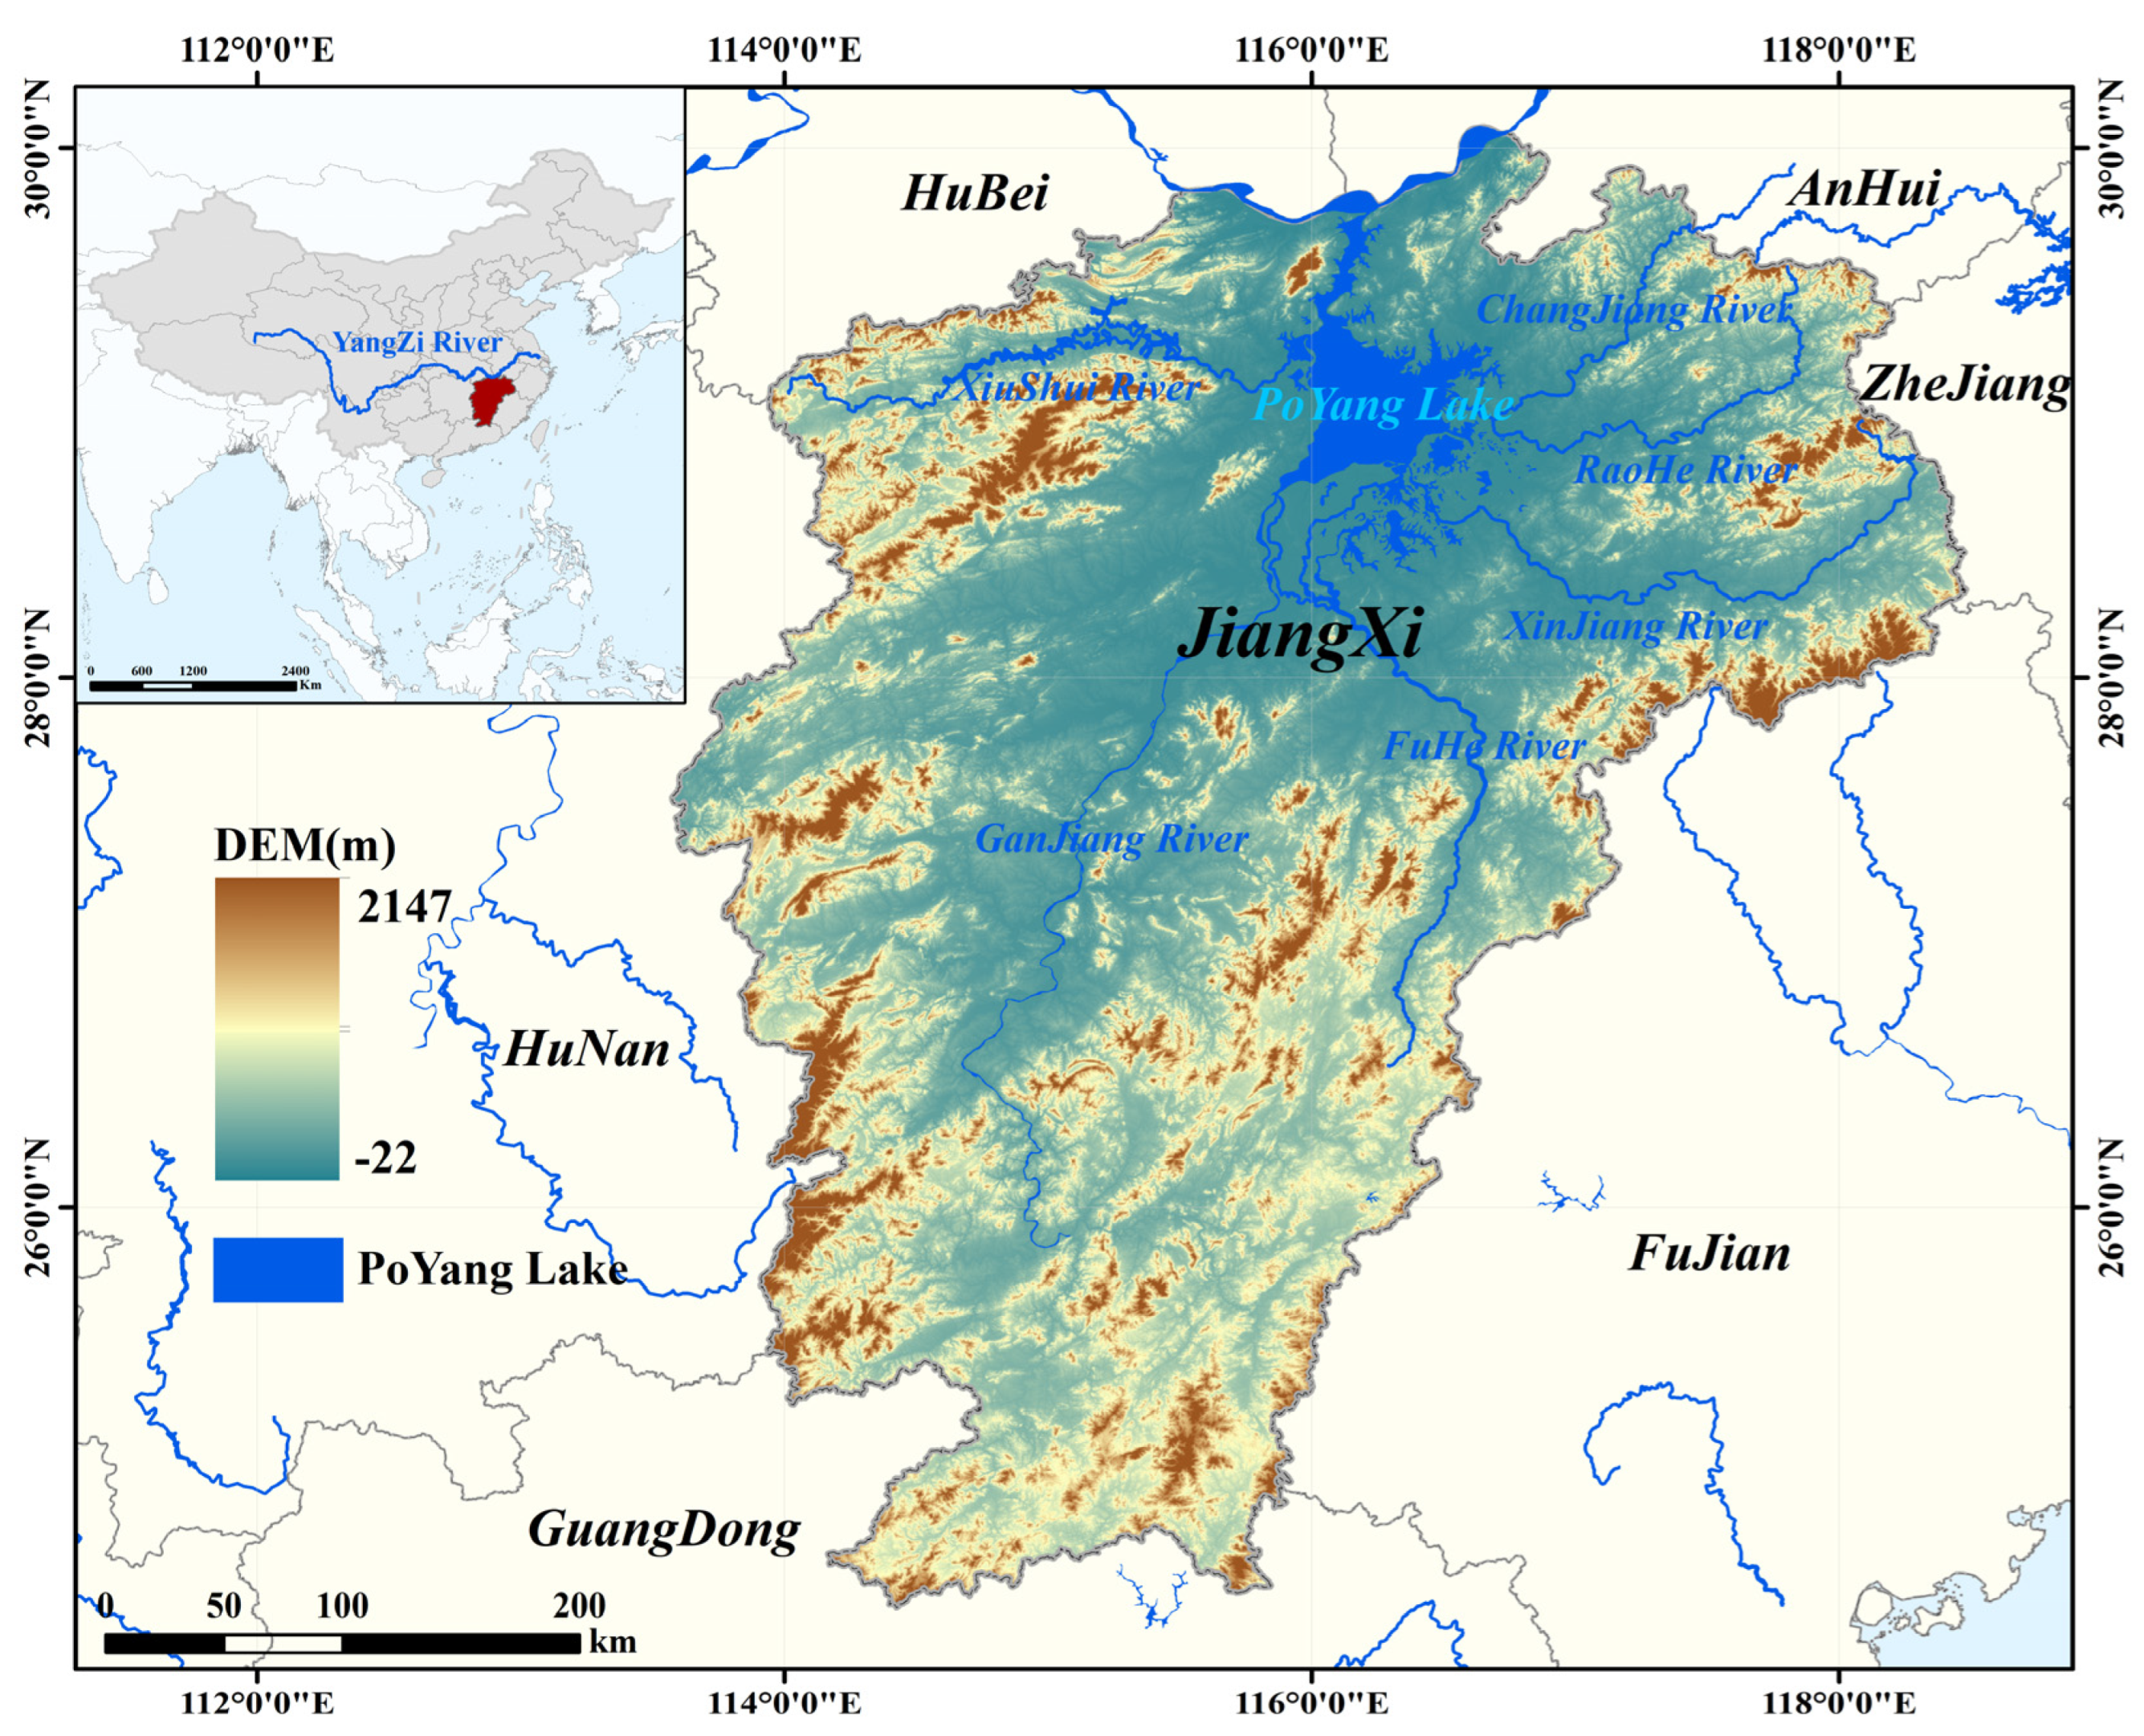
2.1. Research Area

Jiangxi Province, located in southeastern China along the southern bank of the middle and lower reaches of the Yangtze River, spans between longitudes 113°34′36″ E to 118°28′58″ E and latitudes 24°29′14″ N to 30°04′41″ N, covering a total land area of 166,900 square kilometers (Figure 2). Its advantageous geographical location is characterized by widespread mountains and hills, with major water systems such as the Gan River and Poyang Lake crisscrossing the region. These favorable features not only create a substantial forest carbon sink, presenting considerable potential for development, but also foster a variety of renewable energy resources [40], including hydro and wind power, bolstering the province’s commitment to developing a green, low-carbon economy.
Industrially, Jiangxi has established a strong foundation in sectors like non-ferrous metals, electronic information, equipment manufacturing, and aviation, all of which have experienced rapid growth. In 2021, the added value of strategic emerging industries, high-tech industries, and equipment manufacturing accounted for 22.1%, 38.2%, and 28.5% of the total industrial output above designated size, respectively. Despite these advancements, high-energy-consuming industries such as ferrous and non-ferrous metal smelting and non-metallic mineral product manufacturing continue to represent a significant portion of the industrial output, with coal as the predominant source in the energy consumption structure. In 2022, the secondary sector contributed 44.8% to Jiangxi’s economic output, exceeding the national average of 39.9%. Consequently, while the province has made considerable strides in developing emerging industrial sectors, reducing carbon emissions in high-energy-consuming and high-emission industries remains a formidable challenge. Achieving peak carbon and carbon neutrality are ambitious goals that reflect the ongoing challenges in these sectors.

2.2. Sector-Specific Carbon Emission Accounting

Given the absence of publicly available, up-to-date sector-specific carbon emission data, this study utilizes the “National Greenhouse Gas Inventories Guidelines” by the IPCC [41]. It calculates the carbon emissions for Jiangxi Province’s 12 major sectors (detailed in Appendix A Table A1) using 15 primary types of fossil energy, according to Equation (1):
T C = i = 1 12 j = 1 15 E j · C j = i = 1 12 j = 1 15 E j · N C V j · C E F j · C O F j · 44 12
where j represents the 15 different types of energy, and i represents the 12 different sectors. The terms TC, Ej, and Cj correspond to the total carbon emissions, the consumption of the j-th type of energy, and the emission factor, respectively. Additionally, NCVj, CEFj, and COFj denote the average lower heating value, the carbon content per unit of energy, and the carbon oxidation rate of the j-th type of energy, respectively. Detailed parameters for these variables are provided in Appendix A Table A2.

2.3. LMDI Decomposition

The Logarithmic Mean Divisia Index (LMDI) decomposition method, known for its path independence, completeness of decomposition and lack of residuals [42,43], is widely used to analyze the contribution of various factors to carbon emissions. The Kaya identity serves as the theoretical foundation for the LMDI decomposition method, describing the relationship between carbon emissions and their influencing factors. Based on the modified Kaya identity [44], Equation (2) is constructed for the factors influencing carbon emissions in major sectors:
T C = i = 1 12 j = 1 15 C i j E i j × E i j E i × E i G i × G i G × G P × P = i j C H × E S × E Q × S I × G Z × P M
where Cij and Eij, respectively, represent the carbon emissions and energy consumption from fossil fuels in sector i; G is the total industrial output value, and P represents the total population at the end of the year; the factors GZ, PM, CH, ES, EQ, and SI stand for the GDP economic growth effect, population scale effect, carbon emission coefficient effect, energy structure effect, energy intensity effect, and industrial structure effect, respectively.
This paper applies the above decomposition Equation (2) to the LMDI decomposition method and quantitatively decomposes the effects of various factors using the LMDI additive decomposition method, as shown in Equation (3):
Δ C t o t = C t C o = Δ C H + Δ E S + Δ E Q + Δ S I + Δ G Z + Δ P M
where Co and Ct represent the CO2 emissions in the base year and the target year, respectively, ΔCH, ΔES, ΔEQ, ΔSI, ΔGZ, ΔPM, respectively, represent the contributions of each factor effect to the change in carbon emissions. Since the carbon emission coefficient remains constant, its effect is not considered in the analysis.
The calculation formulas for the effects of various factors are as follows:
Δ C x = i j L ( C i j T , C i j o ) ln ( x T x o )  
L ( C i j T , C i j o ) = C i j T   or   C i j o   ,   C i j T = C i j o C i j T C i j o ln C i j T     ln C i j o   ,   C i j T C i j o 0 , C i j T = C i j o = 0
In the formulas, x represents the aforementioned decomposition effects, CTij and COij represent the CO2 emissions from fossil fuels in sector i in the target and base years, respectively, L(CTij, COij) represents the weight, and xT and xo, respectively, represent the values of the influencing variables in the target and base years.
For ease of comparison, the relative contribution degree z is used to measure the impact of each effect on carbon emissions. As shown in Equation (6), the magnitude of z directly correlates with the strength of its impact on carbon emissions, where larger values signify a greater influence on increasing emissions.
z = Δ C x x | Δ C x | × 100 %

2.4. Decoupling Analysis

Tapio Decoupling Model

The Tapio decoupling model (Equation (7)), based on time-series characteristics, analyzes the decoupling states between regional economic development and energy input consumption as well as environmental pressure over different time periods [45]. It reveals the coupling relationship between economic development and carbon emissions, that is, the trend from negative decoupling to strong decoupling [46]. This helps to assess the effectiveness of sector energy-saving and emission-reduction policies more accurately.
μ = Δ C / C o Δ G D P / G D P o
where μ represents the decoupling coefficient, ΔC and ΔGDP, respectively, represent the changes in emissions and gross production value of each sector, Co and GDPo, respectively, represent the base period’s carbon emissions and gross production value. Based on the range of changes in the decoupling elasticity index values, the decoupling states can be subdivided into eight states under three main types: linkage, decoupling, and negative decoupling (Figure 3), among which strong decoupling in the fourth quadrant is the most ideal decoupling outcome.

2.5. LEAP Model

The Long-range Energy Alternatives Planning (LEAP) model is a “bottom–up” accounting model mainly used for energy policy decision analysis and corporate energy saving and emission reduction planning assessment [47]. It evaluates the impact of different policy and technological choices on energy demand, supply, carbon emissions, and costs by simulating energy consumption and production processes [48]. This paper incorporates the LMDI decomposition results as important parameter inputs into the LEAP model, taking into account the trends of carbon emission influencing factors, and thus enhancing the scientific nature and reliability of scenario simulations. At the same time, by setting different policy scenarios, the future trends and peaking times of carbon emissions in various sectors are analyzed and compared, and emission reduction paths are simulated from aspects such as energy structure, energy intensity, and industrial structure, as shown in the following formula:
E D = i 12 j 15 A l i × E q i j
The model assumes that the final energy demand (ED) of each sector can be represented by its activity level (Al) and energy intensity (Eq). Since only industry activities are considered (excluding household energy consumption expenditure), economic indicators (added value of each industry) are used for measurement. The energy consumption sector of this model is divided into twelve parts. However, due to the statistical scope of the LEAP model and the omission of certain emission sources, such as refinery dry gas, deviations are observed in the base year carbon emission accounting results. Therefore, this paper makes reasonable adjustments to the carbon emission values of 2021 to adjust the proportion of overall forecast values accordingly, thus improving the comparability of the results.

2.6. Data Sources

This study’s selection of sector categories takes into account the national industry classification system, energy balance sheet divisions, and data availability, ensuring the thorough coverage of the province’s main carbon emission sources. The data on energy consumption by various sectors comes from the annual “China Energy Statistical Yearbook”, while the socio-economic data such as gross industrial output value and year-end population numbers are derived from the annual “Jiangxi Statistical Yearbook”. To account for inflation, GDP is adjusted based on the constant prices of the year 2007. Since the GDP of different sectors cannot be fully obtained, this paper measures it using the product of the proportion of subdivided sectoral assets and the total sectoral output value. Furthermore, to prevent double-counting, the accounting of carbon emissions in this paper exclusively considers emissions from the combustion of fossil energy in the terminal consumption of each sector and excludes carbon emissions from production processes.

3. Results

3.1. Sector-Specific Carbon Emission Analysis

From 2007 to 2021, the total carbon emissions from various sectors in Jiangxi Province increased from 120 Mt to 213.8 Mt, with an average annual growth rate of 4.21%, which is significantly lower than the 7.59% average annual growth rate of the total production value of these sectors over the same period. This disparity is largely attributable to the Jiangxi government’s concerted efforts in optimizing energy and industrial structures, achieving notable progress in energy conservation and emissions reduction across major sectors. As depicted in Figure 4, a broad array of sectors, including agriculture, forestry, animal husbandry and fishery, the textile industry, chemical raw materials and chemical products manufacturing, and the combined sectors of wholesale and retail trade and accommodation and catering services, are exhibiting a deceleration in carbon emission growth, approaching peak emission status. Nevertheless, high-energy-consuming industries such as ferrous metal smelting, non-metallic mineral products, and electricity and heat production continue to be the primary drivers of carbon emission increases. While the carbon emission growth rate in the petroleum and coal processing industry has seen a recent decline, ongoing expansions in infrastructure, such as roads, railways, waterways, and the transportation network, have not fully counteracted the rising carbon emissions from the transportation sector, which predominantly relies on fossil fuels.

3.2. Energy Consumption Status Analysis

The total energy consumption in Jiangxi Province’s sectors in 2021 was approximately 88.213 million tons of standard coal, demonstrating an annual average growth rate of around 4.25%. This rate is slightly higher than the 4.21% growth rate of carbon emissions, suggesting ongoing improvements in the energy structure and enhanced energy utilization efficiency. As illustrated in Figure 5, coal and petroleum remain the predominant energy sources in the province’s sectors, constituting 75.5% and 23.8% of the total fossil energy consumption, respectively. In contrast, natural gas constitutes a mere 0.7% of the energy mix. The prevalent use of high-carbon energy sources is evident across various sectors. Sectors with substantial energy demands—such as petroleum and coal processing, non-metallic mineral product manufacturing, ferrous metal smelting, and electricity production and supply—lead in energy usage. Consequently, the secondary industry continues to account for the majority of energy consumption, totaling 86.8%. Looking forward, there is significant potential for optimizing the energy consumption structure, particularly within the secondary sector in Jiangxi Province.

3.3. Decomposition of Carbon Emission Influencing Factors

To delve deeper into the factors influencing the changes in carbon emissions in Jiangxi Province, this study aligns its analysis with the Five-Year Plans for National Economic and Social Development, using these plans as temporal markers. The research period is segmented into three key phases: 2007–2011, 2012–2016, and 2017–2021. Within each phase, the relative contribution degree z of each factor is calculated, as presented in Table 1. Notably, the economic growth effect in the main sectors consistently shows the largest relative contribution, underscoring economic development as a principal driver of carbon emissions in the province. Concurrently, there is a noticeable resurgence in the impact of industrial structure, suggesting that high-energy-consumption industries might have experienced rapid growth, exacerbating the carbon emission issues. Furthermore, the trends in the relative contributions of energy structure and energy intensity across different sectors indicate an increasing suppressive effect on carbon emissions. Additionally, the influence of population scale on increasing carbon emissions in various sectors is progressively diminishing.

3.3.1. Energy Structure Effect

As illustrated in Table 1, the energy structure effect across various sectors exhibits a generally consistent declining trend over time. Notably, sectors such as agriculture, forestry, animal husbandry and fishery, transportation, wholesale and retail, and accommodation and catering services have seen effective adjustments in their energy structures, with an increasing inhibitory effect on carbon emissions. This trend is largely attributable to the increased adoption of renewable and clean energy sources, including natural gas and primary electricity, during the “13th Five-Year Plan” period, coupled with a decrease in the consumption of traditional fossil energies like coal and oil. Despite these advances, the current reduction effect on carbon emissions remains relatively limited. There is a critical need for the ongoing optimization of the energy structure in each sector, particularly in high-energy-consumption industries such as ferrous metal smelting and rolling processing, petroleum, coal, and other fuel processing, as well as the textile industry. It is essential to actively promote the adoption of new energy sources, reduce dependency on coal, and other fossil fuels, and accelerate the development of a low-carbon clean energy system.

3.3.2. Energy Intensity Effect

In the initial period from 2007 to 2011, the energy intensity effect in the agriculture, forestry, animal husbandry, and fishery and industrial sectors displayed a negative relative contribution, thereby inhibiting CO2 emissions. Conversely, during the same period, all sectors within the tertiary industry exhibited a positive effect. This was largely due to the prevalence of outdated technologies and equipment in early stage sectors such as transportation, wholesale and retail, and accommodation and catering services, which led to relatively low energy utilization rates. In the two following periods, most industrial sectors showed a further decrease in their contributions, underscoring significant strides made under the “13th Five-Year Plan”. Technological advancements in Jiangxi Province have continually enhanced energy efficiency across sectors. However, sectors like the paper and paper products industry and the petroleum, coal, and other fuel processing industries experienced a resurgence in their energy structure effects, signaling a need for vigilance to mitigate the risks of declining energy efficiency. The energy intensity contribution in the transportation sector exhibited considerable fluctuations, emphasizing the importance of improving energy utilization within this sector as a focal point of Jiangxi Province’s efforts to reduce carbon emissions. Looking ahead, it will be crucial to continue promoting energy conservation in transportation, expedite the development of waterways, railways, and pipelines, and actively encourage the adoption of energy-saving and new energy vehicles.

3.3.3. Industrial Structure Effect

During the initial period from 2007 to 2011, the industrial structure effect in the primary and tertiary industries showed an inhibitory effect on carbon emissions. Even as the proportion of some high-energy-consuming industries increased, it did not lead to a corresponding sharp rise in carbon emissions. In the subsequent period from 2012 to 2016, the industrial structure effect for most industrial sectors in Jiangxi Province turned negative, indicating that the province was actively promoting the restructuring of its industrial base, effectively curbing the expansion of high-carbon industries. However, industries such as the textile, paper and paper products, and construction sectors experienced a rebound, reflecting rapid development during this period and outpacing the efforts in optimizing and upgrading industrial structures in line with energy consumption and emission reductions. By the period of 2017 to 2021, the overall effect of the industrial structure transitioned from negative to positive, with the structure of most high-energy-consuming industries now contributing to an increase in carbon emissions. It should be noted that the adjustment of industrial structure represents a long-term, dynamic process with inherent delays [49]. Moving forward, it will be crucial to focus on controlling the growth of high-carbon industries, enforcing strict emission standards, and encouraging a transformation from high-carbon to low-carbon emerging industries.

3.3.4. Economic Growth Effect

The economic growth effect showed a positive relative contribution in all three periods analyzed, indicating that economic development has driven an increase in carbon emissions across various sectors. Notably, during the first period from 2007 to 2011, sectors such as transportation and the electric power industry saw economic growth contributions exceeding 40%, signifying a strong link between economic activity and carbon emissions. By the period from 2017 to 2021, the total carbon emissions attributable to economic growth declined from 27.53 Mt to 22.06 Mt, suggesting that the impact of economic development on carbon emissions is gradually diminishing. However, economic factors continue to be a primary driver of increasing carbon emissions, reflecting Jiangxi Province’s emphasis on economic growth. This is particularly evident in the rapid expansion of secondary and tertiary industries and the acceleration of industrialization, which contribute to carbon emission increases. This trend aligns with the environmental Kuznets curve (EKC) hypothesis [50,51], which posits that rapid economic growth frequently accompanies heightened resource consumption and significant environmental challenges. Therefore, addressing how to implement effective measures and develop new technologies to reduce carbon emissions while promoting high-quality economic development in Jiangxi remains a major concern and a significant challenge. This situation underscores the need for a balanced approach that integrates economic progress with environmental sustainability.

3.3.5. Population Size Effect

The relative contribution of the population size effect was positive across all three study periods, exhibiting a fluctuating downward trend within the range of 0–2%. Despite a slowdown in population growth rates in recent years, Jiangxi Province maintains a substantial population base. Ongoing urbanization has elevated living standards and increased demands, which in turn have expanded industrial production activities, leading to higher energy consumption and carbon emissions. Additionally, Jiangxi Province is actively absorbing labor-intensive industries relocated from the eastern regions, further intensifying the dependence of various sectors on the population. Moreover, the challenges posed by population growth—such as increased pressure on transportation, housing, land use, ecological environment, and issues related to employment and aging—are significantly impacting carbon emissions. These factors underscore the complex relationship between population dynamics and environmental impact, illustrating the multifaceted challenges Jiangxi faces in managing carbon emissions amidst demographic changes.

3.4. Analysis of the Decoupling of Sectoral Carbon Emissions from Economic Growth

Economic growth is often accompanied by increased resource consumption and environmental pollution. Nevertheless, the implementation of effective policies, along with the development of new energies and technologies, can facilitate a process known as decoupling—wherein economic growth may be maintained or even accelerated, but with reduced resource consumption and environmental impact. Based on the previous analysis, it has been demonstrated that the economic growth effect significantly drives carbon emissions in Jiangxi Province’s main sectors. Therefore, examining the decoupling relationship between carbon emissions and economic growth in Jiangxi provides crucial insights into the current decoupling status and highlights specific areas where policy measures could be effectively applied.
Figure 6 provides a detailed analysis of the decoupling status across various sectors during the period of 2007–2011. It illustrates that sectors such as agriculture, forestry, animal husbandry, fisheries, the textile industry, and electricity and heat production significantly achieved strong decoupling, where carbon emissions decreased while economic growth increased. In contrast, most sectors within the secondary and tertiary industries experienced expansive negative decoupling, characterized by an increase in carbon emissions alongside economic development. This trend suggests a concerning pattern of economic growth that heavily relies on high energy consumption and elevated emission levels, which is not sustainable. This situation highlights the substantial challenges associated with transforming energy structures and upgrading the industries during the period. In the subsequent five-year period from 2012 to 2016, certain sectors including paper and paper products, non-ferrous metal smelting and rolling processing, and construction, exhibited either growth linkage or weak decoupling. Here, carbon emissions and economic growth increased simultaneously, reflecting the robust economic development momentum of Jiangxi Province and the beneficial effects of evolving policies and technologies. During the period of 2017–2021, a majority of sectors shifted from weak to strong decoupling, indicating a more sustainable approach to economic growth. However, the decoupling status of sectors such as agriculture, forestry, animal husbandry and fisheries, as well as ferrous metal smelting, experienced a regression. This indicates that, as production structures adjusted and economic output decreased, the transformation in energy structures lagged behind the rate of economic contraction. Concurrently, the transportation industry continued to exhibit expansive negative decoupling, possibly driven by factors such as lagging infrastructure development, insufficient management services, and an irrational industrial structure.
Overall, the evolution of the decoupling relationship between carbon emissions and economic development across various sectors in Jiangxi Province generally follows a sequential pattern: starting from expansive negative decoupling, progressing through growth linkage and weak decoupling, and ultimately achieving strong decoupling. This trend indicates a positive shift towards sustainable development, demonstrating that, while pursuing rapid economic growth, Jiangxi Province is also committed to reducing carbon emissions. The economic development model is gradually transitioning towards a more resource-efficient and environmentally responsible paradigm.

3.5. Carbon Emission Forecasting

3.5.1. Scenario Setting

Given the complex interplay of factors influencing future energy consumption and carbon dioxide emissions in Jiangxi Province, this study employs scenario analysis. Based on the current state of development during the “13th Five-Year Plan” period and referring to the “14th Five-Year Plan” development plan, relevant macro-plans and policies such as the “Notification of the Jiangxi Provincial People’s Government on the Issuance of the Comprehensive Work Plan for Energy Conservation and Emission Reduction in Jiangxi Province during the 14th Five-Year Plan” and the “Ecological and Environmental Protection Plan of Jiangxi Province for the 14th Five-Year Plan”, combined with the trends in the added value of various industries (industrial structure), energy consumption structure, energy intensity, and energy consumption growth rate over the years in Jiangxi Province, various influencing factors are considered comprehensively. Three scenarios are set to reflect different policy and development pathways: the baseline scenario (BS), the carbon reduction scenario (RS), and the low-carbon scenario (LS). These scenarios are used to estimate the carbon emissions of different sectors from 2022 to 2050, facilitating a detailed prediction and analysis of the timing, peak, and trajectory towards achieving carbon peaking in Jiangxi Province.
Baseline scenario (BS): This scenario assumes a continuation of current development trends, with economic growth, energy consumption, and carbon emissions in Jiangxi Province following the patterns observed over the past decade. Carbon reduction efforts primarily rely on traditional technological approaches, without the influence of new policies or technological advancements. This scenario serves as a benchmark for comparing the impacts of alternative future scenarios.
Carbon reduction scenario (RS): This scenario posits enhanced carbon reduction efforts in Jiangxi Province. Parameters are established based on the strategic directions and policies articulated during the “14th Five-Year Plan” period. Specific targets for sector output, energy structure, and energy consumption are set by referencing policy documents and aligning them with industry characteristics. This scenario aims to demonstrate the potential impact of adhering to current planned policies on carbon reduction.
Low-carbon scenario (LS): Building on the RS scenario, this scenario further intensifies Jiangxi Province’s commitment to fostering a low-carbon economy. It includes active participation in the national carbon market and carbon emissions trading, while emphasizing the acceleration of carbon capture, utilization, and storage (CCUS) projects. Concurrently, this scenario emphasizes the importance of the stringent regulation of high-emission industries by implementing stricter emission standards and ensuring the rigorous enforcement of compliance measures, aiming to significantly improve energy utilization and environmental sustainability.

3.5.2. Parameter Settings

The scenario settings of the LEAP model are predicated on insights gained from the LMDI decomposition analysis, which pinpointed critical factors affecting carbon emissions. For example, previous findings suggest that an accelerated growth rate in the gross production value could intensify carbon emissions across sectors. When regional economic growth slows down, a peak in carbon emissions may occur. The “14th Five-Year Plan” for Jiangxi Province projects an average annual GDP growth target of approximately 7% by 2025, with specific objectives set for various sectors. Additionally, referring to the past decade’s average annual GDP growth rate and using the Grey Forecasting GM(1,1) model, the GDP growth rate under the baseline scenario is predicted. According to research by the Institute for Contemporary China Studies, Tsinghua University, China’s future GDP growth rate is expected to drop to around 4% by 2035. Considering these dynamics, the forecast parameters for various sectors under the carbon reduction and low carbon scenarios have been revised accordingly. Population projections are also estimated based on historical growth trends and the aforementioned plans. Details of the settings are provided in Table 2.
Meanwhile, the LMDI decomposition analysis also reveals that the energy intensity effect plays a pivotal role in reducing carbon emissions across various sectors, serving as a significant inhibitory factor for carbon emissions, and there remains substantial potential for adjustment and optimization within the energy structure. The “Comprehensive Work Plan for Energy Conservation and Emission Reduction in Jiangxi Province during the 14th Five-Year Plan” proposes that, by 2025, the energy consumption per unit of GDP in the province should be reduced by 14% compared to 2020, and total energy consumption is to be kept under stringent control. Utilizing historical industry data analyzed via the Grey Forecasting GM(1,1) model, parameters such as energy intensity, energy structure, and the annual growth rate of energy consumption are delineated for key time intervals across various sectors. The overall trends in energy-related parameters under different scenarios are shown in Figure 7.

3.5.3. Forecast Results

The total carbon emissions of various sectors from 2022 to 2050 are calculated as shown in Figure 8. Under the baseline scenario, which disregards the impact of policy and technological advancements and continues past development trends, there is an ongoing increase in total carbon emissions, with the electricity and heat production and supply industry experiencing the most significant growth. Conversely, under the carbon reduction and low-carbon scenarios, which are influenced by strategic policy directives, total carbon emissions are projected to peak in 2030 and 2025 at 227.44 million tons and 216.35 million tons, respectively. These projections result from substantial adjustments and enhancements in the energy structure, energy consumption, and industrial organization within major sectors. Comparatively, the cumulative carbon reduction potential from 2022 to 2050 under these scenarios is estimated at 1.39 billion tons and 2.17 billion tons, respectively. Sectors such as non-ferrous metal smelting and rolling processing, along with petroleum, coal, and other fuel processing, are expected to reach their emissions peak ahead of schedule, while the transportation, non-metallic mineral product, and electricity industries are likely to be the last to achieve their peaking objectives. As the energy consumption of high-energy-consuming industries diminishes over time, a significant curtailment of carbon emissions is anticipated. For instance, by 2050, carbon emission reductions in the non-metallic mineral product industry are projected at 37.5% and 61.3% under the carbon reduction and low-carbon scenarios, respectively. The carbon reduction and low-carbon scenarios have achieved significant reductions, particularly in high-emission industries. Consequently, it is imperative to further strengthen the implementation of carbon reduction policies, especially in energy-intensive sectors.
The findings from the LEAP model substantiate the results of the LMDI decomposition analysis, supporting the projection that Jiangxi Province is on track to achieve its carbon-peaking targets before 2030. This outcome is expected to be facilitated by a targeted policy framework that encourages sustainable practices, yielding more substantial results. The achievement of these targets will primarily be driven by significant advancements in technology and improvements in energy utilization efficiency, in conjunction with strategic adjustments to the industrial structure. Furthermore, by focusing more closely on high carbon-emitting industries, the implementation of a targeted policy framework aimed at promoting sustainable practices is expected to yield substantial environmental benefits.

4. Discussion and Conclusions

This study initially quantified the carbon emissions of twelve major sectors in Jiangxi Province from 2007 to 2021, employing the IPCC carbon accounting method. It then applied the Kaya identity and the LMDI index decomposition method to delineate the primary factors influencing carbon emissions within these sectors. Through the Tapio decoupling model, the study explored the decoupling paths between carbon emissions and economic development. Furthermore, by integrating historical data, development plans, and relevant national policy documents, this study deployed the LEAP model to forecast the peaking of carbon emissions under different development conditions from 2022 to 2050, yielding the following key conclusions.
Over the past fifteen years, carbon emissions from various sectors in Jiangxi Province have continued to increase [22,52]. Although some sectors have experienced a decline in the rate of carbon emission growth, the majority still predominantly rely on fossil fuels such as coal and oil. High-energy-consumption industries remain significant contributors to carbon emissions. To continue optimizing the energy consumption structure in the future, on the one hand, it is essential to fully exploit Jiangxi’s abundant renewable energy resources, such as hydropower and wind energy. Promoting the development of clean energy tailored to local conditions can help reduce the reliance on fossil fuels [53]. On the other hand, it is crucial to align with national strategies for peaking carbon emissions in key sectors and adapt these plans to local circumstances [54,55]. The Ministry of Industry and Information Technology, among other departments, has issued carbon peaking implementation plans for critical sectors including electricity, steel, non-ferrous metals, building materials, and petrochemicals. Drawing on actual provincial conditions, Jiangxi should craft tailored emission reduction strategies that suit its specific circumstances. For instance, leveraging its geographical advantages and resource endowments, Jiangxi should accelerate the application of renewable energy and clean fuels in power production and promote smart grid technology. The metal processing industry could significantly develop short-process steelmaking and increase the proportion of electric arc furnace steel, while the construction industry should accelerate the adoption of advanced technologies such as new dry-process cement and float glass. Furthermore, by fostering strategic emerging industries and optimizing the industrial structure, Jiangxi can pursue a path of high-quality development prioritizing ecological sustainability and low-carbon growth.
From the perspective of driving factors, the effects of economic growth and industrial structure are the main drivers of carbon emission growth in various sectors, a conclusion that has been reaffirmed in Jiangxi Province. However, it is worth noting that there are cyclical fluctuations in the industrial structure adjustments of various sectors, and the expansion of high-carbon industries requires reasonable management. On a positive note, the impacts of energy structure and energy intensity on promoting carbon reduction are progressively becoming more pronounced across different sectors. Despite these advancements, sectors such as ferrous metal smelting and rolling processing, as well as petroleum, coal, and other fuel processing, still demand further technological innovation and the optimization of their energy structures. This indicates that, during periods of economic transition, fostering a beneficial interplay among adjustments in industrial structure, energy structure optimization, and improvements in energy efficiency is vital. These dynamics hold significant implications for the central region in balancing high-quality economic development with a transition to a green, low-carbon economy, and in identifying the critical factors for carbon reduction at various stages.
The trend of decoupling between carbon emissions and economic growth in Jiangxi Province’s sectors spans from negative decoupling to strong decoupling, conclusions have also been reached in studies of neighboring provinces [56,57,58]. However, significant differences between sectors are seldom discussed. The tertiary sector, particularly transportation, wholesale and retail, and accommodation and catering services, encounters substantial challenges in achieving decoupling, highlighting the deficiencies in transitioning these service industries towards low-carbon operations and enhancing their overall quality of development within the province. An accelerated advancement of modern services and low-carbon industries is imperative. Additionally, the observed decoupling decline in sectors such as agriculture, forestry, animal husbandry and fisheries, and ferrous metal smelting reveals that the rate of energy structure transformation lags behind economic contraction. The regression in decoupling progress within the agricultural sector can be largely attributed to its persistent dependency on conventional farming techniques and fossil fuel usage [59]. The sector faces challenges in integrating contemporary, low-carbon technologies due to there being limited financial resources and technical expertise [60]. In the ferrous metal smelting industry, the process itself is characterized by high-energy consumption and substantial emissions. Despite the initiation of cleaner production technologies, such as electric arc furnaces by some enterprises, the industry at large continues to exhibit low-energy efficiency [61], posing substantial challenges in achieving meaningful reductions in carbon emissions, suggesting that long-term strategies should not only focus on immediate technological upgrades but also on systemic changes that foster sustainability. This conclusion holds significant implications for China’s central region, a critical hub for key sectors such as agriculture and steel production. It is imperative for policymakers to closely monitor the decoupling trends within these industries. As the industrial structure undergoes adjustments and optimization, a heightened focus on transitioning to a low-carbon energy framework is crucial. Furthermore, there is a need to expedite the development of modern services and strategic emerging industries, improve the quality and efficiency of traditional services, and foster green and low-carbon initiatives. Collectively, these strategies are essential for supporting high-quality regional development.
In the baseline scenario, without additional energy policies, CO2 emissions in Jiangxi Province are projected to continue rising and are unlikely to reach a peak. In contrast, under the carbon reduction scenario and the low-carbon scenario, emissions are expected to reach phased peaks of 227.5 million tons and 216.4 million tons before 2030, respectively. These scenarios necessitate a reduction in energy intensity by at least 10% and achieving a non-fossil fuel share of approximately 25%, aligning closely with recent targets for industrial energy efficiency improvements. Achieving regional carbon peaking targets will require breakthroughs in low-carbon technologies [62], particularly in high-emission key sectors, necessitating enhanced integration with major national scientific projects. This approach should focus on critical emission reduction technologies in key sectors and accelerate the application of scientific research outcomes. Simultaneously, it is vital to coordinate the industrial, supply, and innovation chains and to foster integration across the energy, industry, transportation, and construction sectors to enhance the overall effectiveness of sector carbon peaking. However, to ensure that Jiangxi can successfully achieve its carbon neutrality target, more proactive measures are imperative, including accelerating the construction of CCUS projects, developing technologies that enhance capture efficiency and reduce costs, and promoting the development of ecological carbon sinks. Such initiatives not only accelerate the achievement of carbon peaking goals but also provide valuable insights for the central region in developing differentiated and phased sectoral carbon peaking strategies. On the one hand, it is essential to leverage regional resources, identify the carbon reduction potential and breakthroughs across different sectors, starting with high-carbon sectors, and enforce stricter energy conservation and carbon reduction standards while setting phased development objectives through a targeted and precise approach. On the other hand, balancing immediate and long-term needs, local and broader perspectives, and coordinating steps systematically are crucial for steadily advancing the carbon peaking process, thereby enabling the active exploration of a low-carbon economic development pathway that is well suited to the region’s specific characteristics.
Sector-based mitigation policies represent an effective strategy [48]. The analytical methods discussed can be extended to other regions with similar industrial structures, energy consumption patterns, and resource endowments, but when applying these experiences to more developed regions or other countries, tailored approaches that consider local conditions, resource availability, and economic structures are essential for effective implementation. For example, developed countries with advanced technological capabilities may find it easier to implement similar strategies, while developing countries may face challenges similar to those in Jiangxi. Future research should aim to assess the enhancement of emission reduction effects resulting from targeted measures and to develop more precise actions tailored to specific sectors. However, it is important to acknowledge that the scenario settings in the LEAP model still have limitations and may not capture the full range of possible future developments. Additionally, there are inherent uncertainties associated with model parameters, which could compromise the precision of our emission forecasts. For instance, the model presupposes constant emission factors and energy efficiencies across different technologies, an assumption that might not accurately reflect the evolving technological landscape. Moreover, while our findings offer valuable insights for Jiangxi Province, the applicability of our results to other regions might be limited due to differences in economic structures, resource endowments, and policy environments. Further comparative studies across diverse regions are imperative to establish the robustness and transferability of the findings.
Moving forward, it is possible to adopt more stringent emission reduction measures for high-emission industries, further enhancing the alignment with both national and local “dual-carbon” strategies. By 2025, the aim is to achieve peak carbon emissions in key sectors such as industry, construction, and transportation. This will involve focusing on policy formulation and infrastructure development, including limiting the growth of high-energy-consuming industries, promoting energy-saving technologies, and increasing the proportion of renewable energy to 20%, with a reduction of 14% in CO2 emissions per unit of GDP compared to 2020. From 2026 to 2030, the emphasis will shift to accelerating the implementation of stricter emission standards, developing clean energy, and reducing energy intensity by at least 10%. During this period, the proportion of non-fossil fuels should reach 25%, with peak carbon emissions gradually being achieved in sectors such as agriculture and services. From 2031 to 2050, efforts will focus on consolidation and optimization. This phase will continue to optimize the industrial structure, promote low-carbon technologies, and widely adopt new energy vehicles. Meanwhile, the construction of regional CCUS projects will be accelerated, integrating with the national unified carbon market. Active participation in national carbon emissions trading and deepened research into market mechanisms such as carbon pricing, carbon tax, and carbon finance [63,64,65]. These steps will enrich the policy toolbox for sector carbon peaking and sustain momentum for low-carbon development across sectors, thus fostering a “policy synergy” and “collaborative effect” [66]. Building on this foundation, Jiangxi Province can develop a distinctive pathway for sector carbon peaking that not only highlights regional characteristics but also embodies fairness and justice. By doing so, Jiangxi can contribute its ‘Plan’ and ‘Experience’ to national and global discussions on sustainable development.

Author Contributions

Conceptualization, F.X.; methodology, X.J.; software, X.J.; data curation, X.J.; writing—original draft preparation, X.J.; writing—review and editing, F.X. and X.J.; visualization, X.J.; funding acquisition, F.X. All authors have read and agreed to the published version of the manuscript.

Funding

This research was funded by the National Natural Science Foundation of China (41261023); Social Science Planning Project of Jiangxi Province (13YJ18); Graduate Students’ Innovative Research Fund Program of Nanchang Hangkong University (YC2023-069).

Institutional Review Board Statement

Not applicable.

Informed Consent Statement

Not applicable.

Data Availability Statement

The original contributions presented in the study are included in the article; further inquiries can be directed to the corresponding authors.

Conflicts of Interest

The authors declare no conflicts of interest.

Appendix A

Table A1. Classification and code of sectors.
Full TermAbbreviations
Logarithmic Mean Divisia IndexLMDI
Long-range energy alternatives planningLEAP
Agriculture, forestry, animal husbandry and fisheryAFAH
Textile industryTI
Papermaking and paper products industryPPPI
Petroleum, coal, and other fuel processing industryPCFP
Chemical raw materials and chemical products manufacturing industryCRCP
Non-metallic mineral products industryNMMP
Ferrous metal smelting and rolling processing industryFMSR
Non-ferrous metal smelting and rolling processing industryNFMS
Electricity, heat production and supply industryEHPS
Construction industryCI
Transportation industryTRI
Wholesale and retail, and accommodation and catering industryWRTC
Table A2. Carbon emission conversion coefficients for various types of energy.
Energy SourceAverage Low Heating Value (GJ/ton, 10,000 Nm3)Carbon Content per Unit of Energy (ton C/GJ)Carbon Oxidation RateCO2 Emission Factor
Raw coal20.90826.370.941.900
Washed coal26.34425.410.932.283
Other washed coal12.54525.410.901.052
Coke28.43529.420.932.853
Crude oil41.81620.080.983.017
Gasoline43.07018.900.982.925
Kerosene43.07019.600.983.033
Diesel42.65220.200.983.096
Fuel oil41.81621.100.983.170
Liquefied petroleum gas50.17917.200.993.133
Refinery dry gas45.99818.200.993.039
Other petroleum products40.19020.000.982.888
Coke oven gas179.81013.600.998.877
Blast furnace gas 37.69070.800.999.686
Natural gas389.31015.300.9921.622

References

  1. Davies, A.R.; Hooks, G.; Knox-Hayes, J.; Liévanos, R.S. Riskscapes and the socio-spatial challenges of climate change. Camb. J. Reg. Econ. Soc. 2020, 13, 197–213. [Google Scholar] [CrossRef]
  2. Costello, A.; Abbas, M.; Allen, A.; Ball, S.; Bell, S.; Bellamy, R.; Friel, S.; Groce, N.; Johnson, A.M.; Kett, M.; et al. Managing the health effects of climate change Lancet and University College London Institute for Global Health Commission. Lancet 2009, 373, 1693–1733. [Google Scholar] [CrossRef]
  3. Rogelj, J.; Schaeffer, M.; Meinshausen, M.; Knutti, R.; Alcamo, J.; Riahi, K.; Hare, W. Zero emission targets as long-term global goals for climate protection. Environ. Res. Lett. 2015, 10, 105007. [Google Scholar] [CrossRef]
  4. Edenhofer, O.; Steckel, J.C.; Jakob, M.; Bertram, C. Reports of coal’s terminal decline may be exaggerated. Environ. Res. Lett. 2018, 13, 024019. [Google Scholar] [CrossRef]
  5. Le Quéré, C.; Korsbakken, J.I.; Wilson, C.; Tosun, J.; Andrew, R.; Andres, R.J.; Canadell, J.G.; Jordan, A.; Peters, G.P.; van Vuuren, D.P. Drivers of declining CO2 emissions in 18 developed economies. Nat. Clim. Change 2019, 9, 213–217. [Google Scholar] [CrossRef]
  6. Basu, S.; Lehman, S.J.; Miller, J.B.; Andrews, A.E.; Sweeney, C.; Gurney, K.R.; Xu, X.; Southon, J.; Tans, P.P. Estimating US fossil fuel CO2 emissions from measurements of 14C in atmospheric CO2. Proc. Natl. Acad. Sci. USA 2020, 117, 13300–13307. [Google Scholar] [CrossRef]
  7. Andres, R.J.; Boden, T.A.; Bréon, F.-M.; Ciais, P.; Davis, S.; Erickson, D.; Gregg, J.S.; Jacobson, A.; Marland, G.; Miller, J.; et al. A synthesis of carbon dioxide emissions from fossil-fuel combustion. Biogeosciences 2012, 9, 1845–1871. [Google Scholar] [CrossRef]
  8. Ma, S.; Lei, T.; Meng, J.; Liang, X.; Guan, D. Global oil refining’s contribution to greenhouse gas emissions from 2000 to 2021. Innovation 2022, 4, 100361. [Google Scholar] [CrossRef]
  9. Lackner, K. Can Fossil Carbon Fuel the 21st Century? Int. Geol. Rev. 2002, 44, 1122–1133. [Google Scholar] [CrossRef]
  10. Emenekwe, C.; Okereke, C.; Nnamani, U.A.; Emodi, N.; Diemuodeke, O.; Anieze, E. Macroeconomics of decarbonization strategies of selected global south countries: A systematic review. Front. Environ. Sci. 2022, 10, 938017. [Google Scholar] [CrossRef]
  11. González, P.; Presno, M.J.; Landajo, M. Tracking the change in Spanish greenhouse gas emissions through an LMDI decomposition model: A global and sectoral approach. J. Environ. Sci. 2022, 139, 114–122. [Google Scholar] [CrossRef]
  12. Guo, J.; Zhang, Y.J.; Zhang, K.-B. The key sectors for energy conservation and carbon emissions reduction in China: Evidence from the input-output method. J. Clean. Prod. 2018, 179, 180–190. [Google Scholar] [CrossRef]
  13. Wen, W.; Wang, Q. Identification of key sectors and key provinces at the view of CO2 reduction and economic growth in China: Linkage analyses based on the MRIO model. Ecol. Indic. 2019, 96, 1–15. [Google Scholar] [CrossRef]
  14. Lin, B.; Teng, Y. Structural path and decomposition analysis of sectoral carbon emission changes in China. Energy 2022, 261, 125331. [Google Scholar] [CrossRef]
  15. Wang, Q.; Li, S.; Pisarenko, Z. Modeling carbon emission trajectory of China, US and India. J. Clean. Prod. 2020, 258, 120723. [Google Scholar] [CrossRef]
  16. Xie, P.; Lu, Y.; Xie, Y. The Influencing Factors of Carbon Emissions in the Industrial Sector: Empirical Analysis Based on a Spatial Econometric Model. Sustainability 2024, 16, 2478. [Google Scholar] [CrossRef]
  17. Li, H.; Pang, B.; Zhu, F.-H.; Sun, X.-L.; Xu, J.-X.; Wang, S. Comparative Energy Consumption Structure and Mode between China and Major Energy-Consuming Countries Under the Background of Carbon Emission Reduction. Huan Jing Ke Xue = Huanjing Kexue 2022, 43, 5294–5304. [Google Scholar] [CrossRef]
  18. Zhang, G.; Wen, J.; Tang, X. Human capital and its structure and industry structure upgrading. China Popul. Resour. Environ. 2011, 10, 138–146. [Google Scholar]
  19. Qiang, Q.; Jian, C. Natural resource endowment, institutional quality and China’s regional economic growth. Resour. Policy 2020, 66, 101644. [Google Scholar] [CrossRef]
  20. Li, R.; Han, X.; Wang, Q. Do technical differences lead to a widening gap in China’s regional carbon emissions efficiency? Evidence from a combination of LMDI and PDA approach. Renew. Sustain. Energy Rev. 2023, 182, 113361. [Google Scholar] [CrossRef]
  21. Jiang, P.; Gong, X.; Yang, Y.; Tang, K.; Zhao, Y.; Liu, S.; Liu, L. Research on spatial and temporal differences of carbon emissions and influencing factors in eight economic regions of China based on LMDI model. Sci. Rep. 2023, 13, 7956. [Google Scholar] [CrossRef]
  22. Xinfa, T.; Xue, L. Research on energy policies of Jiangxi province under the dual-carbon constraints. Front. Environ. Sci. 2022, 10, 986385. [Google Scholar] [CrossRef]
  23. Ghazali, A.; Ali, G. Investigation of key contributors of CO2 emissions in extended STIRPAT model for newly industrialized countries: A dynamic common correlated estimator (DCCE) approach. Energy Rep. 2019, 5, 242–252. [Google Scholar] [CrossRef]
  24. Sun, L.; Mao, X.; Feng, L.; Zhang, M.; Gui, X.; Wu, X. Investigating the Direct and Spillover Effects of Urbanization on Energy-Related Carbon Dioxide Emissions in China Using Nighttime Light Data. Remote Sens. 2023, 15, 4093. [Google Scholar] [CrossRef]
  25. Su, B.; Ang, B.W. Structural decomposition analysis applied to energy and emissions: Some methodological developments. Energy Econ. 2012, 34, 177–188. [Google Scholar] [CrossRef]
  26. Lin, B.; Xu, M. Does China become the “pollution heaven” in South-South trade? Evidence from Sino-Russian trade. Sci. Total Environ. 2019, 666, 964–974. [Google Scholar] [CrossRef]
  27. Xu, B.; Lin, B. Factors affecting CO2 emissions in China’s agriculture sector: Evidence from geographically weighted regression model. Energy Policy 2017, 104, 404–414. [Google Scholar] [CrossRef]
  28. Wen, L.; Li, Z. Provincial-level industrial CO2 emission drivers and emission reduction strategies in China: Combining two-layer LMDI method with spectral clustering. Sci. Total Environ. 2020, 700, 134374. [Google Scholar] [CrossRef]
  29. Zhang, C.; Luo, H. Research on carbon emission peak prediction and path of China’s public buildings: Scenario analysis based on LEAP model. Energy Build. 2023, 289, 113053. [Google Scholar] [CrossRef]
  30. Liu, M.; Zhang, X.; Zhang, M.; Feng, Y.; Liu, Y.; Wen, J.; Liu, L. Influencing factors of carbon emissions in transportation industry based on CD function and LMDI decomposition model: China as an example. Environ. Impact Assess. Rev. 2021, 90, 106623. [Google Scholar] [CrossRef]
  31. He, Y.; Xing, Y.; Zeng, X.; Ji, Y.; Hou, H.; Zhang, Y.; Zhu, Z. Factors influencing carbon emissions from China’s electricity industry: Analysis using the combination of LMDI and K-means clustering. Environ. Impact Assess. Rev. 2022, 93, 106724. [Google Scholar] [CrossRef]
  32. Chong, C.; Tan, W.; Ting, Z.J.; Liu, P.; Ma, L.; Li, Z.; Ni, W. The driving factors of energy-related CO2 emission growth in Malaysia: The LMDI decomposition method based on energy allocation analysis. Renew. Sustain. Energy Rev. 2019, 115, 109356. [Google Scholar] [CrossRef]
  33. Chen, Y.; Lin, B. Decomposition analysis of patenting in renewable energy technologies: From an extended LMDI approach perspective based on three Five-Year Plan periods in China. J. Clean. Prod. 2020, 269, 122402. [Google Scholar] [CrossRef]
  34. Erdoğan, S.; Gedikli, A.; Yılmaz, A.D.; Haider, A.; Zafar, M.W. Investigation of energy consumption–Economic growth nexus: A note on MENA sample. Energy Rep. 2019, 5, 1281–1292. [Google Scholar] [CrossRef]
  35. Huang, L.; Kelly, S.; Lv, K.; Giurco, D. A systematic review of empirical methods for modelling sectoral carbon emissions in China. J. Clean. Prod. 2019, 215, 1382–1401. [Google Scholar] [CrossRef]
  36. Zheng, X.; Wang, J.; Chen, Y.; Tian, C.; Li, X. Potential pathways to reach energy-related CO2 emission peak in China: Analysis of different scenarios. Environ. Sci. Pollut. Res. 2023, 30, 66328–66345. [Google Scholar] [CrossRef]
  37. Wu, G.; Niu, D. A study of carbon peaking and carbon neutral pathways in China’s power sector under a 1.5 °C temperature control target. Environ. Sci. Pollut. Res. 2022, 29, 85062–85080. [Google Scholar] [CrossRef] [PubMed]
  38. Huang, H.; Wu, X.; Cheng, X. The Prediction of Carbon Emission Information in Yangtze River Economic Zone by Deep Learning. Land 2021, 10, 1380. [Google Scholar] [CrossRef]
  39. Lai, W.-T.; Wang, Y.; Huang, L.-L.; Huang, Y.-M.; Luo, J.; Chen, H.-Y. Decomposition of driving factors of industry-related CO 2 emissions and its decoupling with economic growth in Fujian Province, China. Ying Yong Sheng Tai Xue Bao = J. Appl. Ecol. 2020, 31, 3529–3538. [Google Scholar]
  40. Tsou, Y.-L.; Edelman, D. Planning for Economic Growth with Reduced CO2 Emissions in Provincial China: The Case of Jiangxi. J. Urban Manag. 2013, 2, 45–70. [Google Scholar] [CrossRef]
  41. Eggleston, H.; Buendia, L.; Miwa, K.; Ngara, T.; Tanabe, K. 2006 IPCC Guidelines for National Greenhouse Gas Inventories; IPCC: Hayama, Japan, 2006. [Google Scholar]
  42. Ang, B.W. Decomposition analysis for policymaking in energy: Which is the preferred method? Energy Policy 2004, 32, 1131–1139. [Google Scholar] [CrossRef]
  43. Ang, B.W.; Zhang, F.Q. A survey of index decomposition analysis in energy and environmental studies. Energy 2000, 25, 1149–1176. [Google Scholar] [CrossRef]
  44. Jiang, S.; Zhu, Y.; He, G.; Wang, Q.; Lu, Y. Factors influencing China’s non-residential power consumption: Estimation using the Kaya–LMDI methods. Energy 2020, 201, 117719. [Google Scholar] [CrossRef]
  45. Wang, Q.; Wang, X. Moving to economic growth without water demand growth—A decomposition analysis of decoupling from economic growth and water use in 31 provinces of China. Sci. Total Environ. 2020, 726, 138362. [Google Scholar] [CrossRef] [PubMed]
  46. Tapio, P. Towards a theory of decoupling: Degrees of decoupling in the EU and the case of road traffic in Finland between 1970 and 2001. Transp. Policy 2005, 12, 137–151. [Google Scholar] [CrossRef]
  47. Kumar, A.; Bhattacharya, S.C.; Pham, H.L. Greenhouse gas mitigation potential of biomass energy technologies in Vietnam using the long range energy alternative planning system model. Energy 2003, 28, 627–654. [Google Scholar] [CrossRef]
  48. Cai, W.; Wang, C.; Chen, J.; Wang, K.; Zhang, Y.; Lu, X. Comparison of CO2 emission scenarios and mitigation opportunities in China’s five sectors in 2020. Energy Policy 2008, 36, 1181–1194. [Google Scholar] [CrossRef]
  49. Dong, B.; Xu, Y.; Fan, X. How to achieve a win-win situation between economic growth and carbon emission reduction: Empirical evidence from the perspective of industrial structure upgrading. Environ. Sci. Pollut. Res. 2020, 27, 43829–43844. [Google Scholar] [CrossRef] [PubMed]
  50. Grossman, G.M.; Krueger, A.B. Economic Growth and the Environment. Q. J. Econ. 1995, 110, 353–377. [Google Scholar] [CrossRef]
  51. Koondhar, M.; Shahbaz, M.; Memon, K.A.; Ozturk, I.; Kong, R. A visualization review analysis of the last two decades for environmental Kuznets curve “EKC” based on co-citation analysis theory and pathfinder network scaling algorithms. Environ. Sci. Pollut. Res. 2021, 28, 16690–16706. [Google Scholar] [CrossRef]
  52. Jia, J.; Jian, H.; Xie, D.; Gu, Z.; Chen, C. Multi-scale decomposition of energy-related industrial carbon emission by an extended logarithmic mean Divisia index: A case study of Jiangxi, China. Energy Effic. 2019, 12, 2161–2186. [Google Scholar] [CrossRef]
  53. Fu, C.; Min, W. Research on the control path and countermeasures of net CO 2 emissions in central China—Represented by Jiangxi Province. Environ. Technol. 2022, 44, 3867–3882. [Google Scholar] [CrossRef] [PubMed]
  54. Azimi, M.; Bian, Z. Provincial and regional analysis of carbon neutrality policy and the environmental Kuznets curve: Examining their effect on CO2 emissions in China. Environ. Sci. Pollut. Res. 2023, 30, 46234–46247. [Google Scholar] [CrossRef] [PubMed]
  55. Gao, Y.; Khan, A.; Khan, S.; Ali, M.; Huai, J. Navigating China’s carbon neutrality journey: Insights from policy instruments and implementation strategies across provincial regions. Environ. Sci. Pollut. Res. 2023, 30, 115322–115336. [Google Scholar] [CrossRef] [PubMed]
  56. Song, Y.; Sun, J.; Zhang, M.; Su, B. Using the Tapio-Z decoupling model to evaluate the decoupling status of China’s CO2 emissions at provincial level and its dynamic trend. Struct. Change Econ. Dyn. 2020, 52, 120–129. [Google Scholar] [CrossRef]
  57. Guan, S.; Liao, Q.; Wu, W.; Yi, C.; Gao, Y. Revealing the Coupling Relationship between the Gross Ecosystem Product and Economic Growth: A Case Study of Hubei Province. Sustainability 2022, 14, 7546. [Google Scholar] [CrossRef]
  58. Dong, J.; Li, C.; Wang, Q. Decomposition of carbon emission and its decoupling analysis and prediction with economic development: A case study of industrial sectors in Henan Province. J. Clean. Prod. 2021, 321, 129019. [Google Scholar] [CrossRef]
  59. Yuan, R.; Xu, C.; Kong, F. Decoupling agriculture pollution and carbon reduction from economic growth in the Yangtze River Delta, China. PLoS ONE 2023, 18, e0280268. [Google Scholar] [CrossRef]
  60. Chen, Y.; Li, M. How does the digital transformation of agriculture affect carbon emissions? Evidence from China’s provincial panel data. Humanit. Soc. Sci. Commun. 2024, 11, 1–17. [Google Scholar] [CrossRef]
  61. Zeng, G.; Zhong, M.; Xiao, C. Drivers and decoupling analysis of carbon emissions in the non-ferrous metal industry-evidence from 28 provinces in China. PeerJ 2023, 11, e16575. [Google Scholar] [CrossRef]
  62. Erdoğan, S.; Yıldırım, S.; Yıldırım, D.Ç.; Gedikli, A. The effects of innovation on sectoral carbon emissions: Evidence from G20 countries. J. Environ. Manag. 2020, 267, 110637. [Google Scholar] [CrossRef] [PubMed]
  63. Wu, S.; Niu, R. Development of carbon finance in China based on the hybrid MCDM method. Humanit. Soc. Sci. Commun. 2024, 11, 156. [Google Scholar] [CrossRef]
  64. Jiang, L.F.; Niu, H.; Ru, Y.; Tong, A.; Wang, Y. Analysis on the mediating effect and regulating impact of carbon finance on quality-focused economy advancement. Front. Environ. Sci. 2023, 11, 1235382. [Google Scholar] [CrossRef]
  65. Jiang, L.; Niu, H.; Ru, Y.; Tong, A.; Wang, Y. Can carbon finance promote high quality economic development: Evidence from China. Heliyon 2023, 9, e22698. [Google Scholar] [CrossRef]
  66. Hu, A. China’s goal of achieving carbon peak by 2030 and its main approaches. J. Beijing Univ. Technol. (Soc. Sci. Ed.) 2021, 21, 1–15. [Google Scholar]
Figure 1. A research framework for this study.
Sustainability 16 05811 g001
Figure 2. Location of the study area (Jiangxi Province, China).
Sustainability 16 05811 g002
Figure 3. Decoupling status and decoupling index range.
Sustainability 16 05811 g003
Figure 4. Changes in CO2 emissions by sector in Jiangxi Province, 2007–2021.
Sustainability 16 05811 g004
Figure 5. Flow chart of major sectoral energy consumption in Jiangxi Province, 2021.
Sustainability 16 05811 g005
Figure 6. The decoupling status of carbon emissions and economic development in various sectors in Jiangxi Province from 2007 to 2021.
Sustainability 16 05811 g006
Figure 7. Configuration of the total energy-related parameters at key time points in Jiangxi Province across various scenarios.
Sustainability 16 05811 g007
Figure 8. Projected carbon emissions by sector under different scenarios.
Sustainability 16 05811 g008
Table 1. Relative contribution of driving factors on carbon emissions by sector, 2007–2021.
PeriodSectorEnergy StructureEnergy IntensityIndustrial StructureEconomic GrowthPopulation Size
2007–2011AFAH−1.00−25.62−22.8034.871.97
TI0.98−54.25−5.6122.741.49
PPPI0.39−6.59−16.0628.811.61
PCFP−2.42−26.835.1330.172.46
CRCP−2.86−17.828.6512.731.03
NMMP−0.71−21.0420.5129.531.96
FMSR0.57−9.020.6439.972.41
NFMS−2.04−22.3811.2218.241.17
EHPS0.02−5.78−16.7144.853.12
CI5.3532.6−15.8732.211.66
TRI0.271.11−16.9147.023.48
WRTC−12.670.97−1.3144.342.06
Total Effect−0.19−11.722.0827.531.42
2012–2016AFAH0.84−15.92−7.5853.531.39
TI−0.23−57.2720.0213.530.30
PPPI0.14−23.6923.3530.270.80
PCFP−1.200.728.3327.090.36
CRCP−1.01−13.43−7.4336.800.59
NMMP0.58−35.9332.8329.480.71
FMSR0.6812.60−48.4229.840.50
NFMS4.01−38.40−0.3929.060.50
EHPS0.01−0.20−25.6736.670.59
CI−2.66−10.2320.6926.430.72
TRI0.8416.51−19.1748.491.28
WRTC20.252.444.1427.150.73
Total Effect0.27−2.18−13.0923.270.38
2017–2021AFAH−5.57−26.81−0.9838.530.93
TI2.14−22.93−35.1818.410.46
PPPI−0.1418.999.2828.910.52
PCFP3.066.46−35.1119.910.37
CRCP−0.07−40.04−16.7417.040.25
NMMP0.13−30.551.7245.510.86
FMSR1.42−43.0630.0824.150.49
NFMS−3.27−43.76−13.5420.950.46
EHPS−0.01−34.8546.3318.390.33
CI−0.85−29.3510.4534.670.70
TRI−2.48−2.410.2943.520.90
WRTC−7.01−3.80−1.8720.020.44
Total Effect−0.22−27.6920.822.060.41
Table 2. Development scenario settings.
ScenarioBaseline Scenario (BS)Carbon Reduction Scenario (RS)Low Carbon Scenario (LS)
Baseline settingsExisting macro policies and technology levelsExisting macro policies and technology levels, with additional support from carbon reduction policiesExisting macro policies and technology levels, with additional low-carbon development policies and technological innovation
Economic growth rateGDP increases then decreases, average annual growth rate about 3.2%GDP growth slows, average annual growth rate controlled between 2.7%, achieving green and coordinated developmentGDP growth moderately slows, average annual growth rate controlled between 2.3%, introducing the concept of green GDP
Industrial structureIndustrial structure remains unchangedOptimize industrial structure, restrict high-energy-consuming industries such as steel and chemicals to growth of −1%Significantly optimize industrial structure, high-energy-consuming industries to decrease growth to −2%, greatly increase the proportion of strategic emerging industries
Energy transitionOptimize industrial processes, reduce energy intensity by about 10%, introduce energy storage devices, and the proportion of non-fossil energy should reach 25% by 2030Focus on high-emission industries, reduce energy intensity by more than 15%, introduce energy storage devices, vigorously develop region-specific renewable energies such as hydro and wind power
Policy and technological innovationEstablish a carbon trading market, formulate differentiated carbon tax strategies, enhance public participation and education, promote new energy technologies and efficient end-use
Disclaimer/Publisher’s Note: The statements, opinions and data contained in all publications are solely those of the individual author(s) and contributor(s) and not of MDPI and/or the editor(s). MDPI and/or the editor(s) disclaim responsibility for any injury to people or property resulting from any ideas, methods, instructions or products referred to in the content.

