Abstract
Biochar application is considered an effective method for reducing nitrous oxide (N2O) emissions from soil. However, the mechanisms underlying the influence of various biochar dosages on soil N2O emissions and the duration of one-time biochar application remain unclear. The effects of different biochar application rates and a one-time application on soil N2O emissions in the Huanghuaihai Plain of China were investigated through a field experiment from 2020 to 2022. In the wheat and maize rotation system, six treatments were administered: no biochar (C0); 2 (C1), 4 (C2), 8 (C3), and 12 t/hm2 biochar (C4) applied annually; and a one-time application of 12 t/hm2 biochar (CS) in 2018. Our results indicate that, compared with C0, biochar significantly inhibited soil N2O emissions, particularly in the C3 and C4 treatments, with reductions of 31.36–56.21% and 36.92–52.45%, respectively. However, CS did not significantly affect soil N2O emissions during the study period. These findings suggest that the biochar’s inhibitory effect on soil N2O emissions is contingent upon the dosage and frequency of application. A structural equation model revealed that biochar decreases soil N2O emissions by enhancing the reduction in N2O during denitrification. Under the conditions of this experiment, based on a logistic ecological model, a one-time application of 12 t/hm2 biochar was projected to significantly reduce soil N2O emissions for approximately 1.77 years. On the whole, biochar reduces soil N2O emissions mainly by regulating N2O production through denitrification, and the duration of this inhibition of N2O emissions mainly depends on the application amount and frequency of biochar application.
1. Introduction
Nitrogen fertilizer is a vital component of agricultural production. It significantly contributes to the release of nitrous oxide (N2O) after being applied to the soil, which is a principal factor increasing N2O emissions in farmlands [1,2]. Consequently, mitigating N2O emissions from farmlands is a critical strategy for China to achieve its “carbon peaking and carbon neutrality” objectives [3,4]. Concurrently, crop straw, a major biochar source, not only alleviates the environmental burden of agricultural waste but also diminishes soil greenhouse gas emissions. This dual functionality positions biochar as an agronomic measure well aligned with China’s current and forthcoming national circumstances [5].
Numerous studies have demonstrated that biochar can significantly reduce soil N2O emissions, enhance soil quality, and improve nitrogen use efficiency. These benefits are attributed to biochar’s physical adsorption of exogenous nitrogen, alteration of the soil carbon and nitrogen cycles, and impact on related microbial activity [6,7,8]. For instance, a recent meta-analysis conducted by Zhang et al. [9] found that biochar application decreased N2O emissions by 7.09%. Additionally, while the incorporation of a higher amount of biochar into Amazon forest soil markedly reduced N2O emissions, the application of a lesser amount of biochar did not significantly affect them [10]. The above result indicated that greater biochar addition could increase the activity of N2O reductase and decrease soil N2O emissions [11,12]. Concurrently, this process can suppress the enzymatic activity converting and into N2O, thereby decreasing N2O production during denitrification [13,14]. However, some studies indicate that biochar can either promote or have no effect on N2O emissions. For example, Wu et al. [15] reported that adding 40 t/hm2 of biochar increased soil N2O emissions by 32.0% and 46.2% over two years, primarily because substantial biochar applications introduce more and , enhancing their transformation [16]. Furthermore, applying very high amounts of biochar drastically reduced the quantity of soil nitrogen available from microbial processes that generate N2O, indicating that biochar application can modify the soil C:N ratio and, consequently, affect soil N2O emissions [6,17]. These findings indicate that the impact of biochar on soil N2O emissions is intricately linked to the quantity of biochar applied.
An increasing number of studies have observed that the aging of biochar in the natural environment may lead to a decline in its efficacy to suppress soil N2O emissions over time. For instance, Liu et al. [18] reported that a one-time application of 13.5 t/hm2 biochar significantly reduced soil N2O emissions in the first two years, yet no considerable difference was observed in the third year. Biochar’s influence on the N2O emissions weakened over time, which may be related to the occupancy of biochar pores and the decomposition of biochar [19,20,21]. Although a large number of studies have explored the response of soil N2O emissions to aging biochar, there is currently no way to predict the exact duration of biochar’s emission-reducing impact. Therefore, this study aims to estimate the duration of biochar’s inhibitory effect on soil N2O emissions using ecological models, providing crucial insights for future applications regarding the dosage and frequency of biochar use in agriculture.
To develop a reasonable ecological model, it is essential to consider the influence of biochar on soil physicochemical properties and microbial abundance. Nitrification and denitrification are the main ways that biochar affects soil N2O emissions [22,23,24]. Nitrification is defined as →→, and N2O is produced as a by-product. Denitrification is defined as →→NO→N2O→N2, and N2O is produced as an intermediate product. Previous research has indicated that the porous structure of biochar provides a suitable habitat for nitrifying bacteria, which is beneficial for increasing the abundance of ammonia-oxidizing bacteria (AOB) and ammonia-oxidizing archaea (AOA), and this means that biochar increases the occurrence of nitrification in soil and thus increases the by-product (N2O) emissions during nitrification [25,26]. Conversely, during denitrification, biochar reduced the nitrite reductase K (nirK) and nitrite reductase S (nirS) gene copy numbers and also increased the nitric oxide reductase (nosZ) gene copy number, which means that biochar can inhibit nitrite reduction and promote N2O reduction during denitrification and thus reduce N2O emissions during denitrification [27,28,29]. Additionally, biochar’s ability to adsorb and stabilize soil nitrate nitrogen reduces the substrates available for denitrification, further curtailing N2O emissions [30,31,32]. Thus, biochar’s role in modulating ammonia oxidation and denitrification processes is evident in its impact on N2O emissions. Prior studies have identified AOA, AOB, nirK, nirS, and nosZ as crucial functional genes influencing soil N2O emissions. Soil microorganisms, constrained by environmental resources, respond rapidly to changes in these resources [33,34]. The introduction of biochar imposes a limit on the growth of soil-associated microorganisms, aligning with the logistic ecological model’s growth dynamics, which have been substantiated in numerous studies [35,36,37]. In this study, key functional genes were identified using structural equation models, and ecological models based on logistic differential equations were constructed to predict the temporal effects of biochar on soil N2O emissions.
The Huanghuaihai Plain, an important crop producing area, also records one of the highest nitrogen fertilizer application rates in China, exceeding 600 kg N/hm2 annually. This figure notably surpasses that of similar farmlands in Europe [38]. Thus, through investigating the effects of biochar at different dosages (2, 4, 8, and 12 t/hm2) over consecutive years, along with a one-time application of 12 t/hm2, the objectives of this study were to (1) determine the effect of biochar on soil N2O emissions in the Huanghuaihai Plain and its mechanism; (2) identify the key functional genes of biochar affecting soil N2O emissions; and (3) use ecological models to quantify the duration for which biochar inhibits soil N2O emissions.
2. Experimental Section
2.1. Study Site
The study was conducted at the Jining Experimental Station, Shandong Academy of Agricultural Sciences (116°58′13″ E, 35°40′7″ N), characterized by a warm temperate semi-humid monsoon climate, with an average annual temperature of 13.6 °C. The annual precipitation averages 693 mm, primarily occurring from June to August. The experimental field employs a wheat–maize rotation system, having a light loam soil texture. Prior to 2018, the soil’s basic properties in the 0–20 cm layer were as follows: pH 7.82, organic matter 14.25 g/kg, alkali hydrolyzed nitrogen 23.11 mg/kg, available phosphorus 29.89 mg/kg, available potassium 89 mg/kg, and an electrical conductivity of soil 1.72 mS/cm.
2.2. Experimental Design
Field samples for this study were collected from October 2020 to October 2022. The experiment comprised six treatments, each randomly assigned with three replicates, totaling eighteen experimental plots of 20 m2 each: 0 (C0), 2 (C1), 4 (C2), 8 (C3), 12 t/hm2 biochar (C4), and one-time application of 12 t/hm2 biochar in 2018 (CS). Biochar was applied annually before winter wheat sowing for C1, C2, C3, and C4, whereas CS received a single application in 2018. Wheat (JiMai 22) was sown on 5 October 2020 and 4 October 2021 and harvested on 3 June 2021 and 1 June 2022, respectively. Maize (LuDan 510) was sown on 14 June 2021 and 4 June 2022 and harvested on 1 October 2021 and 4 October 2022. JiMai 22 and LuDan 510, selected for the experiment, were acquired from the local market. In the winter wheat season, nitrogen and phosphorus fertilizers were applied at doses of 300 kg N/hm2 and 150 kg P2O5/hm2, respectively. In the maize season, the applications were 280 kg N/hm2, 120 kg P2O5/hm2, and 60 kg K2O/hm2. The nitrogen fertilizer was evenly divided between base application and topdressing (1:1 ratio) on specified dates, while the phosphorus was applied entirely as a base fertilizer. For maize, all fertilizers were applied in a single session on 14 June 2021 and 4 June 2022. Rotary tillage, sowing, and irrigation were performed concurrently after base fertilizer application in each season, with other management practices being consistent with local standards.
The biochar tested was produced from rice straw via incomplete combustion at 800 °C. Its fundamental properties were as follows: total nitrogen content of 5.12 g/kg, total potassium content of 13.37 g/kg, total phosphorus content of 0.96 g/kg, density of 0.332 g/cm3, pH of 8.50, and carbon content of 70%. Biochar and fertilizers were mixed and incorporated into the soil to a depth of 20 cm using rotary tillage.
2.3. Sample Collection and Determination
Soil moisture and temperature were measured using a handheld TDR instrument (Spectrum, Tianjin, China). Soil samples, once collected, were cleared of plant roots and gravel and divided into two parts: one for measuring soil inorganic nitrogen, and the other for assessing the copy number of functional genes. and in the soil were extracted with 0.01 mol/L CaCl2 solution, and the extract was examined using an AA3 flow analyzer (Braun and Lubbe, Norderstedt, Germany). Sample collection occurred at 15–20-day intervals during the wheat season and 7–10-day intervals in the maize season, with increased frequency during fertilization, irrigation, and precipitation events.
Soil DNA was extracted from 0.5 g of soil using the FastDNA Spin Kit for Soils (MP Biomedicals, Solon, OH, USA), dissolved in 100 μL sterile water, and stored at −80 °C. The q-PCR was conducted using a CFX96 Real-Time PCR System (Bio-Rad, Hercules, CA, USA) with a reaction volume of 20 μL, comprising 10 μL SYBR Green (TaKaRa, Kusatsu, Japan), 0.2 μL Rox DYEII, 1 μL DNA template, 0.4 μL of each primer (10 μmol/L), and 8.0 μL sterilized water. The amplification primers and reaction conditions of each gene are shown in Table 1 [39]. Each experiment included strict negative controls.

Table 1.
Amplification primers and reaction conditions of qPCR.
Gas samples were collected at the same frequency as the soil samples. N2O emission fluxes were measured using static box gas chromatography involving a stainless-steel sampling box (50 cm × 50 cm × 50 cm) with a 1.5 mm thickness and a base (50 cm × 50 cm × 15 cm) with a 2 mm thickness [18]. Gas sampling occurred from 8:00 am to 11:00 am. In the gas collection of each box, a 200 mL disposable syringe was used to collect gas samples at 0, 10, 20, and 30 min, respectively. At each gas collection, the temperature in the chamber was recorded. Gas chromatography (Agilent 7890, Santa Clara, CA, USA) was used for sample analysis, with our N2O flux calculation following:
where F is the N2O flux (µg/m2/h); ρ is the density of N2O under standard conditions (g/m3); V is the cavity volume (m3); A is the covered area of the chamber (m2); ΔC/Δt is the concentration rate of N2O in the box; and T is the air temperature in the box.
The cumulative soil N2O emissions were calculated as follows:
where E is cumulative soil N2O emissions (kg/ha); f is the N2O flux (µg/m2/h); i is the ith measurement; (ti+1 − ti) is the number of days between two adjacent measurements; and ×10−5 is the unit conversion of N2O.
2.4. Construction of an Ecological Model to Predict Biochar’s Duration of Effectiveness
Based on the results of experimental analyses, key marker functional genes were identified, facilitating the subsequent construction of the model. The Logistic model posits an environmental constraint, known as the environmental capacity (K), which limits the number of microbial populations carrying these functional genes. The instantaneous growth rate, denoted as r′, was assumed to be a linear function of the population number (N). As N approaches K, r′ decreases, reaching zero when the population number equals the environmental capacity (N = K), indicating no further growth. Conversely, when N is zero, r′ is at its maximum, equivalent to the intrinsic growth rate of the population (r). Therefore, it can be assumed that
According to the Logistic differential equation model,
By solving this equation, we can obtain the following:
The following given condition is considered:
After integration, we can obtain the following:
The solution is formalized in
Further sorting produce equations are
and
By performing unary regression, we can obtain
We can then obtain parameters a and r.
These mathematical findings enable the calculation of the effective duration for a one-time application of 12 t/hm2 biochar in mitigating soil N2O emissions, informed by the result of an increased copy number value for key marker functional genes from the biochar treatment.
2.5. Statistical Analysis
A one-way ANOVA was conducted using SPSS22 software. The Pearson correlation coefficient was employed to examine the relationship between gas emission fluxes and influencing factors, with the significance threshold being set at p < 0.05. Graphs were generated using Origin8.5 software, and all data were presented as mean ± standard deviation. The comprehensive impact of soil physicochemical properties and microorganisms on soil N2O emissions was assessed through structural equation modeling (SEM) using Amos17.0 software. Excel 2021 was utilized to estimate the duration of soil N2O emission reduction by biochar based on the Logistic model.
3. Results
3.1. Effects of Biochar Doses and Application Frequency on Soil N2O Emissions
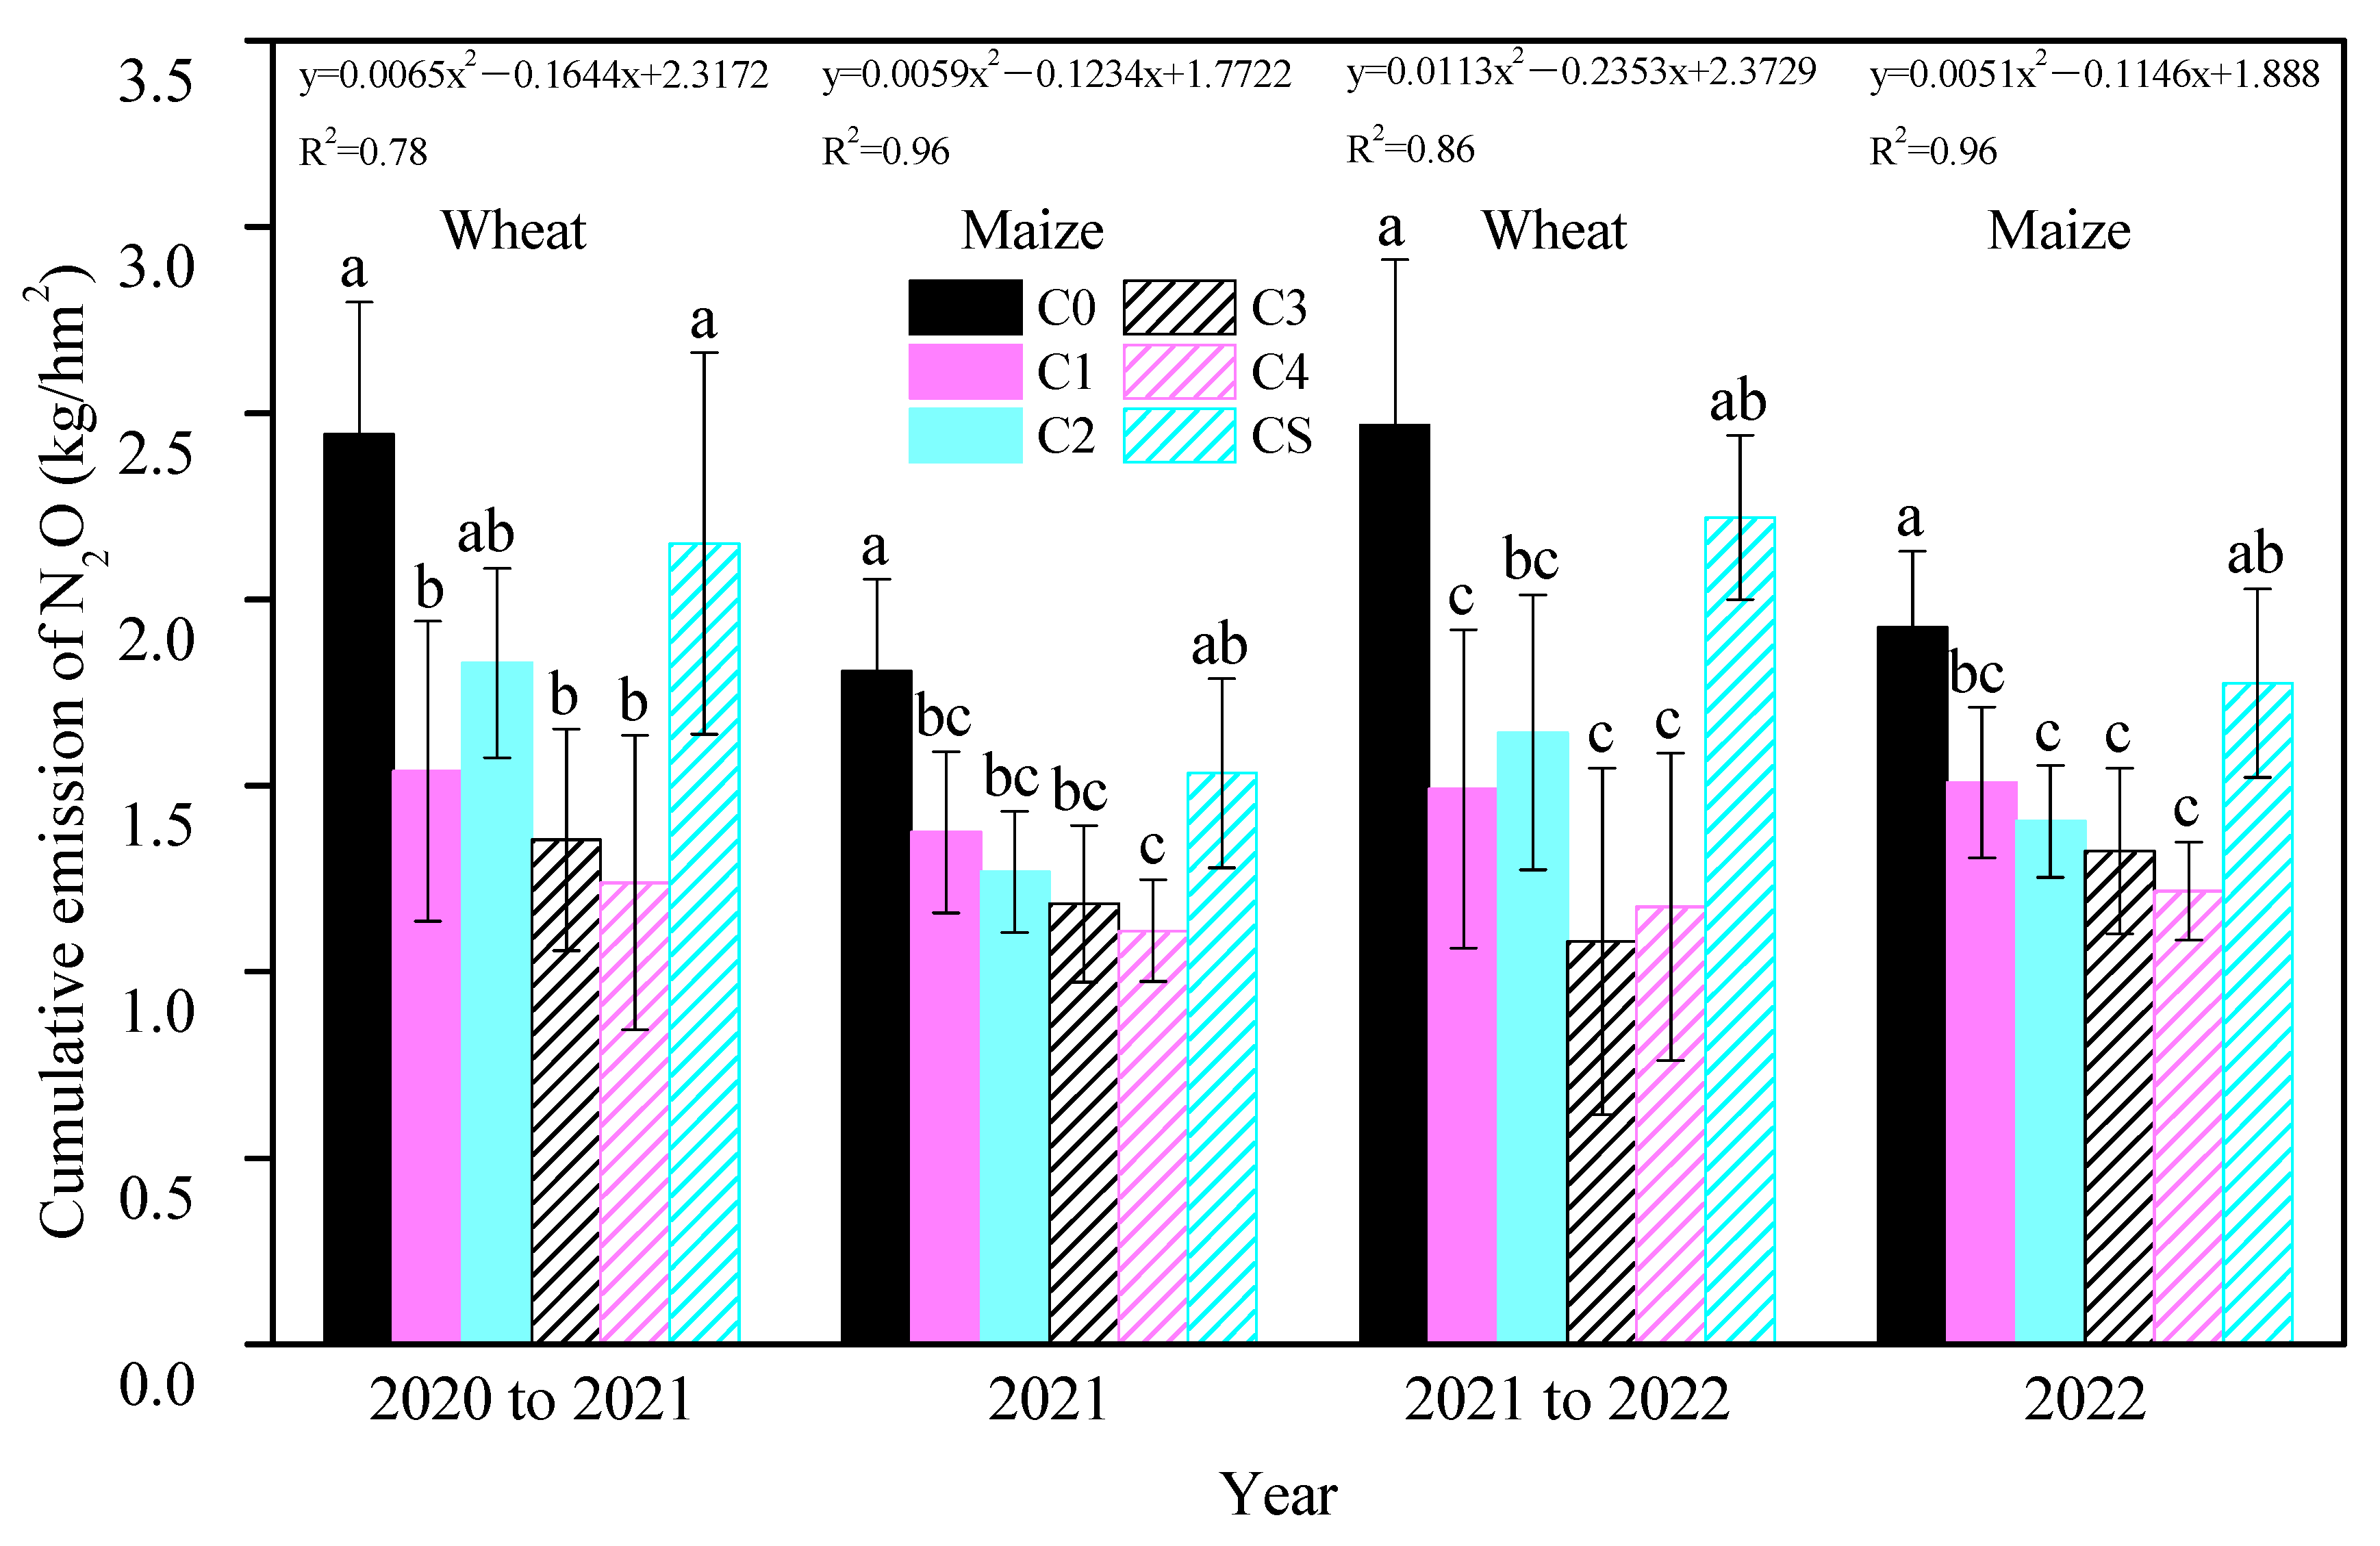
Throughout the experimental period, annual biochar additions consistently reduced cumulative soil N2O emissions, with treatments C3 and C4 exhibiting the most pronounced inhibitory effects in each growing season (Figure 1). Relative to C0, cumulative N2O emissions in the wheat seasons decreased by 44.69% and 56.21% for C3 and by 49.39% and 52.45% for C4. In the maize seasons, these reductions were 34.65% and 31.36% for C3 and 38.62% and 36.92% for C4. An inverse quadratic linear relationship was observed between the biochar doses and cumulative N2O emissions, indicating a decrease in emissions with increasing biochar application. The one-time application of 12 t/hm2 biochar (CS) showed a reduction in cumulative N2O emissions compared to C0, but this result was not significant, indicating its ineffectiveness in substantially reducing soil N2O emissions three years post-application. The study highlighted that biochar’s inhibition of soil N2O emissions was predominantly observed at emission peaks (Figure 2). During the wheat season, peak N2O fluxes in treated soils occurred following base and topdressing fertilizer applications, remaining low throughout the rest of the season. In the maize season, the first emission peak occurred post-fertilization, followed by a declining trend, with a second peak emerging from late July to mid-August annually. Although the maize season soil exhibited higher N2O flux intensity than in the wheat season, biochar’s emission mitigation was more effective during the wheat season.
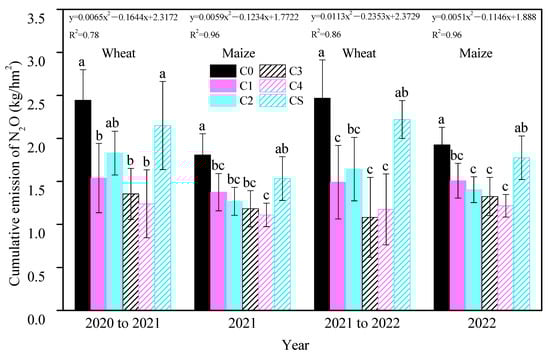
Figure 1.
Cumulative soil N2O emissions in each season and treatment. Bars are shown as the means with standard errors. Different small letters for the same season indicate a significant difference between the groups (p < 0.05). The equation represents the linear relationship between different biochar inputs and soil cumulative N2O emissions in each season.
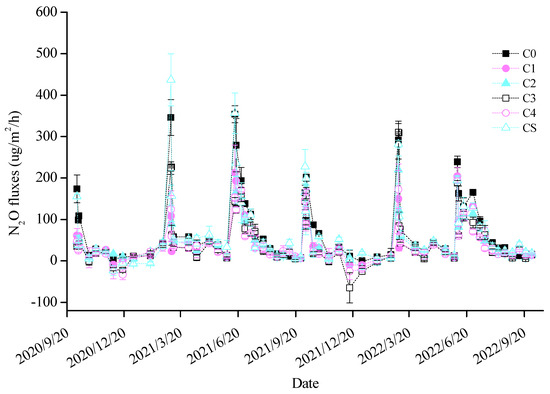
Figure 2.
Changes in soil N2O fluxes in each treatment. Broken lines are shown as means with standard errors. The same applies to the figures below.
3.2. Effects of Biochar Dosage and Frequency on Soil Inorganic Nitrogen, Temperature, and Moisture
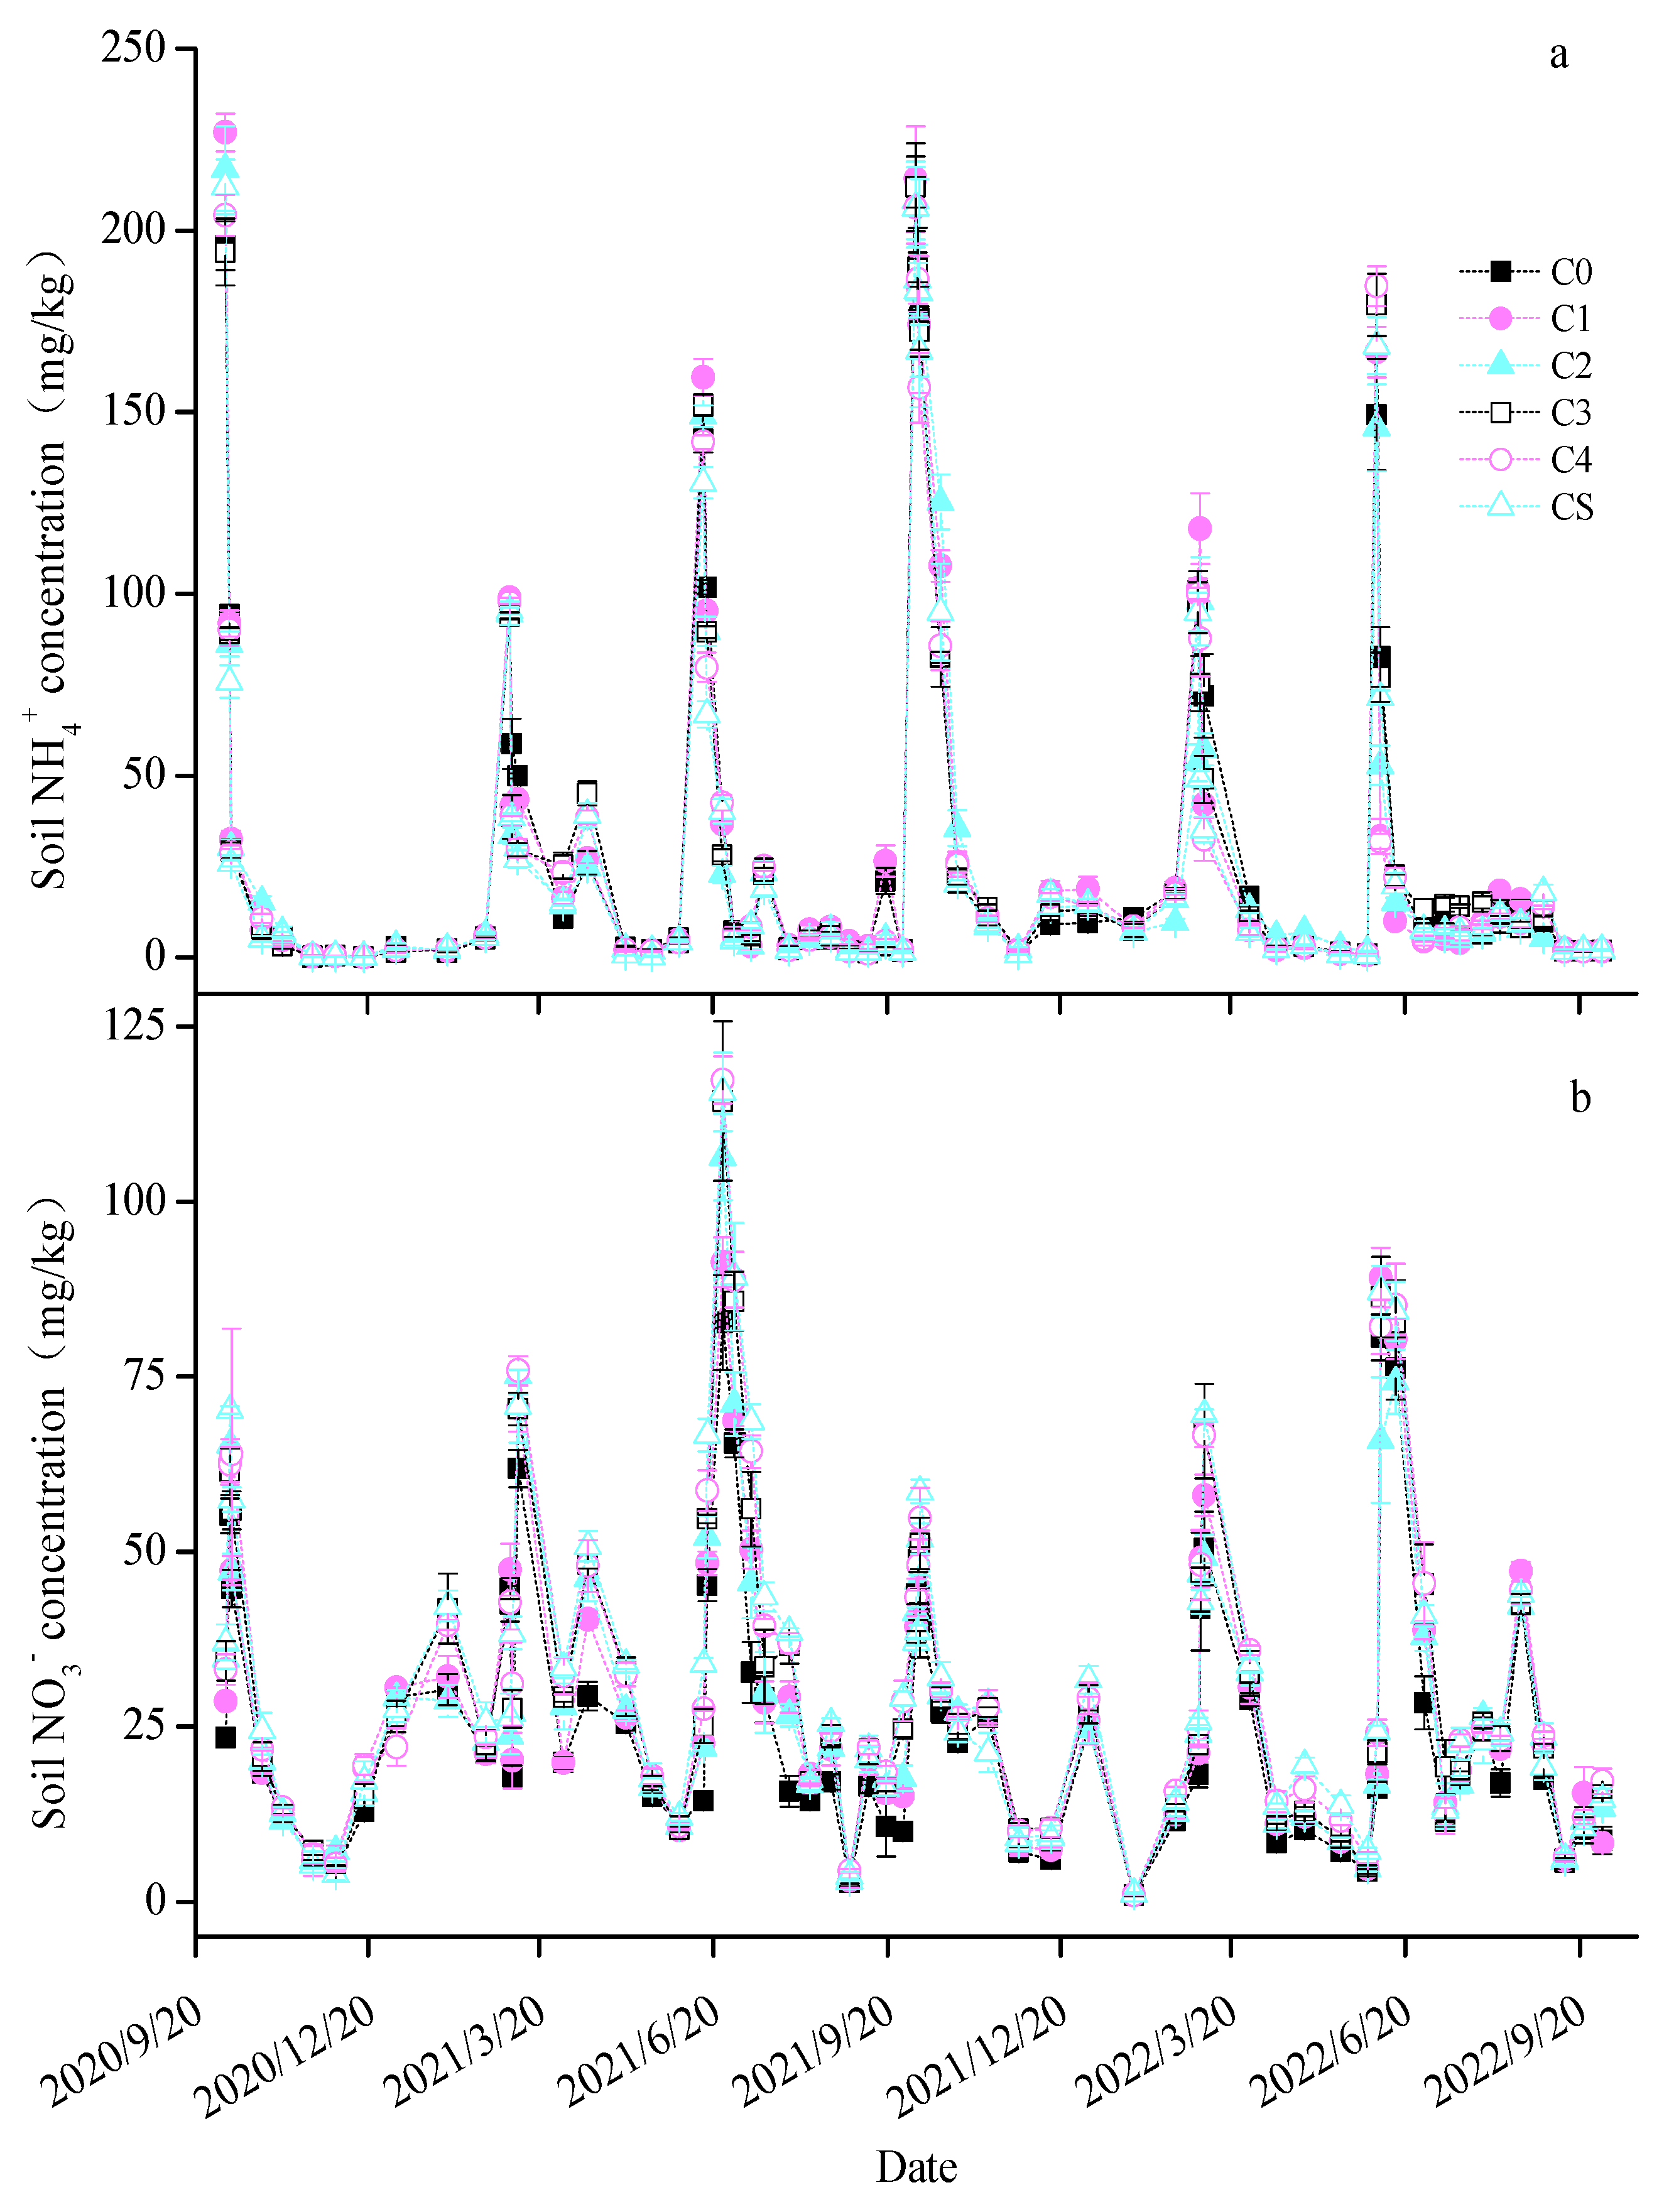
The soil content trends were similar across all treatments, peaking swiftly post-fertilization before decreasing rapidly (Figure 3a). Notably, in the first maize season, the C2 and C4 treatments decreased average soil content by 10.2% and 20.1%, respectively. In the maize season of the second year, only C2 treatment significantly reduced the average soil by 20.1%. The soil trends followed a consistent pattern across treatments (Figure 3b), increasing after fertilization and then gradually declining. In the first wheat season, the C3, C4, and CS treatments significantly raised the average soil by 12.35–25.69%. During the first maize season, the biochar treatments elevated the average soil content by 21.18–59.02%. In the second wheat season, all treatments except C1 increased the average soil content by 13.26–25.29%, and in the second maize season, all except C2 enhanced the soil content by 13.52–18.80%. The soil temperature and moisture dynamics are depicted in Figure S1. The soil temperature changes were gradual over time across the treatments, while the soil moisture exhibited more significant fluctuations due to irrigation and precipitation. The biochar treatments, particularly C3, C4, and CS, modestly increased the average soil temperature by 1.22–4.30%, 1.90–5.61%, and 1.62–4.40%, respectively (Table S1). Only the CS treatment significantly reduced soil moisture in the first wheat season by 16.14%, whereas the other biochar treatments did not notably affect soil moisture during the whole test period.
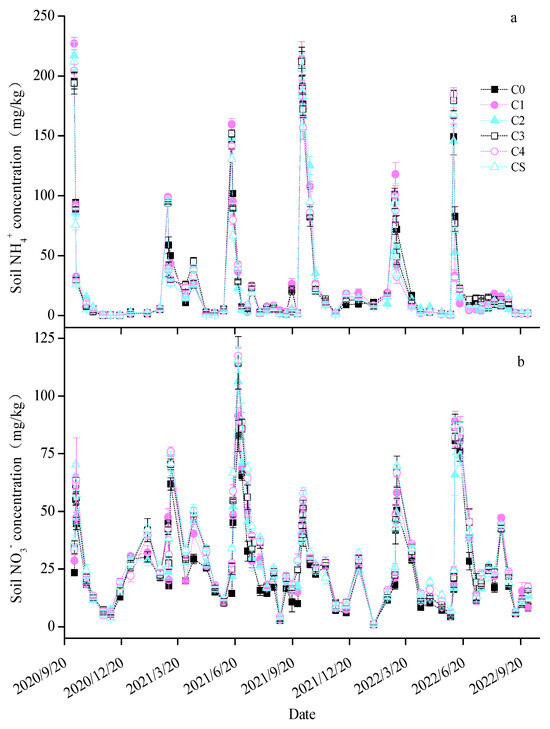
Figure 3.
Changes in the soil (a) and (b) content in each treatment.
3.3. Effects of Biochar Dosage and Frequency on Functional Genes
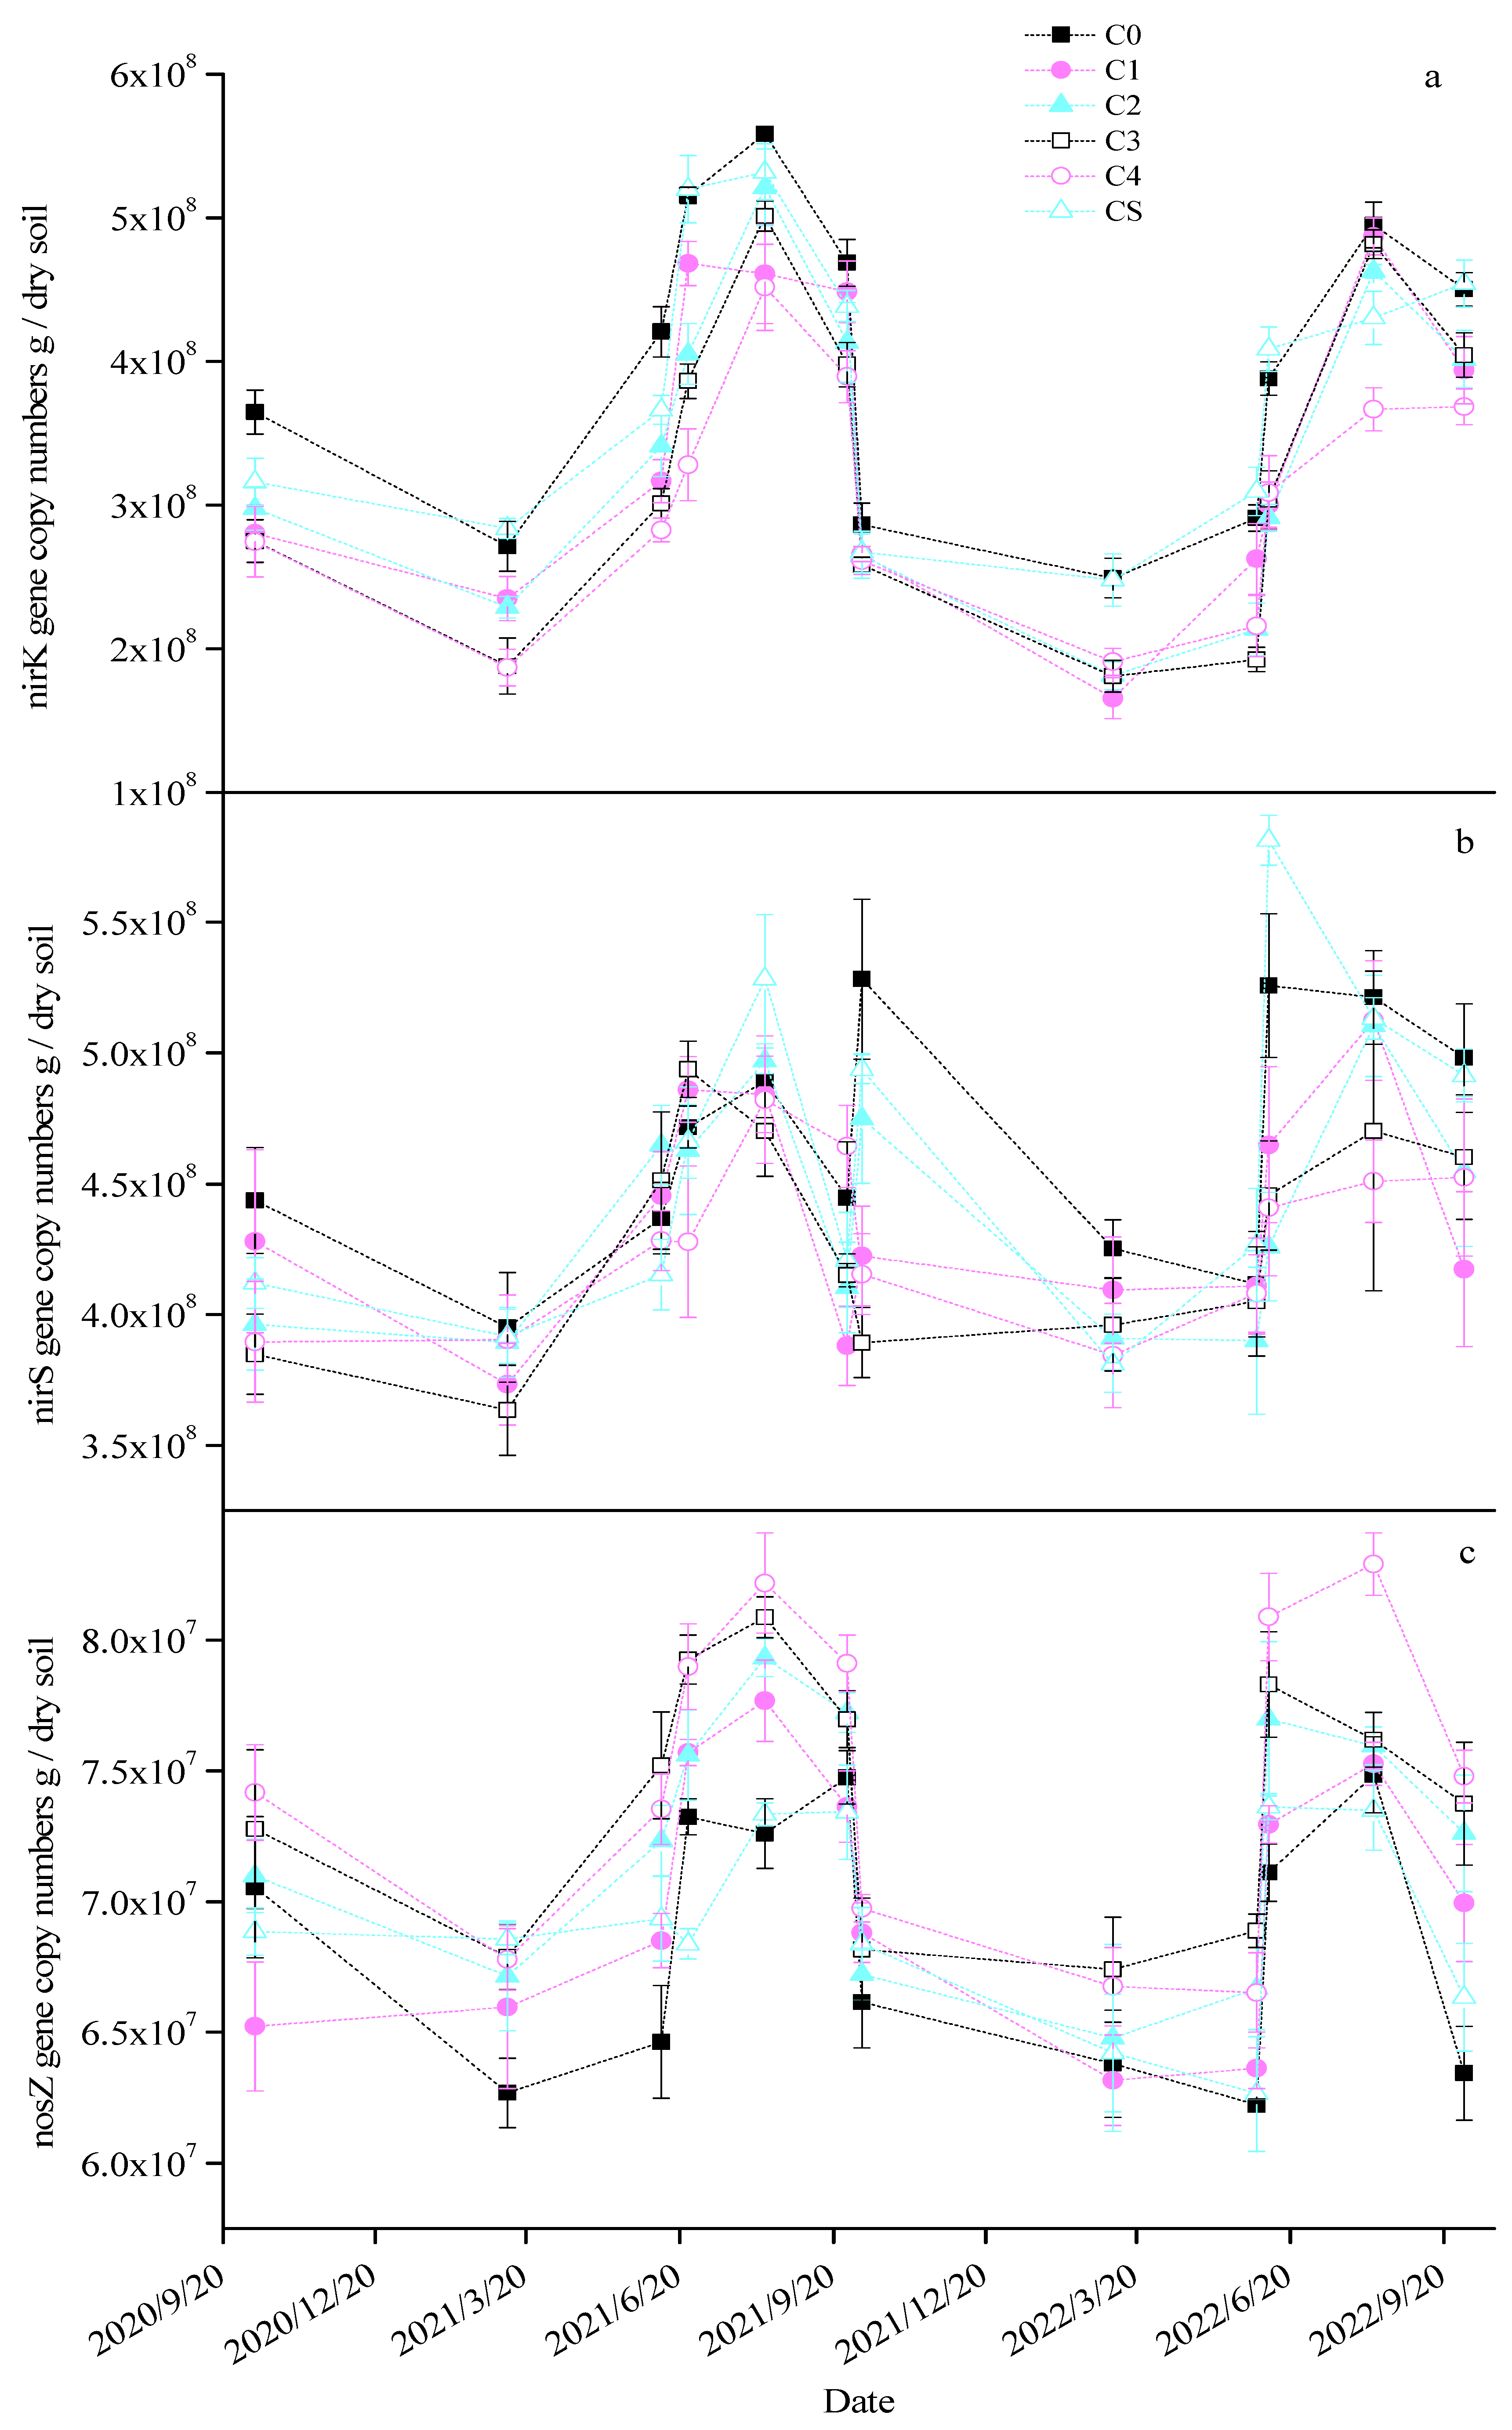
Seasonal variations were observed in the copy numbers of the nirK, nirS, and nosZ genes in the soil across the different treatments, with significantly higher values being noted during the maize season than in the wheat season (Figure 4). Excluding the CS treatment, the biochar applications resulted in significant reductions in soil nirK gene copy numbers of 17.90–29.55%, 10.70–24.12%, 16.30–23.55%, and 10.99–21.97% across the four growing seasons, respectively (Table 2). The CS treatment led to a notable decrease of 8.50% in the nirK gene copy number in the first wheat season only. During the second maize season, all biochar treatments except CS significantly reduced the nirS gene copy number by 9.72–12.99%. In other seasons, the impact of biochar on the soil nirS gene copy number was not significant. All biochar treatments except CS enhanced the nosZ gene copy number to various extents, particularly in the C3 and C4 treatments, with increases of 9.11% and 8.92%, 7.49% and 8.94%, 6.39% and 5.65%, and 9.00% and 13.95% in the respective seasons. Additionally, slight seasonal shifts were noted in the AOB gene copy number across the treatments, marked by a substantial rise in the middle of the second maize season (Figure S2a). The biochar treatments led to significant increases in the soil AOB gene copy number, with increments of 56.18–197.44%, 28.23–83.93%, 68.85–284.63%, and 70.68–151.61% in the respective growing seasons. The AOA gene copy number in the soil exhibited no significant seasonal variation (Figure S2b). All biochar treatments except for CS notably augmented the soil AOA gene copy number by 28.26–69.09%, 18.84–70.96%, 28.53–90.57%, and 21.00–25.80% across the four seasons, respectively.
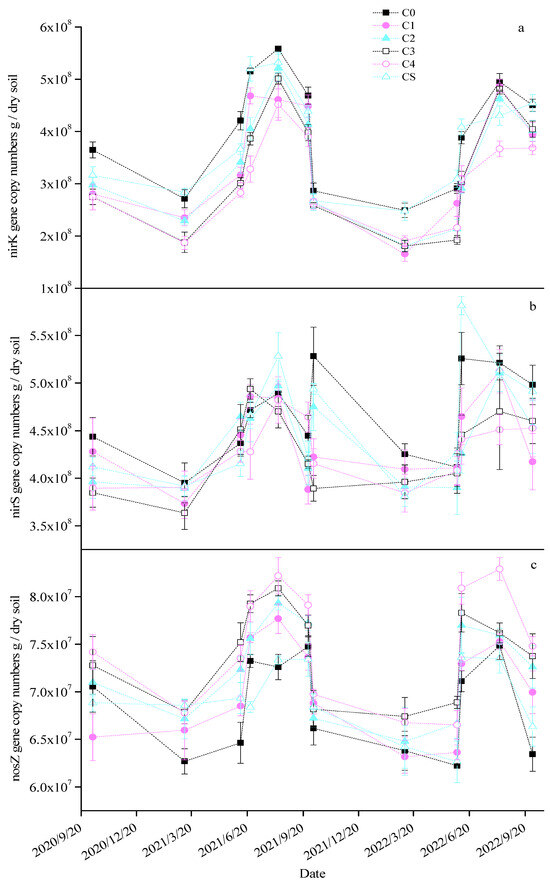
Figure 4.
Changes in the nirK (a), nirS (b), and nosZ (c) gene copy numbers in each treatment.
Table 2.
The mean values for AOA, AOB, nirK, nirS, and nosZ gene copy numbers for each treatment. Different small letters of the same season and same gene indicate a significant difference between the groups (p < 0.05).
3.4. SEM of Biochar’s Effects on Soil N2O Emissions
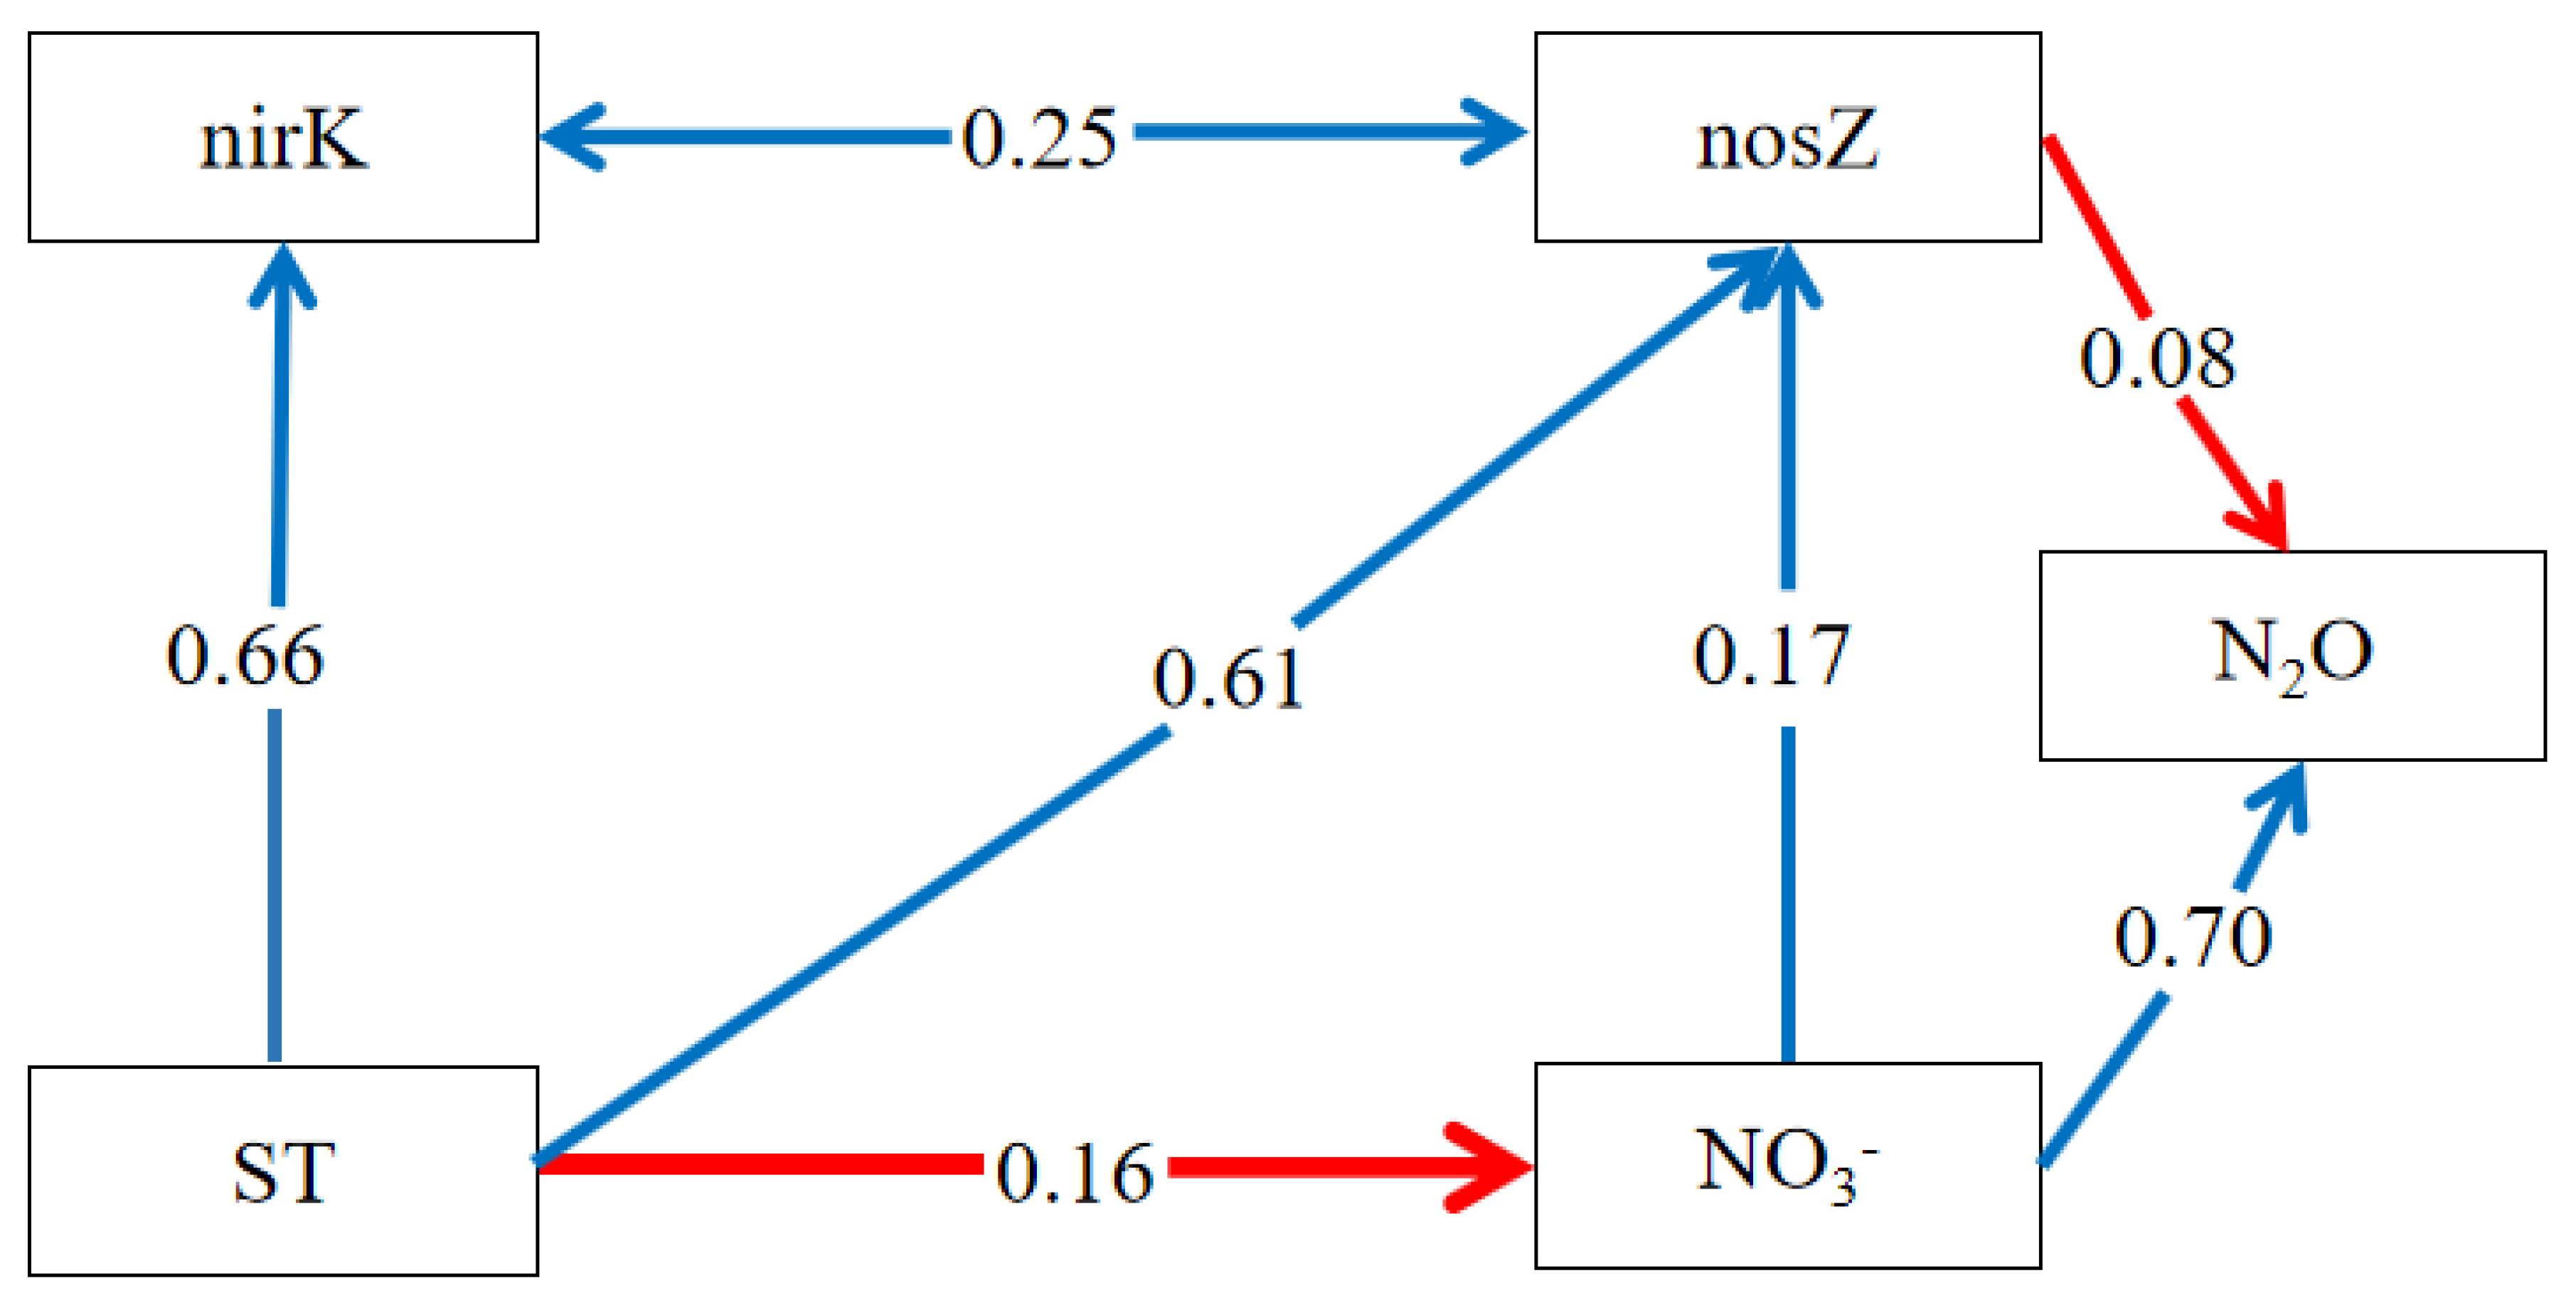
The results from the structural equation modeling (SEM) indicated that the nosZ gene significantly reduced soil N2O emissions, evidenced by a path coefficient of −0.08 (Figure 5). The soil content, an important factor, influenced N2O emissions both directly and indirectly through the nosZ gene, yielding a path coefficient of 0.70 + 0.17 × (−0.08) = 0.69. Soil moisture and temperature were found to significantly impact the nosZ gene, with soil temperature also affecting content. Hence, in our study, soil temperature and moisture indirectly influenced soil N2O emissions. The nirK gene had no direct effect on soil N2O emissions, but the SEM revealed an association with the nosZ gene, potentially affecting its copy number. Under drought conditions, the denitrification process in soil was less pronounced. However, soil denitrification was aggravated after precipitation and irrigation. Biochar application could significantly reduce soil N2O emissions by reducing denitrification N2O emissions.
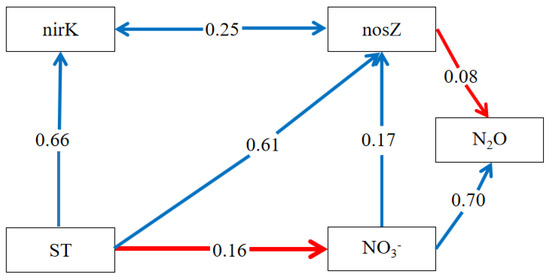
Figure 5.
SEM of factors influencing soil N2O emissions. The blue line indicates a positive correlation, and the red line indicates a negative correlation. A→B represents the action of A on B, and A↔B represents the interaction between A and B.
3.5. Prediction of the Inhibition Time of Biochar on Soil N2O Emissions Based on the Logistic Ecological Model
It is evident that the nosZ gene emerged as the key functional gene in the biochar-mediated inhibition of soil N2O emissions. From the C4 treatment data in Table S2, the peak increase in the nosZ gene copy number was approximately 1 × 10⁷, denoted as the K value in 1.5. For evaluating the nosZ gene copy number increase for the C5 treatment in Table S2, data from 7 October 2021, 6 March 2022, and 31 May 2022 were chosen. Parameter a was determined to be 0.2907, and r was considered as −0.0041, following the methodology in Section 2.4, yielding y = 0.2907 − (−0.0041t). In correlating these findings with the N2O emission fluxes on corresponding dates (Figure 2), it was shown that an increase in the nosZ gene copy number to 1 × 10⁶ notably suppressed soil N2O emissions. Consequently, the CS processing duration was calculated from the maximum (1 × 10⁷) to the minimum (1 × 10⁶) value, which was approximately 1.77 years. Therefore, based on the logistic ecological model, a one-time application of 12 t/hm2 of biochar would cause a rapid surge leading to a peak in nitrous oxide-reducing bacteria, followed by a decline to the base level, effectively restraining soil N2O emissions for an estimated duration of 1.77 years.
4. Discussion
4.1. Effects of Biochar on Soil Environment and Inorganic Nitrogen
In our study, an increase in average soil temperature was observed following biochar application, aligning with previous findings that attribute this to biochar’s black color and greater heat absorption capacity [45,46]. However, biochar had no significant effect on soil moisture in our study. The soil moisture levels were primarily influenced by precipitation and irrigation, with the biochar treatment demonstrating no significant water retention effect. Our results differ from those of many past studies [47,48,49] and may be linked to the characteristics or preparation conditions of the biochar used. It has been reported that straw biochar produced at lower temperatures exhibits considerably higher water retention capabilities compared to that prepared at higher temperatures [50,51]. As temperature increases, biochar’s degree of aromatization intensifies, its hydrophobic properties are enhanced, and the quantity of oxygen- and nitrogen-containing functional groups diminishes, leading to a reduction in biochar’s water-holding capacity [52,53].
Soil and play critical roles as substrates for the nitrification and denitrification processes in soil microorganisms [54,55]. In our study, soil was identified as a primary factor influencing soil N2O emissions, and it was observed that biochar application increased soil levels, with particularly notable effects in the C3, C4, and CS treatments. Owing to its large specific surface area and efficient adsorption capabilities, biochar minimizes leaching, thereby retaining within the soil [56,57]. Furthermore, a reduction in soil content was noted, implying that the rise in soil was partly due to enhanced nitrification. This inference is supported by the observed increases in AOB and AOA gene copy numbers in soils treated with biochar. Additionally, an increment in biochar application was found to suppress the amplification of nirK and nirS gene copy numbers, suggesting that biochar inhibits reduction, thereby augmenting soil concentration [58]. A positive correlation was established between the quantity of biochar added and the nosZ gene copy number in the soil. Notably, the nosZ gene copy number exhibited positive associations with both soil temperature and levels. The elevated soil temperatures enhance the activity of N2O-reducing bacteria, leading to an increased nosZ gene copy number [59,60,61]. Additionally, a higher concentration of in the soil favors a rise in nosZ gene copy number [62].
4.2. Influence of Biochar on Soil N2O Emissions and Its Temporal Effects
Biochar application has been found to affect N2O production from nitrification and denitrification, effectively reducing soil N2O emissions [24]. Our research indicated a significant increase in AOB and AOA gene frequencies and concentration in the soil post-biochar treatment, suggesting that biochar enhances nitrification, which may indirectly affect soil N2O emissions [63]. Nonetheless, the overall impact of biochar was a reduction in soil N2O emissions, underscoring its efficacy in inhibiting N2O generation during denitrification. The SEM of relevant factors revealed that biochar’s primary mechanism for reducing soil N2O emissions was through increasing the nosZ gene copy number, thereby facilitating the N2O reduction [64,65]. It was also observed that biochar could reduce N2O emissions by increasing the abundance of N2O-reducing bacteria in a field experiment in North China [25]. Hence, denitrification is identified as the crucial process through which biochar mitigates soil N2O emissions in this experimental context. Additionally, the rise in soil levels appeared to stimulate microbial activity associated with N2O reduction [66]. This inhibition mechanism was also found in our results, especially in the treatment with a high amount biochar application, and this may be because the addition of biochar creates a more favorable environment for nitrous oxide-reducing bacteria, which, in turn, enhances the N2O reduction process [67]. Furthermore, higher amounts of biochar showed superior efficacy in adsorbing , thus diminishing the nitrification substrate availability and further reducing N2O emissions [68,69].
Our findings indicate that the annual application of 8 t/hm2 biochar was most effective in inhibiting N2O emissions in the wheat season, whereas it was 12 t/hm2 in the maize season, which is consistent with the results of many previous studies [70,71,72]. Biochar’s emission reduction is attributed to alterations in soil physicochemical properties and microbial activities, revealing a temporal dependency in its inhibitory effect. In 2018, a one-time application of 12 t/hm2 biochar (CS treatment) was implemented; however, no significant N2O emission reduction was exhibited throughout the study period. Given the pre-planting application of biochar in the wheat season and its time-sensitive effect, biochar was found to be more effective in reducing N2O emissions during the wheat season than in the maize season. Over time, the beneficial properties of biochar, such as its large specific surface area and strong adsorption, tend to diminish, affecting soil structure and microbial activity, thereby impacting its N2O emission reduction capacity [73,74,75,76]. Furthermore, biological processes, including the invasive growth of saprophytic mycelia and extracellular enzymes, can alter biochar’s structure within the soil, potentially leading to its fragmentation and influencing its functionality [77].
According to the above results, to accurately estimate the duration of biochar’s inhibitory effect on soil N2O emissions, we adopted a logistic ecological model. The findings suggest that the inhibitory impact of 12 t/hm2 biochar on soil N2O emissions persists for approximately 1.77 years under the conditions of this experiment. Therefore, reapplying 12 t/hm2 biochar at intervals of roughly 1.77 years can effectively and sustainably reduce soil N2O emissions. This aligns with the work of Liu et al. [18], who noted that a single application of 13.5 t/hm2 biochar significantly reduced soil N2O emissions in the first two years, with no marked difference observed at the onset of the third year. A clear correlation exists between biochar’s duration and application rate. Based on our experiments and the practical aspects of farmland management, in a wheat–maize rotation system, the initial biochar application should occur before wheat sowing in the first cycle, followed by a second application before maize sowing in the second cycle (around 1.5 years after the previous application) and a third application before maize sowing in the fourth cycle (approximately 2 years after the last application), continuing with alternating intervals of 1.5 and 2 years. While prior research has generally advocated for annual biochar applications, considering economic and labor costs, extending the interval between biochar applications has proven to be an efficient strategy [78,79]. For instance, using a 12 t/hm2 biochar application, as recommended in this study, could reduce the average annual cost of biochar by 37.5%, significantly reduce labor requirements, and optimize biochar’s value.
The primary cause of increased soil N2O emissions has been identified as fertilizer application, with reductions in fertilization to lower these emissions potentially impacting crop yield negatively [80,81]. However, integrating biochar with fertilizers has been shown to decrease soil N2O emissions without compromising crop yield. Experimental results indicate that biochar application effectively diminishes soil N2O emissions via denitrification. Within this study’s parameters, the optimal biochar application rate for the targeted area, under standard nitrogen fertilization conditions, was determined to be 12 t/hm2. Furthermore, it was recommended that biochar be applied at alternating intervals of 1.5 and 2 years to sustain its efficacy.
5. Conclusions
In this study, we examined the effect of biochar on soil N2O emissions and its time-limited effect. Biochar significantly reduced soil N2O emissions compared to the control (C0), particularly during fertilization, irrigation, and precipitation events. SEM analysis revealed that biochar diminished N2O emissions by enhancing N2O reabsorption, with this effect being notably pronounced in treatments with larger biochar quantities (C4). However, the suppression of N2O emissions by large, one-time applications of biochar was not sustained. Utilizing a logistic ecological model, it was determined that the biochar’s inhibitory influence on soil N2O emissions gradually declines, persisting for approximately 1.77 years. Thus, when evaluating the overall cost and benefits of biochar usage, the quantity of biochar applied and the frequency of its application emerge as critical considerations.
Supplementary Materials
The following supporting information can be downloaded at: https://www.mdpi.com/article/10.3390/su16135813/s1. Table S1: Mean table of soil properties under the six experimental treatments. Data are the mean with standard errors. Lowercase letter in the same column and in the same season represents significant differences among experimental treatments at the level of 0.05; Table S2: Compared with C0, the increased value of nosZ gene copy numbers under the six experimental treatments. Figure S1: Variation of the soil temperature (a) and soil moisture (b) under the six experimental treatments. Data are shown as the means with standard errors; Figure S2: Variation of the AOB (a) and AOA (b) gene copy numbers under the six experimental treatments. Data are shown as the means with standard errors.
Author Contributions
H.L.: Conceptualization, Methodology, Writing—Original Draft, Formal analysis. N.W.: Data curation: Writing—Review and Editing. Y.W.: Writing—Review and Editing, Supervision. Y.L.: Writing—Review and Editing. Y.Z.: Writing—Review and Editing, Supervision. G.Q.: Writing—Original Draft. H.D.: Writing—Review and Editing. H.W.: Methodology. X.Z.: Supervision, Project administration. X.L.: Writing—Review and Editing, Supervision. All authors have read and agreed to the published version of the manuscript.
Funding
Agricultural science and technology innovation project of Shandong Academy of Agricultural Sciences (CXGC2024B12; CXGC2024D14; CXGC2023F14); National Technological Innovation Center for Comprehensive Utilization of Saline-Alkali Land “Open List” project “Carbon Budget Assessment of Different Improved Utilization Modes of Saline-alkali Land” (GYJ2023003), the Natural Science Foundation of Shandong Province (ZR2023MD131; ZR2022QC227).
Institutional Review Board Statement
Not applicable.
Informed Consent Statement
Not applicable.
Data Availability Statement
The data that support the findings of this study are available on request from the corresponding author. Please contact xinhuali_2008@163.com.
Conflicts of Interest
The authors declare no conflicts of interest.
Correction Statement
This article has been republished with a minor correction to the existing affiliation information. This change does not affect the scientific content of the article.
Abbreviations
| N2O | Nitrous oxide |
| AOB | Ammonia-oxidizing bacteria |
| AOA | Ammonia-oxidizing archaea |
| nirK | Nitrite reductase K |
| nirS | Nitrite reductase S |
| nosZ | Nitric oxide reductase |
References
- Ma, R.Y.; Yu, K.; Xiao, S.Q.; Liu, S.W.; Ciais, P.; Zou, J.W. Data-driven estimates of fertilizer-induced soil NH3, NO and N2O emissions from croplands in China and their climate change impacts. Glob. Chang. Biol. 2022, 28, 1008–1022. [Google Scholar] [CrossRef] [PubMed]
- Wang, G.F.; Liu, P.; Hu, J.M.; Zhang, F. Agriculture-Induced N2O Emissions and Reduction Strategies in China. Int. J. Environ. Res. Public Health 2022, 19, 12193. [Google Scholar] [CrossRef] [PubMed]
- Wu, B.B.; Li, J.H.; Yao, Z.L.; Li, X.; Wang, W.J.; Wu, Z.C.; Zhou, Q. Characteristics and reduction assessment of GHG emissions from crop residue open burning in China under the targets of carbon peak and carbon neutrality. Sci. Total Environ. 2023, 905, 167235. [Google Scholar] [CrossRef] [PubMed]
- Yang, S.; Yang, D.Z.; Shi, W.; Deng, C.C.; Chen, C.B.; Feng, S.J. Global evaluation of carbon neutrality and peak carbon dioxide emissions: Current challenges and future outlook. Environ. Sci. Pollut. Res. 2023, 30, 81725–81744. [Google Scholar] [CrossRef]
- Qin, F.Z.; Li, J.L.; Zhang, C.; Zeng, G.M.; Huang, D.L.; Tan, X.F.; Qin, D.Y.; Tan, H. Biochar in the 21st century: A data-driven visualization of collaboration, frontier identification, and future trend. Sci. Total Environ. 2022, 818, 151774. [Google Scholar] [CrossRef] [PubMed]
- Kaur, N.; Kieffer, C.; Ren, W.; Hui, D.F. How much is soil nitrous oxide emission reduced with biochar application? An evaluation of meta-analyses. GCB Bioenergy 2023, 15, 24–37. [Google Scholar] [CrossRef]
- Wang, L.; Chen, D.J.; Zhu, L.Z. Biochar carbon sequestration potential rectification in soils: Synthesis effects of biochar on soil CO2, CH4 and N2O emissions. Sci. Total Environ. 2023, 904, 167047. [Google Scholar] [CrossRef] [PubMed]
- Wu, Z.; Dong, Y.B.; Zhang, X.; Xu, X.T.; Xiong, Z.Q. Biochar single application and reapplication decreased soil greenhouse gas and nitrogen oxide emissions from rice–wheat rotation: A three-year field observation. Geoderma 2023, 435, 116498. [Google Scholar] [CrossRef]
- Zhang, X.Y.; Gu, L.P.; Gui, D.Y.; Xu, B.; Li, R.; Chen, X.; Sha, Z.P.; Pan, X.J. Suitable biochar application practices simultaneously alleviate N2O and NH3 emissions from arable soils: A meta-analysis study. Environ. Res. 2024, 242, 117750. [Google Scholar] [CrossRef] [PubMed]
- Zhang, S.B.; Zhou, J.S.; Chen, J.; Ge, T.D.; Cai, Y.J.; Yu, B.; Wang, H.L.; White, J.; Li, Y.F. Changes in soil CO2 and N2O emissions in response to urea and biochar-based urea in a subtropical Moso bamboo forest. Soil Tillage Res. 2023, 228, 105625. [Google Scholar] [CrossRef]
- Wu, P.; Xie, M.; Clough, T.J.; Yuan, D.; Wu, S.; He, X.; Hu, C.; Zhou, S.; Qin, S. Biochar-derived persistent free radicals and reactive oxygen species reduce the potential of biochar to mitigate soil N2O emissions by inhibiting nosZ. Soil Biol. Biochem. 2023, 178, 108970. [Google Scholar] [CrossRef]
- Ji, C.; Li, S.Q.; Geng, Y.J.; Miao, Y.; Ding, Y.; Liu, S.W.; Zou, J.W. Differential responses of soil N2O to biochar depend on the predominant microbial pathway. Appl. Soil Ecol. 2020, 145, 103348. [Google Scholar] [CrossRef]
- Fan, C.H.; Duan, P.P.; Zhang, X.; Shen, H.J.; Chen, M.; Xiong, Z.Q. Mechanisms underlying the mitigation of both N2O and NO emissions with field-aged biochar in an Anthrosol. Geoderma 2020, 364, 114178. [Google Scholar] [CrossRef]
- Yanai, Y.; Toyota, K.; Okazaki, M. Effects of charcoal addition on N2O emissions from soil resulting from rewetting air-dried soil in short-term laboratory experiments. Soil Sci. Plant Nutr. 2007, 53, 181–188. [Google Scholar] [CrossRef]
- Wu, Y.Z.; Li, Y.; Wang, H.B.; Wang, Z.J.; Fu, X.Q.; Shen, J.L.; Wang, Y.; Liu, X.L.; Meng, L.; Wu, J.S. Response of N2O emissions to biochar amendment on a tea field soil in subtropical central China: A three-year field experiment. Agric. Ecosyst. Environ. 2021, 318, 107473. [Google Scholar] [CrossRef]
- Wang, L.; Yang, K.; Gao, C.C.; Zhu, L.Z. Effect and mechanism of biochar on CO2 and N2O emissions under different nitrogen fertilization gradient from an acidic soil. Sci. Total Environ. 2020, 747, 141265. [Google Scholar] [CrossRef] [PubMed]
- Borchard, N.; Schirrmann, M.; Cayuela, M.L.; Kammann, C.; Wrage-Mönnig, N.; Estavillo, J.M.; Fuertes-Mendizábal, T.; Sigua, G.; Spokas, K.; Ippolito, J.A.; et al. Biochar, soil and land-use interactions that reduce nitrate leaching and N2O emissions: A meta-analysis. Sci. Total Environ. 2019, 651, 2354–2364. [Google Scholar] [CrossRef] [PubMed]
- Liu, H.Y.; Li, H.B.; Zhang, A.P.; Rahaman, M.A.; Yang, Z.L. Inhibited effect of biochar application on N2O emissions is amount and time-dependent by regulating denitrification in a wheat-maize rotation system in North China. Sci. Total Environ. 2020, 721, 137636. [Google Scholar] [CrossRef] [PubMed]
- Ivanova, N.; Obaeed, G.L.O.; Sulkarnaev, F.; Buchkina, N.; Gubin, A.; Yurtaev, A. Effect of biochar aging in agricultural soil on its wetting properties and surface structure. Biochar 2023, 5, 75. [Google Scholar] [CrossRef]
- Liao, X.; Liu, D.Y.; Niu, Y.H.; Chen, Z.M.; He, T.H.; Ding, W.X. Effect of field-aged biochar on fertilizer N retention and N2O emissions: A field microplot experiment with 15N-labeled urea. Sci. Total Environ. 2021, 773, 145645. [Google Scholar] [CrossRef] [PubMed]
- Duan, P.P.; Zhang, X.; Zhang, Q.Q.; Wu, Z.; Xiong, Z.Q. Field-aged biochar stimulated N2O production from greenhouse vegetable production soils by nitrification and denitrification. Sci. Total Environ. 2018, 642, 1303–1310. [Google Scholar] [CrossRef] [PubMed]
- Liang, X.; Zhou, W.; Yang, R.; Zhang, D.; Wang, H.; Li, Q.; Qi, Z.; Li, Y.; Lin, W. Microbial mechanism of biochar addition to reduce N2O emissions from soilless substrate systems. J. Environ. Manag. 2023, 348, 119326. [Google Scholar] [CrossRef] [PubMed]
- Edwards, J.D.; Pittelkow, C.M.; Kent, A.D.; Yang, W.H. Dynamic biochar effects on soil nitrous oxide emissions and underlying microbial processes during the maize growing season. Soil Biol. Biochem. 2018, 122, 81–90. [Google Scholar] [CrossRef]
- Tang, Z.M.; Liu, X.R.; Li, G.C.; Liu, X.R. Mechanism of biochar on nitrification and denitrification to N2O emissions based on isotope characteristic values. Environ. Res. 2022, 212, 113219. [Google Scholar] [CrossRef] [PubMed]
- Shi, Y.L.; Liu, X.R.; Zhang, Q.W. Effects of combined biochar and organic fertilizer on nitrous oxide fluxes and the related nitrifier and denitrifier communities in a saline-alkali soil. Sci. Total Environ. 2019, 686, 199–211. [Google Scholar] [CrossRef]
- Kookana, R.S.; Sarmah, A.K.; Zwieten, L.V.; Krull, E.V.; Singh, B. Biochar application to soil: Agronomic and environmental benefits and unintended consequences. Adv. Agron. 2011, 112, 103–143. [Google Scholar]
- Ji, C.; Li, S.Q.; Geng, Y.J.; Yuan, Y.M.; Zhi, J.Z.; Yu, K.; Han, Z.Q.; Wu, S.; Liu, S.W.; Zou, J.W. Decreased N2O and NO emissions associated with stimulated denitrification following biochar amendment in subtropical tea plantations. Geoderma 2020, 365, 114223. [Google Scholar] [CrossRef]
- Dai, Z.M.; Li, Y.; Zhang, X.J.; Wu, J.J.; Luo, Y.; Kuzyakov, Y.; Brookes, P.C.; Xu, J.M. Easily mineralizable carbon in manure-based biochar added to a soil influences N2O emissions and microbial-N cycling genes. Land Degrad. Dev. 2019, 30, 406–416. [Google Scholar] [CrossRef]
- Zheng, X.B.; Cong, P.; Singh, B.P.; Wang, H.L.; Ma, X.G.; Jiang, Y.J.; Lin, Y.X.; Dong, J.X.; Song, W.J.; Feng, Y.F.; et al. Fertilizer nitrogen substitution using biochar-loaded ammonium-nitrogen reduces nitrous oxide emissions by regulating nitrous oxide-reducing bacteria. Environ. Technol. Innov. 2024, 33, 103487. [Google Scholar] [CrossRef]
- Kuang, P.; Cui, Y.; Zhang, Z.; Ma, K.; Zhang, W.; Zhao, K.; Zhang, X. Increasing surface functionalities of FeCl3-modified reed waste biochar for enhanced nitrate adsorption property. Processes 2023, 11, 1740. [Google Scholar] [CrossRef]
- Wu, Z.; Song, Y.S.; Shen, H.J.; Jiang, X.Y.; Li, B.; Xiong, Z.Q. Biochar can mitigate methane emissions by improving methanotrophs for prolonged period in fertilized paddy soils. Environ. Pollut. 2019, 253, 1038–1046. [Google Scholar] [CrossRef] [PubMed]
- Cao, H.; Ning, L.; Xun, M.; Feng, F.; Li, P.; Yue, S.; Song, J.; Zhang, W.; Yang, H. Biochar can increase nitrogen use efficiency of Malus hupehensis by modulating nitrate reduction of soil and root. Appl. Soil Ecol. 2019, 135, 25–32. [Google Scholar] [CrossRef]
- Ma, B.B.; Zhou, X.L.; Zhang, Q.; Qin, M.S.; Hu, L.G.; Yang, K.N.; Xie, Z.; Ma, W.B.; Chen, B.B.; Feng, H.Y.; et al. How do soil micro-organisms respond to N, P and NP additions? Application of the ecological framework of (co-) limitation by multiple resources. J. Ecol. 2019, 107, 2329–2345. [Google Scholar] [CrossRef]
- Lau, J.A.; Lennon, J.T. Rapid responses of soil microorganisms improve plant fitness in novel environments. Proc. Natl. Acad. Sci. USA 2012, 109, 14058–14062. [Google Scholar] [CrossRef] [PubMed]
- Wirsching, J.; Pagel, H.; Ditterich, F.; Uksa, M.; Werneburg, M.; Zwiener, C.; Zwiener, C.; Berner, D.; Kandeler, E.; Poll, C. Biodegradation of pesticides at the limit: Kinetics and microbial substrate use at low concentrations. Front. Microbiol. 2020, 11, 2107. [Google Scholar] [CrossRef] [PubMed]
- Wachenheim, D.E.; Patterson, J.A.; Ladisch, M.R. Analysis of the logistic function model: Derivation and applications specific to batch cultured microorganisms. Bioresour. Technol. 2003, 86, 157–164. [Google Scholar] [CrossRef]
- Bakhshandeh, E.; Rahimian, H.; Pirdashti, H.; Nematzadeh, G.A. Phosphate solubilization potential and modeling of stress tolerance of rhizobacteria from rice paddy soil in northern Iran. World J. Microbiol. Biotechnol. 2014, 30, 2437–2447. [Google Scholar] [CrossRef] [PubMed]
- Schils, R.; Olesen, J.E.; Kersebaum, K.C.; Rijk, B.; Oberforster, M.; Kalyada, V.; Khitrykau, M.; Gobin, A.; Kirchev, H.; Manolova, V.; et al. Cereal yield gaps across Europe. Eur. J. Agron. 2018, 101, 109–120. [Google Scholar] [CrossRef]
- Li, S.Q.; Song, L.N.; Jin, Y.G.; Liu, S.W.; Shen, Q.R.; Zou, J.W. Linking N2O emission from biochar-amended composting process to the abundance of denitrify (nirK and nosZ) bacteria community. AMB Express 2016, 6, 1–9. [Google Scholar] [CrossRef]
- Francis, C.A.; Roberts, K.J.; Beman, J.M.; Santoro, A.E.; Oakley, B.B. Ubiquity and diversity of ammonia-oxidizing archaea in water columns and sediments of the ocean. Proc. Natl. Acad. Sci. USA 2005, 102, 14683–14688. [Google Scholar] [CrossRef]
- Rotthauwe, J.H. The ammonia monooxygenase structural gene amoa as a functional marker: Molecular fine-scale analysis of natural ammonia-oxidizing populations. Appl. Environ. Microbiol. 1997, 63, 4704–4712. [Google Scholar] [CrossRef] [PubMed]
- Hallin, S.; Lindgren, P.E. Pcr detection of genes encoding nitrite reductase in denitrifying bacteria. Appl. Environ. Microbiol. 1999, 65, 1652–1657. [Google Scholar] [CrossRef]
- Guo, G.X.; Deng, H.; Qiao, M.; Mu, Y.J.; Zhu, Y.G. Effect of pyrene on denitrification activity and abundance and composition of denitrifying community in an agricultural soil. Environ. Pollut. 2011, 159, 1886–1895. [Google Scholar] [CrossRef] [PubMed]
- Kloos, K.; Mergel, A.; Christopher, R.; Bothe, H. Denitrification within the genus azospirillum and other associative bacteria. Funct. Plant Biol. 2001, 28, 991–998. [Google Scholar] [CrossRef]
- Feng, W.Y.; Yang, F.; Cen, R.; Liu, J.; Qu, Z.Y.; Miao, Q.F.; Chen, H.Y. Effects of straw biochar application on soil temperature, available nitrogen and growth of corn. J. Environ. Manag. 2021, 277, 111331. [Google Scholar] [CrossRef] [PubMed]
- Gao, Y.; Li, T.X.; Fu, Q.; Li, H.; Liu, D.; Ji, Y.; Li, Q.L.; Cai, Y.P. Biochar application for the improvement of water-soil environments and carbon emissions under freeze-thaw conditions: An in-situ field trial. Sci. Total Environ. 2020, 723, 138007. [Google Scholar] [CrossRef] [PubMed]
- Wei, B.L.; Peng, Y.C.; Lin, L.X.; Zhang, D.L.; Ma, L.; Jiang, L.G.; Li, Y.E.; He, T.G.; Wang, Z.T. Drivers of biochar-mediated improvement of soil water retention capacity based on soil texture: A meta-analysis. Geoderma 2023, 437, 116591. [Google Scholar] [CrossRef]
- Qian, Z.Z.; Tang, L.Z.; Zhuang, S.Y.; Zou, Y.; Fu, D.L.; Chen, X. Effects of biochar amendments on soil water retention characteristics of red soil at south China. Biochar 2020, 2, 479–488. [Google Scholar] [CrossRef]
- Razzaghi, F.; Obour, P.B.; Arthur, E. Does biochar improve soil water retention? A systematic review and meta-analysis. Geoderma 2020, 361, 114055. [Google Scholar] [CrossRef]
- Zhang, L.; Yao, Z.L.; Zhao, L.X.; Yu, F.Y.; Li, Z.H.; Yi, W.M.; Fu, P.; Jia, J.X.; Zhao, Y.N. Effects of various pyrolysis temperatures on the physicochemical characteristics of crop straw-derived biochars and their application in tar reforming. Catal. Today 2024, 114663. [Google Scholar] [CrossRef]
- Masebinu, S.O.; Akinlabi, E.T.; Muzenda, E.; Aboyade, A.O. A review of biochar properties and their roles in mitigating challenges with anaerobic digestion. Renew. Sustain. Energy Rev. 2019, 103, 291–307. [Google Scholar] [CrossRef]
- Huang, H.; Reddy, N.G.; Huang, X.; Chen, P.; Wang, P.; Zhang, Y.; Huang, Y.; Lin, P.; Garg, A. Effects of pyrolysis temperature, feedstock type and compaction on water retention of biochar amended soil. Sci. Rep. 2021, 11, 7419. [Google Scholar] [CrossRef] [PubMed]
- Kameyama, K.; Miyamoto, T.; Iwata, Y. The preliminary study of water-retention related properties of biochar produced from various feedstock at different pyrolysis temperatures. Materials 2019, 12, 1732. [Google Scholar] [CrossRef] [PubMed]
- Bai, X.; Hu, X.J.; Liu, J.J.; Yu, Z.H.; Jin, J.; Liu, X.B.; Wang, G.H. Canonical ammonia oxidizers and comammox Clade A play active roles in nitrification in a black soil at different pH and ammonium concentrations. Biol. Fertil. Soils 2024, 60, 471–481. [Google Scholar] [CrossRef]
- Wang, Y.S.; Liu, Y.S.; Liu, R.L.; Zhang, A.P.; Yang, S.Q.; Liu, H.Y.; Zhou, Y.; Yang, Z.L. Biochar amendment reduces paddy soil nitrogen leaching but increases net global warming potential in Ningxia irrigation, China. Sci. Rep. 2017, 7, 1592. [Google Scholar] [CrossRef] [PubMed]
- Jiang, Y.B.; Kang, Y.; Han, C.; Zhu, T.B.; Deng, H.; Xie, Z.B.; Zhong, W.H. Biochar amendment in reductive soil disinfestation process improved remediation effect and reduced N2O emission in a nitrate-riched degraded soil. Arch. Agron. Soil Sci. 2020, 66, 983–991. [Google Scholar] [CrossRef]
- Sun, H.J.; Lu, H.Y.; Chu, L.; Shao, H.B.; Shi, W.M. Biochar applied with appropriate rates can reduce N leaching, keep N retention and not increase NH3 volatilization in a coastal saline soil. Sci. Total Environ. 2017, 575, 820–825. [Google Scholar] [CrossRef] [PubMed]
- Rubin, R.L.; Anderson, T.R.; Ballantine, K.A. Biochar simultaneously reduces nutrient leaching and greenhouse gas emissions in restored wetland soils. Wetlands 2020, 40, 1981–1991. [Google Scholar] [CrossRef]
- Nair, D.; Abalos, D.; Philippot, L.; Bru, D.; Mateo-Marín, N.; Petersen, S.O. Soil and temperature effects on nitrification and denitrification modified N2O mitigation by 3, 4-dimethylpyrazole phosphate. Soil Biol. Biochem. 2021, 157, 108224. [Google Scholar] [CrossRef]
- Wu, B.; Liu, F.F.; Weiser, M.D.; Ning, D.L.; Okie, J.G.; Shen, L.N.; Chai, B.L.; Deng, Y.; Feng, K.; Wu, L.Y.; et al. Temperature determines the diversity and structure of N2O-reducing microbial assemblages. Funct. Ecol. 2018, 32, 1867–1878. [Google Scholar] [CrossRef]
- Stres, B.; Danev, I.T.; Pal, L.; Fuka, M.M.; Resman, L.; Leskovec, S. Influence of temperature and soil water content on bacterial, archaeal and denitrifying microbial communities in drained fen grassland soil microcosms. FEMS Microbiol. Ecol. 2008, 66, 110–122. [Google Scholar] [CrossRef] [PubMed]
- Ligi, T.; Truu, M.; Truu, J.; Nõlvak, H.; Kaasik, A.; Mitsch, W.J.; Mander, Ü. Effects of soil chemical characteristics and water regime on denitrification genes (nirS, nirK, and nosZ) abundances in a created riverine wetland complex. Ecol. Eng. 2014, 72, 47–55. [Google Scholar] [CrossRef]
- Liu, X.R.; Shi, Y.L.; Zhang, Q.W.; Li, G.C. Effects of biochar on nitrification and denitrification-mediated N2O emissions and the associated microbial community in an agricultural soil. Environ. Sci. Pollut. Res. 2021, 28, 6649–6663. [Google Scholar] [CrossRef] [PubMed]
- Dong, W.X.; Walkiewicz, A.; Bieganowski, A.; Oenema, O.; Nosalewicz, M.; He, C.H.; Zhang, Y.M.; Hu, C.S. Biochar promotes the reduction of N2O to N2 and concurrently suppresses the production of N2O in calcareous soil. Geoderma 2020, 362, 114091. [Google Scholar] [CrossRef]
- Zhang, Q.Q.; Zhang, X.; Duan, P.P.; Jiang, X.Y.; Shen, H.J.; Yan, X.Y.; Xiong, Z.Q. The effect of long-term biochar amendment on N2O emissions: Experiments with N15-O18 isotopes combined with specific inhibition approaches. Sci. Total Environ. 2021, 769, 144533. [Google Scholar] [CrossRef] [PubMed]
- Fudjoe, S.K.; Li, L.L.; Anwar, S.; Shi, S.L.; Xie, J.H.; Wang, L.L.; Xie, L.H.; Zhou, Y.J. Nitrogen fertilization promoted microbial growth and N2O emissions by increasing the abundance of nirS and nosZ denitrifiers in semiarid maize field. Front. Microbiol. 2023, 14, 1265562. [Google Scholar] [CrossRef] [PubMed]
- Zhou, S.X.; Li, Y.; Jia, P.Y.; Wang, X.; Kong, F.L.; Jiang, Z.X. The co-addition of biochar and manganese ore promotes nitrous oxide reduction but favors methane emission in sewage sludge composting. J. Clean. Prod. 2022, 339, 130759. [Google Scholar] [CrossRef]
- Zhou, R.; Chen, Z.; EI-Naggar, A.; Tian, L.L.; Huang, C.P.; Zhang, Z.; Palansooriya, K.N.; Li, Y.F.; Yu, B.; Chang, S.X.; et al. Contrasting effects of rice husk and its biochar on N2O emissions and nitrogen leaching from Lei bamboo soils under subtropical conditions. Biol. Fertil. Soils 2023, 59, 803–817. [Google Scholar] [CrossRef]
- Teutscherova, N.; Houska, J.; Navas, M.; Masaguer, A.; Benito, M.; Vazquez, E. Leaching of ammonium and nitrate from acrisol and calcisol amended with holm oak biochar: A column study. Geoderma 2018, 323, 136–145. [Google Scholar] [CrossRef]
- Ma, H.Z.; Jia, X.J.; Yang, J.Y.; Liu, J.; Shangguan, Z.P.; Yan, W.M. Inhibitors mitigate N2O emissions more effectively than biochar: A global perspective. Sci. Total Environ. 2023, 859, 160416. [Google Scholar] [CrossRef] [PubMed]
- Kotuš, T.; Šimanský, V.; Drgoňová, K.; Illéš, M.; Wójcik-Gront, E.; Balashov, E.; Buchkina, N.; Aydın, E.; Horák, J. Combination of Biochar with N–Fertilizer Affects Properties of Soil and N2O emissions in Maize Crop. Agronomy 2022, 12, 1314. [Google Scholar] [CrossRef]
- Tan, G.; Wang, H.; Xu, N.; Liu, H.; Zhai, L. Biochar amendment with fertilizers increases peanut N uptake, alleviates soil N2O emissions without affecting NH3 volatilization in field experiments. Environ. Sci. Pollut. Res. 2018, 25, 1–10. [Google Scholar] [CrossRef] [PubMed]
- Cheng, H.G.; Xing, D.; Twagirayezu, G.; Lin, S.; Gu, S.Y.; Tu, C.L.; Hill, P.W.; Chadwick, D.R.; Jones, D.L. Effects of field-aging on the impact of biochar on herbicide fate and microbial community structure in the soil environment. Chemosphere 2024, 348, 140682. [Google Scholar] [CrossRef] [PubMed]
- Michel, K.; Tatzber, M.; Kitzler, B. Increased N2 emissions from an arable soil four years after biochar application. J. Plant Nutr. Soil Sci. 2022, 185, 202–208. [Google Scholar] [CrossRef]
- Zhang, X.; Zhang, J.Q.; Song, M.X.; Dong, Y.B.; Xiong, Z.Q. N2O and NO production and functional microbes responding to biochar aging process in an intensified vegetable soil. Environ. Pollut. 2022, 307, 119491. [Google Scholar] [CrossRef] [PubMed]
- Min, H.; Long, F.; Chen, J.N.; Jiang, L.G.; Zou, Y.B. Continuous applications of biochar to rice: Effects on nitrogen uptake and utilization. Sci. Rep. 2018, 8, 11461. [Google Scholar]
- Duan, W.; Oleszczuk, P.; Pan, B.; Xing, B.S. Environmental behavior of engineered biochars and their aging processes in soil. Biochar 2019, 1, 339–351. [Google Scholar] [CrossRef]
- Shi, Y.L.; Liu, X.R.; Zhang, Q.W.; Li, Y. Contrasting effects of biochar-and organic fertilizer-amendment on community compositions of nitrifiers and denitrifiers in a wheat-maize rotation system. Appl. Soil Ecol. 2022, 171, 104320. [Google Scholar] [CrossRef]
- González-Cencerrado, A.; Ranz, J.P.; Jiménez, M.T.L.F.; Rebolledo, G.B. Assessing the environmental benefit of a new fertilizer based on activated biochar applied to cereal crops. Sci. Total Environ. 2020, 711, 134668. [Google Scholar] [CrossRef] [PubMed]
- Yu, W.J.; Yue, Y.J.; Wang, F.X. The spatial-temporal coupling pattern of grain yield and fertilization in the North China plain. Agric. Syst. 2022, 196, 103330. [Google Scholar] [CrossRef]
- Guo, C.; Liu, X.F.; He, X.F. A global meta-analysis of crop yield and agricultural greenhouse gas emissions under nitrogen fertilizer application. Sci. Total Environ. 2022, 831, 154982. [Google Scholar] [CrossRef]

Disclaimer/Publisher’s Note: The statements, opinions and data contained in all publications are solely those of the individual author(s) and contributor(s) and not of MDPI and/or the editor(s). MDPI and/or the editor(s) disclaim responsibility for any injury to people or property resulting from any ideas, methods, instructions or products referred to in the content. |
© 2024 by the authors. Licensee MDPI, Basel, Switzerland. This article is an open access article distributed under the terms and conditions of the Creative Commons Attribution (CC BY) license (https://creativecommons.org/licenses/by/4.0/).