Article

Optimal Design of Truss Structures for Sustainable Carbon Emission Reduction in Korean Construction

1
School of Industrial Design & Architectural Engineering, Korea University of Technology & Education, 1600 Chungjeol-ro, Byeongcheon-myeon, Cheonan 31253, Republic of Korea
2
Faculty of Civil Engineering, Wroclaw University of Science and Technology, 27 Wybrzeze Stanislawa, Wyspianskiego St., 50-370 Wroclaw, Poland
*
Author to whom correspondence should be addressed.
Sustainability 2024, 16(14), 5830; https://doi.org/10.3390/su16145830 (registering DOI)
Submission received: 14 June 2024 / Revised: 2 July 2024 / Accepted: 6 July 2024 / Published: 9 July 2024

Abstract

:
Due to the recent abnormalities in global temperature and increasing carbon emissions, the world is working to reduce carbon emissions. In particular, the construction sector accounts for about 37% of all carbon emissions, so it is one of the areas where sustainable reduction efforts must be made. Therefore, in this paper, an optimal design process was performed by evaluating carbon emissions as the objective function, a choice which differed from the objective function of the existing research used in the optimal design of truss structures. The metaheuristics algorithm used for the process was the advanced crow search algorithm. The levels of carbon emissions generated when the material of a truss structure consisted of a customary material (steel) were compared to scenarios in which timber was used, and a construction scenario centered on the Republic of Korea was established for comparison. The structures used as examples were 10-, 17-, 22-, and 120-bar truss structures. As a result, it was confirmed that truss structures using timber had fewer carbon emissions than structures using steel. In addition, it was confirmed that, even in the same timber structures, domestic timber had fewer carbon emissions than imported timber. These results confirmed that in order to achieve carbon neutrality in the construction field, carbon emissions must be considered in advance, in the design stage.

1. Introduction

The world has the advantage of enjoying a convenient life due to the development of many technologies subsequent to the era of industrialization, but this also has the consequence of causing climate change abnormalities due to the steady increase in carbon emissions. According to an IPCC report, greenhouse gas emissions began to increase rapidly in the mid-1950s, and during a similar period, global temperatures also increased [1]. In response, the international community recognized the seriousness of climate change and called for 196 parties to make efforts to limit temperature increases to 1.5 °C above pre-industrial levels at the COP21 (UN climate change conference) on 12 December 2015 [2,3].
As described in Figure 1, construction-related industries account for 36% of global energy consumption and 37% of carbon emissions [4]. This means that carbon emissions from the construction industry are significantly higher than those from other industries. Therefore, in efforts to cope with climate change, the construction industry is one of the key industries which can curb the rise in global temperature. In the construction industry, efforts are being made to reduce the energy generated during the operation of buildings, such as with zero-energy buildings and passive houses [5,6,7]. However, the importance of evaluating carbon emissions over the entire life-cycles of buildings, including the carbon generated from material production, transportation, construction, and reuse, has grown [8,9]. In particular, measures to reduce carbon emissions generated during the development and production of new materials that can replace cement and steel, which are widely used as construction materials, are insufficient [10]. However, demand for construction cement and steel is expected to continue to increase until 2030 [11]. Therefore, according to a technical report published by UNEP and Yale CEA, traditional construction materials such as concrete and iron are recommended for use only when necessary, as a significant pathway to decarbonization, and the use of renewable low-carbon bio-based construction materials is urged [10]. To solve this problem, the global construction market is using something other than conventional concrete and steel frames as a construction material; instead, eco-friendly timber with low embodied energy is emerging as an alternative.
Since timber is lightweight, it can reduce the burden of the load and has the advantages of excellent fire resistance and earthquake resistance [12,13]. Starting with advanced timber construction technology in countries such as Canada, Japan, and the United States, the technology is moving from low-rise buildings to large high-rise buildings [14]. This change was made possible by the development of engineered timber, such as CLT (cross-laminated timber), GLT (glue-laminated timber), and LVL (laminated veneer lumber), which have performance indices similar to materials used in existing steel and concrete structures [15,16]. In addition, since timber can store carbon dioxide that was absorbed before logging, it is considered an essential material for efforts to reduce carbon emissions in the construction industry.
The Republic of Korea, the target of the construction scenarios in this paper, is representative of countries that have achieved rapid economic growth with rapid industrialization. Since its growth has mainly occurred in the construction and manufacturing industries, carbon emissions have inevitably increased. Table 1 presents the emissions by country in 2022 [17], according to CO2 emissions and territorial size, and the numbers in parentheses indicate rankings. The Republic of Korea had the ninth-highest level of carbon emissions in the world, emitting 597 million tons of CO2. However, in proportion to its territory, it was the country with the highest level of carbon emissions. In other words, as a country that emits a significant amount of CO2 compared to its territory, the Republic of Korea is a country that must make great efforts to assist in the reduction of carbon emissions around the world and the stabilization of abnormal climates. However, the Republic of Korea needs more relevant awareness and design and construction technology related to timber structures which can reduce carbon in the construction field, and the market for timber structures is very small.
The optimal design process of a truss structure mainly uses metaheuristic algorithms, and the weight of a truss structure is an objective function. In addition, research is being conducted continuously to reduce construction costs by finding the minimal cross-sectional area or the optimal topology of a truss element [18,19,20,21]. Steel is the material mainly used in the fabrication of truss structures. The previous study of timber structures evaluates and compares carbon emissions by changing the nature of a material in an existing structure rather than evaluating carbon emissions in the optimal design stage [22,23,24,25]. However, the schematic-design stage of a building is an essential time for calculating carbon emissions, a process which is necessary to utilize in order to reduce such emissions quickly [26].
Therefore, in this paper, the carbon emissions of a truss structure were the objective function of optimal design, a process which was performed based on a construction scenario centered in the Republic of Korea. In addition, the carbon emissions of timber truss structures using domestic or imported timber and a truss structure using steel were compared. For the optimal design, the ACSA (advanced crow search algorithm) proposed by Lee et al. was selected from among the among metaheuristics algorithms [27]. This was performed using MATLAB R2023a. Section 2 describes the carbon emission evaluation method, and Section 3 describes the ACSA used to perform the optimal design. Section 4 analyzes the problem definition and the results, and Section 5 presents the conclusions of this paper.

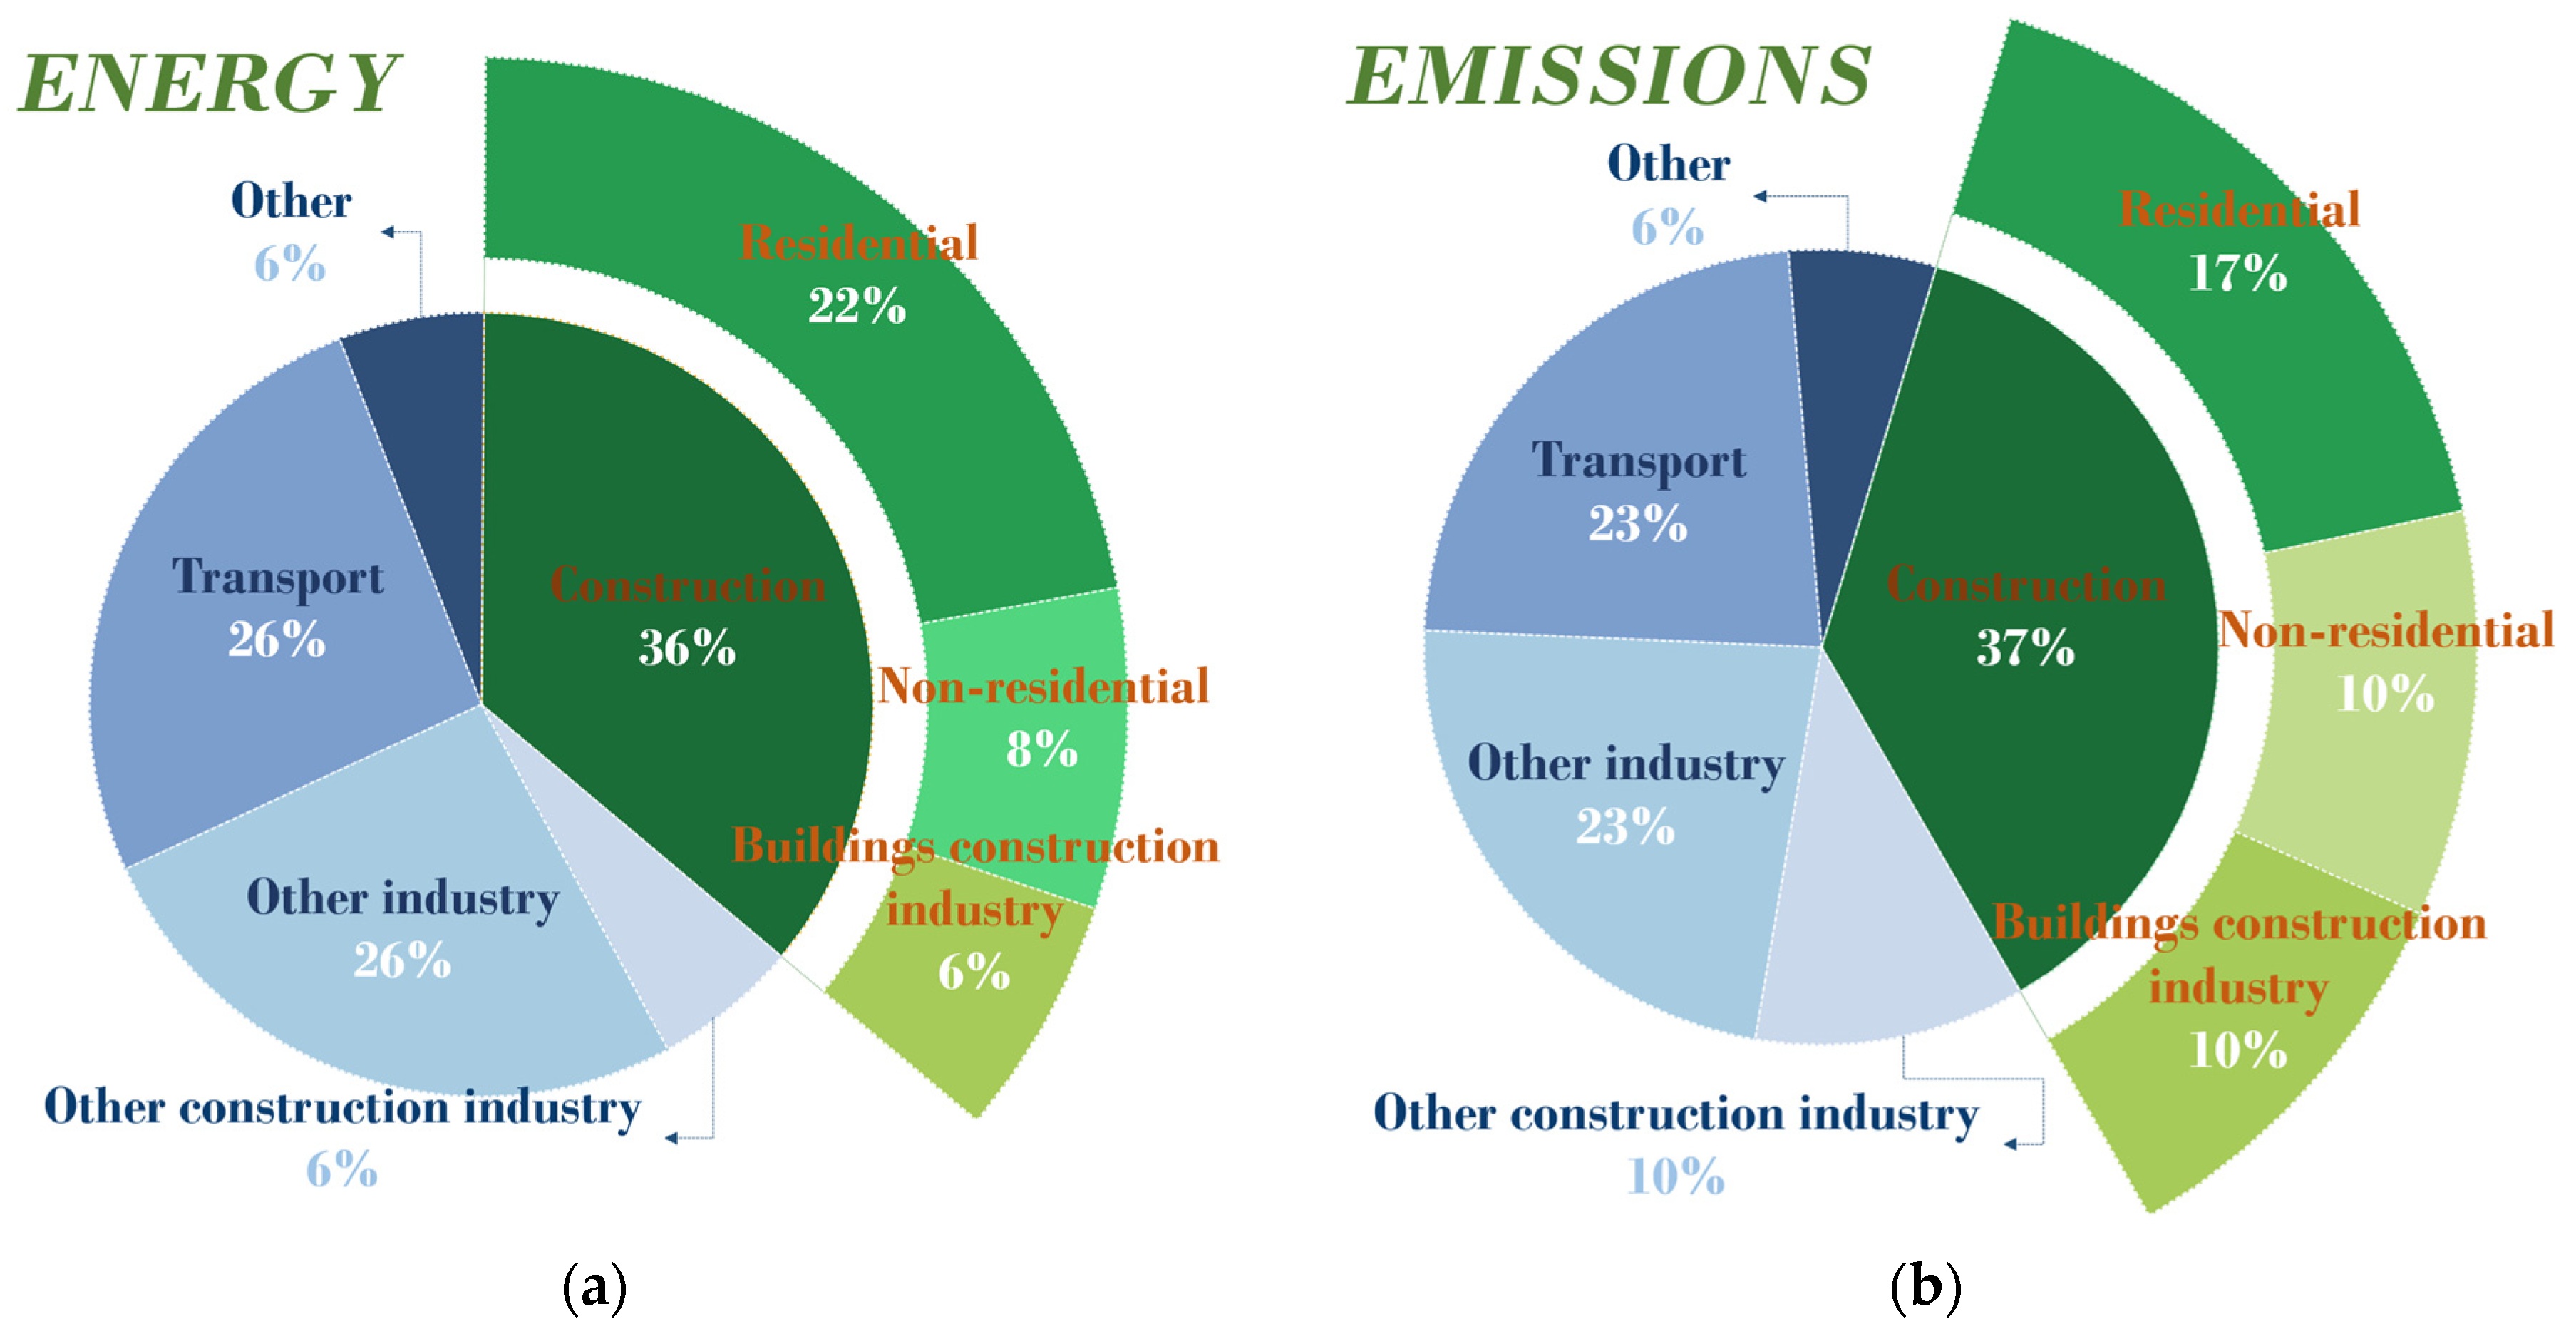
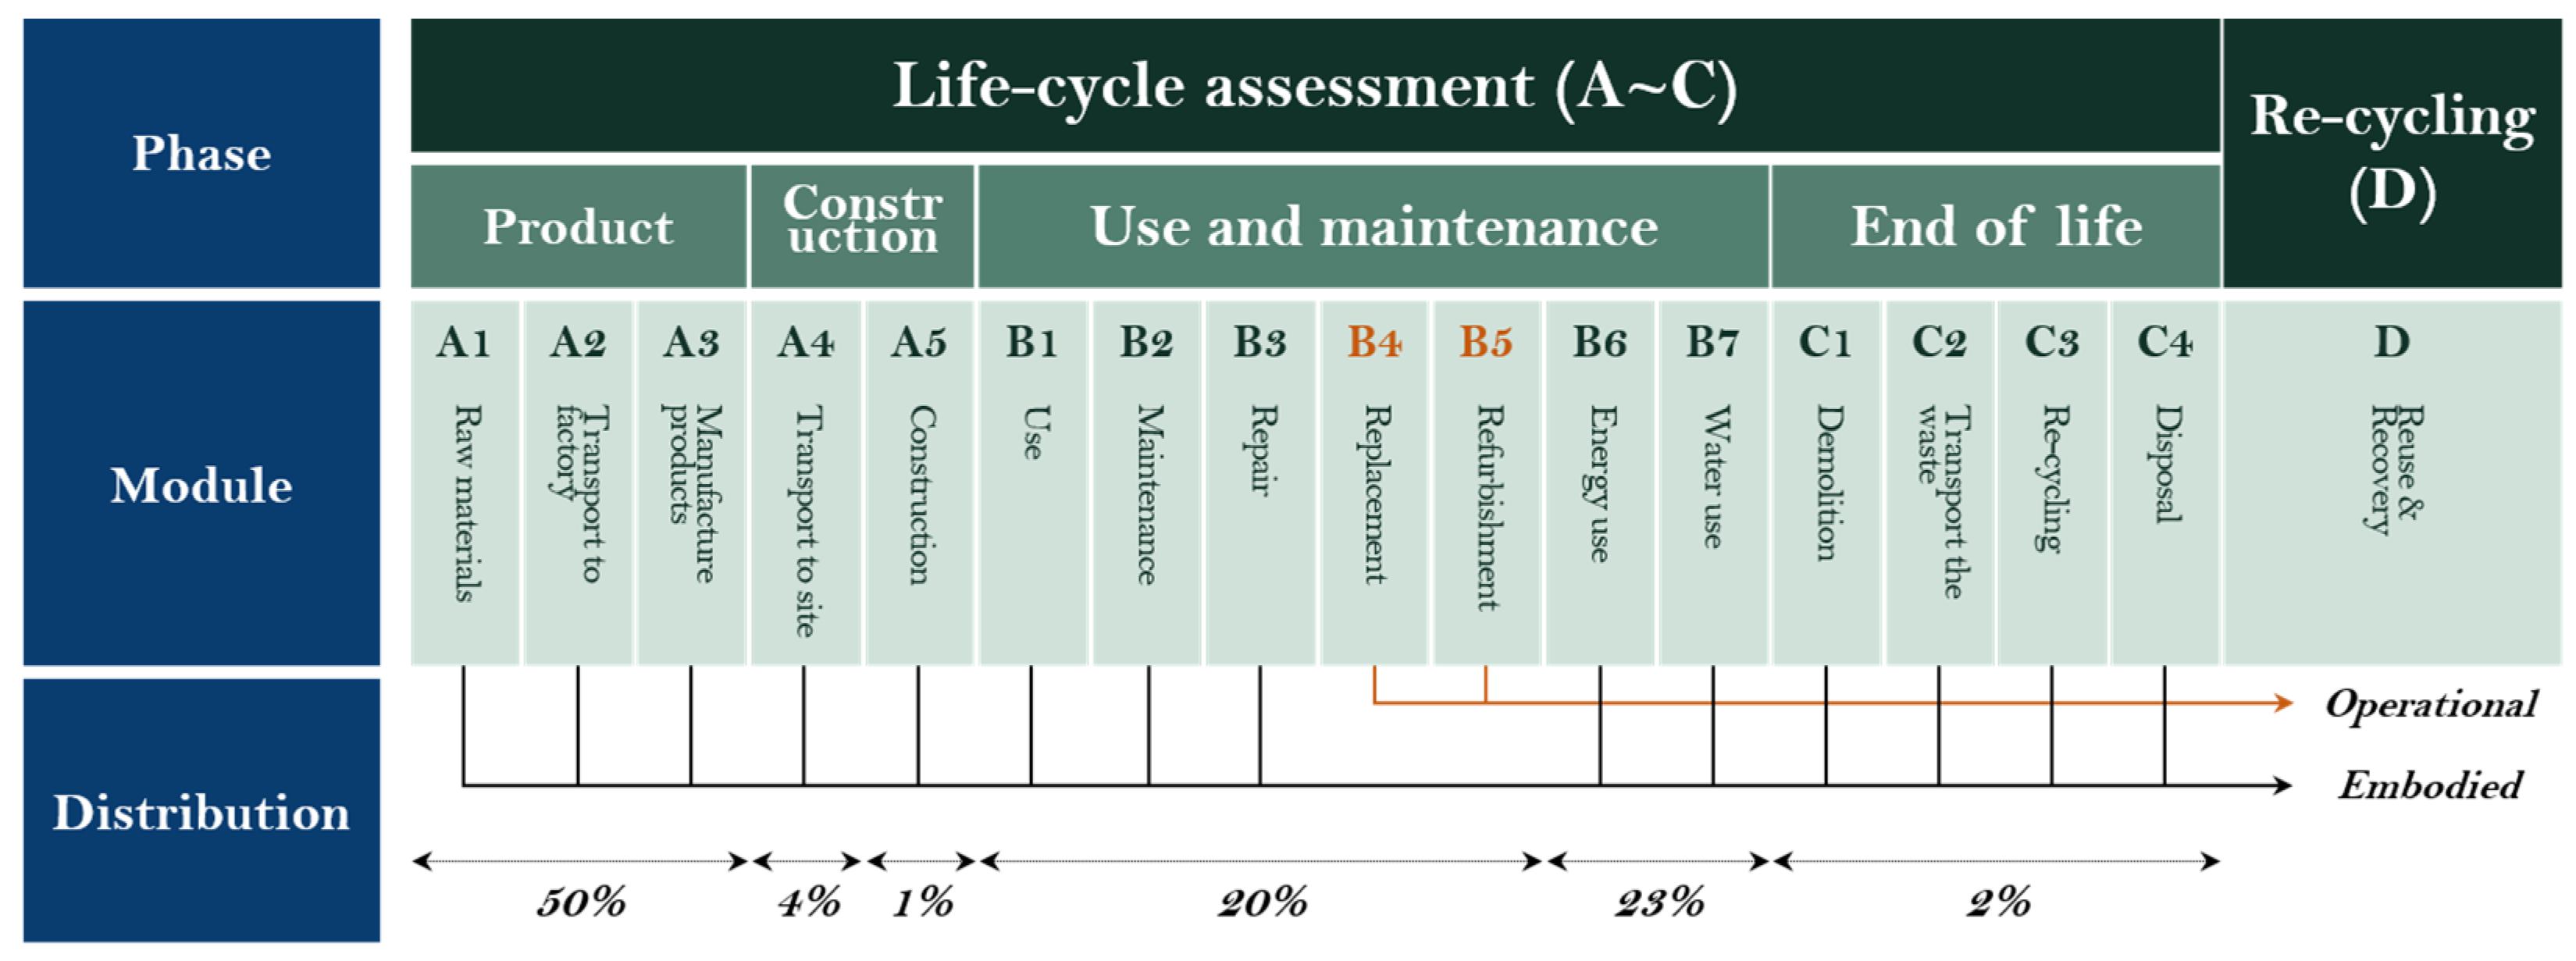
2. Embodied-Carbon Emissions

Figure 2 presents the environmental impact of a building’s life cycle (A–C), which is divided into product, construction, use and maintenance, and end-of-life stages [28]. Modules B4 and B5 generate carbon during the operation of a building, while all other modules represent embodied carbon. Although many studies have tried to reduce the carbon emissions generated when using buildings [29,30,31], the need to evaluate all relevant carbon emissions, including those generated during the material production, construction, and disposal processes, is constantly being raised [32,33]. In particular, it is essential to calculate carbon emissions in advance, in the schematic-design stage (A1–A3), because the carbon emissions generated in the material production stage account for the most significant portion, at about 50%. In this paper, only steps A1–A4 are considered, due to the difficulty of determining the construction costs, waste-related treatment methods, and operating carbon, which depend on the method of use.
E C n e t (carbon emissions), considering steps A1–A4 in a building’s life cycle, can be calculated using Equation (1). Here, E C A 1 A 3 refers to the carbon emissions generated in steps A1–A3, while E C A 4 refers to the carbon emissions generated in step A4.
E C n e t = E C A 1 A 3 + E C A 4
The E C A 1 A 3 and E C A 4 included in the E C n e t formula may be calculated using Equations (2) and (3). Here, n denotes the number of elements, W i denotes the weight (kg) of the i-element, L m a t , i denotes the moving distance of the i-element material, and L e l e , i denotes the moving distance of the i-element. Furthermore, E C C i denotes the embedded carbon coefficient of the i-element material, and T C i denotes the transport coefficient of the i-element. The E C C i of E C A 1 A 2 has a positive or negative value. If E C C i has a negative value, the objective function becomes negative, making it challenging to find the minimum value. Therefore, the optimal design uses a positive value, and the final E C n e t is calculated by multiplying the result by −1. Finally, the loss in manufacturing engineered timber using materials (wood) is considered.
E C A 1 3 = E C A 1 A 2 + E C A 3   = i = 1 n W i × E C C i × L o s s   + i = 1 n W i × L m a t , i × T C i × L o s s
E C A 4 = i = 1 n W i × L e l e ,   i × T C i
E C C i is determined using Table 2 [34]. In general, 1.37 kgCO2e is discharged per kg of steel, which is widely used as a structural material, and 0.159 kgCO2e is discharged per kg of concrete. Wood varies depending on the type, but has excellent flexural strength. GLT, which is widely used as a bending member, emits 0.512 kgCO2e per kg. However, considering carbon storage, a value of −0.896 kgCO2e/kg can be used.
T C i is determined using Table 3 [35]. The value of T C i varies depending on transportation method, whether road, rail, or ocean, and it has the most significant value, at 10.7 kgCO2e/t per 100 km, when using road transportation. Since T C i calculates carbon emissions by multiplying them by the moving distance, even when buildings are constructed using the same material, differences in carbon emissions may be significant depending on the moving distances of materials or elements.

3. Advanced Crow Search Algorithm

The CSA (crow search algorithm) was proposed by Askarzadeh, A. in 2016 [36], and Lee, D. et al. proposed the ACSA (advanced crow search algorithm) in 2023, which supplemented the convergence performance and shortcomings of the CSA [27]. Lee, D. et al. confirmed that the exploitation and exploration performance was improved using 23 benchmark functions and five engineering problems.
Like the CSA, the ACSA consists of five steps, which are performed as follows:
Step 1: Define the problem and set the parameters.
Step 1 defines an optimization problem and the parameters required to perform the optimization. The defined parameters are D (dimension of problem), N (flock size), t m a x (maximum generation), fl (flight length), A P m a x (maximum awareness probability), A P m i n (minimum awareness probability), FAR (flight awareness ratio), lb (lower boundary), and ub (upper boundary).
Step 2: Initialize the positions of the crows and evaluate.
A crow’s position is randomly adopted in the lb and ub ranges and initialized, as shown in Equation (4). Here, x means each crow’s position, which is stored as shown in Equation (5). In addition, the flock of each crow is evaluated using the initially set objective function.
C r o w s = x 1 1 x 1 D x N 1 x N D
C r o w s   m e m o r y = m 1 1 m 1 D m N 1 m N D
Step 3: Generate and evaluate the new positions for the crows.
The ACSA is classified as a method of generating crow positions according to the size of the dynamic AP, which is defined using Equation (6) and has smaller values as the number of generations increases. Here, t denotes the current number of generations. The reason for using a dynamic AP is to make the ACSA mainly use exploitation performance rather than exploration as the number of generations increases.
D y n a m i c   A P t = A P m i n + A P m a x A P m i n ln t + 1
If a random number from 0 to 1 is greater than or equal to the dynamic AP, the crow position is generated using Equation (7). Here, r is a random variable between 0 and 1, m j , t is a randomly adopted crow position, and g b j , t is the best crow position. That is, a crow follows a crow randomly adopted by the FAR or a crow in the best position. Conversely, if a random number is smaller than the dynamic AP, the crow position is generated using Equation (8). If r is 0.5 or more, it randomly moves to a new position in a smaller boundary according to the number of generations. If r is less than 0.5, it randomly moves to a new position within the boundary of the entirety. The location of the generated crow is reevaluated using the objective function.
x t + 1 = x t + r × f l × m j , t x t x t + r × f l × g b j , t x t             i f   r F A R e l s e
x t + 1 = 2 x t + l b + r × l b u b / t r a n d o m   p o s i t i o n             i f   r 0.5 e l s e
Step 4: Update the memory.
The evaluation of the initial crow position is remembered and compared to the evaluation of the crow position generated in step 3, and the better crow position is updated in the crow’s memory.
Step 5: Terminate the repetition.
If t is less than t m a x , steps 3–4 are repeated. The algorithm terminates if t is equal to t m a x . The terminated ACSA derives an optimization result.

4. Numerical Examples

4.1. Problem Definition

In this paper, the goal was to minimize the carbon emissions generated in steps A1–A4 during a building’s life cycle. The objective function was expressed using Equation (9), and the constraint could be expressed using Equation (10). If g 1 and g 2 were not met, a penalty of 10 4 was imposed.
To   minimize   E C n e t × f p e n a l t y             i f   s a t i s f i e d e l s e         f p e n a l t y = 10 4 f p e n a l t y = 1
Subject   to   g 1 x :   σ y T   o r   C σ i g 2 x :   δ m a x δ
First, 10-bar, 17-bar, and 22-bar truss structures and a 120-bar truss dome structure were selected as numerical examples. Table 4 shows the scenarios of the structures, which were assumed to have been built at KOREATECH in the Republic of Korea. In Table 4, L indicates the location and D indicates the moving distance.
  • In the case of using steel as the material for the structure, it was assumed that the Republic of Korea imports most of its iron scrap from Japan. Imported iron scrap was processed into Pohang’s structural steel and transported to KOREATECH.
  • In the case of using GLT (imported) as the material for the structure, it was assumed that it was imported by sea from Canada, which has the highest timber production in the world. Imported timber was brought into Incheon, processed into GLT at a sawmill, and transported to KOREATECH.
  • In the case of using GLT (domestic) as the material for the structure, it was assumed that logging was performed in Gangneung, where wood production is the highest in Korea. The wood was brought into Incheon, processed into GLT at a sawmill, and transported to KOREATECH.
  • The loss rate during the production of the construction materials was 10%.
All materials had their own ECC, and in the case of wood, the ECC differed depending on whether carbon storage was considered. Therefore, carbon emissions were compared and analyzed by classifying them into five cases, as shown in Table 5 and Figure 3. In cases 2–5, truss structures in the same state were used to compare carbon emissions according to whether the materials were imported or considered for carbon storage. The parameters of the ACSA used for the optimal design of the carbon emissions of the truss structures are shown in Table 6. Each analysis was repeated 10 times.

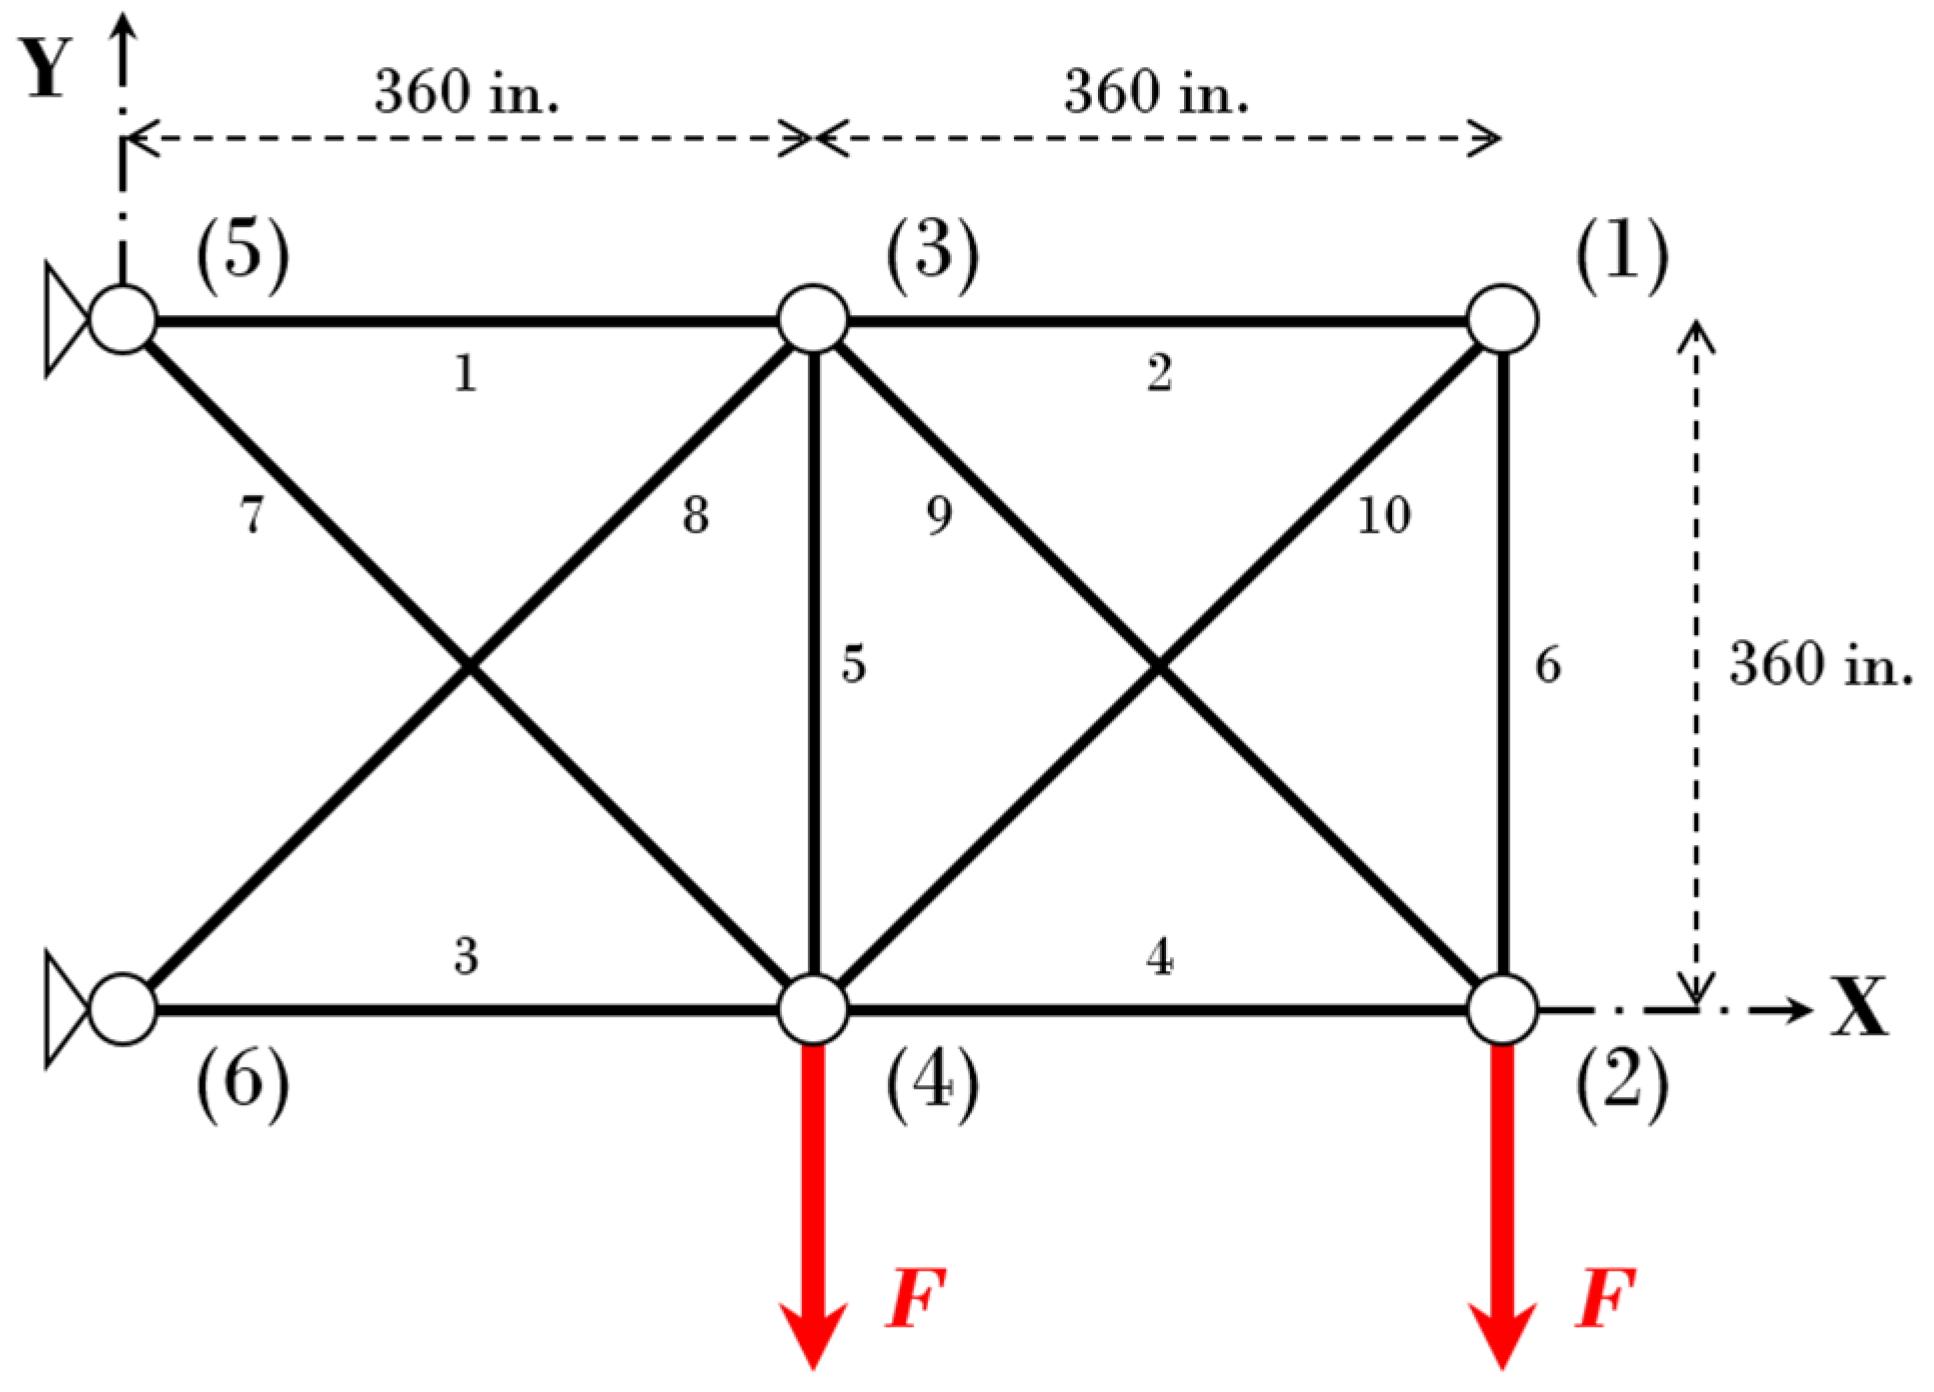
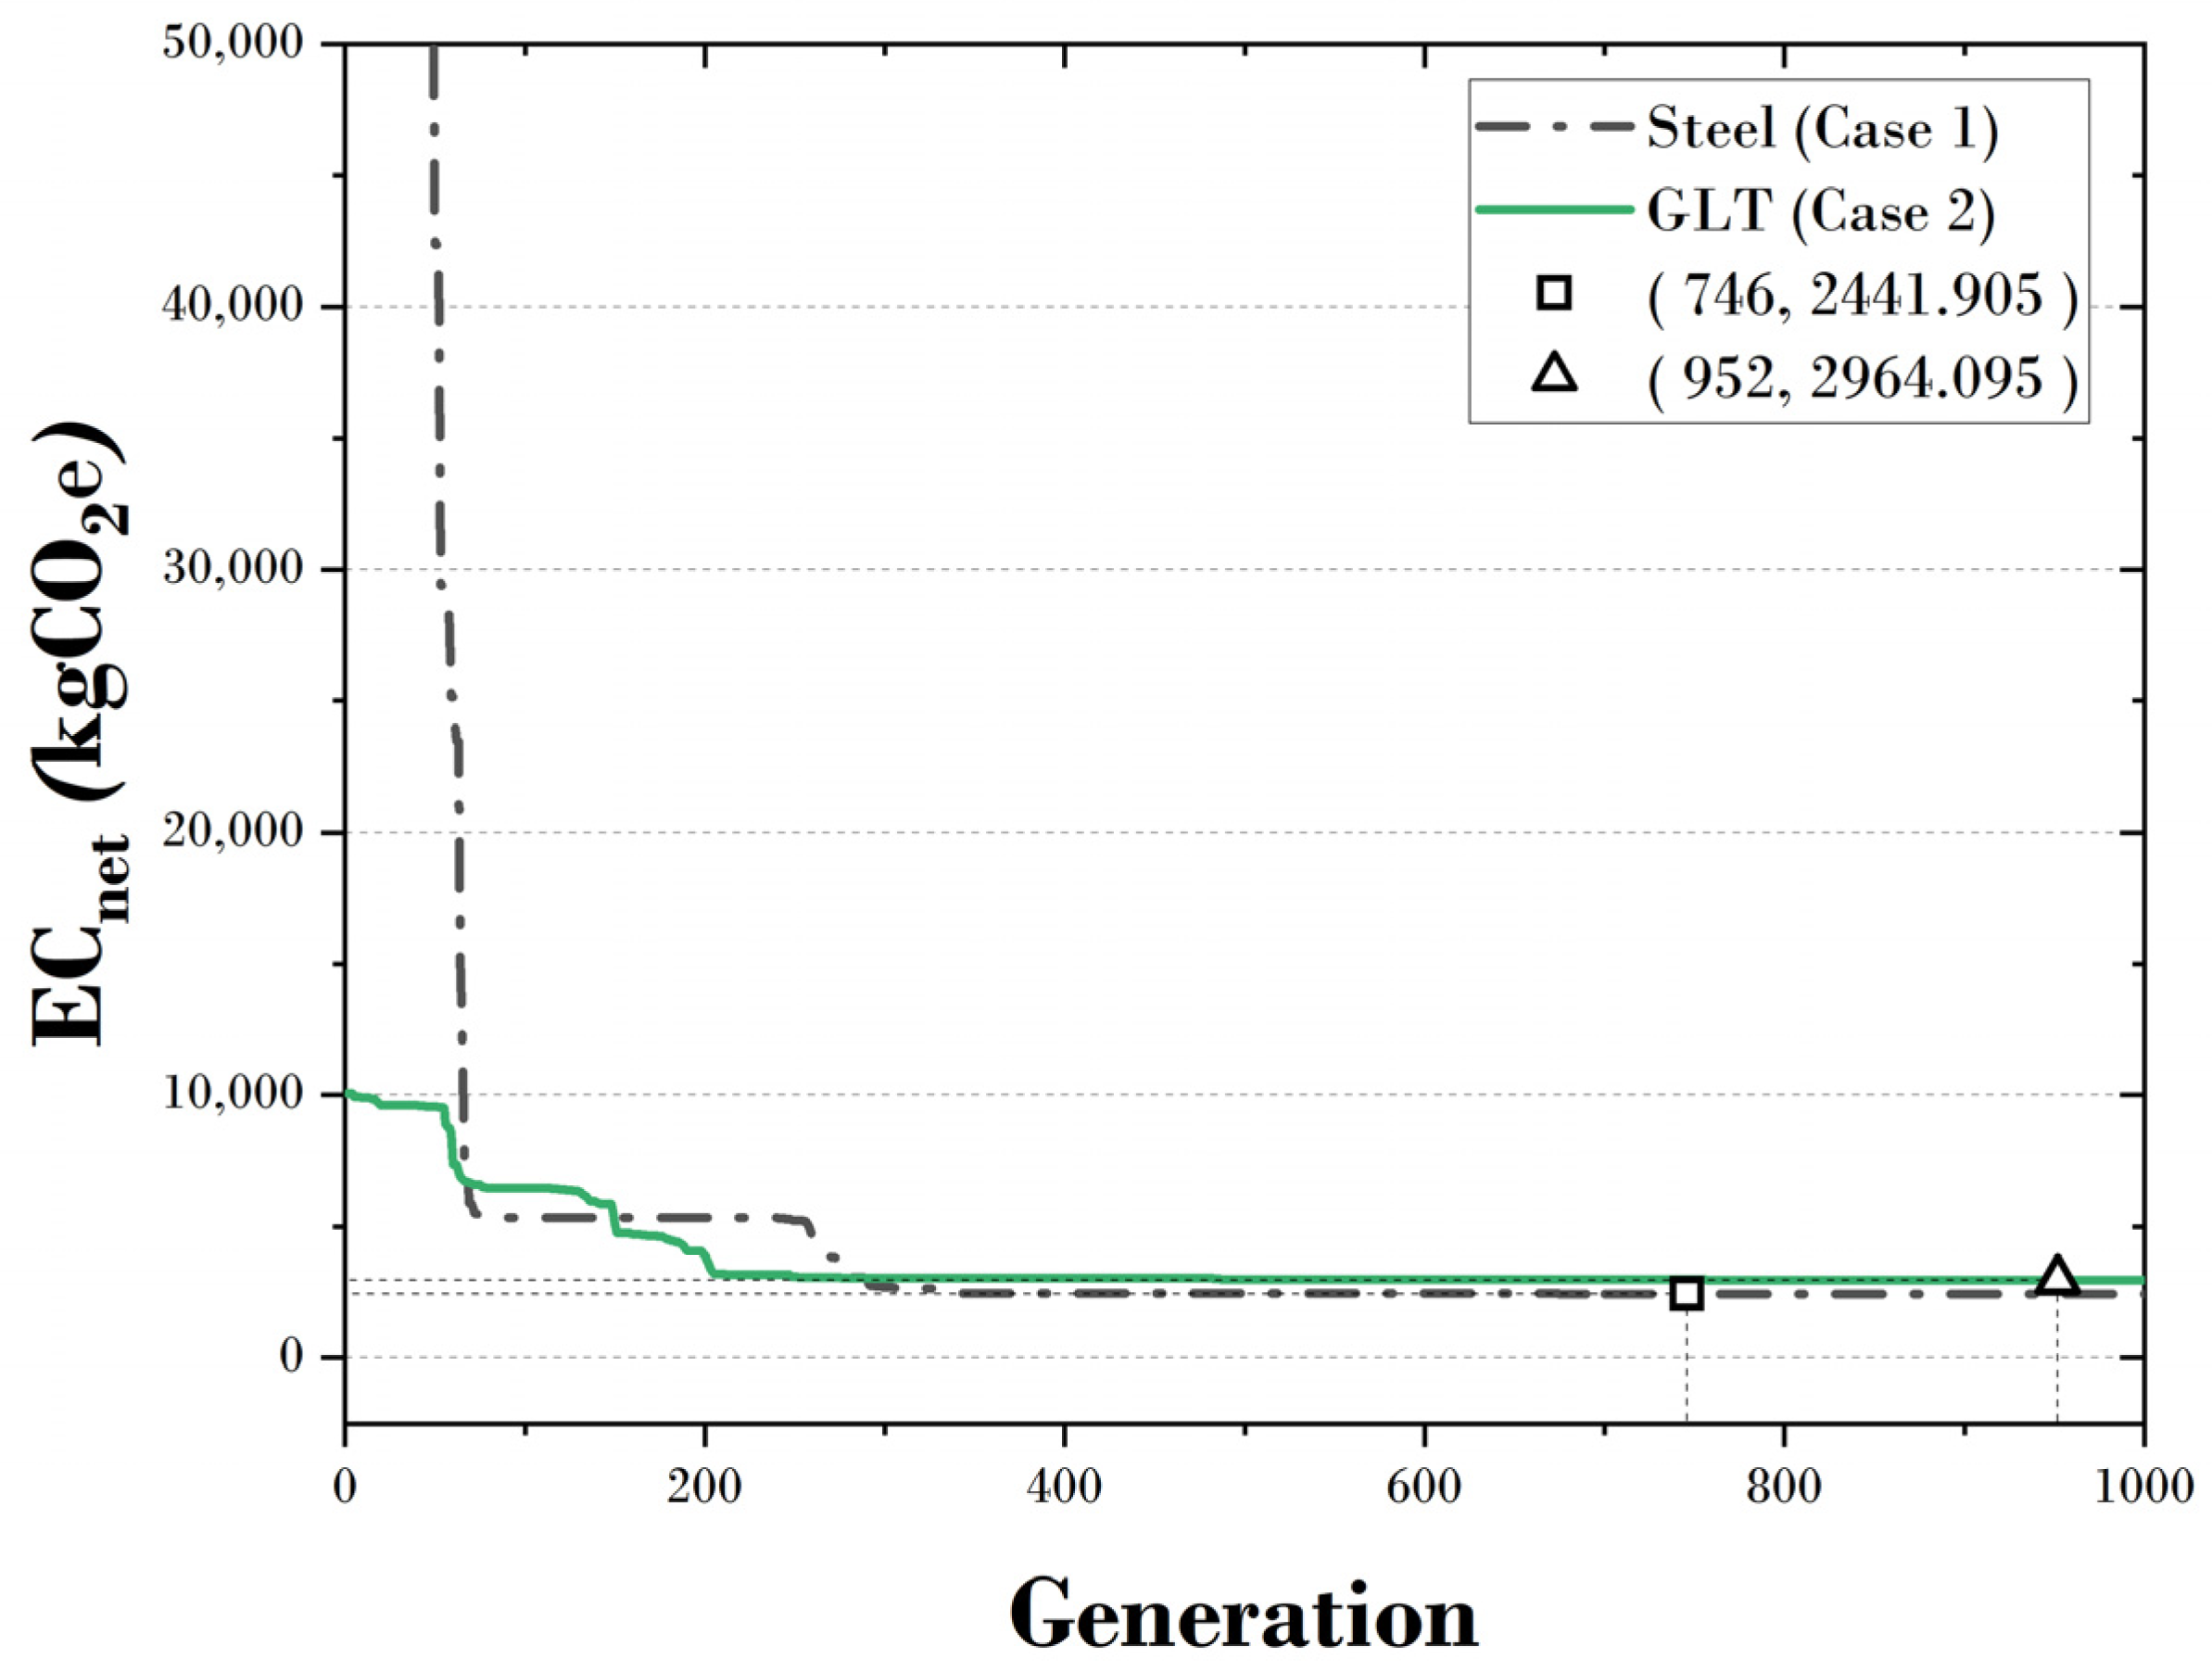
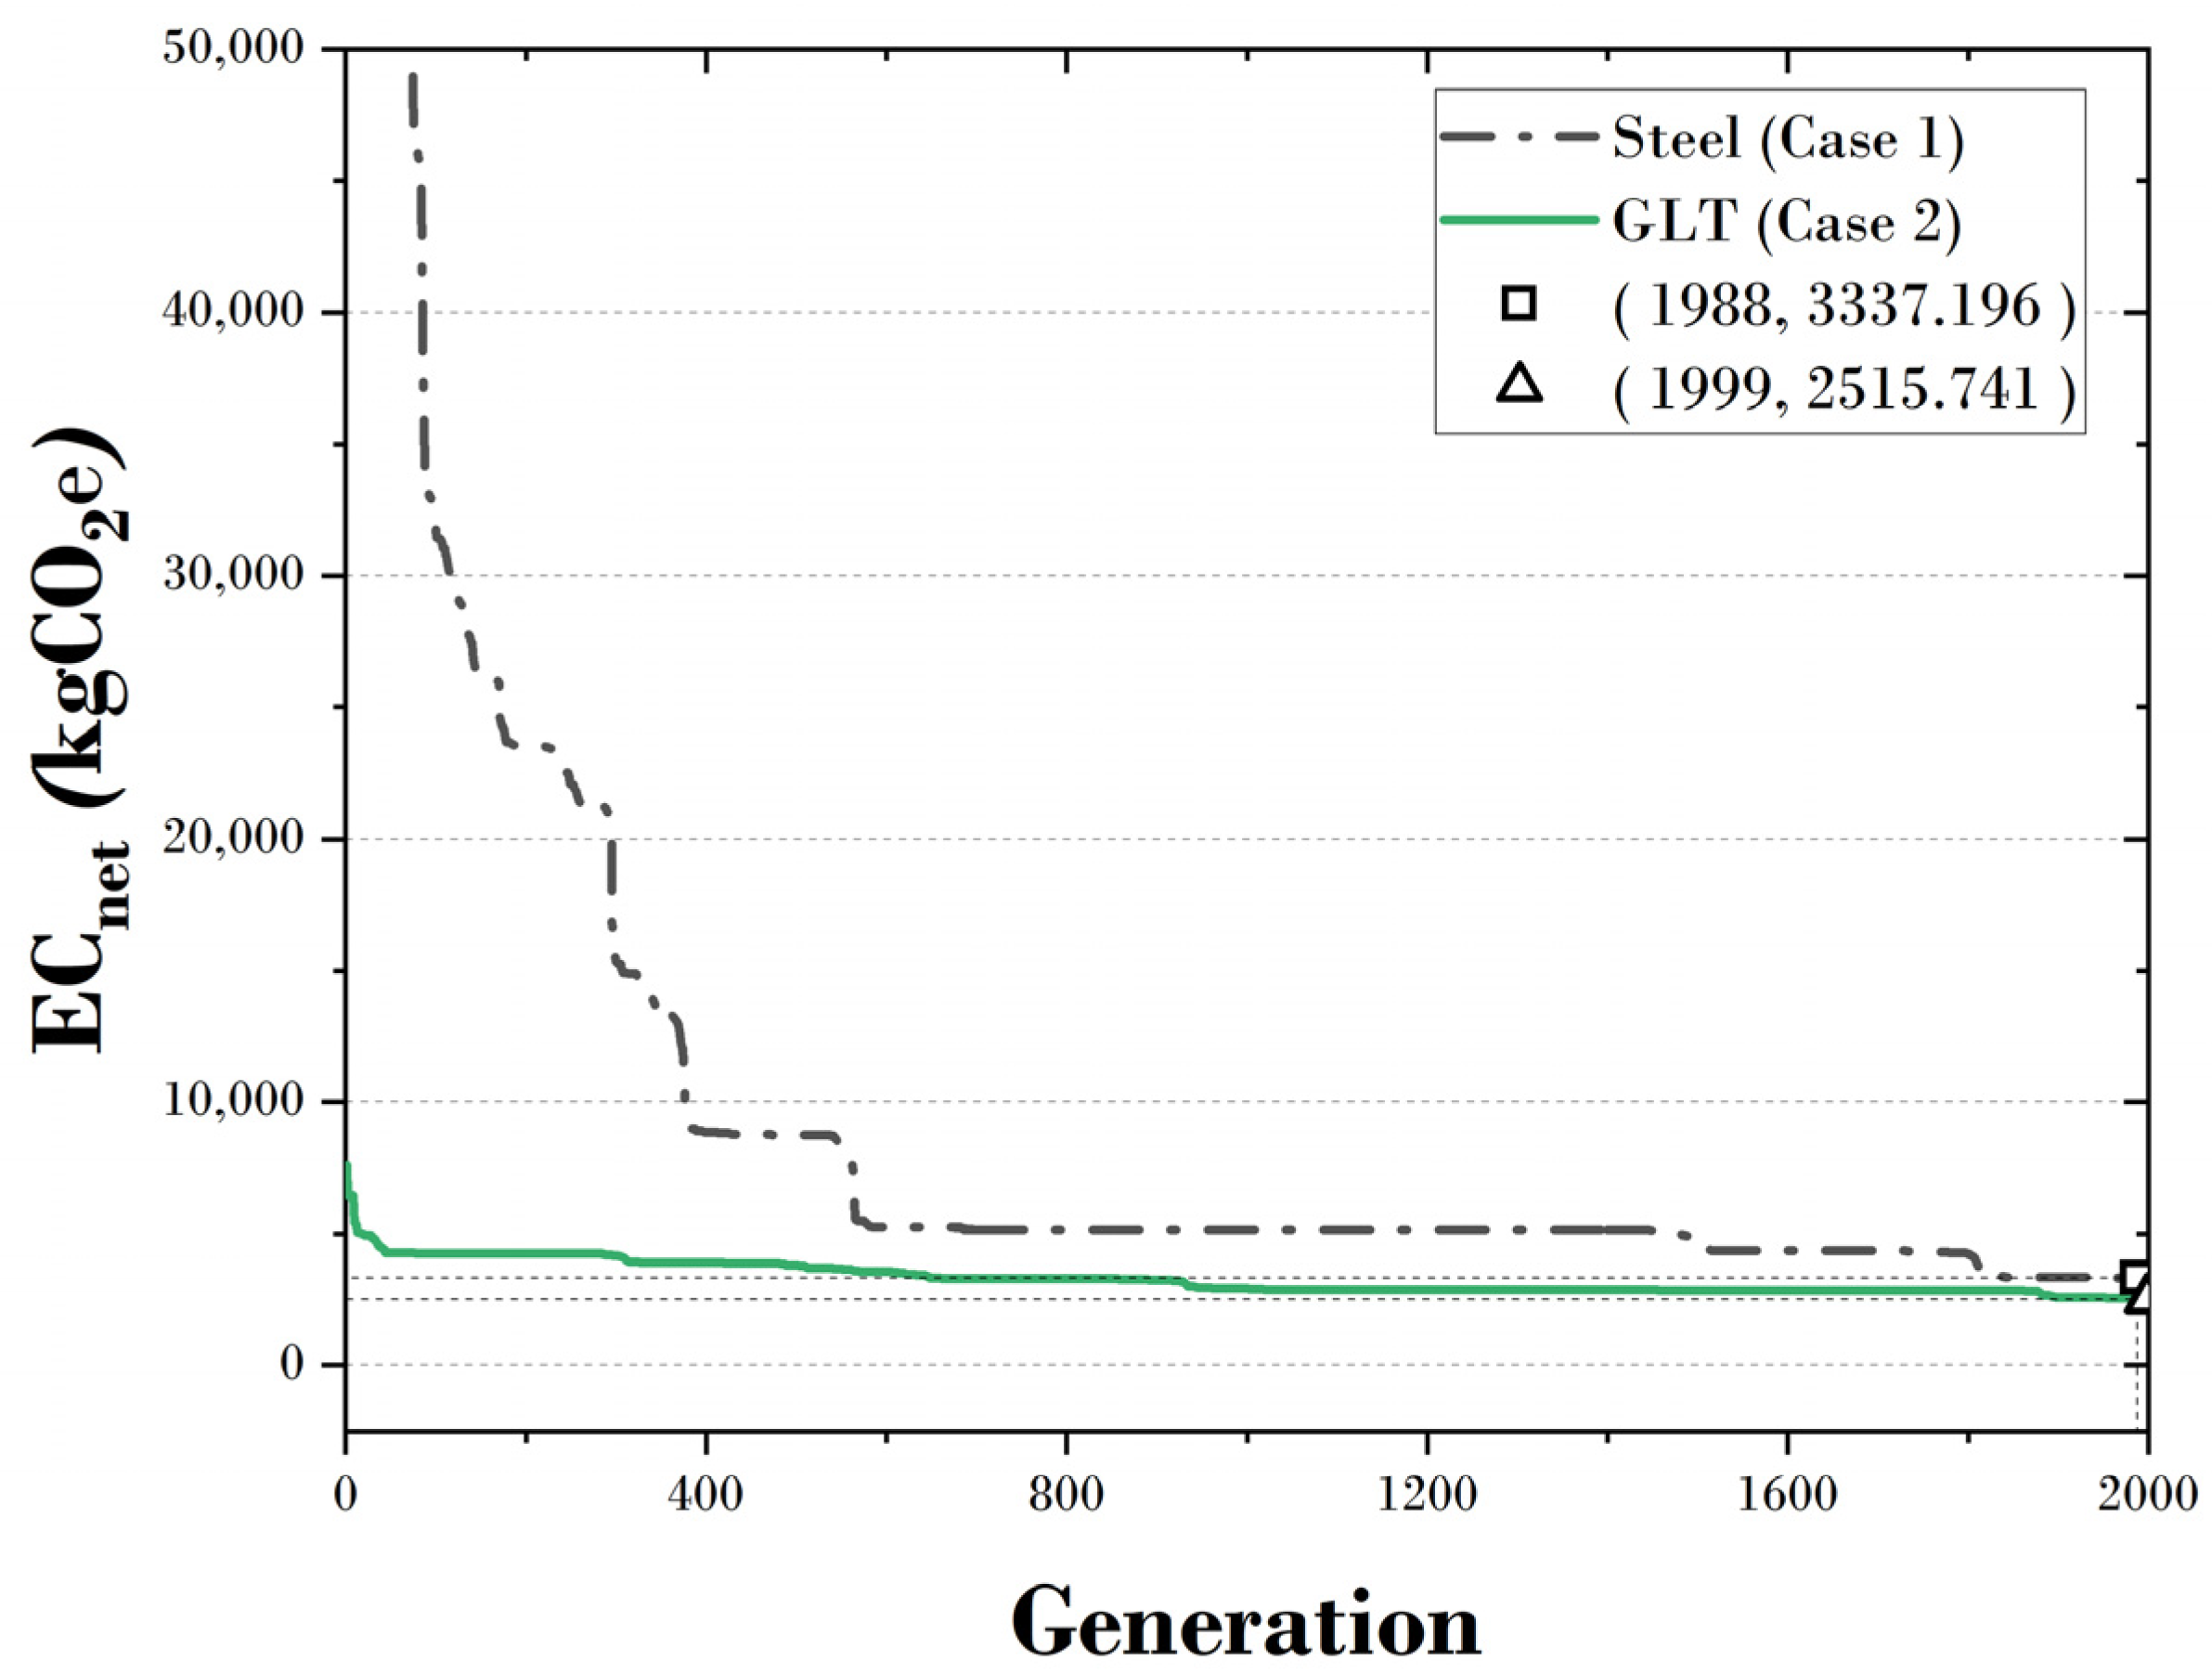
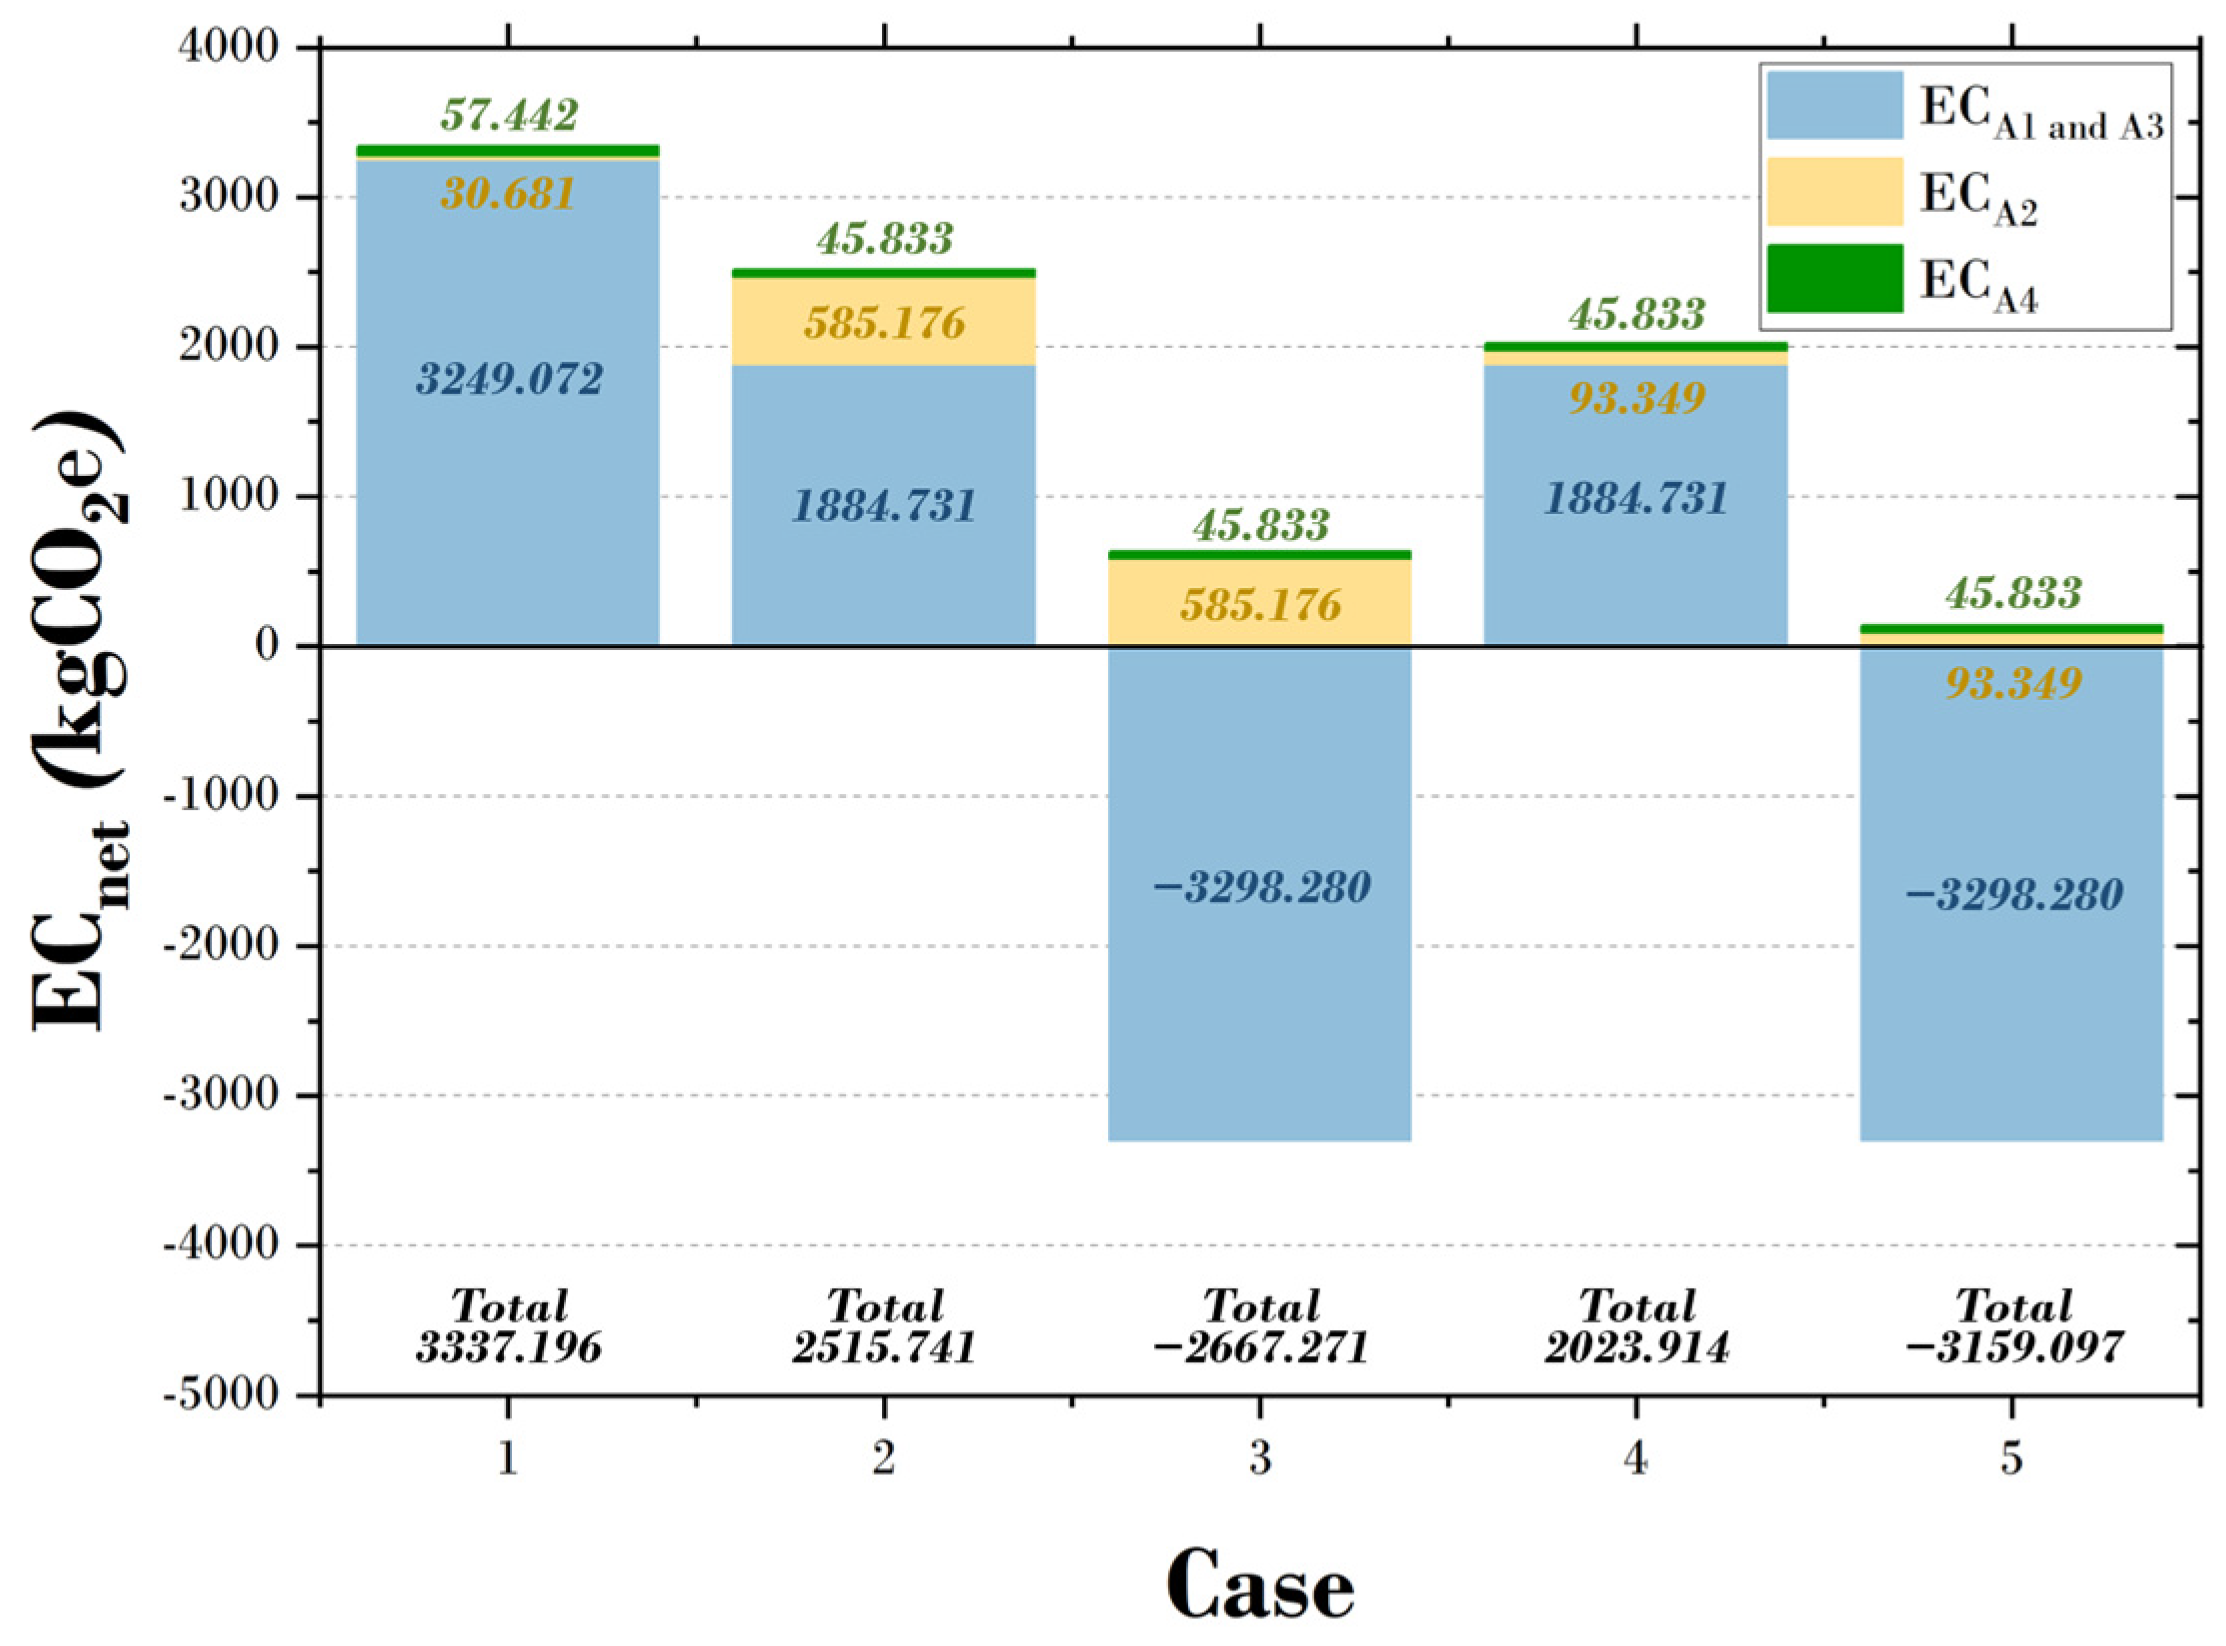
4.2. The 10-Bar Truss Structure

Figure 4 shows the shape and the coordinates of the 10-bar truss structure [37]. It consisted of 6 nodes and 10 elements, and the design variable was 10. A load of −100 kips was applied to nodes 4 and 5 along the Y-axis, and the maximum displacement generated at each node was set to 3.6 in.
Table 7 shows the cross-sectional areas and constraints derived from the optimal design results. When the structure’s material was made of steel, the cross-sectional area of element 3 was the largest, at 8.261 mm2, and the cross-sectional areas of elements 2, 5, 6, and 10 were the smallest, at 0.100 mm2. When GLT was used, the cross-sectional area of element 1 was the largest, at 291.313 mm2, and the cross-sectional areas of elements 2 and 10 were the smallest, at 0.100 mm2. In addition, it was confirmed that steel and GLT satisfied the allowable stress and allowable displacement, and the structure’s weights were 4759.435 kg and 8692.408 kg, respectively, in these scenarios. Figure 5 shows a convergence graph of the 10-bar truss structure, and it can be seen that both steel and GLT converged to one value. Steel converged to a minimum carbon emission of 2441.905 kgCO2e in 746 generations, and GLT converged to a minimum carbon emission of 2964.095 kgCO2e in 952 generations.
Figure 6 shows the carbon emissions of steps A1–A4 according to the case. In steps A1 and A3, case 1 had the most significant emissions, with 2377.423 kgCO2e of carbon emitted, and cases 3 and 5 had the lowest carbon emissions, with −3886.099 kgCO2e. In step A2, cases 2 and 3 had the most significant emissions, with 689.466 kgCO2e of carbon emitted, and case 1 had the lowest carbon emissions, with 22.450 kgCO2e. In step A4, cases 2–5 had the most significant carbon emissions at 54.002 kgCO2e, and case 1 had the lowest carbon emissions, at 42.032 kgCO2e. Considering the total carbon emissions of all steps (A1–A4), case 2 had the most significant carbon emissions, at 2964.095 kgCO2e, and case 5 had the lowest carbon emissions, at −3722.111 kgCO2e. When comparing cases 1, 3, and 5, it can be seen that the carbon emissions were lower when using GLT compared to steel. In addition, when comparing cases 2 and 4 or cases 3 and 5, it can be noted that the same material (GLT) was used, but the differences in carbon emissions could be significant depending on the transport distances of the materials and elements.

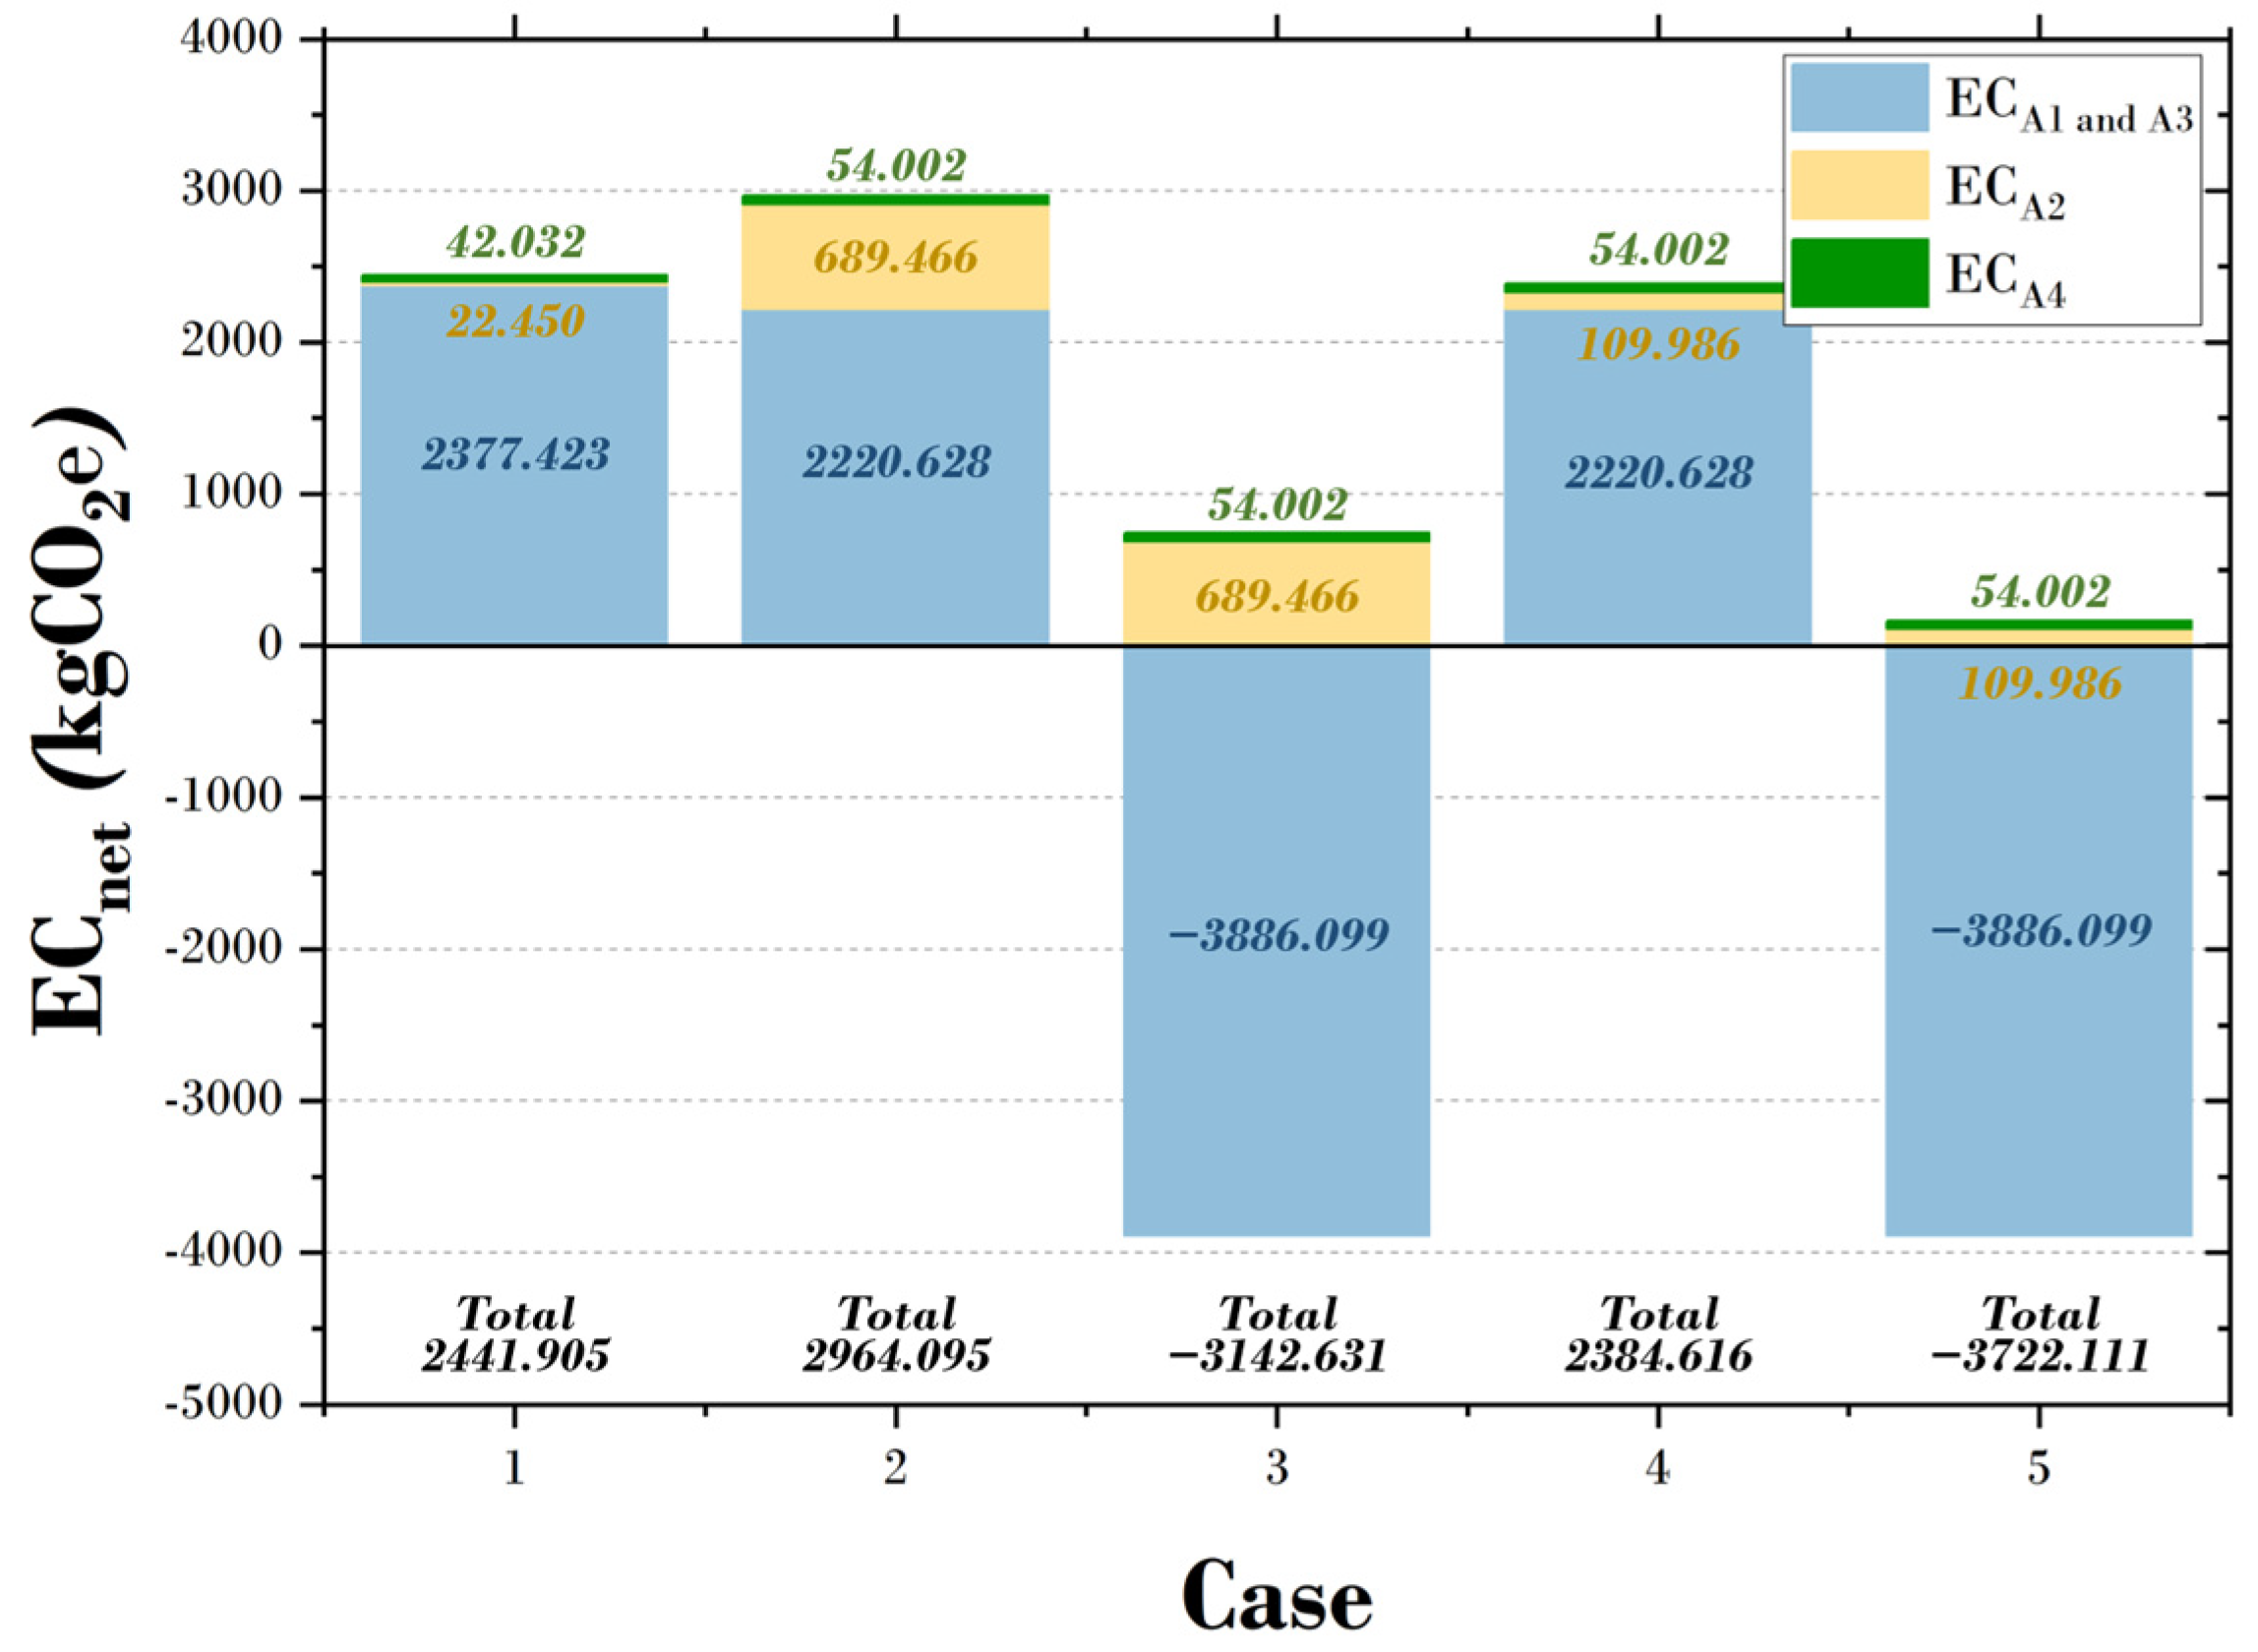
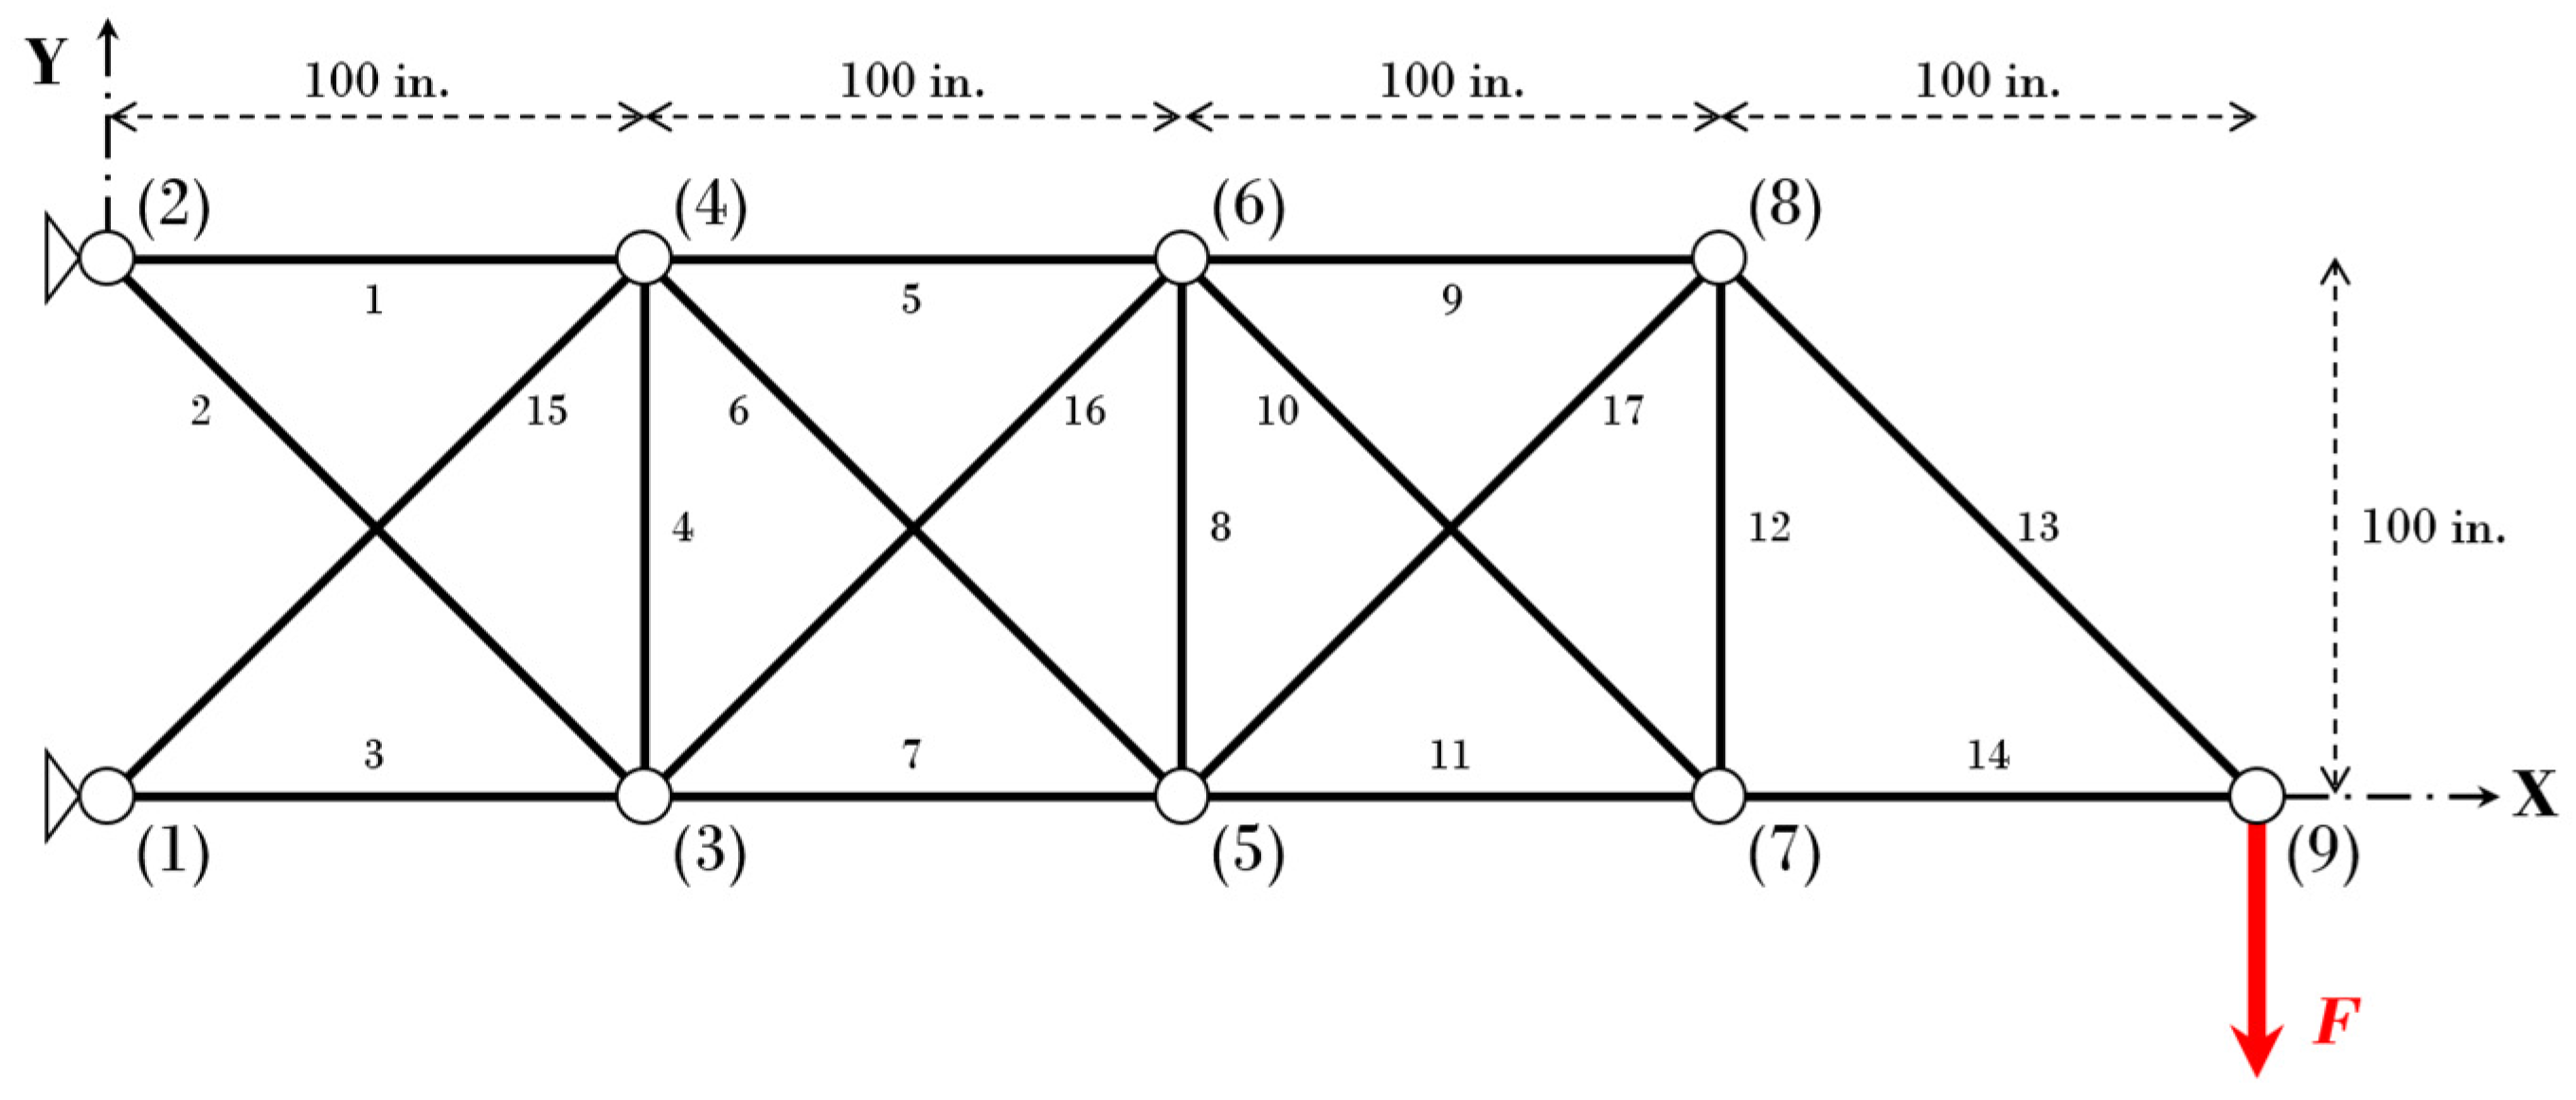
4.3. The 17-Bar Truss Structure

Figure 7 shows the shape and the coordinates of the 17-bar truss structure [37]. It consisted of 9 nodes and 17 elements, and the design variable was 17. A load of −100 kips was applied to node 9 along the Y-axis, and the maximum displacement generated at each node was set to 2.0 in.
Table 8 shows the cross-sectional areas and constraints derived from the optimal design results. When the structure’s material was made of steel, the cross-sectional area of element 1 was the largest, at 33.616 mm2, and the cross-sectional areas of elements 6 and 8 were the smallest, at 0.100 mm2. When GLT was used, the cross-sectional area of element 10 was the largest, at 566.670 mm2, and the cross-sectional areas of elements 15 and 17 were the smallest, at 0.100 mm2. In addition, it was confirmed that steel and GLT satisfied the allowable stress and allowable displacement, and the structure’s weights were 4753.058 kg and 7377.587 kg, respectively, in these scenarios. Figure 8 shows a convergence graph of the 17-bar truss structure, and it can be seen that both steel and GLT converged to one value. Steel converged to a minimum carbon emission of 3337.196 kgCO2e in 1988 generations, and GLT converged to a minimum carbon emission of 2515.741 kgCO2e in 1999 generations.
Figure 9 shows the carbon emissions of steps A1–A4 according to the case. In steps A1 and A3, case 1 had the most significant emissions, with 3249.072 kgCO2e of carbon emitted, and cases 3 and 5 had the lowest carbon emissions, with −3298.280 kgCO2e. In step A2, cases 2 and 3 had the most significant emissions, with 585.176 kgCO2e of carbon emitted, and case 1 had the lowest carbon emissions, with 30.681 kgCO2e. In step A4, cases 2–5 had the lowest carbon emissions, at 45.833 kgCO2e, and case 1 had the most significant carbon emissions, at 57.442 kgCO2e. Considering the total carbon emissions of all steps (A1–A4), case 2 had the most significant carbon emissions, at 3337.196 kgCO2e, and case 5 had the lowest carbon emissions, at −3159.097 kgCO2e. When comparing cases 1, 3, and 5, it can be seen that the carbon emissions were lower when using GLT compared to steel. In addition, when comparing cases 2 and 4 or cases 3 and 5, it can be noted that the same material (GLT) was used, but the differences in carbon emissions could be significant depending on the transport distances of the materials and elements.

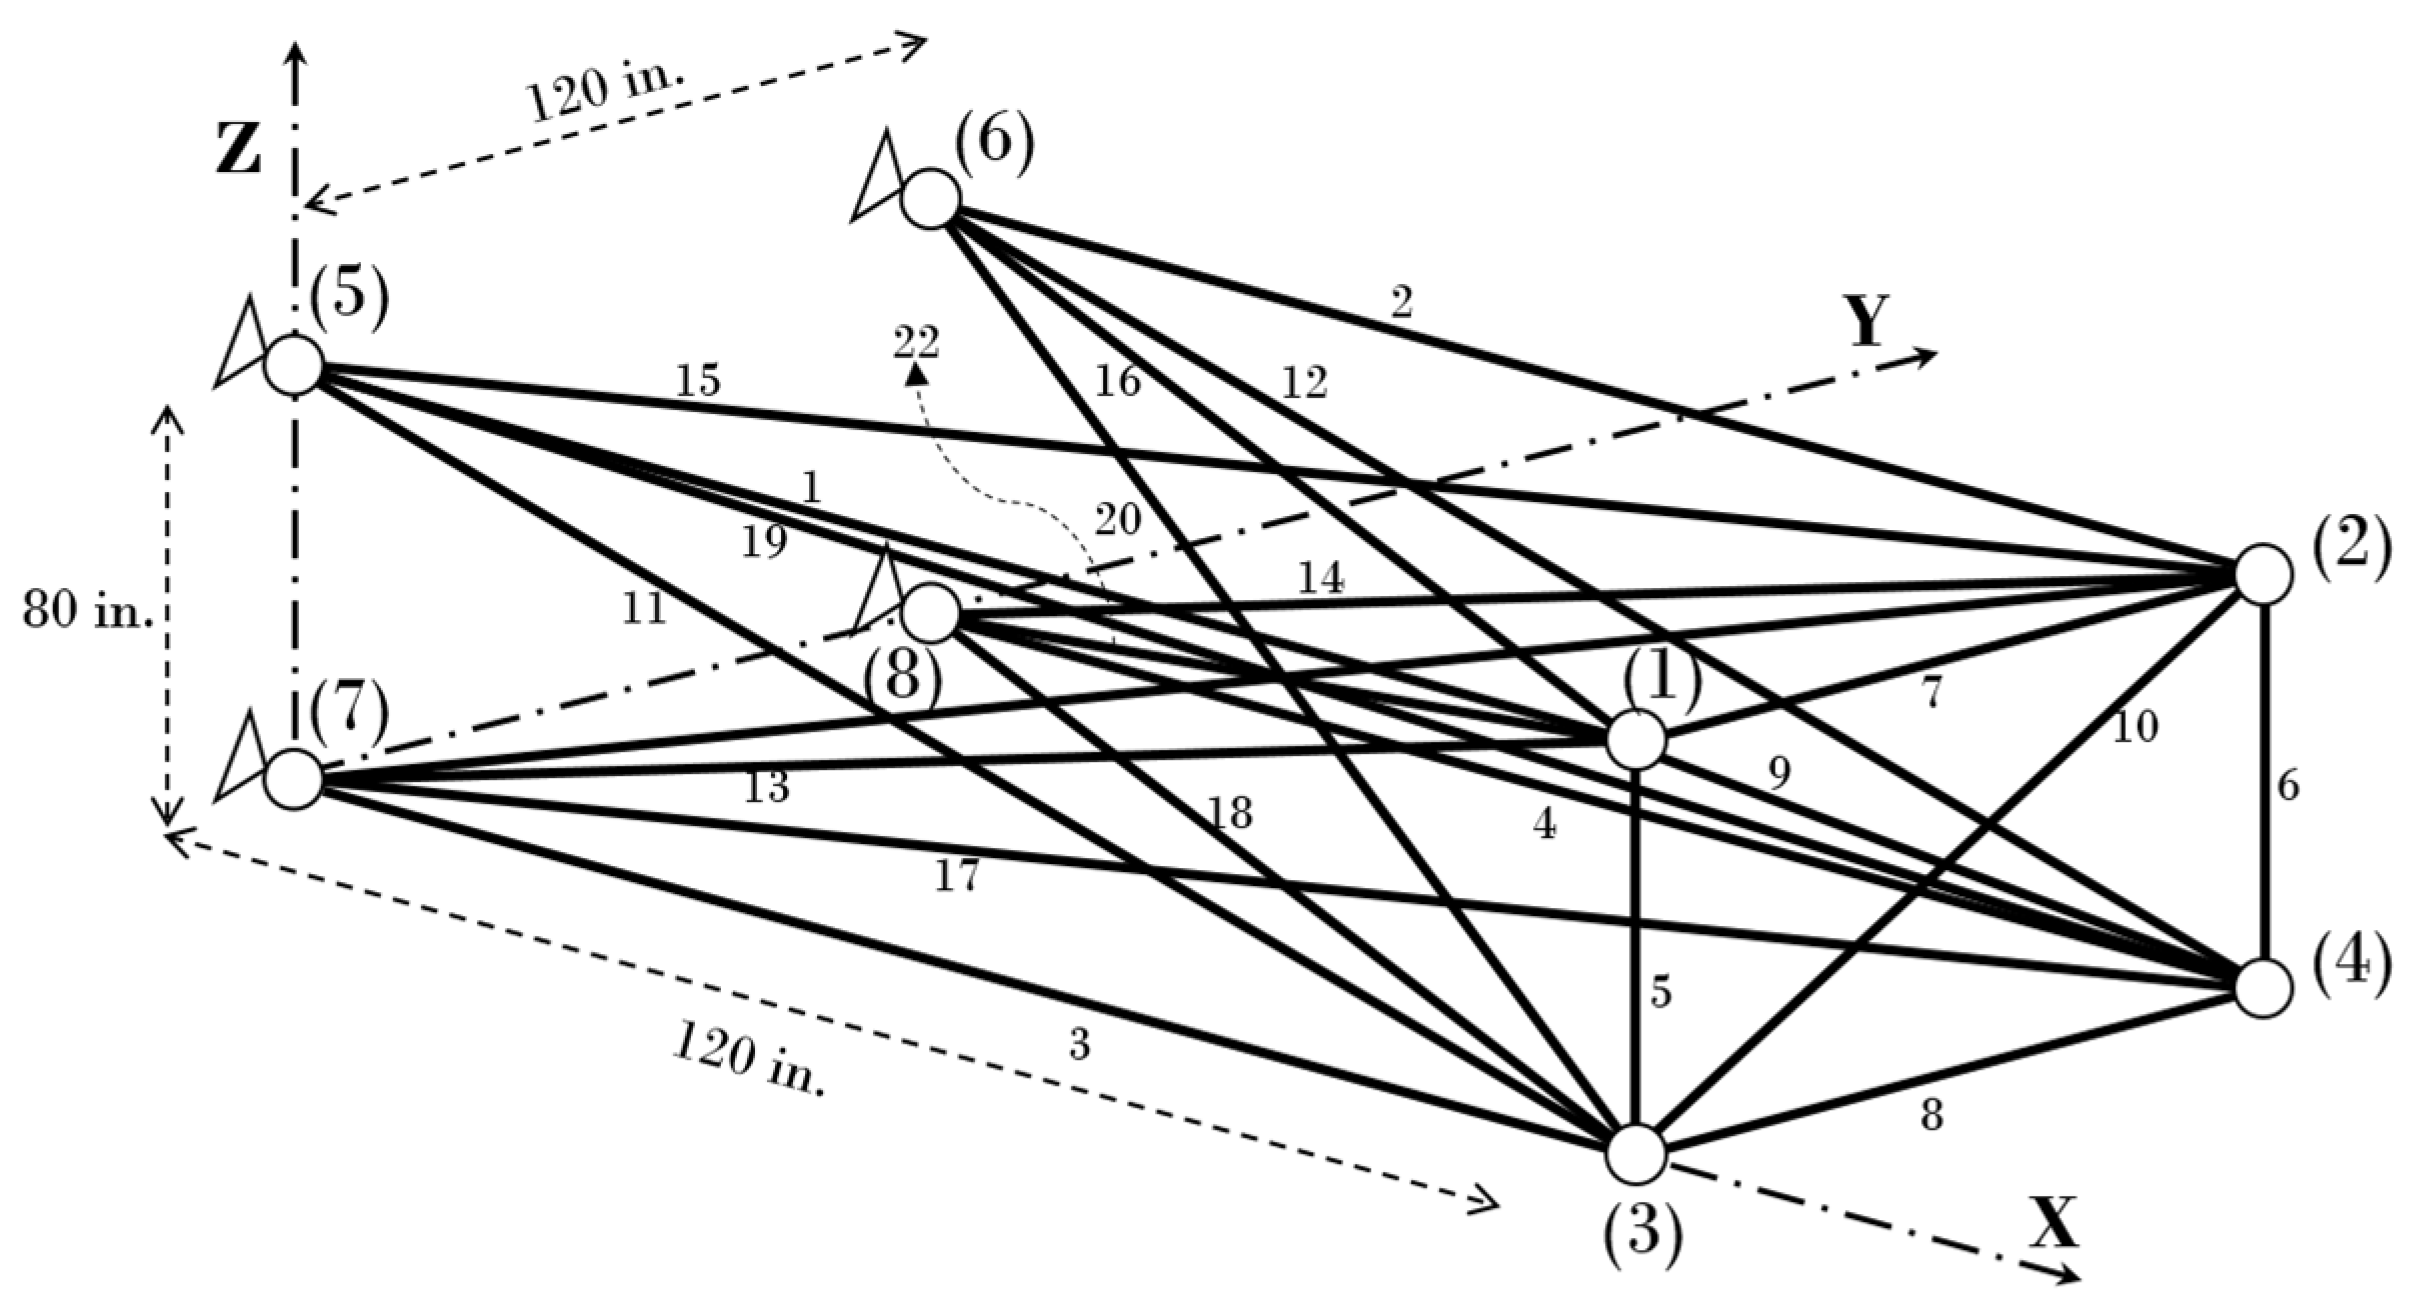
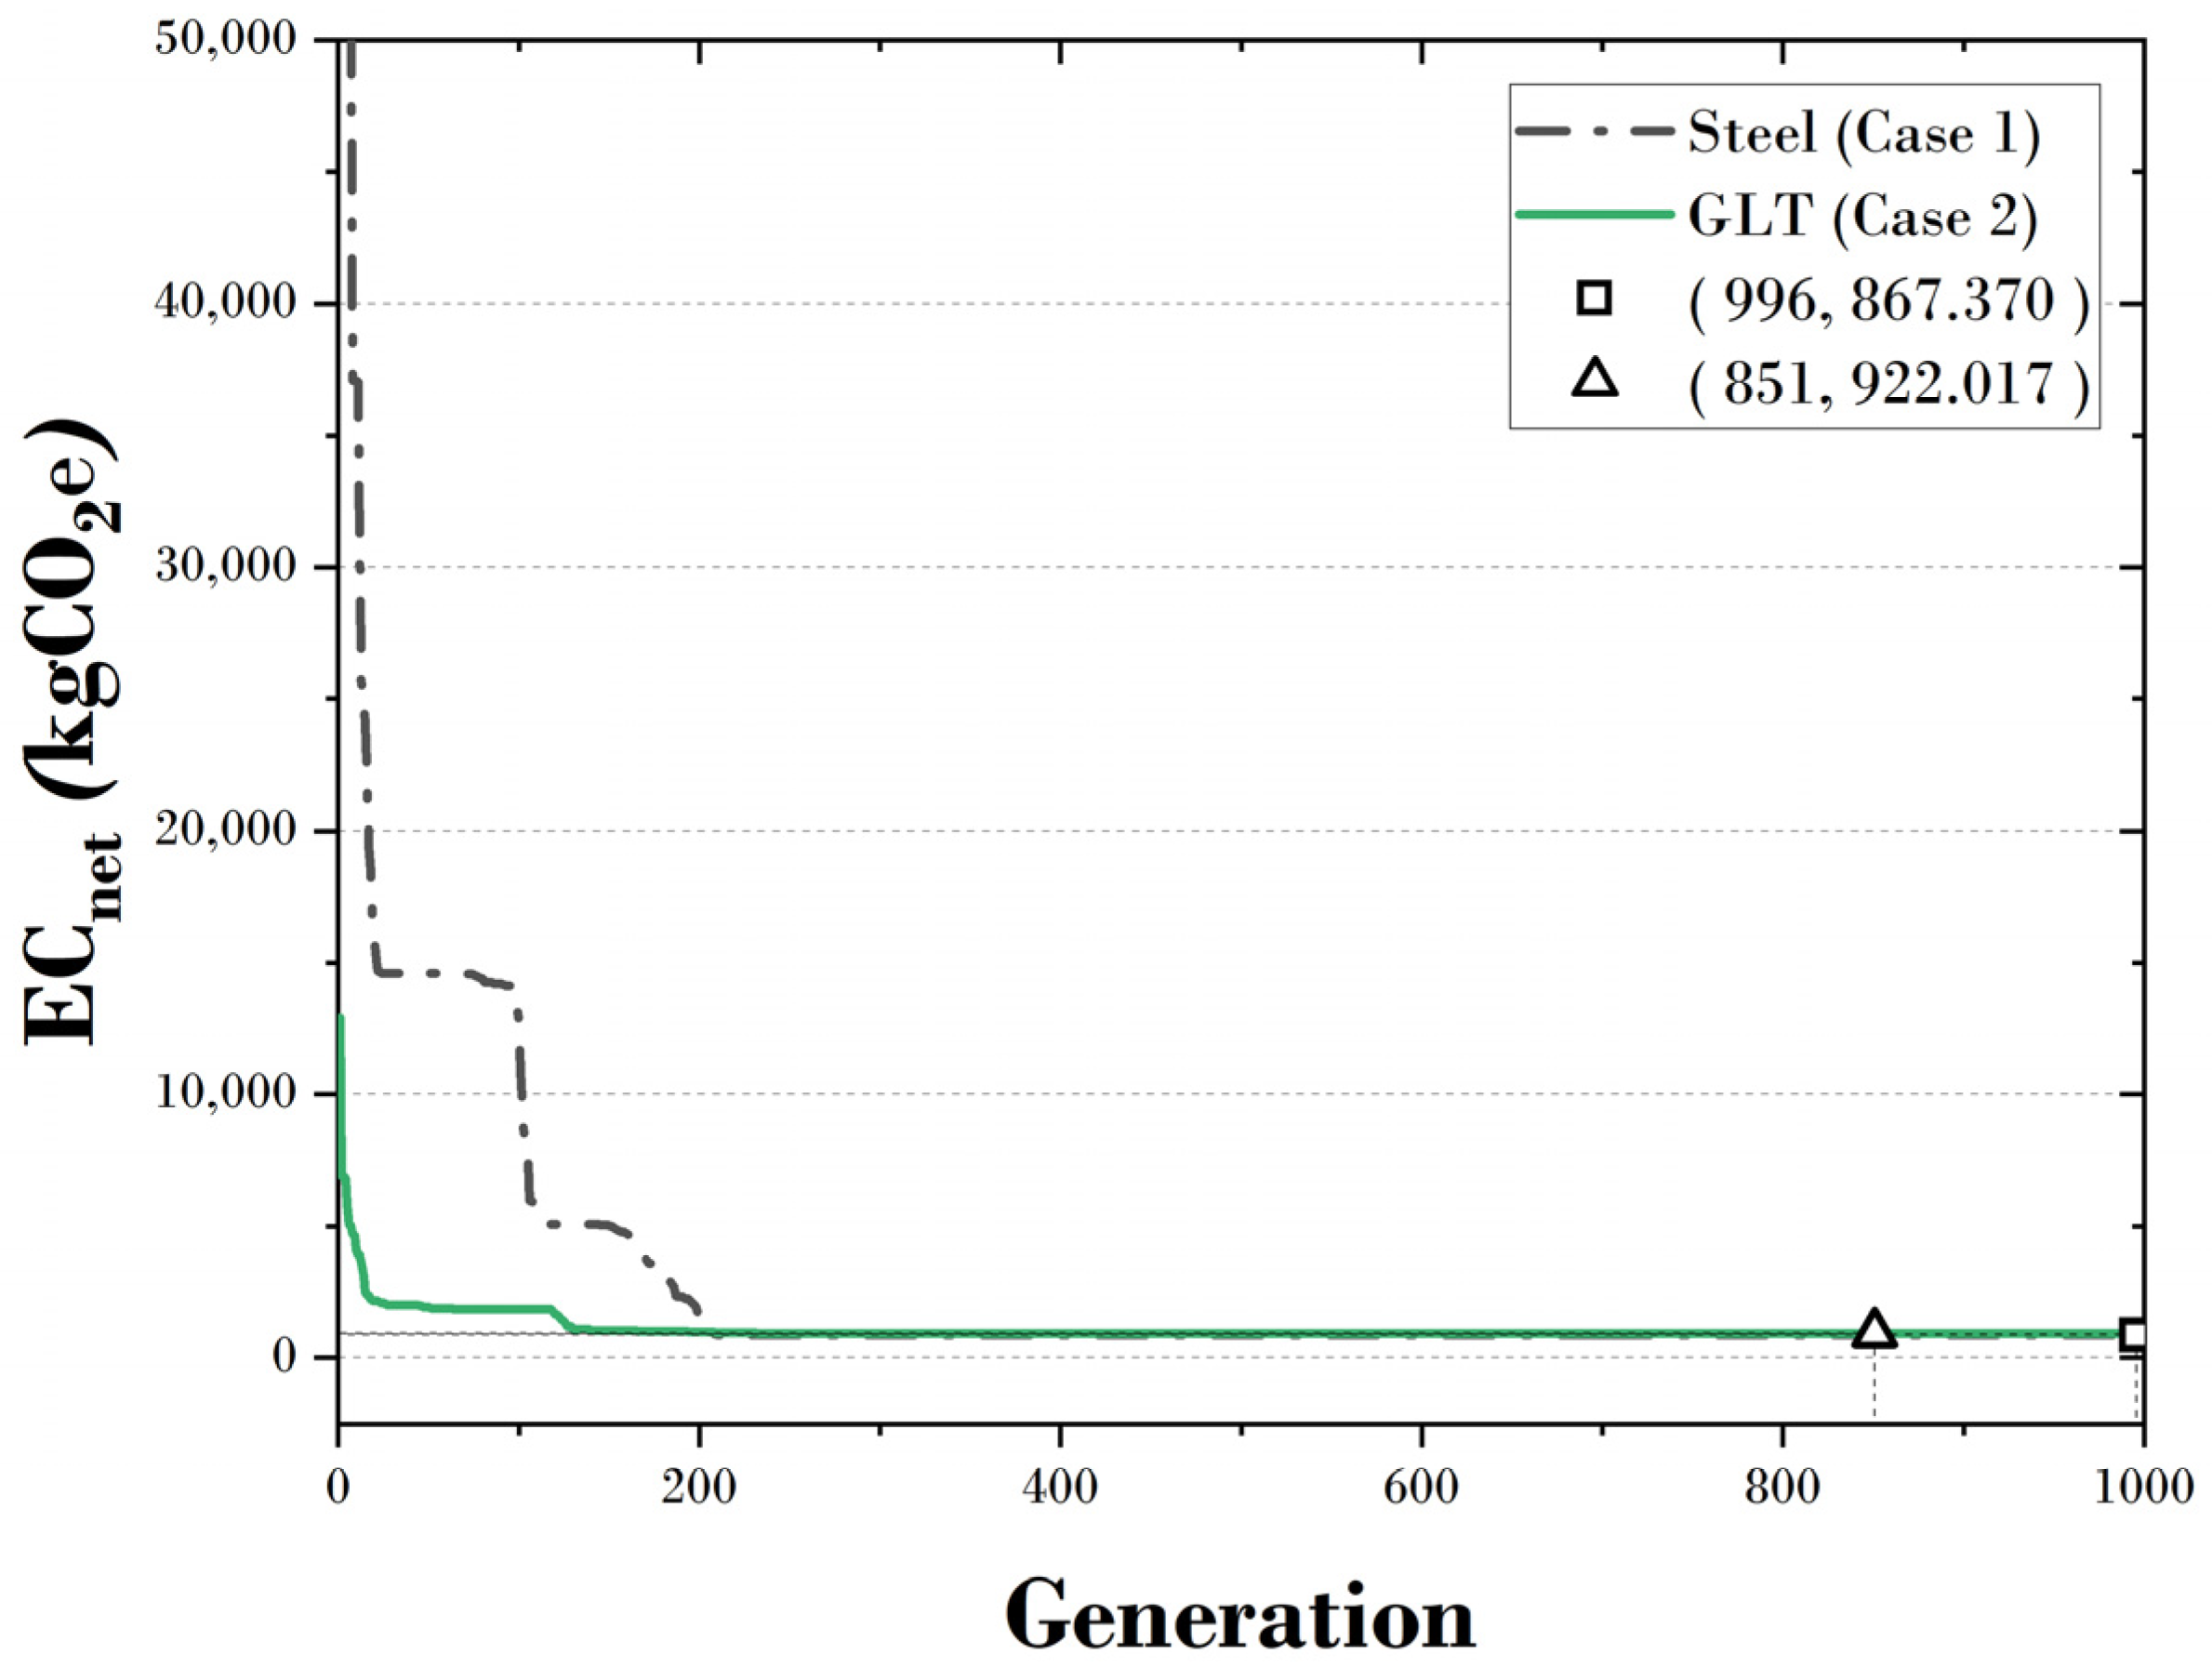
4.4. The 22-Bar Truss Structure

Figure 10 shows the shape and the coordinates of the 22-bar truss structure [37]. It consisted of 8 nodes and 22 elements, and the design variable was seven. A load of −20 kips was applied to nodes 1, 2, 3, and 4 along the X-axis, and a load of −50 kips was applied to nodes 2 and 4 along the Y-axis. The maximum displacement generated at each node was set to 2.0 in.
Table 9 shows the cross-sectional areas and constraints derived from the optimal design results. When the structure’s material was made of steel, the group of element 3 was the largest, at 2.355 mm2, and the groups of elements 2, 4, and 5 were the smallest, at 0.100 mm2. When GLT was used, the group of element 6 was the largest, at 68.667 mm2, and the groups of elements 2, 4, 5, and 7 were the smallest, at 0.100 mm2. In addition, it was confirmed that steel and GLT satisfied the allowable stress and allowable displacement, and the structure’s weights were 1235.366 kg and 2703.877 kg, respectively, in these scenarios. Figure 11 shows a convergence graph of the 22-bar truss structure, and it can be seen that both steel and GLT converged to one value. Steel converged to a minimum carbon emission of 867.370 kgCO2e in 996 generations, and GLT converged to a minimum carbon emission of 922.017 kgCO2e in 851 generations.
Figure 12 shows the carbon emissions of steps A1–A4 according to the case. In steps A1 and A3, case 1 had the most significant emissions, with 844.466 kgCO2e of carbon emitted, and cases 3 and 5 had the lowest carbon emissions, with −1208.817 kgCO2e. In step A2, cases 2 and 3 had the most significant emissions, with 214.467 kgCO2e of carbon emitted, and case 1 had the lowest carbon emissions, with 7.974 kgCO2e. In step A4, cases 2–5 had the most significant carbon emissions, at 16.798 kgCO2e, and case 1 had the lowest carbon emissions, at 14.930 kgCO2e. Considering the total carbon emissions of all steps (A1–A4), case 2 had the most significant carbon emissions, at 922.017 kgCO2e, and case 5 had the lowest carbon emissions, at −1157.807 kgCO2e. When comparing cases 1, 3, and 5, it can be seen that the carbon emissions were lower when using GLT compared to steel. In addition, when comparing cases 2 and 4 or cases 3 and 5, it can be noted that the same material (GLT) was used, but the differences in carbon emissions could be significant depending on the transport distances of the materials and elements.

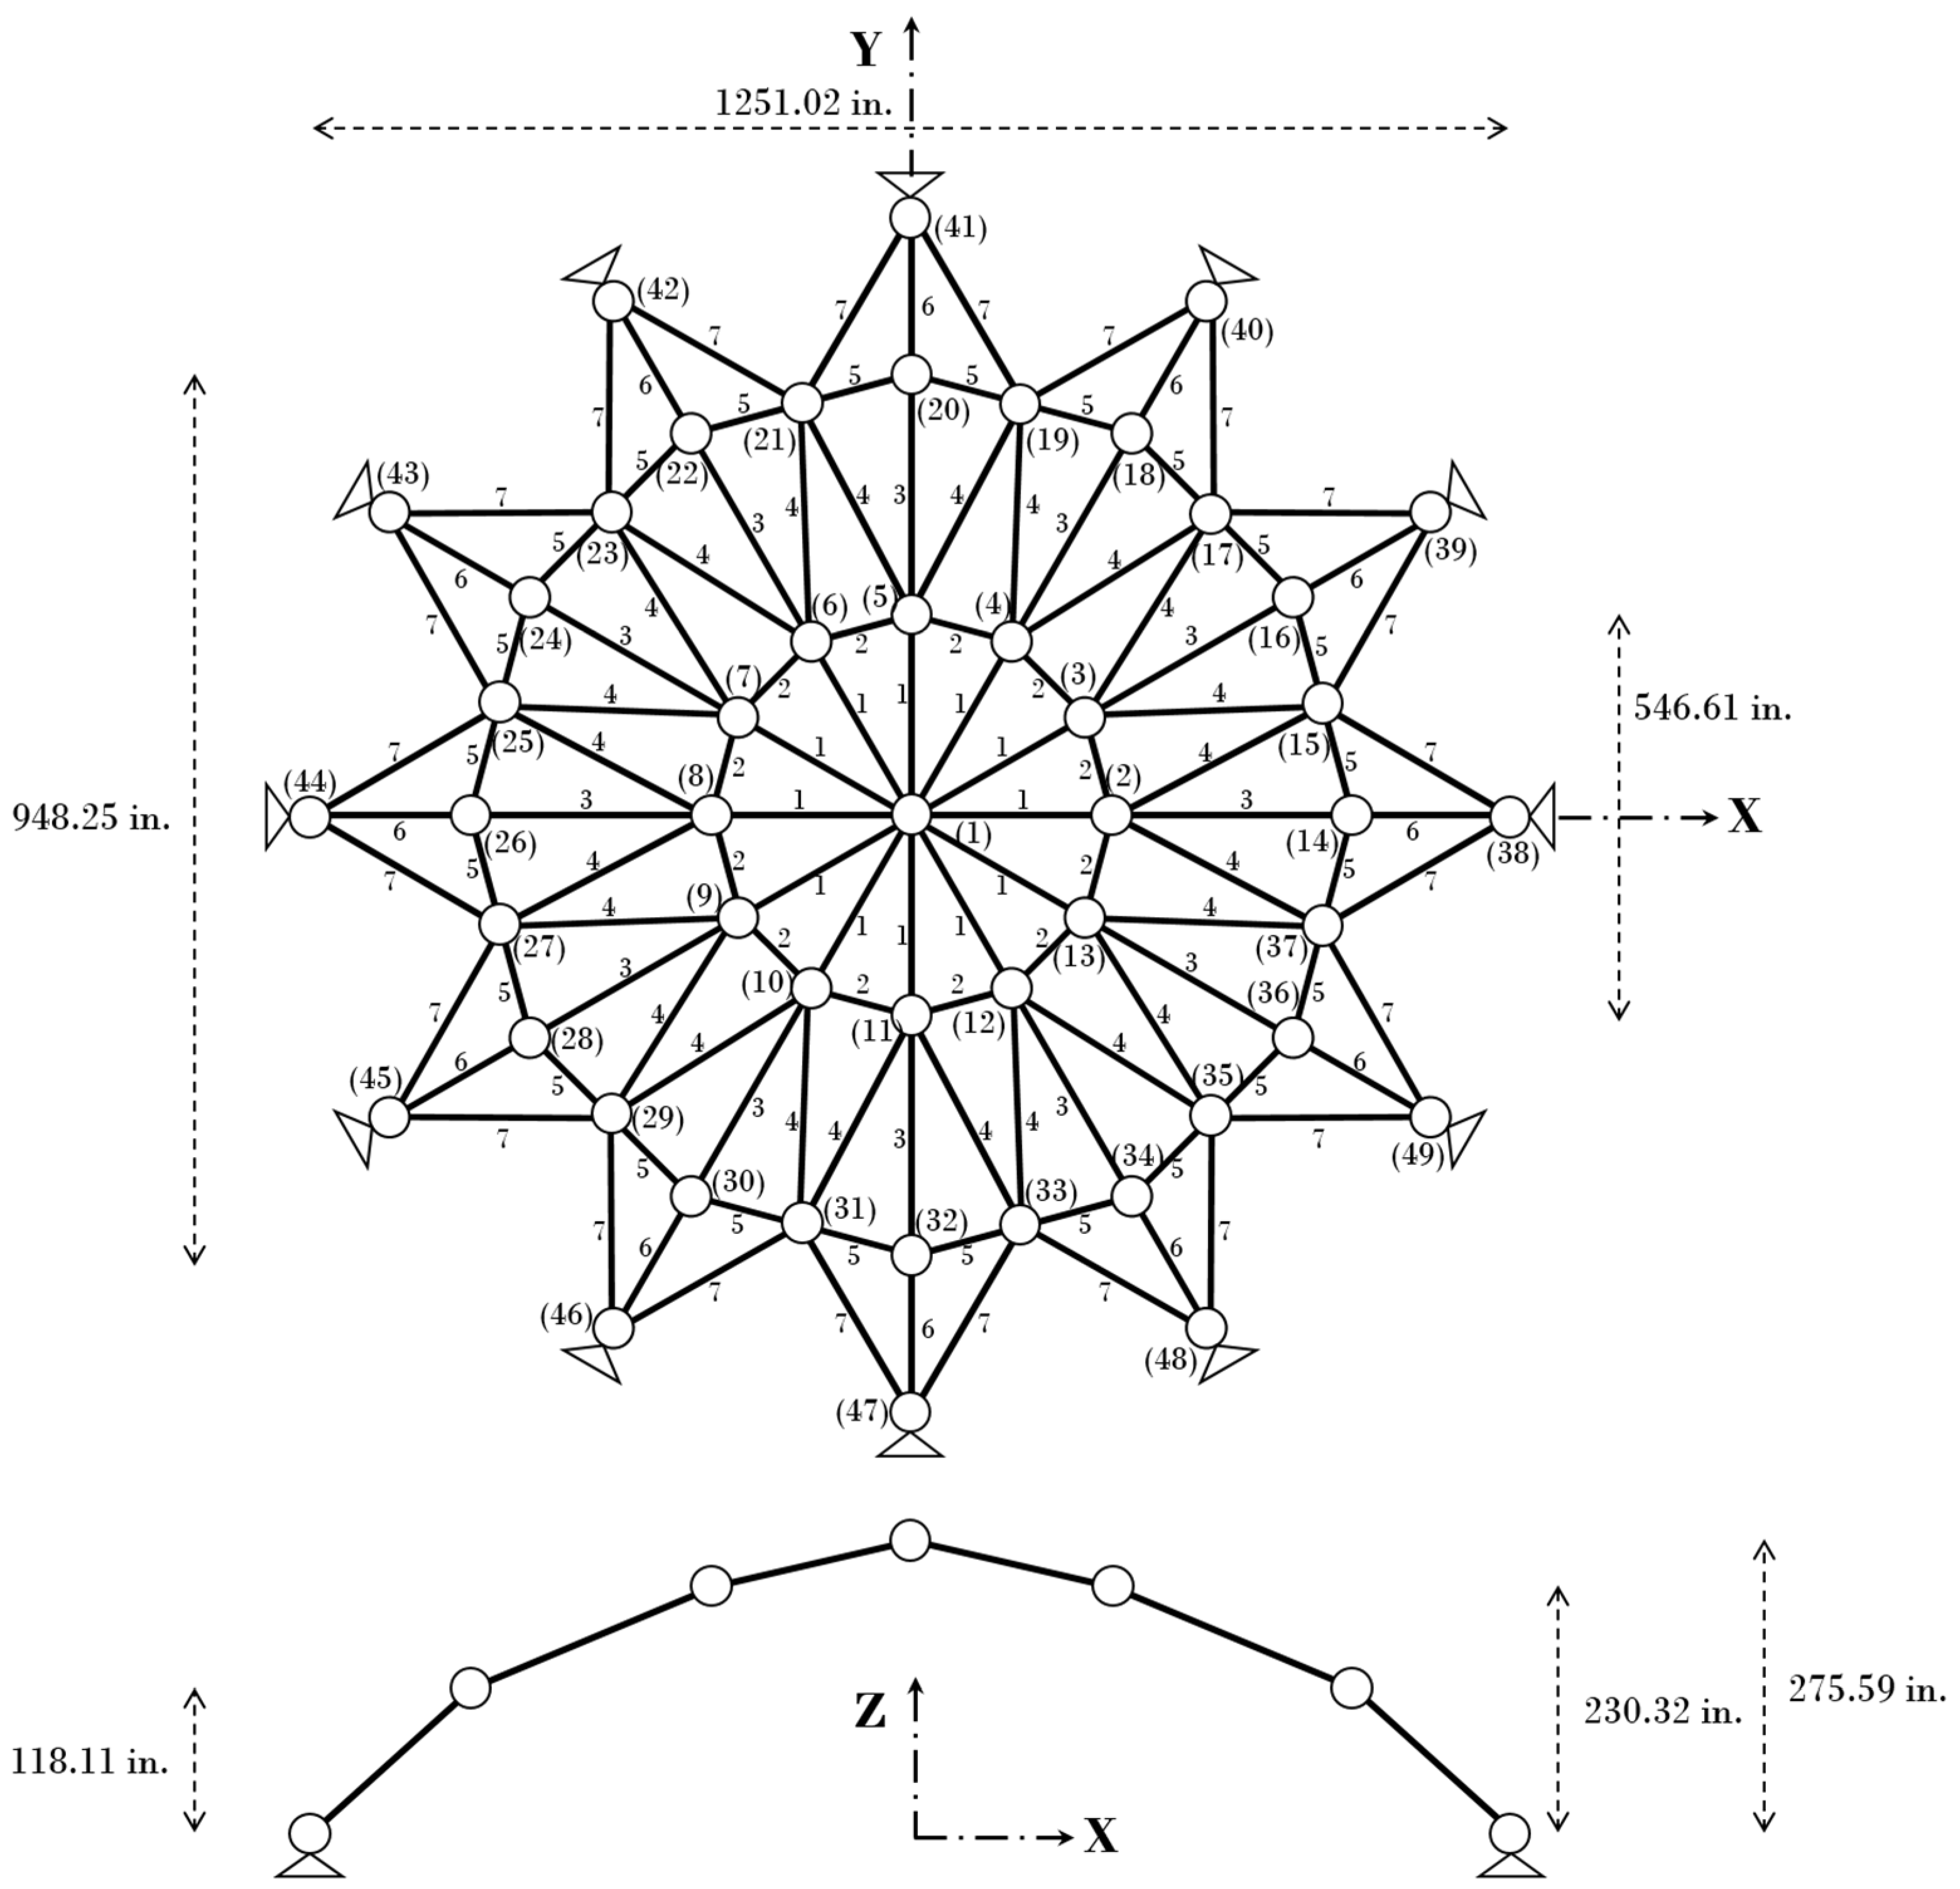
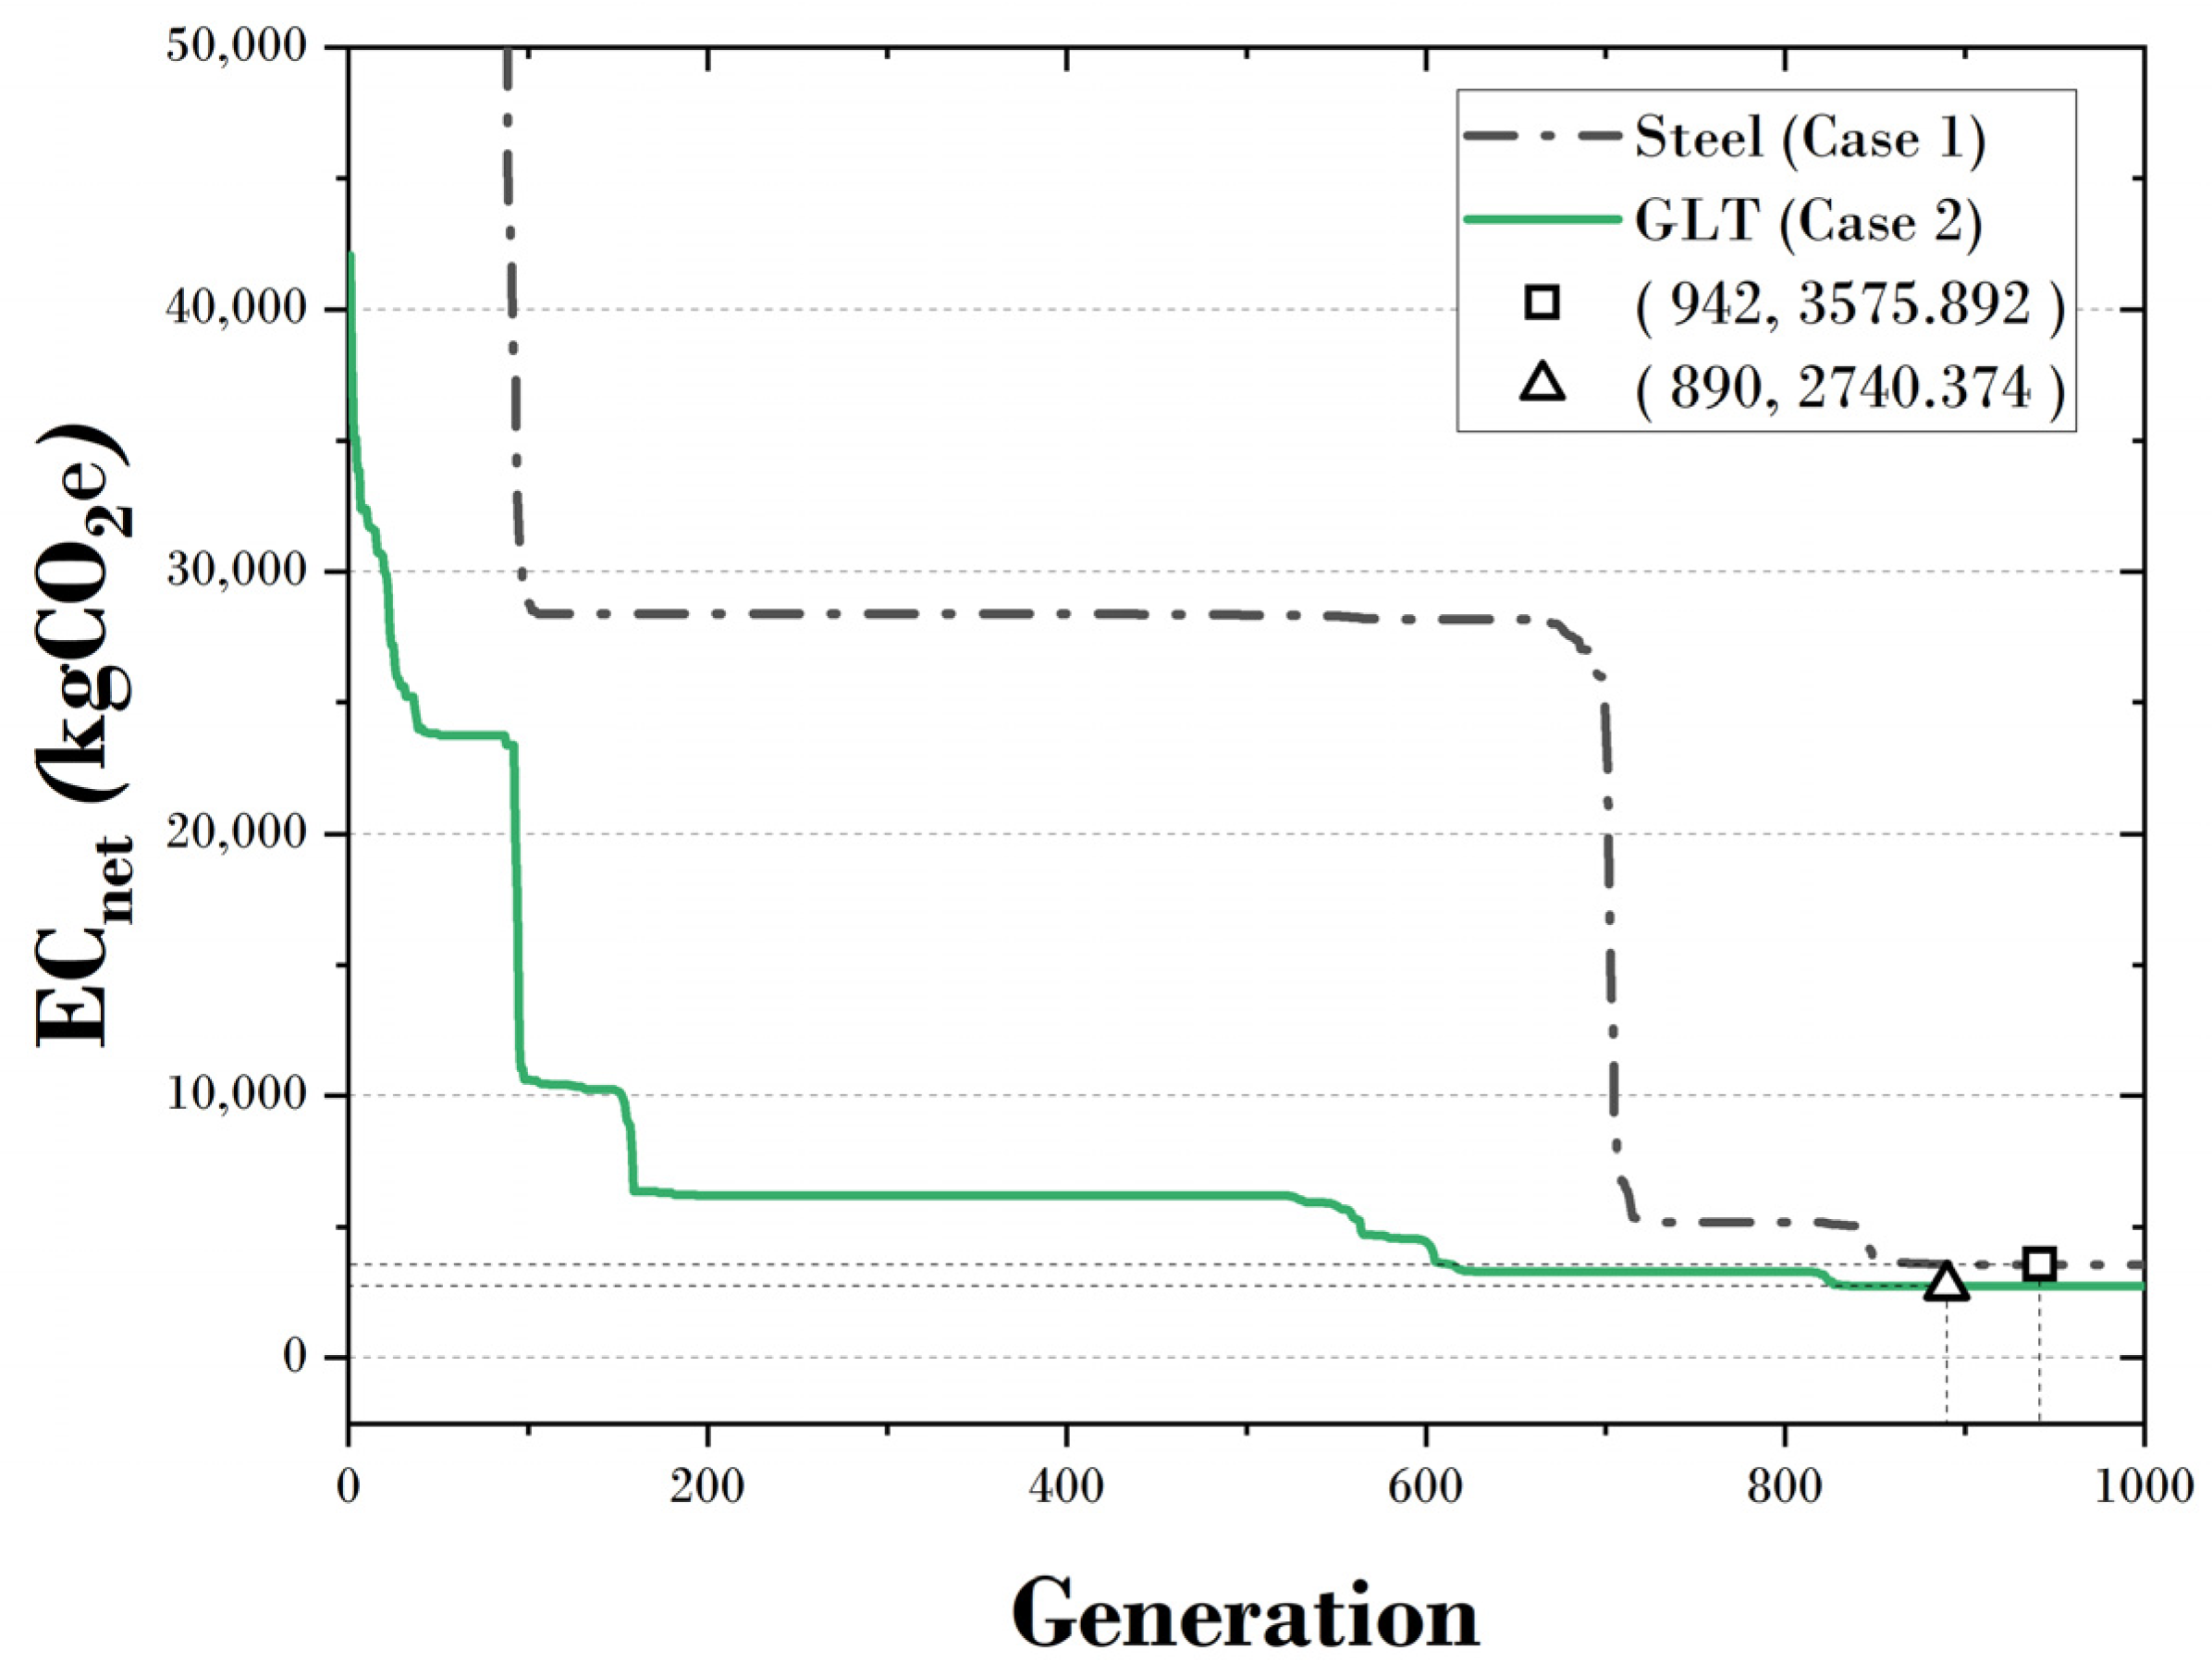
4.5. The 120-Bar Truss Dome Structure

Figure 13 shows the shape and the coordinates of the 120-bar truss structure [38]. It consisted of 49 nodes and 120 elements, and the design variable was seven. Loads of −15, −10.0, and −5.0 kips were applied to nodes 1, 2–15, and 14–37 along the Z-axis. The maximum displacement generated at each node was set to 2.0 in.
Table 10 shows the cross-sectional areas and constraints derived from the optimal design results. When the structure’s material was made of steel, the group of element 3 was the largest, at 2.057 mm2, and the group of element 6 was the smallest, at 0.148 mm2. When GLT was used, the group of element 5 was the largest, at 36.551 mm2, and the group of element 3 was the smallest, at 3.946 mm2. In addition, it was confirmed that steel and GLT satisfied the allowable stress and allowable displacement, and the structure’s weights were 5093.025 kg and 8036.328 kg, respectively, in these scenarios. Figure 14 shows a convergence graph of the 120-bar truss dome structure, and it can be seen that both steel and GLT converged to one value. Steel converged to a minimum carbon emission of 3575.892 kgCO2e in 942 generations, and GLT converged to a minimum carbon emission of 2740.374 kgCO2e in 890 generations.
Figure 15 shows the carbon emissions of steps A1–A4 according to the case. In steps A1 and A3, case 1 had the most significant emissions, with 3,481,466 kgCO2e of carbon emitted, and cases 3 and 5 had the lowest carbon emissions with −3592.786 kgCO2e. In step A2, cases 2 and 3 had the most significant emissions, with 637.427 kgCO2e of carbon emitted, and case 1 had the lowest carbon emissions, with 32.876 kgCO2e. In step A4, cases 2–5 had the lowest carbon emissions, at 49.926 kgCO2e, and case 1 had the most significant carbon emissions, at 61.551 kgCO2e. Considering the total carbon emissions of all steps (A1–A4), case 2 had the most significant carbon emissions, at 3575.892 kgCO2e, and case 5 had the lowest carbon emissions, at −3441.176 kgCO2e. When comparing cases 1, 3, and 5, it can be seen that the carbon emissions were lower when using GLT compared to steel. In addition, when comparing cases 2 and 4 or cases 3 and 5, it can be noted that the same material (GLT) was used, but the differences in carbon emissions could be significant depending on the transport distances of the materials and elements.

5. Conclusions

In this study, the optimal design of truss structures was performed using carbon emissions, considering the internal energy of the construction materials as an objective function. The carbon emissions of domestic and imported wood were compared with those of customary materials sourced from the Republic of Korea.
As a result, it was confirmed that the carbon emissions of steps A1 and A3 were the largest for all example structures when using customary materials (steel). In other words, the carbon emissions were more significant when using customary materials than when using timber, and in particular, the greater the weight of the structure, the greater the carbon emissions. However, since the travel distance was significant when timber was imported from Canada (case 2), absent consideration of its carbon storage, the carbon emissions may be larger than when using customary materials (case 1) or domestic wood (case 4). In addition, when the carbon storage capacity of the material is considered (cases 3 and 5), the carbon emission reduction can be maximized when using domestic timber. Therefore, to stabilize the abnormal climate around the world and reduce carbon emissions, the Republic of Korea should strive to build timber structures and encourage the use of domestic timber at the national level.
To reduce carbon emissions around the world, it is essential to evaluate carbon emissions in advance in the construction schematic-design stage. If optimal design is performed using carbon emissions, as performed in this study, in the schematic-design stage, it is expected to contribute significantly to reducing carbon emissions worldwide and reducing carbon in the construction field. For a more accurate evaluation in the future, it will be necessary to perform optimal design within which all steps of carbon emission evaluation are considered as an objective function.

Author Contributions

Conceptualization, D.L., J.K. and S.L.; methodology, D.L. and J.K.; software, D.L.; validation, D.L. and J.K.; formal analysis, D.L.; investigation, D.L.; data curation, D.L. and J.K.; writing—original draft preparation, D.L., J.K. and S.L.; visualization, D.L. and J.K.; supervision, S.L.; project administration, D.L. and S.L.; funding acquisition, D.L. and S.L. All authors have read and agreed to the published version of the manuscript.

Funding

This research was supported by the Basic Science Research Program through the National Research Foundation of Korea (NRF), which is funded by the Ministry of Education (RS-2023-00244008). This work was also supported by a National Research Foundation of Korea (NRF) grant funded by the Ministry of Science and ICT (RS-2024-00352968).

Institutional Review Board Statement

Not applicable.

Informed Consent Statement

Not applicable.

Data Availability Statement

Data from this study can be accessed upon request by contacting the first author.

Conflicts of Interest

The authors declare no conflicts of interest.

References

  1. Lee, H.; Calvin, K.; Dasgupta, D.; Krinner, G.; Mukherji, A.; Thorne, P.; Trisos, C.; Romero, J.; Aldunce, P.; Barret, K.; et al. Climate Change 2023: Synthesis Report, Summary for Policymakers; Contribution of Working Groups I, II and III to the Sixth Assessment Report of the Intergovernmental Panel on Climate Change; Core Writing Team, Lee, H., Romero, J., Eds.; IPCC: Geneva, Switzerland, 2023. [Google Scholar]
  2. Tokarska, K.B.; Gillett, N.P. Cumulative carbon emissions budgets consistent with 1.5 °C global warming. Nat. Clim. Chang. 2018, 8, 296–299. [Google Scholar] [CrossRef]
  3. Hafner, A.; Schäfer, S. Environmental aspects of material efficiency versus carbon storage in timber buildings. Eur. J. Wood Wood Prod. 2018, 76, 1045–1059. [Google Scholar] [CrossRef]
  4. GlobalABC. 2021 Global Status Report for Buildings and Construction; UN Environment Programme: Nairobi, Kenya, 2021; pp. 15–16. [Google Scholar]
  5. Moran, F.; Blight, T.; Natarajan, S.; Shea, A. The use of Passive House Planning Package to reduce energy use and CO2 emissions in historic dwellings. Energy Build. 2014, 75, 216–227. [Google Scholar] [CrossRef]
  6. Whang, S.W.; Kim, S. Determining sustainable design management using passive design elements for a zero emission house during the schematic design. Energy Build. 2014, 77, 304–312. [Google Scholar] [CrossRef]
  7. Wiberg, A.H.; Georges, L.; Dokka, T.H.; Haase, M.; Time, B.; Lien, A.G.; Mellegård, S.; Maltha, M. A net zero emission concept analysis of a single-family house. Energy Build. 2014, 74, 101–110. [Google Scholar] [CrossRef]
  8. Knoeri, C.; Sanyé-Mengual, E.; Althaus, H.J. Comparative LCA of recycled and conventional concrete for structural applications. Int. J. Life Cycle Assess. 2013, 18, 909–918. [Google Scholar] [CrossRef]
  9. Cho, Y.S.; Kim, J.H.; Hong, S.U.; Kim, Y. LCA application in the optimum design of high rise steel structures. Renew. Sustain. Energy Rev. 2012, 16, 3146–3153. [Google Scholar] [CrossRef]
  10. Acevedo-De-los Ríos, A. Building Materials and the Climate: Constructing a New Future; Technical Report; UNEP: Nairobi, Kenya, 2023. [Google Scholar]
  11. IEA. Available online: https://www.iea.org/data-and-statistics/charts/global-cement-demand-for-building-construction-2000-2020-and-in-the-net-zero-scenario-2025-2030 (accessed on 12 April 2024).
  12. Follesa, M.; Fragiacomo, M.; Casagrande, D.; Tomasi, R.; Piazza, M.; Vassallo, D.; Canetti, D.; Rossi, S. The new provisions for the seismic design of timber buildings in Europe. Eng. Struct. 2018, 168, 736–747. [Google Scholar] [CrossRef]
  13. Barber, D. Determination of fire resistance ratings for glulam connectors within US high rise timber buildings. Fire Saf. J. 2017, 91, 579–585. [Google Scholar] [CrossRef]
  14. Žegarac Leskovar, V.; Premrov, M. A review of architectural and structural design typologies of multi-storey timber buildings in Europe. Forests 2021, 12, 757. [Google Scholar] [CrossRef]
  15. Nehdi, M.L.; Zhang, Y.; Gao, X.; Zhang, L.V.; Suleiman, A.R. Experimental investigation on axial compression of resilient nail-cross-laminated timber panels. Sustainability 2021, 13, 11257. [Google Scholar] [CrossRef]
  16. Hammad, M.; Valipour, H.; Ghanbari-Ghazijahani, T.; Bradford, M. Timber-timber composite (TTC) beams subjected to hogging moment. Constr. Build. Mater. 2022, 321, 126295. [Google Scholar] [CrossRef]
  17. Enerdata. Available online: https://yearbook.enerdata.co.kr/co2/emissions-co2-data-from-fuel-combustion.html (accessed on 12 April 2024).
  18. Farshi, B.; Alinia-Ziazi, A. Sizing optimization of truss structures by method of centers and force formulation. Int. J. Solids Struct. 2010, 47, 2508–2524. [Google Scholar] [CrossRef]
  19. Hasançebi, O.; Azad, S.K.; Azad, S.K. Automated sizing of truss structures using a computationally improved SOPT algorithm. Int. J. Optim. Civ. Eng. 2013, 3, 209–221. [Google Scholar]
  20. Mortazavi, A. A new fuzzy strategy for size and topology optimization of truss structures. Appl. Soft Comput. 2020, 93, 106412. [Google Scholar] [CrossRef]
  21. Cai, Q.; Feng, R.; Zhang, Z. Topology optimization of truss structure considering nodal stability and local buckling stability. Structures 2022, 40, 64–73. [Google Scholar] [CrossRef]
  22. Amoruso, F.M.; Schuetze, T. Life cycle assessment and costing of carbon neutral hybrid-timber building renovation systems: Three applications in the Republic of Korea. Build. Environ. 2022, 222, 109395. [Google Scholar] [CrossRef]
  23. Oh, J.W.; Park, K.S.; Kim, H.S.; Kim, I.; Pang, S.J.; Ahn, K.S.; Oh, J.K. Comparative CO2 emissions of concrete and timber slabs with equivalent structural performance. Energy Build. 2023, 281, 112768. [Google Scholar] [CrossRef]
  24. Hemmati, M.; Messadi, T.; Gu, H.; Seddelmeyer, J.; Hemmati, M. Comparison of Embodied Carbon Footprint of a Mass Timber Building Structure with a Steel Equivalent. Buildings 2024, 14, 1276. [Google Scholar] [CrossRef]
  25. Zhao, Z.; Chen, H.; Liu, H.; Zhu, Z.; Zhao, T.; Zhou, T. Embodied carbon emission reduction potential of new steel–timber composite frame structure for rural houses. Structures 2024, 61, 106121. [Google Scholar] [CrossRef]
  26. Orr, J.; Gibbons, O.; Arnold, W. How to Calculate Embodied Carbon; The Institution of Structural Engineers: London, UK, 2020. [Google Scholar]
  27. Lee, D.; Kim, J.; Shon, S.; Lee, S. An Advanced Crow Search Algorithm for Solving Global Optimization Problem. Appl. Sci. 2023, 13, 6628. [Google Scholar] [CrossRef]
  28. BS EN 15804+A2:2019; Sustainability of Construction Works—Environmental Product Declarations—Core Rules for the Product Category of Construction Products. European Standards: Pilsen, Czech Republic, 2019.
  29. Mostafavi, F.; Tahsildoost, M.; Zomorodian, Z. Energy efficiency and carbon emission in high-rise buildings: A review (2005–2020). Build. Environ. 2021, 206, 108329. [Google Scholar] [CrossRef]
  30. Cabeza, L.F.; Chàfer, M. Technological options and strategies towards zero energy buildings contributing to climate change mitigation: A systematic review. Energy Build. 2020, 219, 110009. [Google Scholar] [CrossRef]
  31. Wu, W.; Skye, H.M. Residential net-zero energy buildings: Review and perspective. Renew. Sustain. Energy Rev. 2021, 142, 110859. [Google Scholar] [CrossRef]
  32. KC, S.; Gautam, D. Progress in sustainable structural engineering: A review. Innov. Infrastruct. Solut. 2021, 6, 68. [Google Scholar] [CrossRef]
  33. Passoni, C.; Caruso, M.; Marini, A.; Pinho, R.; Landolfo, R. The role of life cycle structural engineering in the transition towards a sustainable building renovation: Available tools and research needs. Buildings 2022, 12, 1107. [Google Scholar] [CrossRef]
  34. Climatiq. Available online: https://www.climatiq.io/data/ (accessed on 12 April 2024).
  35. ARUP. Embodied Carbon Timber; The Institution of Structural Engineers: London, UK, 2023; pp. 1–15. [Google Scholar]
  36. Askarzadeh, A. A novel metaheuristic method for solving constrained engineering optimization problems: Crow search algorithm. Comput. Struct. 2016, 169, 1–12. [Google Scholar] [CrossRef]
  37. Lee, K.S.; Geem, Z.W. A new structural optimization method based on the harmony search algorithm. Comput. Struct. 2004, 82, 781–798. [Google Scholar] [CrossRef]
  38. Asl, R.N.; Aslani, M.; Panahi, M.S. Sizing Optimization of Truss Structures using a Hybridized Genetic Algorithm. arXiv 2013, arXiv:1306.1454. [Google Scholar]
Figure 1. Global energy consumption and carbon emissions [4]. (a) Global energy consumption. (b) Global carbon emissions.
Sustainability 16 05830 g001
Figure 2. LCA steps and distribution of carbon emissions.
Sustainability 16 05830 g002
Figure 3. Scenarios of the cases.
Sustainability 16 05830 g003
Figure 4. Shape of the 10-bar truss structure.
Sustainability 16 05830 g004
Figure 5. Convergence graph of the 10-bar truss structure.
Sustainability 16 05830 g005
Figure 6. E C n e t results of the 10-bar truss structure.
Sustainability 16 05830 g006
Figure 7. Shape of the 17-bar truss structure.
Sustainability 16 05830 g007
Figure 8. Convergence graph of the 17-bar truss structure.
Sustainability 16 05830 g008
Figure 9. E C n e t results of the 17-bar truss structure.
Sustainability 16 05830 g009
Figure 10. Shape of the 22-bar truss structure.
Sustainability 16 05830 g010
Figure 11. Convergence graph of the 22-bar truss structure.
Sustainability 16 05830 g011
Figure 12. E C n e t results of the 22-bar truss structure.
Sustainability 16 05830 g012
Figure 13. Shape of 120-bar truss dome structure.
Sustainability 16 05830 g013
Figure 14. Convergence graph of the 120-bar truss dome structure.
Sustainability 16 05830 g014
Figure 15. E C n e t results of the 120-bar truss dome structure.
Sustainability 16 05830 g015
Table 1. CO2 emissions and territorial size, by country, in 2022.
CountryCO2 Emissions
(M ton CO2)
Territorial Size and Relative Emissions
Territory (km2)CO2 per Territory (ton CO2/km2)
China10,504 (1)9,596,960109.45 (8)
USA4735 (2)9,833,517481.52 (5)
India2481 (3)3,287,263754.73 (4)
Russia1798 (4)17,098,246105.16 (9)
Japan1001 (5)377,9762648.32 (2)
Indonesia739 (6)1,904,569388.01 (6)
Germany636 (7)357,1141780.94 (3)
Iran634 (8)1,648,195384.66 (7)
Republic of Korea597 (9)100,2105957.49 (1)
Table 2. Embodied-carbon values of materials.
MaterialCarbon (kgCO2e/kg)
No Carbon StorageIncluding Carbon Storage
Concrete (structure)0.159-
Steel (general, pipe)1.370-
Steel (section)1.420-
CLT0.437−1.204
MDF0.857−0.644
GLT0.512−0.896
Aluminum (general)8.240-
Glass0.850-
Iron (general)1.910-
Table 3. Embodied-carbon values of transportation methods.
TransportationCarbon (kgCO2e/kg/km)
By sea0.000017
By rail0.000027
By road0.000107
Table 4. Material transportation scenarios.
MaterialRaw Material
(A1)
Manufacturing Products
(A3)
Construction
(A5)
Steel (imported)L: Osaka (Japan)L: Pohang (Korea)
D: 761 km (by sea)
KOREATECH (Korea)
D: 249 km (by road)
GLT (imported)L: Vancouver (Canada)L: Incheon (Korea)
D: 9351 km (by sea)
KOREATECH (Korea)
D: 128 km (by road)
GLT (domestic)L: Ganneung (Korea)L: Incheon (Korea)
D: 237 km (by road)
KOREATECH (Korea)
D: 128 km (by road)
Table 5. Analysis cases and properties of materials.
CaseMaterialCarbon StorageElastic Modulus
(ksi)
Yield Strength
(ksi)
Density
(lb/in3)
ECC
(kgCO2e/kg)
1Steel (general)-30,458
(210,000 MPa)
40
(275 MPa)
0.2836
(7850 kg/m3)
1.37
2GLT (imported)No1595
(11,000 MPa)
1.105
(7 MPa)
0.0206
(570 kg/m3)
0.512
3GLT (imported)Yes−0.896
4GLT (domestic)No0.512
5GLT (domestic)Yes−0.896
Note: 1 MPa = 0.14504 ksi; 1 kg/m3 = 0.000036127 lbs/in3; 1 lb = 0.4536 kg.
Table 6. Parameters of CSA.
DN t m a x fl A P m a x A P m i n FARublb
Depends on problem101000 (10 bar)
2000 (17 bar)
1000 (22 bar)
20.40.010.410000.1
Table 7. Area and constraint results of 10-bar truss structure (unit: mm2).
VariablesSteelGLT
A 1 6.228291.313
A 2 0.1000.100
A 3 8.261180.205
A 4 2.42990.765
A 5 0.1003.597
A 6 0.1004.057
A 7 4.571151.850
A 8 3.259145.896
A 9 3.510127.887
A 10 0.1000.100
σ m a x (MPa)40.000−1.105
δ m a x (mm)−3.168−1.750
Weight (kg)4759.4358692.408
Table 8. Area and constraint results of 17-bar truss structure (unit: mm2).
VariablesSteelGLT
A 1 33.616344.669
A 2 0.100127.904
A 3 11.434503.673
A 4 23.77151.261
A 5 16.831280.376
A 6 0.1003.236
A 7 8.144182.749
A 8 0.1004.338
A 9 4.989211.631
A 10 3.374566.670
A 11 4.881346.404
A 12 15.760138.544
A 13 4.423137.264
A 14 15.017151.003
A 15 7.6580.100
A 16 6.555131.129
A 17 0.1680.100
σ m a x (MPa)−40.0001.105
δ m a x (mm)−1.870−1.322
Weight (kg)4753.0587377.578
Table 9. Area and constraint results of 22-bar truss structure (unit: mm2).
VariablesSteelGLT
G 1   ( A 1 ~ A 4 )1.55356.065
G 2   ( A 5 ~ A 6 )0.1000.100
G 3   ( A 7 ~ A 8 )2.35514.476
G 4   ( A 9 ~ A 10 )0.1000.100
G 5   ( A 11 ~ A 14 )0.1000.100
G 6   ( A 15 ~ A 18 )0.88268.667
G 7   ( A 19 ~ A 22 )1.0460.100
σ m a x (MPa)−39.999−1.105
δ m a x (mm)−1.216−0.673
Weight (kg)1235.3662703.877
Table 10. Area and constraint results of 120-bar truss dome structure (unit: mm2).
VariablesSteelGLT
G 1   ( A 1 ~ A 12 )0.2676.922
G 2   ( A 13 ~ A 24 )1.02022.505
G 3   ( A 25 ~ A 36 )2.0573.946
G 4   ( A 37 ~ A 60 )0.41517.299
G 5   ( A 61 ~ A 84 )0.48836.551
G 6   ( A 85 ~ A 96 )0.1485.687
G 7   ( A 97 ~ A 120 )0.90616.743
σ m a x (MPa)−40.000−1.105
δ m a x (mm)−2.000−1.932
Weight (kg)5093.0258036.328
Disclaimer/Publisher’s Note: The statements, opinions and data contained in all publications are solely those of the individual author(s) and contributor(s) and not of MDPI and/or the editor(s). MDPI and/or the editor(s) disclaim responsibility for any injury to people or property resulting from any ideas, methods, instructions or products referred to in the content.

