Abstract
At the 75th United Nations General Assembly, China committed to peaking carbon dioxide emissions by 2030 and achieving carbon neutrality by 2060. In response, the national standard “General Specification for Building Energy Conservation and Utilization of Renewable Energy” has been adopted across 20 provinces and cities in seven major regions, including North China, Northeast China, and South China. These regions have implemented stringent energy-saving and emission reduction reviews and quota requirements. Despite this, there is limited research on comprehensive life cycle carbon emission calculations and carbon reduction designs. This study addresses this gap by focusing on economically developed regions with high population density and substantial energy-saving potential, specifically targeting the warm winter and hot summer regions of China. Using a commercial building in Shenzhen as a case study, we established a carbon emission accounting model based on the life cycle assessment (LCA) method. We calculated carbon emissions during the material phase using the project’s bill of quantities and relevant carbon emission factors. Additionally, we used the CEEB 2023 software to design energy-saving and emission reduction solutions for the building. Our comparative analysis reveals that the new design reduces the carbon emissions of the case study building by 13.5%. This reduction not only mitigates the environmental impact of construction but also contributes to the fight against the greenhouse effect, supporting the broader goal of sustainable development.
1. Introduction
In the past few centuries, human activities, especially the Industrial Revolution, have cumulatively impacted our planet, causing drastic changes in our climate. Climate change has increased the intensity and frequency of heatwaves, droughts, hurricanes, and other natural disasters, posing significant threats to human life on Earth. The combustion of fossil fuels as an energy source results in the increased concentration of greenhouse gases such as carbon dioxide (CO2), methane (CH4), and nitrous oxide (N2O) in the Earth’s atmosphere, leading to a rise in the average surface temperature, known as global warming [1]. Scientists predict that if environmentally harmful practices continue, the Earth’s average surface temperature could increase by 2–6 °C by the end of the 21st century [2,3]. Therefore, it is our responsibility to control greenhouse gas emissions in every possible way. To achieve the goal of reducing CO2 emissions by 45% by 2030 and reaching net-zero carbon emissions by 2050, many countries have recently made legal commitments to cut CO2 emissions. However, there is a significant mismatch between global aspirations and current global CO2 emissions levels.
In September 2020, the Chinese government announced its plan to peak its carbon dioxide emissions before 2030 and aim for carbon neutrality by 2060. Further, the Chinese government proposed accelerating the establishment of a policy system for peak carbon emissions, carbon neutrality, and additional actions, particularly emphasizing energy; construction; critical points for carbon emissions reduction in industries like power, steel, and cement; and corresponding measures, and expediting the formulation of specific work timetables and pathways.
In March 2022, the Chinese Ministry of Housing and Urban-Rural Development issued a notice on the development plan for energy conservation and green building, clearly stating the need to strengthen the statistical and monitoring capabilities in the construction sector, improve the system and indicators for energy consumption statistics in the construction sector, and explore the establishment of a system for energy consumption statistics in urban infrastructure [4]. Standards, systems, and methodologies related to building carbon emissions have attracted significant attention as the foundational technologies for the “dual carbon” work in the construction sector [5]. Therefore, against the backdrop of global carbon peaking and neutrality, it is urgently necessary to clarify the calculation of carbon emissions in the construction sector, delineate the mechanisms for energy conservation and carbon reduction in buildings, enhance the level of energy-saving technologies in buildings, and explore the implementation path for dual carbon goals in buildings.
The existing methods for calculating building carbon emissions mainly include input–output analysis, life cycle assessment (LCA), the measured method, and the intensity estimation method. Input–output analysis combines economic input–output tables and relevant environmental data to convert monetary value into carbon emissions, capturing the entire supply chain’s carbon emissions. However, it faces issues of less accurate macro-level analysis. The measured method achieves accurate data but is challenging and time-consuming, and it is unable to measure processes that have not occurred. The intensity estimation method is simple to operate and calculate but provides coarse results, being more of an approximation than a detailed analysis [6]. This project aims to establish a more operationally robust carbon emissions calculation model based on the LCA method. The project will use CEEB software to design, simulate, and compare carbon emission data from the building operation phase in order to identify an energy-saving and emission-reduction scheme suitable for the building [7,8].
2. Data and Methodology
2.1. Basis of Calculation
2.1.1. Main Standards
Currently, the green and low-carbon standard system in the field of architecture in China is still under development. The mainstream standards related to building carbon emission calculations include the “Building Carbon Emission Calculation Standard” (GBT 51366-2019 [9]), the “Building Carbon Emission Measurement Standard” (CECS 374-2014 [10]), Guangdong Province’s “Guidelines for Building Carbon Emission Calculation “, and Xiamen City’s “Building Carbon Emission Accounting Standard” DB 3502/Z 5053-2019 [11].
2.1.2. Key Accounting Points
- (1)
- Carbon emissions during the production and transportation stages of building materials [12] include the total carbon emissions from the production and transportation of primary building materials, such as steel bars, cement, and bricks, from the production site to the construction site [13]. By referring to engineering construction-related technical data such as design drawings and procurement lists, the amount of building materials consumed for the construction is determined. When calculating, we select the primary building materials with a weight no less than 90% of the total weight of building materials consumed in construction [14]; building materials with a weight percentage lower than 1% can be excluded from the calculation [15].
- (2)
- Construction phase carbon emissions include carbon emissions from the completion of sub-projects and implementation processes, as well as carbon emissions generated by construction personnel living and working on-site. The calculation is based on the project’s phase using actual construction energy consumption data and estimated construction energy consumption values.
- (3)
- During the operational phase of building, carbon emissions primarily stem from energy and resource consumption. Taking residential buildings as an example, energy and resource consumption mainly focus on air conditioning systems, lighting systems, power equipment, and domestic hot water and gas. Carbon emissions arise from the release of energy consumption from various operating systems. Energy consumption monitoring methods and resource accounting methods can be employed for completed projects. For projects yet to be built, energy consumption simulation methods and calculation methods based on design standard parameters are recommended.
- (4)
- Carbon emissions in the demolition phase include carbon emissions generated from mechanical dismantling, manual dismantling, and the energy consumption associated with the transportation of construction waste. In the absence of actual dismantling data, empirical formulas can be used for calculation.
- (5)
- Carbon sequestration amount primarily refers to the carbon absorption from greening measures, with vegetation greening being the main approach for building carbon sequestration. The types and areas of construction carbon sequestration can be obtained from architectural blueprints.
2.2. Establishment of Carbon Emission Accounting Model
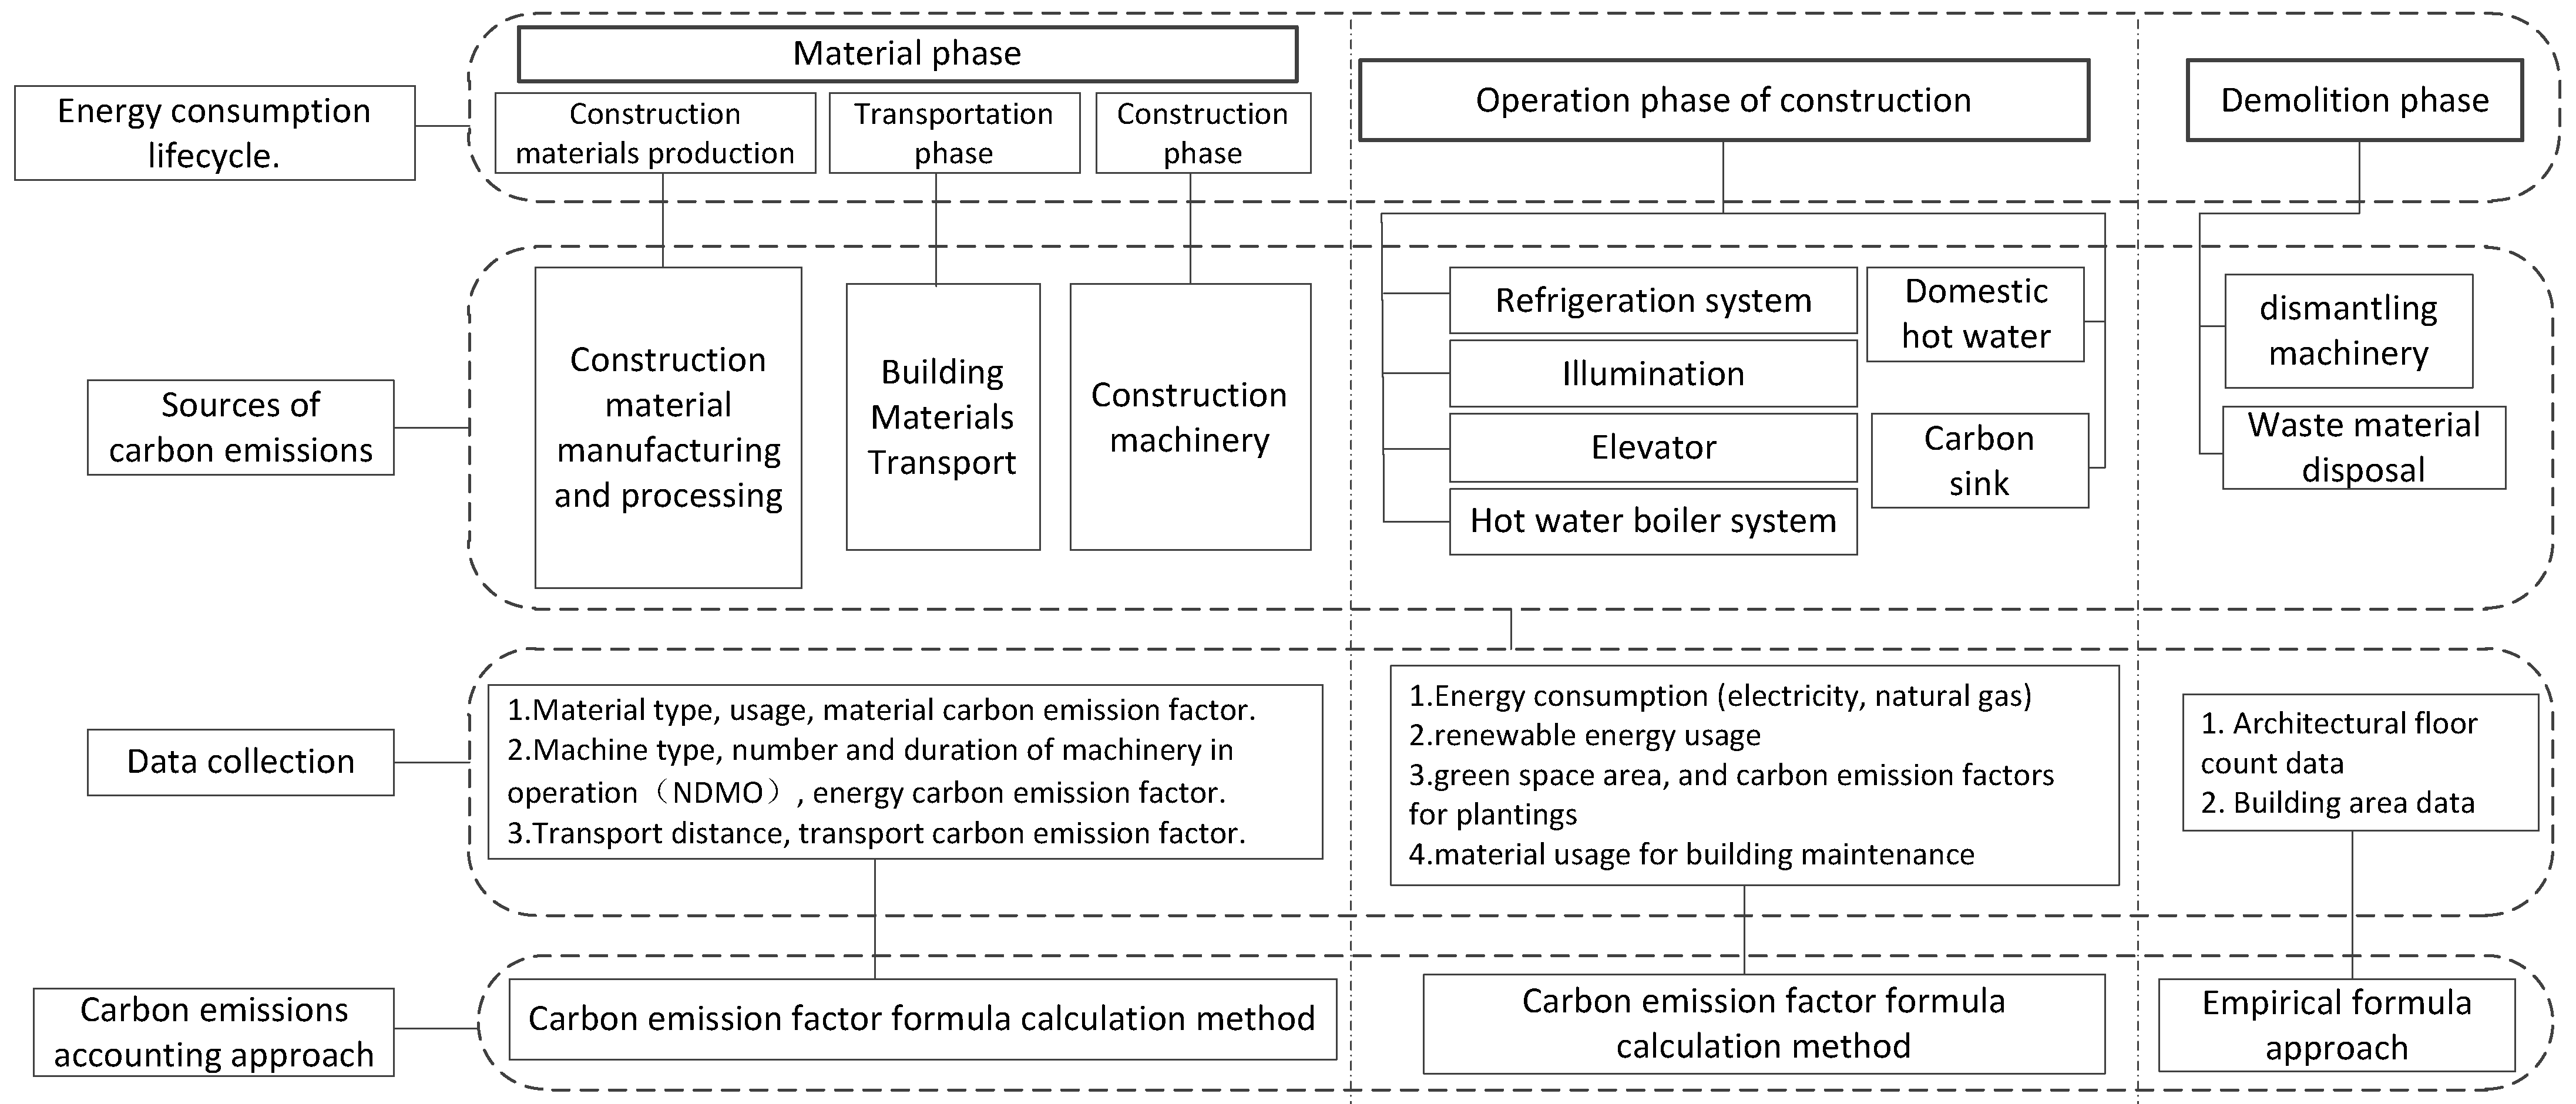
The carbon emissions accounting boundary for the full life cycle includes the material phase, building operation phase, and demolition phase. The material phase’s carbon emissions originate from the production and processing of building materials, transportation, and the energy consumption of construction machinery. The building operation phase’s emissions stem from cooling systems, hot water boilers, lighting, domestic hot water, elevators, and the carbon reduction effect due to green space carbon sequestration. The demolition phase’s emissions are due to the energy consumed by demolition machinery and the disposal of waste materials.
In accounting for carbon emissions during a building’s life cycle, we employ carbon emission factor calculation during the physical stage, gathering data on materials, machinery, transport distances, and corresponding emission factors. For buildings in operation, carbon emissions calculations fall into two scenarios: one involves collecting annual energy consumption records to determine carbon emissions during operation; the other anticipates emissions for buildings in the design or retrofitting phase via design simulations and software to predict future operational carbon emissions. The case project uses THS’s Building Carbon Emission (CEEB) software for simulation and carbon reduction design, yielding carbon emission data for systems like cooling, heating, air conditioning, lighting, outlets, and elevators during operation. For demolition, we assess emissions based on building floor and area data using empirical formulas, as demonstrated in Figure 1.
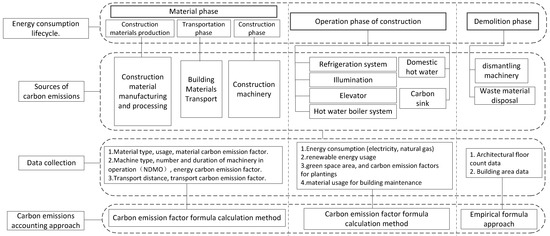
Figure 1.
The carbon emission accounting model. The figure is derived from a literature synthesis [16,17,18,19] and the author’s design.
2.3. Architectural Carbon Emission Accounting Formula
2.3.1. Carbon Emissions during Building Operations
The calculation scope for carbon emissions during the building operation phase includes HVAC, domestic hot water, lighting and elevators, renewable energy, and the building’s carbon sinks. The carbon emissions here include greenhouse gases such as CO2, CH4, N2O, etc. Using CO2 as the baseline, the warming effects of a certain greenhouse gas produced over a certain period of time are converted into equivalent CO2 emissions. This article expresses in terms of CO2 equivalents. Carbon emissions should be determined based on the energy consumption of different systems and the carbon emission factors of various types of energy. The carbon emissions per unit of built area and the total carbon emissions during the building operation phase are calculated as follows:
- —Carbon emissions per unit building area during the operational phase ().
- —Annual consumption of the iᵗʰ type of energy for the building (unit/year).
- —Carbon emission factor for the iᵗʰ type of energy.
- —Energy consumption of the iᵗʰ type by system j (unit/year).
- —Renewable energy provided to system type j for the iᵗʰ energy type (unit/year).
- i—Types of end-use energy consumed by the building, including electricity, gas, oil, and district heating.
- j—Building energy system types, including heating and air conditioning, lighting, and domestic hot water systems.
- —Annual carbon sequestration of the building’s green space (year).
- y—Building’s designed lifespan (years).
- A—Building area (m2).
2.3.2. Construction Phase Carbon Emissions
We calculate the total energy consumption during the construction phase using the construction procedure energy consumption estimation method. We compute the building construction phase’s carbon emissions as:
- —Carbon emissions per unit of the built-up area during construction ().
- —Total energy consumption of the ith type during the construction phase (kWh or kg).
- —Carbon emission factor for the ith energy type ().
- A—Constructed area (m2).
2.3.3. Material Production Phase Carbon Emissions
We account for carbon emissions during the material production phase as:
- —Carbon emissions during the material production phase ().
- —Energy consumption for the ith main construction material.
- —Carbon emission factor for the ith main construction material ().
2.3.4. Material Transportation Phase Carbon Emissions
We ascertain carbon emissions during the material transportation phase as:
- —Carbon emissions during the material transportation process ().
- —Energy consumption for the ith main construction material (t).
- —Average transportation distance for the ith main construction material (km).
- —Carbon emission factor per unit weight per transportation distance for the transportation mode of the ith material.
2.3.5. Demolition Phase Carbon Emissions Calculation
According to the “Guidelines for Building Carbon Emission Calculation” of Guangdong Province of China, the energy consumption of building construction, the emissions during the construction process, and the simplified relationship with the number of building stories are:
where X represents the number of above-ground stories of the building and Y denotes the carbon emissions per unit area, measured in .
3. Results
3.1. Project Overview
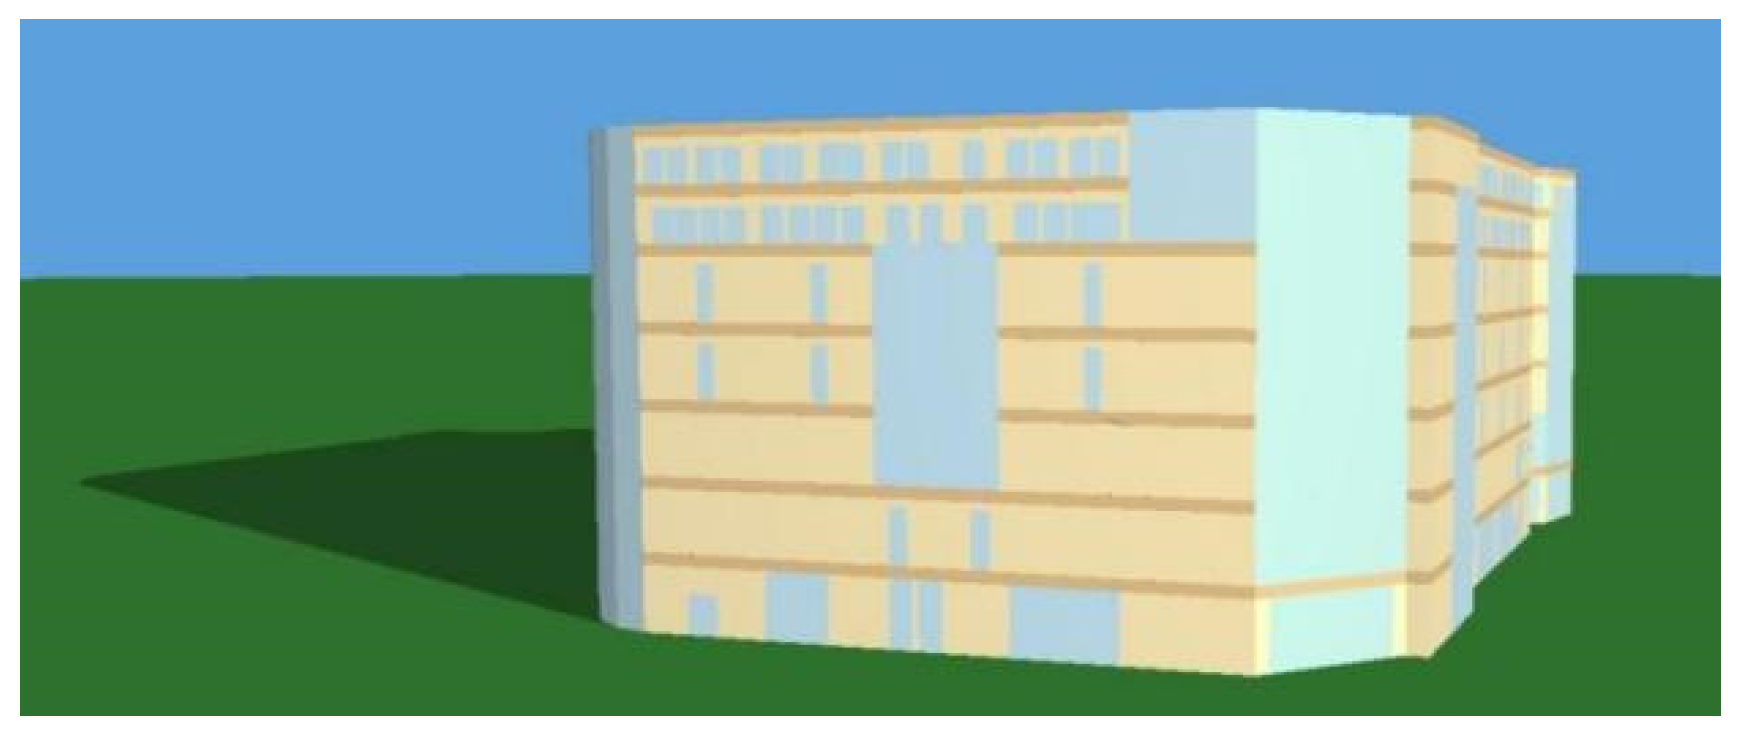
The project is a shopping mall building in Shenzhen, Guangdong, located at 23.30° N and 113.83° E. The design life span is 50 years, with seven above-ground stories reaching a height of 33.6 m, a total floor area of 27,783 square meters, and an orientation angle of 90° north. The solar radiation absorption coefficients for the external walls and the roof are both 0.75. Figure 2 is an observational image of the building model.

Figure 2.
Building model observational image.
3.2. Sources of Basic Data
To calculate and analyze building carbon emissions, it is necessary to collect relevant basic data. Following the analysis of carbon emission sources described earlier and using the established accounting model, one must acquire the required data in the following ways:
- (1)
- The carbon emissions from the material phase encompass the total emissions from material production, transportation, and the construction stage. The types and quantities of materials, types and quantities of machinery, and the types and amounts of energy required for carbon emission calculations all come from the bill of quantities of the case project’s labor and machinery [20].
- (2)
- Operational phase carbon emissions calculations must ascertain the annual energy consumption of air conditioning, lighting, elevators, and household appliances. To measure emissions in this phase, the relevant standards and literature should be combined with THS’s carbon emission professional software, CEEB, to set the parameters for the enclosure structure, lighting system, elevator, and air conditioning energy consumption.
- (3)
- The case building is currently in operation and has not yet entered the demolition and scrapping phase [21]. Empirical estimation methods are used for carbon emissions in this stage [22].
- (4)
- The sources of carbon emission factors are from Chinese standards and research data of other scholars, detailed in Table 1.
 Table 1. Sources of basic data.
3.3. Calculation of Carbon Emissions in the Material Phase
3.3.1. Carbon Emissions in the Production Stage of Building Materials
Here, the total emissions without the material recycling coefficient from the production of building materials stood at 13,870.63 tons, which was derived from Equation (3), as shown in Table 2.
Table 2.
Summary of carbon emissions in the building material production phase.
3.3.2. Carbon Emissions in the Building Material Transportation Stage
We evaluated the carbon emissions from the transportation of construction materials. Concrete, sourced locally and transported by road at an average distance of 40 km, contrasts with other materials, which are transported over an average distance of 500 km, as summarized in Table 3 based on Equation (5).
Table 3.
Summary of carbon emissions in the building material transportation stage.
3.3.3. Carbon Emissions during the Construction Phase
The construction phase emissions were deduced from the machinery and energy consumption listed in the project inventory. By consulting building carbon emission metrics and applying carbon emission factors, we obtained a total of 8,070,586.72 kg, as detailed in Table 4.
Table 4.
Summary table of carbon emissions during the construction phase.
3.3.4. Summary of Carbon Emissions in the Material Phase
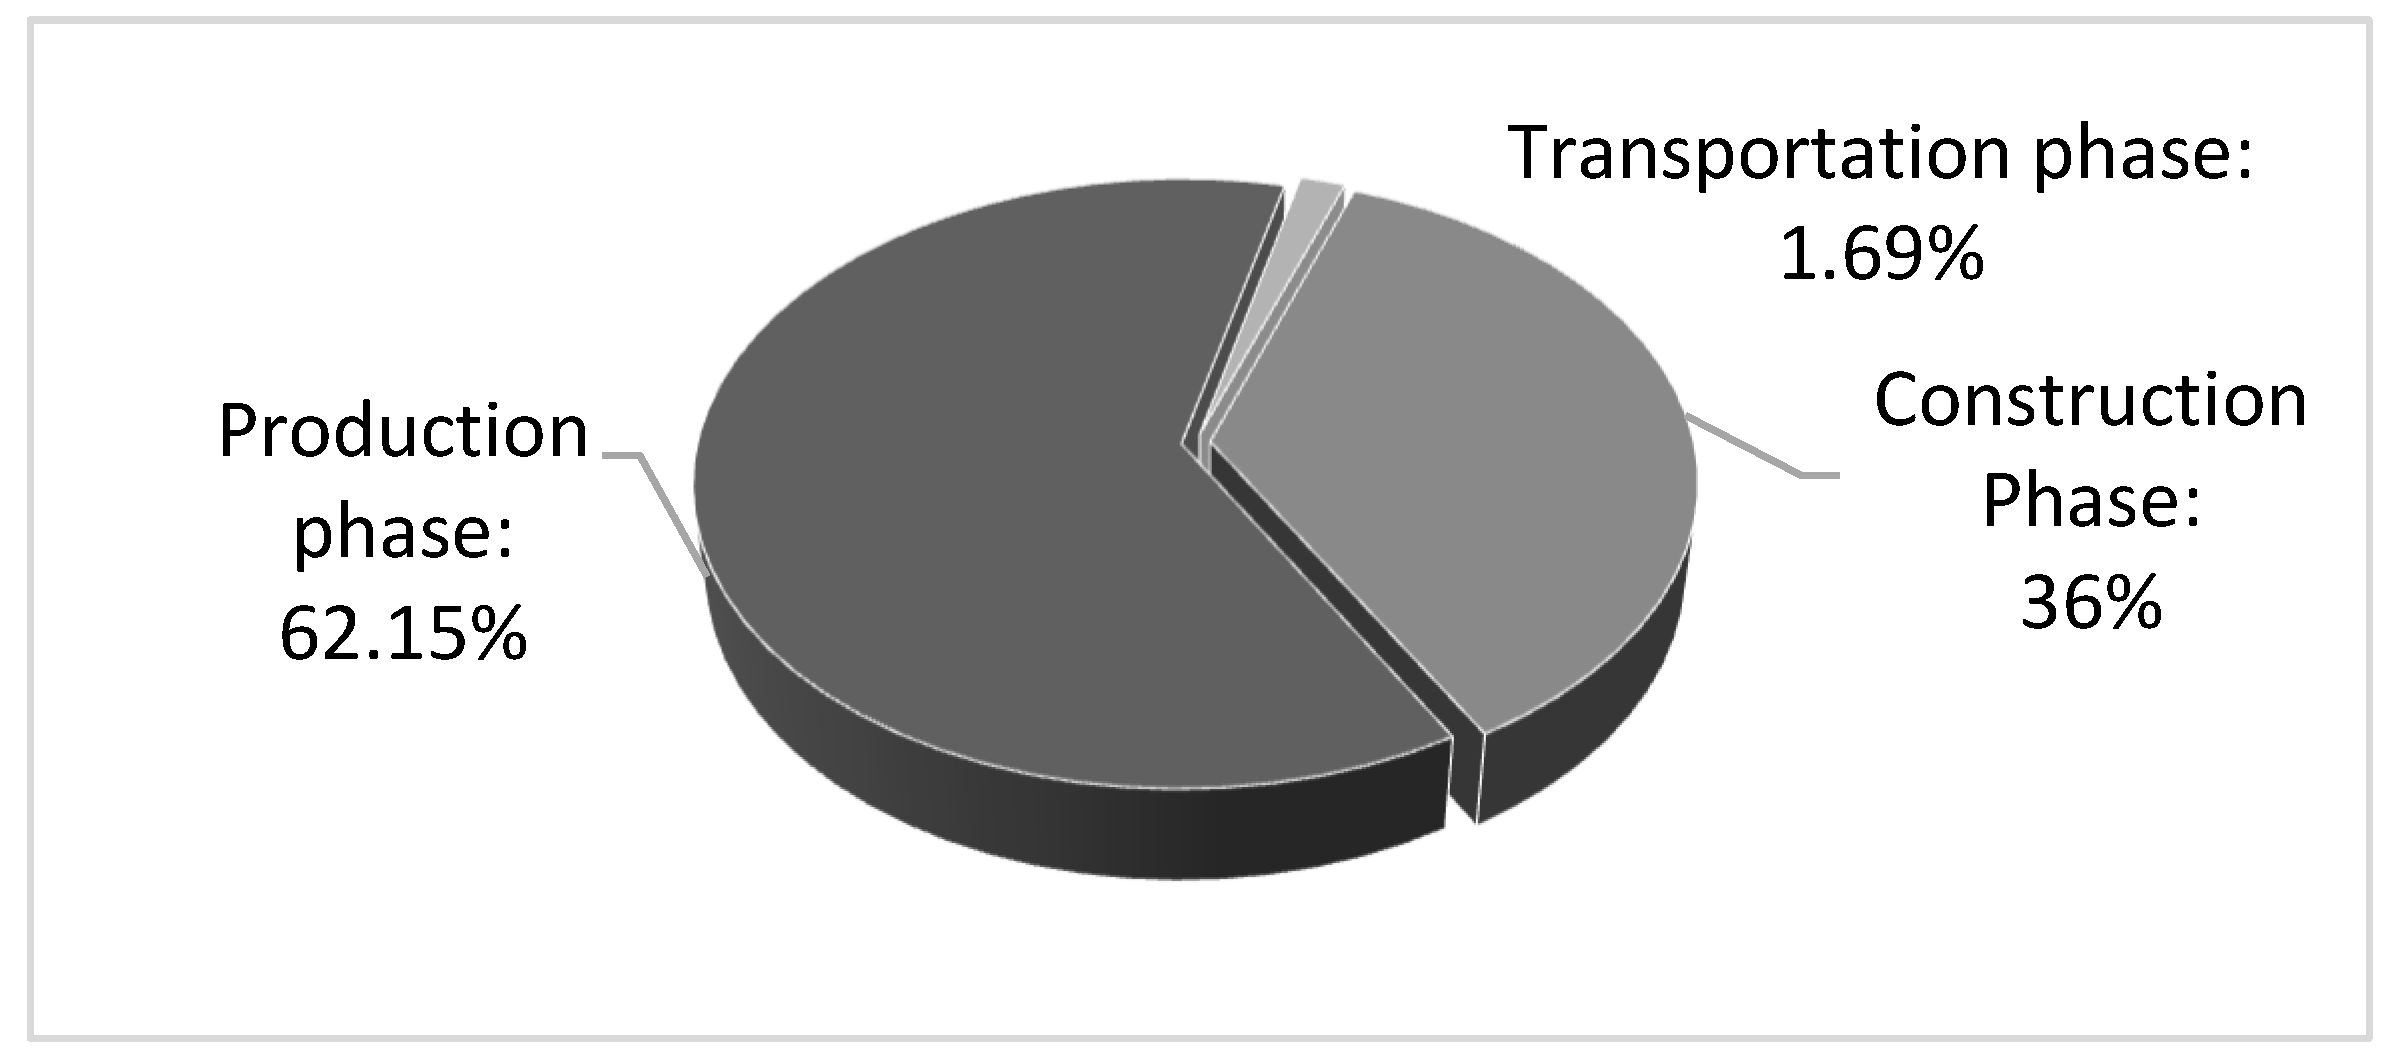
The material phase includes the production phase of building materials, the transportation phase, and the construction phase. The summarized results of the material phase for this case are shown in Table 5, and the analysis diagram is shown in Figure 3.
Table 5.
Summary table of carbon emissions during the material phase.

Figure 3.
Analysis of carbon emission in the material phase.
3.4. Carbon Emission in the Operation Phase
3.4.1. Carbon Sinks
Our research targets an independent shopping mall with a construction area of 27,782 square meters. Besides this structure, the complex includes office buildings and high-rise residential areas. Details on the park’s vegetation types and areas appear in Table 6. We allocate carbon sequestration to the building based on its proportional construction area, applying the standard carbon fixation parameter per square meter. Over 50 years, the total carbon sequestration for saplings amounts to 917.66 tons, as summarized in Table 6.
Table 6.
Summary table of carbon sequestration in the carbon sink.
3.4.2. Analysis of Carbon Emission in the Operation Phase
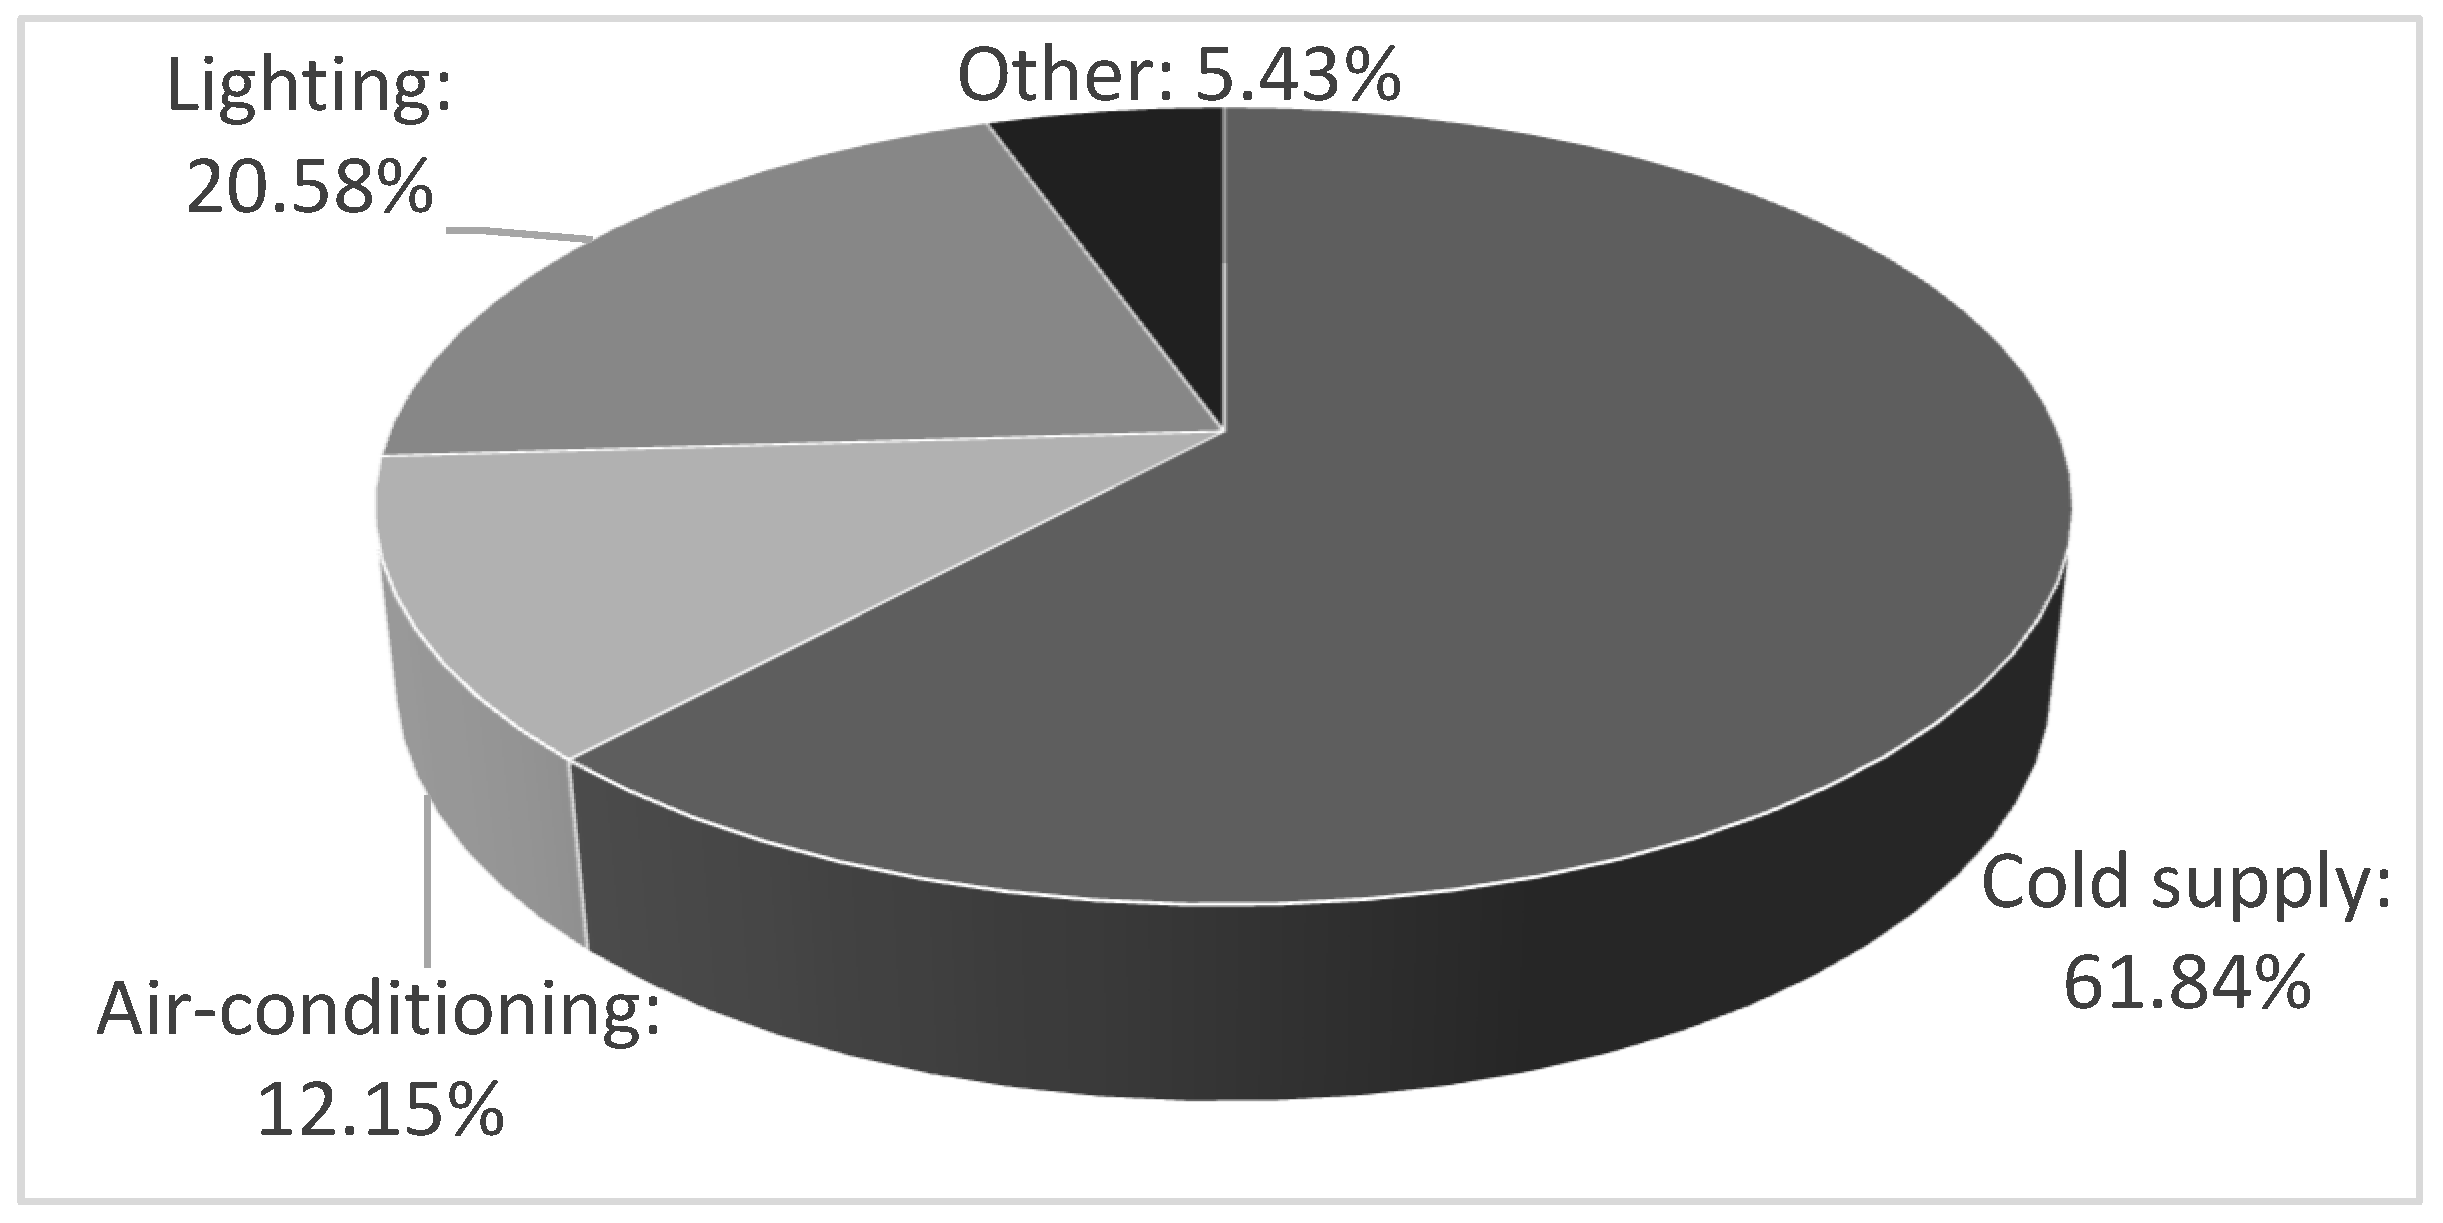
Equations (1) and (2) were utilized to calculate carbon emissions during the operation phase, as detailed in Table 7, with the analytical diagram presented in Figure 4.
Table 7.
Analysis table of carbon emissions in the operation phase.
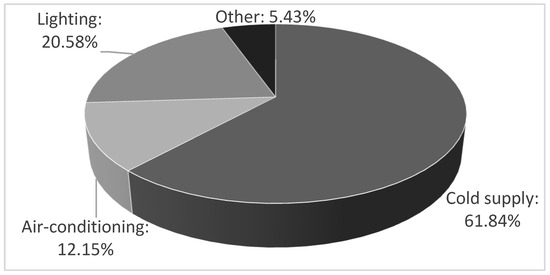
Figure 4.
Analysis of carbon emissions in the operation phase.
3.5. Demolition Phase Carbon Emissions
By applying Equation (5) to calculate the carbon emissions during the demolition phase, can estimate these emissions, with ‘A’ representing the area. This project’s demolition carbon emissions calculations are shown in Table 8.
Table 8.
Emissions inventory for building demolition phase.
3.6. Summary of Carbon Emissions throughout the Entire Life Cycle of a Building
Carbon emissions throughout a building’s entire life cycle encompass the material phase, operational phase, and demolition phase, with the operational phase being the most significant in terms of emissions. Thus, it is the most critical stage for carbon reduction efforts. The detailed data and analysis results are shown in Table 9 and Figure 5.
Table 9.
Summary of carbon emissions throughout the whole life cycle of a building.
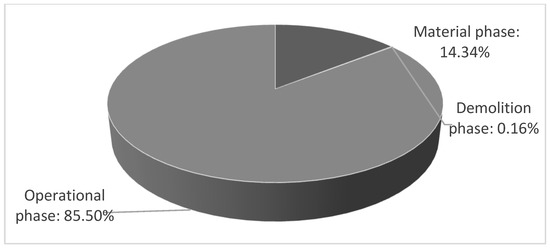
Figure 5.
Analysis of carbon emission proportions throughout a building’s entire life cycle.
4. Discussion of Carbon Reduction Strategies
4.1. Purpose of Carbon Reduction Design
China’s GB 55015-2021 [31] “General Code for Energy Conservation and Renewable Energy Utilization in Buildings” stipulates that an average of 40% should reduce the carbon emission intensity of new residential and public buildings based upon the energy-saving design standards implemented in 2016. The GB/T 50378-2019 [32] “Assessment Standard for Green Building” specifies that construction projects should analyze carbon emissions and adopt measures to lower carbon intensity per unit area, with a rating value of 12 points. These regulations underpin the purpose of carbon reduction design and serve as essential references for achieving the “dual carbon” goals.
4.2. The Project’s Carbon Reduction Strategies at Various Stages
Data analysis reveals that emissions from the operational phase are predominant; thus, targeted carbon mitigation analyses and designs are crucial. Reducing emissions during operations focuses on the carbon outputs caused by air conditioning, heating, and lighting [33]. Deductions from solar photovoltaic and wind turbine energy savings are also relevant. Priority should be given to the building’s intrinsic design—shading, maintenance structure, HVAC systems, and the impact of the carbon sequestration system during operation. Currently, the optimization of domestic hot water, elevators, and renewable energy sources is not under consideration [34].
4.2.1. Shading Analysis
In hot-summer and warm-winter regions, solar radiation through windows significantly impacts air-conditioning loads and indoor thermal environments. Architectural shading is a key measure used to address this. External shading can dramatically decrease annual per-area carbon emissions [35]. Shading improves internal environmental comfort, light control, ventilation, and blocks excessive heat from entering, culminating in reduced indoor temperatures and HVAC energy needs, thus lowering energy consumption and carbon emissions [36]. This project implemented 0.5 m of external shade.
4.2.2. Maintenance Structure
Enhancing the thermal performance of a building’s maintenance structure can markedly reduce heating and cooling loads, leading to energy savings and lowered carbon emissions. Improving insulation reduces heat loss through the structure, thus diminishing carbon emissions in the operational phase [37].
In the maintenance structure design, the heat transfer coefficient of the roof and the exterior wall is changed. As shown in Table 10, the annual cumulative cooling consumption demonstrates that the smaller the heat transfer coefficient, the lower the annual cumulative cooling consumption, and the carbon emission is also low, as shown in Figure 6.
Table 10.
Structural parameters of building maintenance.
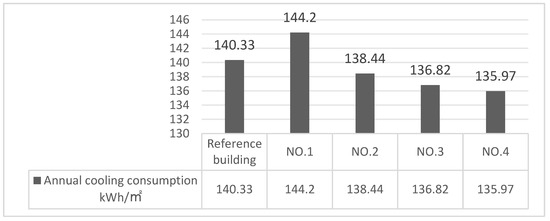
Figure 6.
Total annual cooling consumption of the building.
From the perspective of maintaining building structures, opting for low-carbon materials is an effective way to cut emissions throughout a building’s life cycle. Concrete, cement, steel, and aluminum in buildings are major sources of carbon emissions [38,39]. Research indicates that using low-carbon construction products can reduce the total life cycle carbon emissions by around 10%. Materials certified for environmental performance or other low-carbon certifications can result in lower emissions under identical design conditions. Renewable materials, hemp concrete, shell concrete, and straw are emerging trends in the field of low-carbon building materials.
4.2.3. Carbon Reduction Strategies during the Material Phase
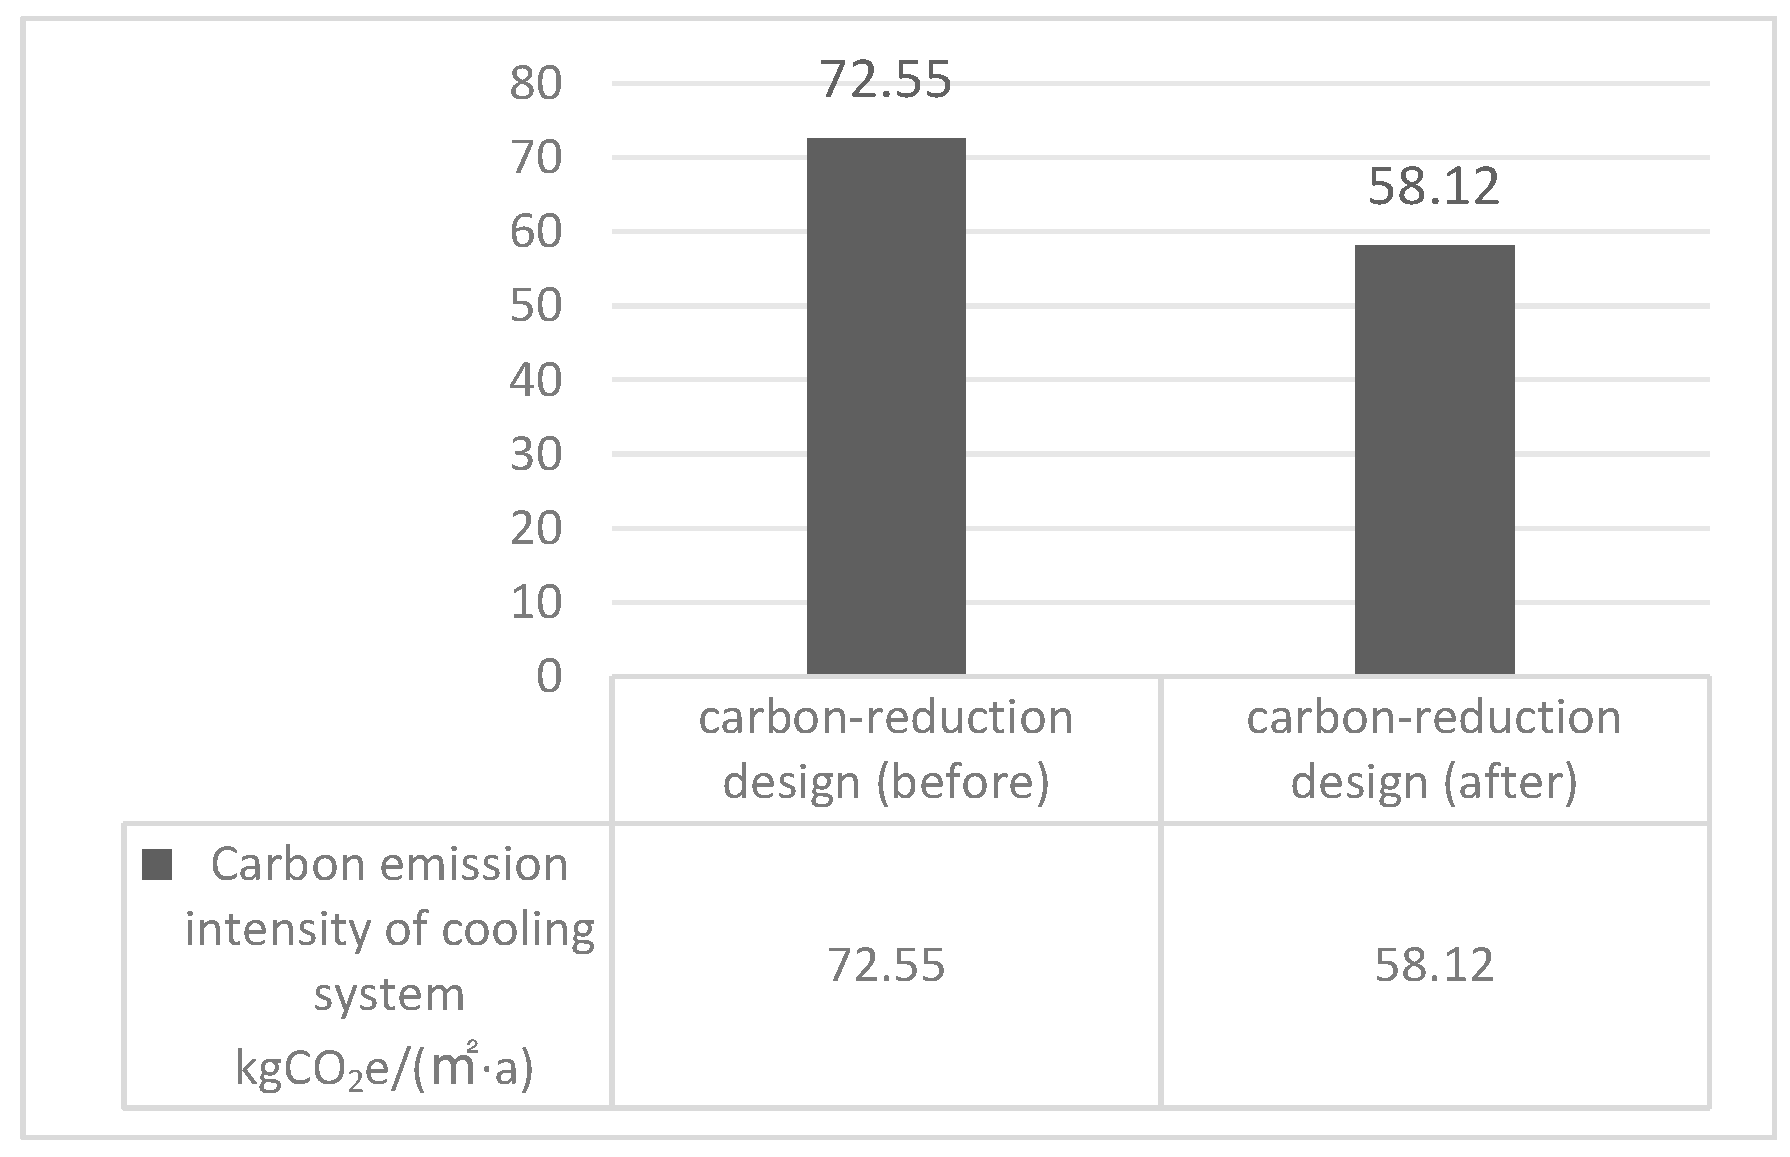
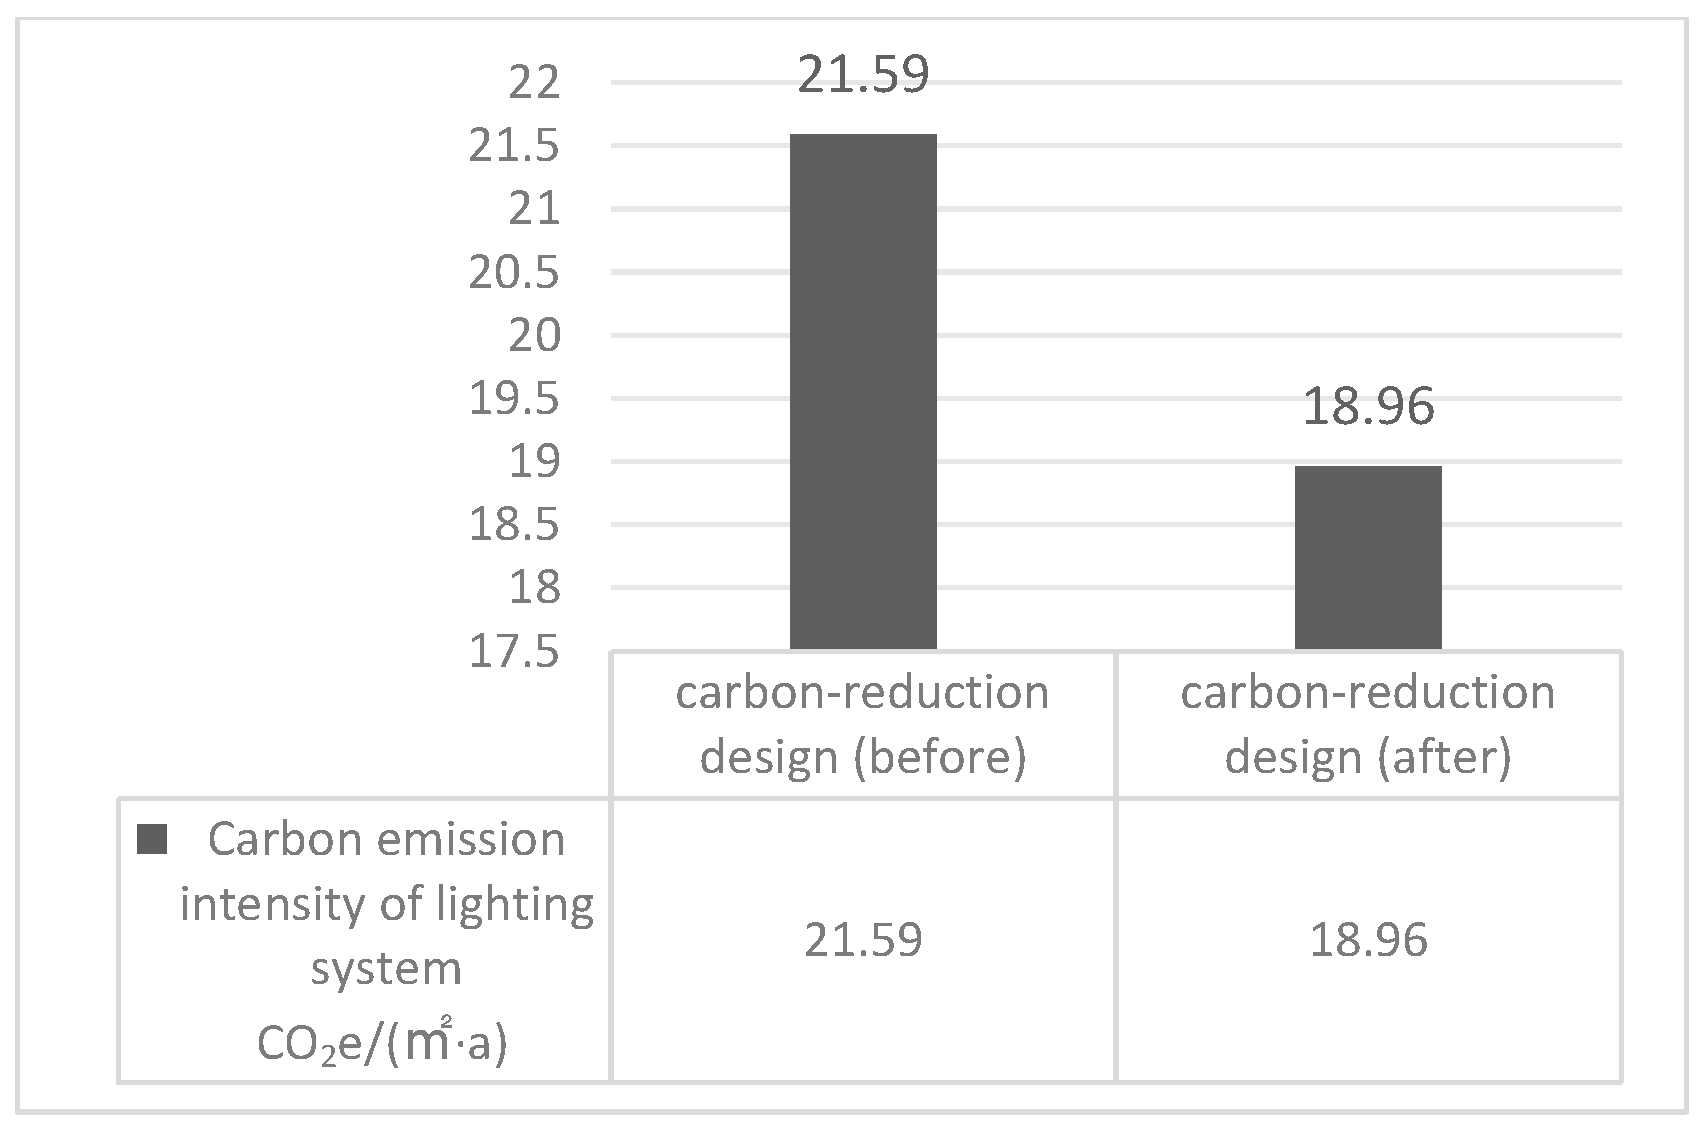
Malls have extended operational hours and strict indoor climate control, resulting in high energy consumption by air conditioning systems [40]. These form the primary application of carbon reduction technologies in commercial buildings. The case study project implemented an efficient air conditioning system, replaced with magnetic levitation chillers, variable frequency pumps, and high-efficiency LED lighting [41]. Figure 7 and Figure 8 illustrate a before-and-after design comparison of carbon emission intensities for the cooling system and lighting system, respectively.
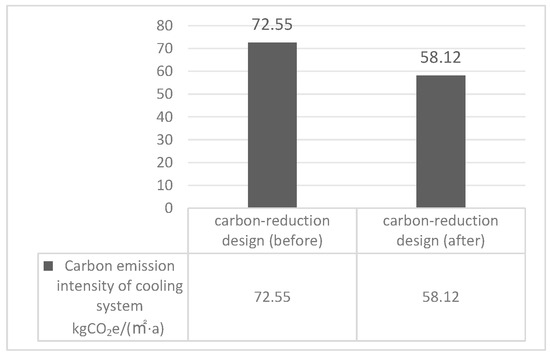
Figure 7.
Comparison of carbon emission intensity before and after air conditioning system design was implemented.
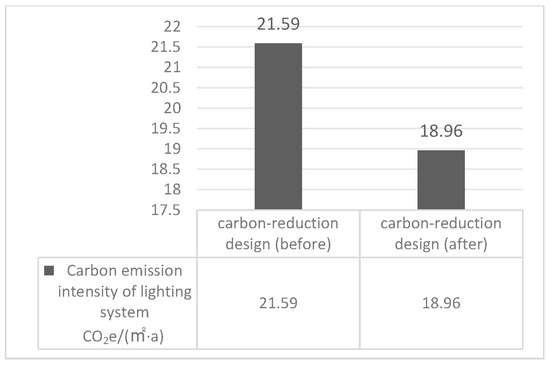
Figure 8.
Comparison of the carbon emission intensity before and after the lighting system design was implemented.
This case study focuses on an existing project. The starting point of this research is to execute a carbon reduction design during the usage phase using CEEB software simulation. A comparison of before and after the design implementation pinpoints carbon reduction breakthroughs, but carbon reduction design during the material phase is beyond the empirical scope of this study. That being said, energy conservation and emission reduction in the material phase typically follow the measures outlined below [42].
- (1)
- Employment of systemized standardized temporary facilities during construction.
To achieve carbon reduction goals, all temporary structures during project construction should use systemized standardized temporary facilities [43]. Office areas should use standardized container houses and detachable prefabricated rooms; construction sites should adopt standardized temporary hole edge protection, standardized processing sheds, standardized fences, prefabricated modular roadway plates and steel roadway solutions, and standardized safety passages. All auxiliary facilities like lifting cages, concrete hoppers, and construction elevator safety doors should have standardized production.
- (2)
- Increase in green material usage proportion and the formulation of rational material transport plans.
In terms of material production and transportation, choosing energy-saving and eco-friendly materials is one of the key actions in executing energy-saving design standards. Considering material lifespan and recyclability, opting for high-strength, high-temperature resistant, corrosion-resistant, high-performance, and recyclable building materials can decrease carbon emissions related to building maintenance during operation phases as well as reduce carbon emissions from constructing new materials by recycling used materials. Moreover, “local sourcing” can directly decrease building material transportation distance, while selecting appropriate transportation tools according to different material needs enhances transport efficiency, both contributing to lowered total carbon emissions during transportation.
Utilize high-strength steel or waste materials to reduce raw material production and to lower carbon emissions. Substituting ordinary building materials with waste materials enhances the material utilization rate, reducing production volume.
4.2.4. Optimizing the Energy Structure and Enhancing the Utilization Rate of Clean Energy
Vigorously developing clean energy is a crucial lever for achieving carbon peak and carbon neutrality goals. Establishing an efficient and rational renewable energy system for buildings, such as photovoltaic power generation, solar water heating, water-source heat pumps, and distributed wind energy generation, contributes to the green and sustainable development of buildings.
4.2.5. Employing Smart Technologies to Create an Informational Operation System
Digital technologies propel the “increase in sources and reduction of consumption” for building energy. They help construct a smart operations platform for buildings, reducing energy use in ventilation, air conditioning, and lighting. Integrating a full life cycle energy management system enables the visualization of energy consumption indicators and a high-energy consumption response. This enables energy scheduling and management to lower energy costs and reduces carbon emissions during operations [44].
4.2.6. Carbon Sequestration and Reduction
This project’s greening carbon sequestration approach involves horizontal greening in the park area, aiming to achieve a carbon reduction of 0.66 kg per square meter of building area annually. To enhance the carbon reduction effect, a combination of vertical greening and park greening or integrating greening with photovoltaic roofing could be implemented. The literature has demonstrated that combining photovoltaic rooftops with vertical greening can reduce up to 52% of neighborhood carbon emissions [45].
4.3. Comparison of Carbon Reduction after Design
After design and computation, the reduction in carbon emission intensity post-design is 14.9, surpassing the threshold of 7, confirming the efficacy of the carbon reduction design. Table 11 illustrates the change in building carbon emission intensity before and after the implementation of the carbon reduction design. Figure 9 compares the carbon emission intensity before and after implementing carbon reduction designs.
Table 11.
Comparison of the carbon reduction effects before and after the design’s implementation.
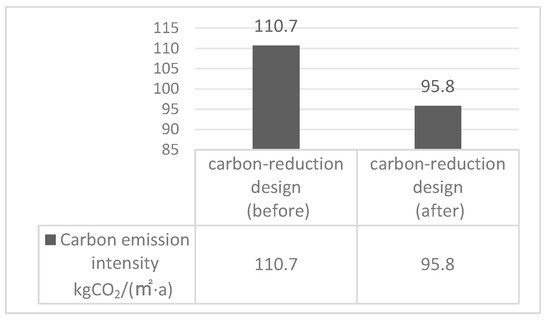
Figure 9.
Comparison of carbon reduction effects before and after the design’s implementation.
5. Conclusions
In conclusion, our research focused on calculating building carbon emissions and implementing carbon reduction strategies. The comparative analysis demonstrated that buildings designed with carbon reduction measures showed a 13.46% decrease in carbon emission intensity from pre-design levels. This highlights the crucial role of carbon accounting and reduction design in promoting energy saving and emission reduction in buildings.
We developed a life cycle assessment (LCA)-based carbon accounting framework that integrates the entire life cycle of a building into its energy consumption phases. These phases include material, operation, and demolition. We identified various carbon emission sources for each phase, proposed data collection methodologies, and matched appropriate accounting methods to these emissions. For the material phase, we considered emissions from production, transportation, and construction by extracting summary tables for materials, labor, and machinery for the case study buildings, followed by calculating the carbon emissions using emission factors. During the operational phase, we collected data on energy usage, renewable energy consumption, carbon sequestration, and maintenance materials, as well as applied carbon emission factors. The demolition phase used actual energy consumption for its carbon emission calculations, in contrast with the formula-based methods used for other phases.
Our case study of a commercial building in China’s hot-summer and cold-winter region revealed that the operational phase contributes the most to total life cycle carbon emissions, followed by the material and demolition phases. Therefore, energy conservation and emission reduction measures should prioritize the operational and material phases, although the demolition phase should also be adequately addressed in energy-efficient designs.
In terms of carbon reduction design, our study targeted the operational phase and found that a lower heat transfer coefficient for the building envelope significantly reduced carbon emissions. Additional strategies included modifying shading types, implementing high-efficiency air conditioning systems, and using energy-efficient lighting. Using THS’s CEEB software simulation, we observed significant energy-saving and emission-reduction effects through enhanced building shading, efficient air conditioning systems, and LED lighting. We proposed seven strategies for achieving energy conservation and emission reductions during the operational and material phases. Energy conservation and emission reduction are critical issues for society and humanity, forming part of the sustainable development path we must steadfastly pursue.
The limitations of this study lie primarily in two areas: identifying the most effective combination of emission reduction measures and understanding the cost implications of using heat-insulating materials for energy saving and emission reduction. These issues will be the focus of future research for our group, involving in-depth analysis and investigation.
Our research findings are applicable to the construction and usage stages of buildings, including design, procurement, construction, and operation phases. By applying our results before finalizing the design scheme, it is possible to assess in advance the environmental conditions, energy consumption, and carbon emissions during building operation. The real-time assessments of design modifications can help designers choose energy-efficient, low-carbon, environmentally friendly, and sustainable solutions, thereby reducing greenhouse gas emissions in the construction industry and contributing to environmental sustainability.
Author Contributions
All authors contributed to the design of this study. W.W., V.S. and S.E.: conceptualization, methodology, software, visualization, writing, and editing. L.L., V.S. and S.E.: data curation, investigation, and funding acquisition. W.W., L.L. and S.E.: formal analysis, investigation, writing, and review. All authors have read and agreed to the published version of the manuscript.
Funding
This research was funded by a first-class major in Shaanxi Province, grant number 2021008, and also supported by the National Natural Science Foundation project “Mechanism of Functional Transformation of Old Industrial Buildings Towards Green Energy Savings”, grant number 5167080889.
Institutional Review Board Statement
Not applicable.
Informed Consent Statement
Not applicable.
Data Availability Statement
The data used to support the findings of this study are available from the corresponding author upon request.
Conflicts of Interest
The authors declare no conflict of interest.
References
- Yang, Y.; Chen, F. Research on energy-saving coupling correlation of new energy buildings. Sustain. Energy Technol. Assess. 2023, 56, 103043. [Google Scholar] [CrossRef]
- Deng, G.; Lu, F.; Yue, X. Research on China’s embodied carbon import and export trade from the perspective of value-added trade. PLoS ONE 2021, 16, e0258902. [Google Scholar] [CrossRef] [PubMed]
- Guo, Q.; Wang, Y.; Dong, X. Effects of smart city construction on energy saving and CO2 emission. Appl. Energy 2022, 313, 118879. [Google Scholar] [CrossRef]
- Guo, C.; Bian, C.; Meng, C.; Huang, M.; Ma, Q. Study on carbon emissions and carbon reduction potential of Tianjin Eco-City Low Carbon Experience Center. Environ. Monit. Manag. Technol. 2022, 34, 7–11. [Google Scholar]
- Dong, Y.; Liu, J.; Dong, H.; Luo, G.; Sun, H. Study on building carbon emission analysis and carbon reduction pathways. Chongqing Archit. 2023, 22, 5–8. [Google Scholar]
- Jayasinghe, A.; Orr, J.; Ibell, T.; Boshoff, W.P. Minimising embodied carbon in reinforced concrete flat slabs through parametric design. J. Build. Eng. 2022, 50, 104136. [Google Scholar] [CrossRef]
- Keyhani, M.; Abbaspour, A.; Bahadori-Jahromi, A.; Mylona, A.; Janbey, A.; Godfrey, P.; Zhang, H. Whole life carbon assessment of a typical UK residential building using different embodied carbon data sources. Sustainability 2023, 15, 5115. [Google Scholar] [CrossRef]
- Heinonen, J.; Säynäjoki, A.; Junnila, S. A longitudinal study on the carbon emissions of a new residential development. Sustainability 2011, 3, 1170–1189. [Google Scholar] [CrossRef]
- GBT 51366-2019; Building Carbon Emission Calculation Standard. Ministry of Housing and Urban-Rural Development of the People’s Republic of China: Beijing, China, 2019.
- CECS 374-2014; Building Carbon Emission Measurement Standard. China Architecture Design & Research Institute: Beijing, China, 2014.
- DB 3502/Z 5053-2019; Building Carbon Emission Accounting Standard. Fujian Provincial Institute of Architectural Science Co., Ltd.: Xiamen, China, 2019.
- Li, H.; Song, F.; Wang, L. Research on carbon reduction and carbon neutrality measures in public buildings of universities. Archit. Econ. 2023, 44, 359–363. [Google Scholar]
- Zhang, R. Strategies for carbon reduction over the whole life cycle of ultra-low-energy buildings. Jiangxi Build. Mater. 2023, 8, 361–362. [Google Scholar]
- Lin, Y.R.; Yin, S.; Xiao, Y. Assessing the potential of carbon emission reduction in building interface renovation of traditional districts: The case of Guangzhou. Hous. Real Estate 2023, 15–20. [Google Scholar]
- Zhang, X.; Zheng, R.; Wang, F. Influence analysis of inventory selection on the physical carbon emission of rural buildings. J. Eng. Manag. 2020, 34, 51–55. [Google Scholar]
- Jiao, Y.; Lloyd, C.; Wakes, S. The relationship between total embodied energy and cost of commercial buildings. Energy Build. 2012, 52, 20–27. [Google Scholar] [CrossRef]
- Dixit, M.K. Life cycle recurrent embodied energy calculation of buildings: A review. J. Clean. Prod. 2019, 209, 731–754. [Google Scholar] [CrossRef]
- Wang, G. A Study on Carbon Emissions Accounting and Reduction Measures for Newly Constructed University Buildings Based on LCA. Master’s Thesis, Beijing University of Chemical Technology, Beijing, China, 2023. [Google Scholar]
- Chen, J.; Qiu, D.; Zhang, X.; Su, H.; Si, K. Analysis of technology and accounting of carbon reduction based on the “Green Building Assessment Standards”. Fujian Constr. 2023, 39–44. [Google Scholar]
- Liu, K. Research on Low-Carbon Design of Public Buildings with Large Spaces in Regions with Hot Summers and Cold Winters. Ph.D. Thesis, Southeast University, Nanjing, China, 2021. [Google Scholar]
- Wang, X. Research on Key Impact Factors in the Calculation Process of Carbon Emissions Throughout the Building Lifecycle. Master’s Thesis, Chongqing University, Chongqing, China, 2022. [Google Scholar]
- Wu, H.; Zhou, W.; Chen, K.; Zhang, L.; Zhang, Z.; Li, Y.; Hu, Z. Carbon emissions assessment for building decoration based on life cycle assessment: A case study of office buildings. Sustainability 2023, 15, 14055. [Google Scholar] [CrossRef]
- Zhuo, Y. New norms for the calculation of architectural carbon emissions and analysis of carbon reduction points in architectural design. Fujian Archit. 2023, 34–38. [Google Scholar]
- Zhang, S.; Wang, K.; Xu, W. Research on the choice of power carbon emission factors in standardized calculation of building carbon emissions. Build. Sci. 2023, 39, 46–57. [Google Scholar]
- Yu, Y. Research on Standardized Calculation Methods and Database for Carbon Emission Factors in Architectural Design. Master’s Thesis, Xi’an University of Architecture and Technology, Xi’an, China, 2023. [Google Scholar]
- Zhang, M. Establishing enterprise carbon emission factor measurement systems based on current status research on carbon emission factors. Metrol. Meas. 2022, 42–43. [Google Scholar]
- Xiao, J.; Guan, X.; Wang, D.; Wang, J. Research on carbon emission factors of recycled concrete. J. Archit. Civ. Eng. 2023, 40, 1–11. [Google Scholar]
- Zhang, X.; Zhang, A.; Zhang, A. Study on carbon emission factor calculation during road construction in cold and arid areas of Inner Mongolia. J. Inn. Mong. Univ. Sci. Technol. 2023, 42, 170–175. [Google Scholar]
- Tian, X. Study on Low Carbon Effect in the Construction Phase of Industrialized Residential Building Based on Carbon Emission Factor Method. Master’s Thesis, Shenyang Jianzhu University, Shenyang, China, 2016. [Google Scholar]
- Gao, C.; Nian, J.; Wang, F. Overview of carbon emission accounting methods and carbon emission factors during steel production stage. Contemp. Econ. Manag. 2021, 43, 33–38. [Google Scholar]
- GB 55015-2021; General Code for Energy Conservation and Renewable Energy Utilization in Buildings. Ministry of Housing and Urban-Rural Development: Beijing, China, 2021.
- GB/T 50378-2019; Assessment Standard for Green Building. Ministry of Housing and Urban-Rural Development of the People’s Republic of China: Beijing, China, 2019.
- Jeong, Y.-S.; Lee, S.-E.; Huh, J.-H. Estimation of CO₂ emission of apartment buildings due to major construction materials in the Republic of Korea. Energy Build. 2012, 49, 437–442. [Google Scholar] [CrossRef]
- Salama, A.; Farag, A.A.; Eraky, A.; El-Sisi, A.A.; Samir, R. Embodied carbon minimization for single-story steel gable frames. Buildings 2023, 13, 739. [Google Scholar] [CrossRef]
- Chen, L. Research on Sustainable Development of Intelligent Construction of Prefabricated Buildings Based on BIM. China Archit. Met. Struct. 2023, 184–186. [Google Scholar]
- Wang, Y. Predictive Model of Carbon Emissions from Buildings in Solar-Rich Areas and Zero-Carbon Pathways Research. Master’s Thesis, Xi’an University of Architecture and Technology, Xi’an, China, 2023. [Google Scholar]
- Wang, K.; Zhang, S.; Yang, X.; Xu, W. A comparative study of carbon reduction potential with the combination of existing policies and technologies in architectural carbon reach. Build. Energy Conserv. (Bilingual) 2022, 50, 8–15. [Google Scholar]
- Xia, Y.; Xiao, D.; Tao, L. Exploring low-carbon design strategies for Beijing Winter Olympics venues from “Building Carbon Emission Calculation Standards”. South Archit. 2023, 11–18. [Google Scholar]
- Li, C.; Tian, S.; Li, S. Research on digital support for building carbon emission calculation and low-carbon pathways. China Tendering 2024, 138–141. [Google Scholar]
- Zhuo, Y. Exploring New Standards for Carbon Emission Calculations in Architecture and Key Points for Carbon Reduction in Building Design. Fujian Archit. 2023, 34–38. [Google Scholar]
- Wang, Z. Assessment of Full Lifecycle Carbon Emissions and Research on Low-Carbon Design Methods for High-Rise Structures. Ph.D. Thesis, Harbin Institute of Technology, Harbin, China, 2021. [Google Scholar]
- Zhang, Z. Study on the Impact of Three-dimensional Greening on Carbon Emissions of Public Buildings in Xi’an. Master’s Thesis, Xi’an University of Architecture and Technology, Xi’an, China, 2023. [Google Scholar]
- Zhou, A.; Zhou, J.; Si, J.; Wang, G. Study on embodied CO2 emissions and transfer pathways of Chinese industries. Sustainability 2023, 15, 2215. [Google Scholar] [CrossRef]
- Luo, Z.; Cang, Y.; Yang, L.; Wang, Y. Research on the method of calculating building embodied carbon emissions throughout the design process. Build. Sci. 2021, 37, 1–7. [Google Scholar]
- Li, Y.; Zhang, K.; Li, J. Comparative analysis and carbon reduction strategies for residential buildings throughout their life cycle. J. Xi’an Univ. Archit. Technol. (Nat. Sci. Ed.) 2021, 53, 737–745. [Google Scholar]


Disclaimer/Publisher’s Note: The statements, opinions and data contained in all publications are solely those of the individual author(s) and contributor(s) and not of MDPI and/or the editor(s). MDPI and/or the editor(s) disclaim responsibility for any injury to people or property resulting from any ideas, methods, instructions or products referred to in the content. |
© 2024 by the authors. Licensee MDPI, Basel, Switzerland. This article is an open access article distributed under the terms and conditions of the Creative Commons Attribution (CC BY) license (https://creativecommons.org/licenses/by/4.0/).