
Examining Crop Yield Losses in Iğdır Plain Irrigation Systems in Türkiye Amidst Water Constraints
Abstract
:1. Introduction
2. Material and Method
2.1. Methodology
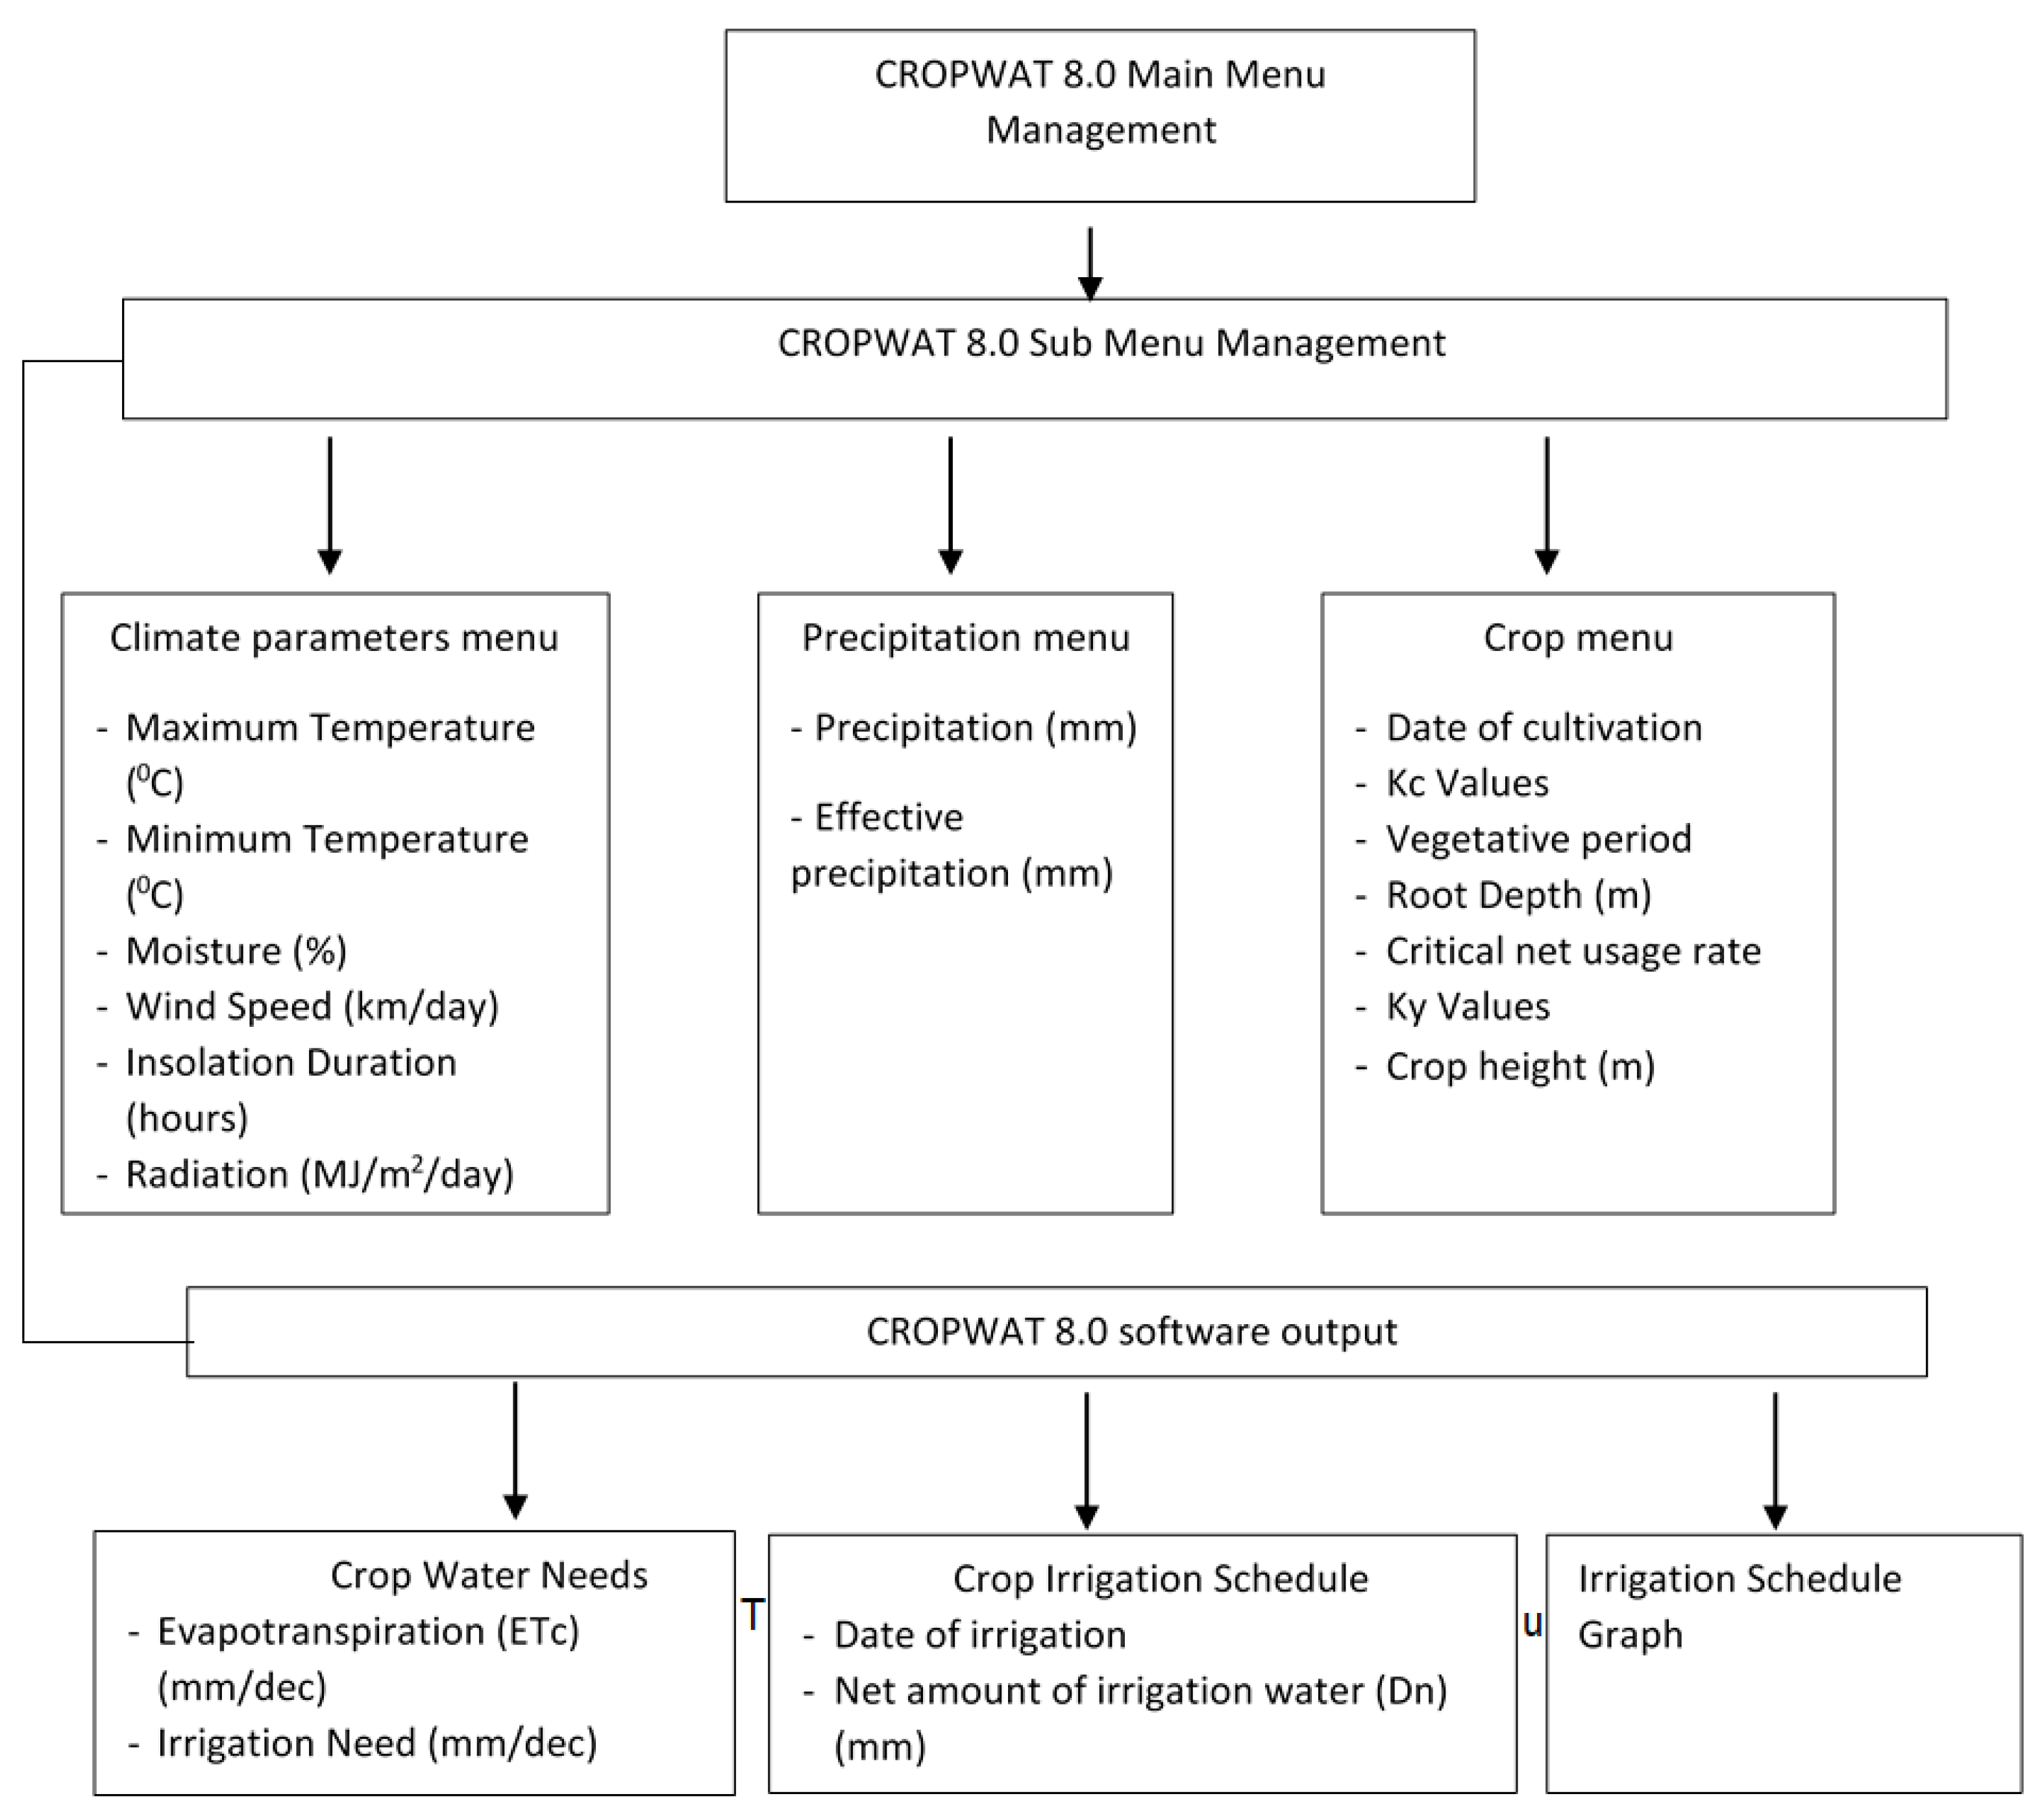
2.1.1. CropWAT
- Climatic data, such as minimum and maximum temperatures, relative humidity, wind speed, solar radiation, and precipitation, were obtained from the Turkish State Meteorological Service (MGM). The climate data covered multiple years and were averaged over 10-day periods.
- Crop types, cultivation areas, and yields for the 2014–2021 period were obtained from the Turkish Statistical Institute (TUIK).
- Irrigation practices, including irrigation efficiencies and transmission losses, were gathered from field surveys conducted by the Directorate General for Water Management.
2.1.2. Statistical Analysis
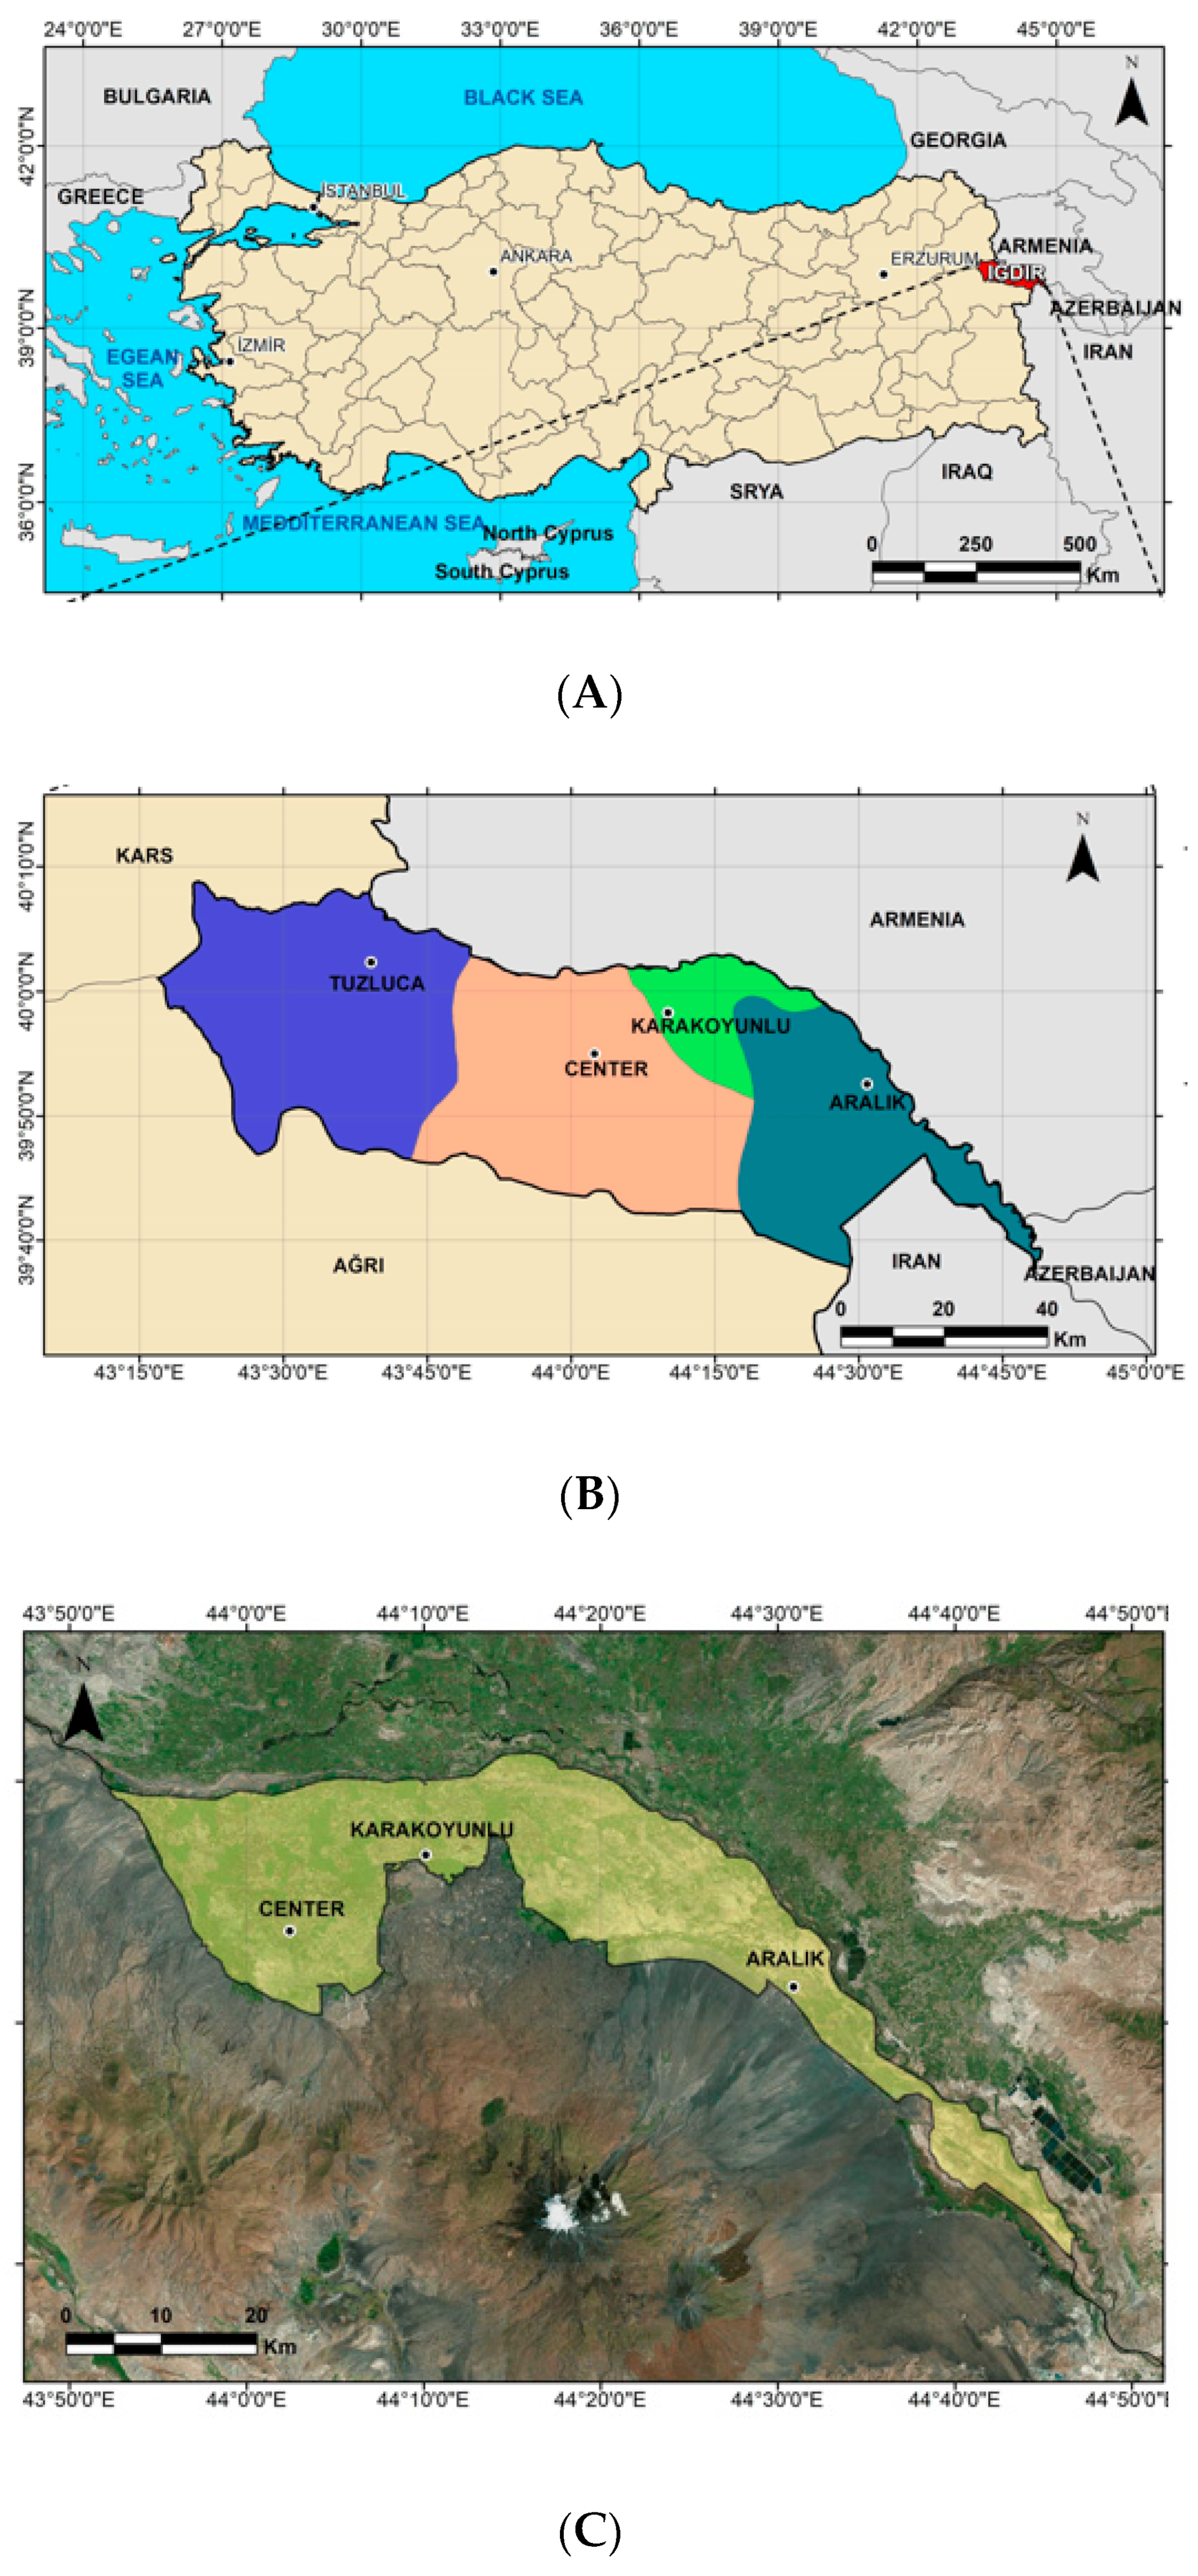
2.2. Study Area
3. Results
3.1. Field Crops
3.1.1. Wheat
3.1.2. Silage Maize (First Cultivation)
3.1.3. Clover
3.2. Vegetable Crops
3.2.1. Tomatoes
3.2.2. Watermelon
3.2.3. Melon
3.3. Fruits
3.3.1. Apple
3.3.2. Apricot
3.3.3. Peach
4. Discussion
5. Conclusions
Funding
Institutional Review Board Statement
Informed Consent Statement
Data Availability Statement
Acknowledgments
Conflicts of Interest
Appendix A
- Crop Water Demand represents the calculated water demand of a crop in millimeters. The crop water demand decreases as the irrigation rate reduces.
- Irrigation Water Demand shows the total irrigation water demand of a crop in millimeters, calculated by dividing the net irrigation water demand by the average irrigation efficiency of 34% in the Iğdır Plain.
- Irrigation Rate (%) indicates the percentage of the irrigation water supplied, ranging from 100% (full irrigation) to 10% (severe water constraint).
- Yield Decrease (%) shows the percentage decrease in crop yield due to the reduction in irrigation water. The yield loss increases as the irrigation rate decreases.
- Yield Loss (kg/ha) quantifies the yield loss in kilograms per hectare, corresponding to each irrigation rate.
- Total Yield Loss calculates the total yield loss across the irrigation plain in metric tons.
- Irrigational water volume shows the total irrigational water demand in thousand cubic meters.
- Loss of Revenue presents the revenue loss due to the reduced yield in thousand dollars. The revenue loss increases with the severity of the water constraint.
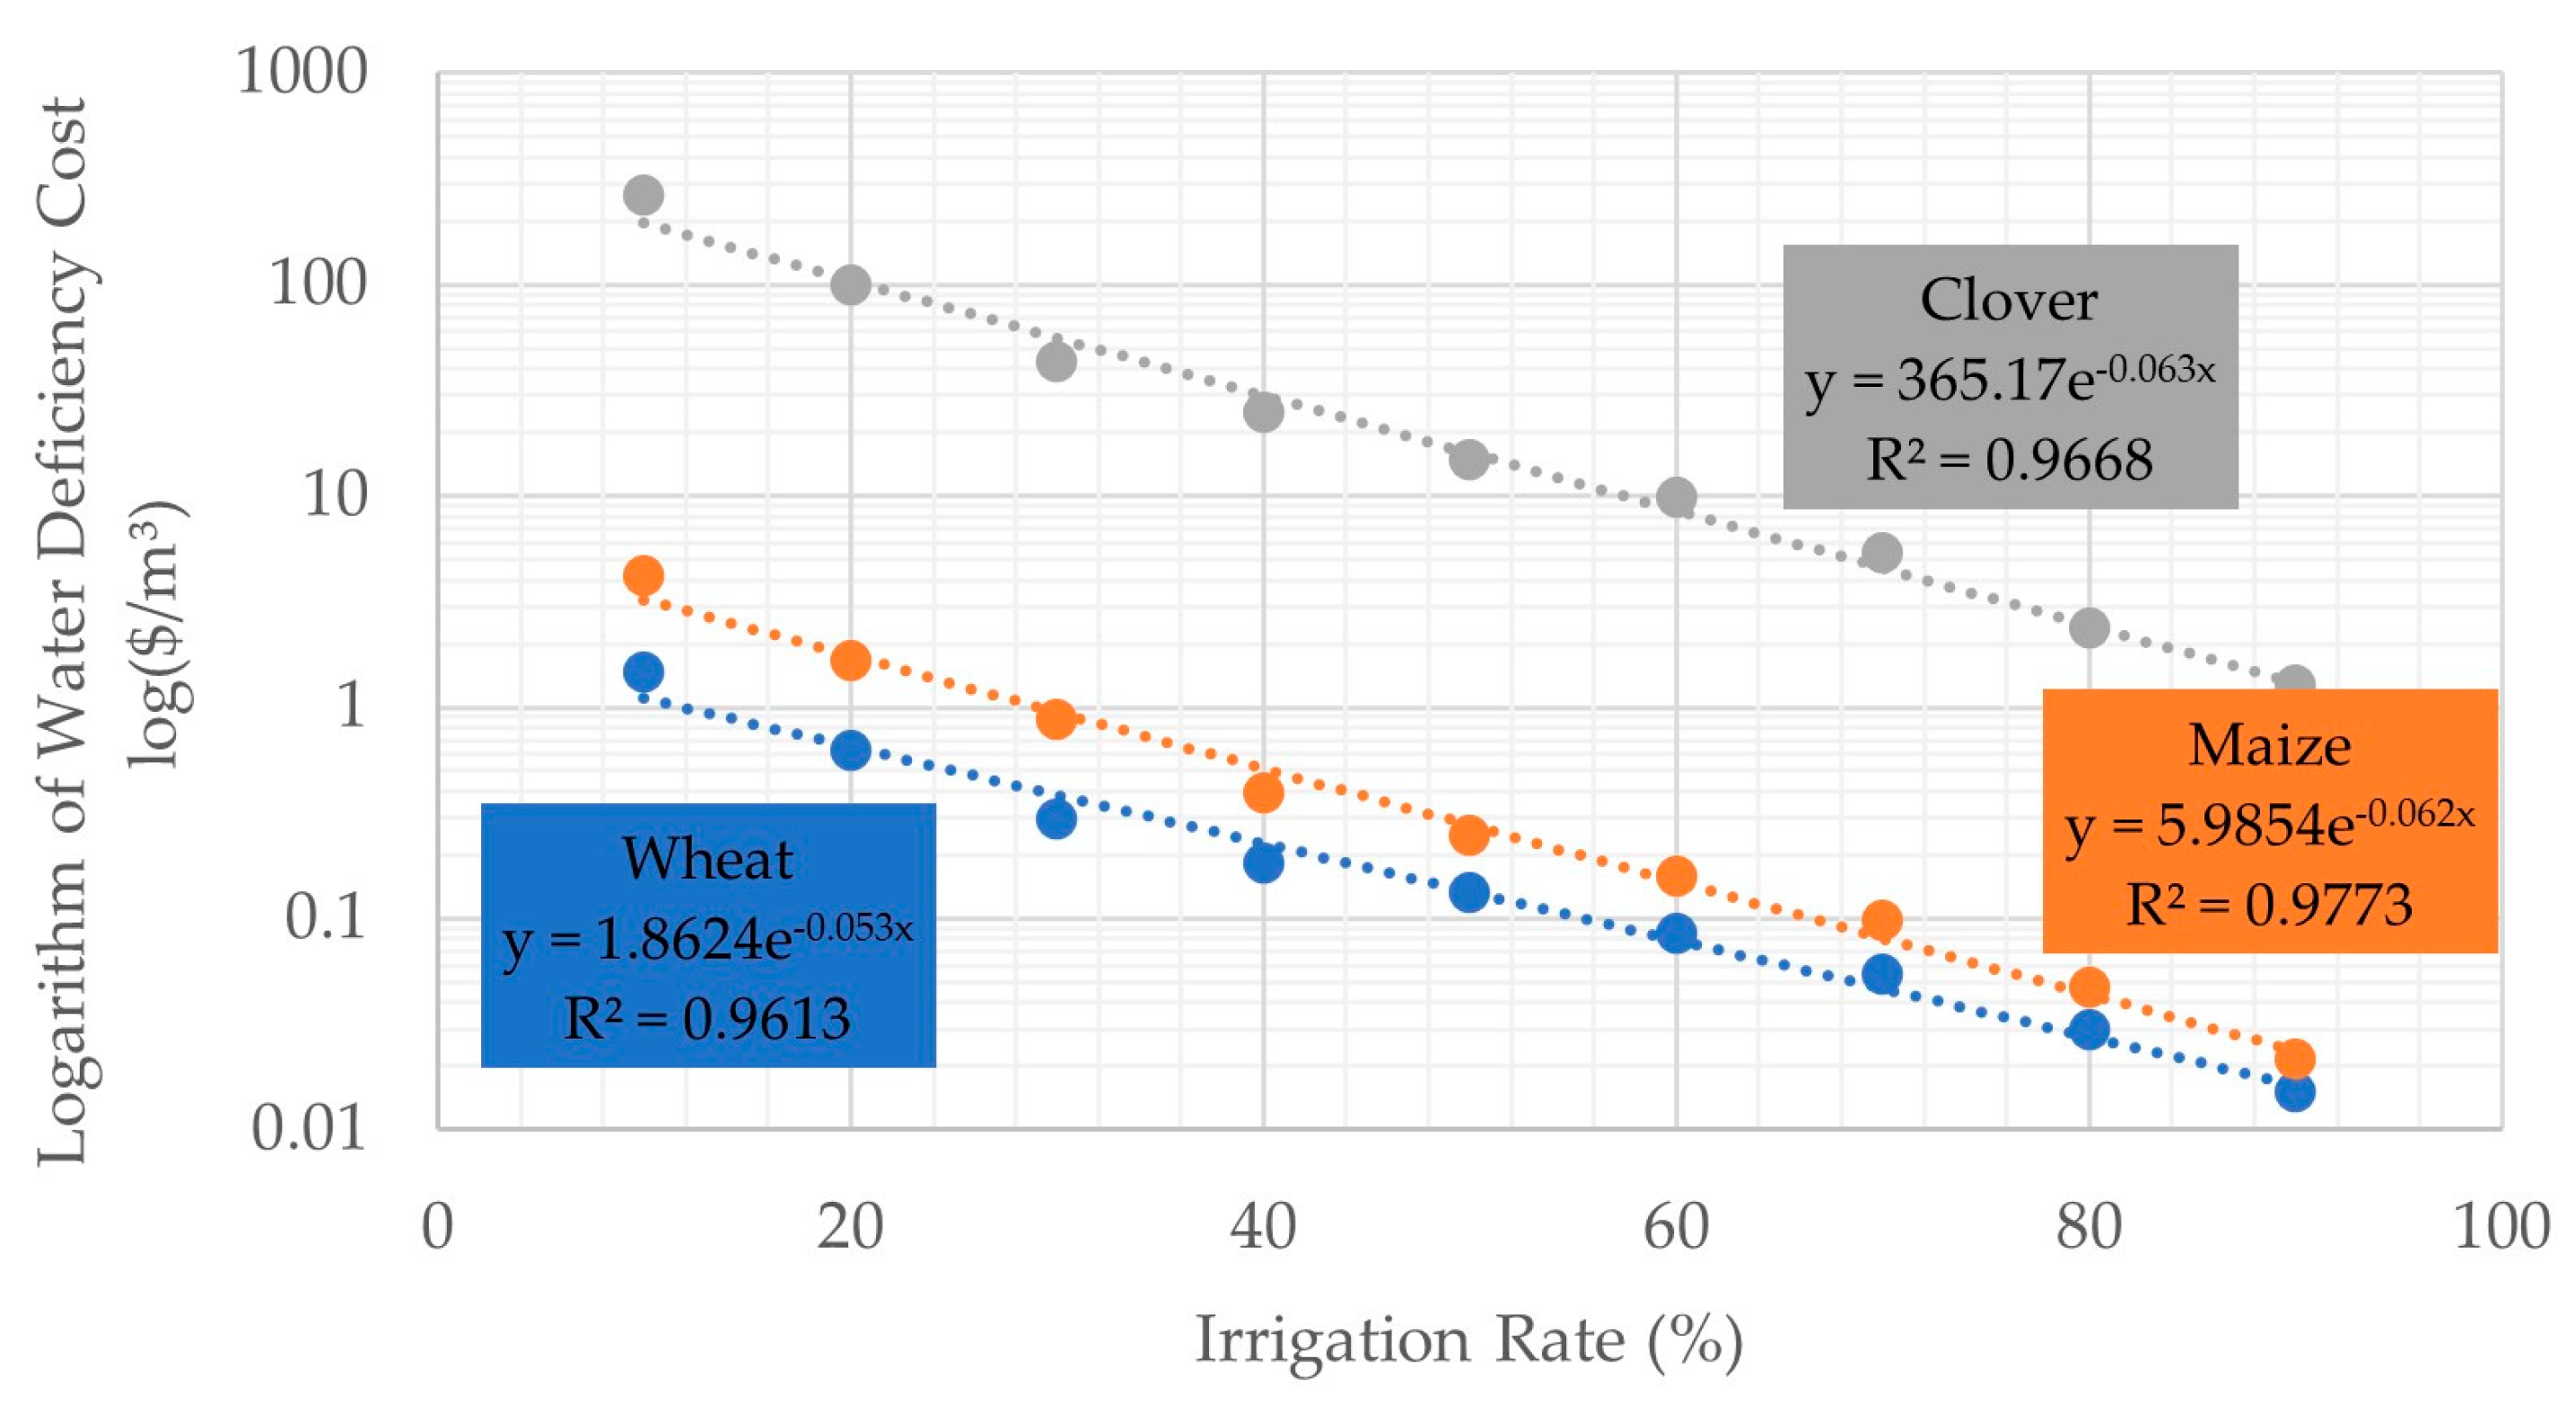
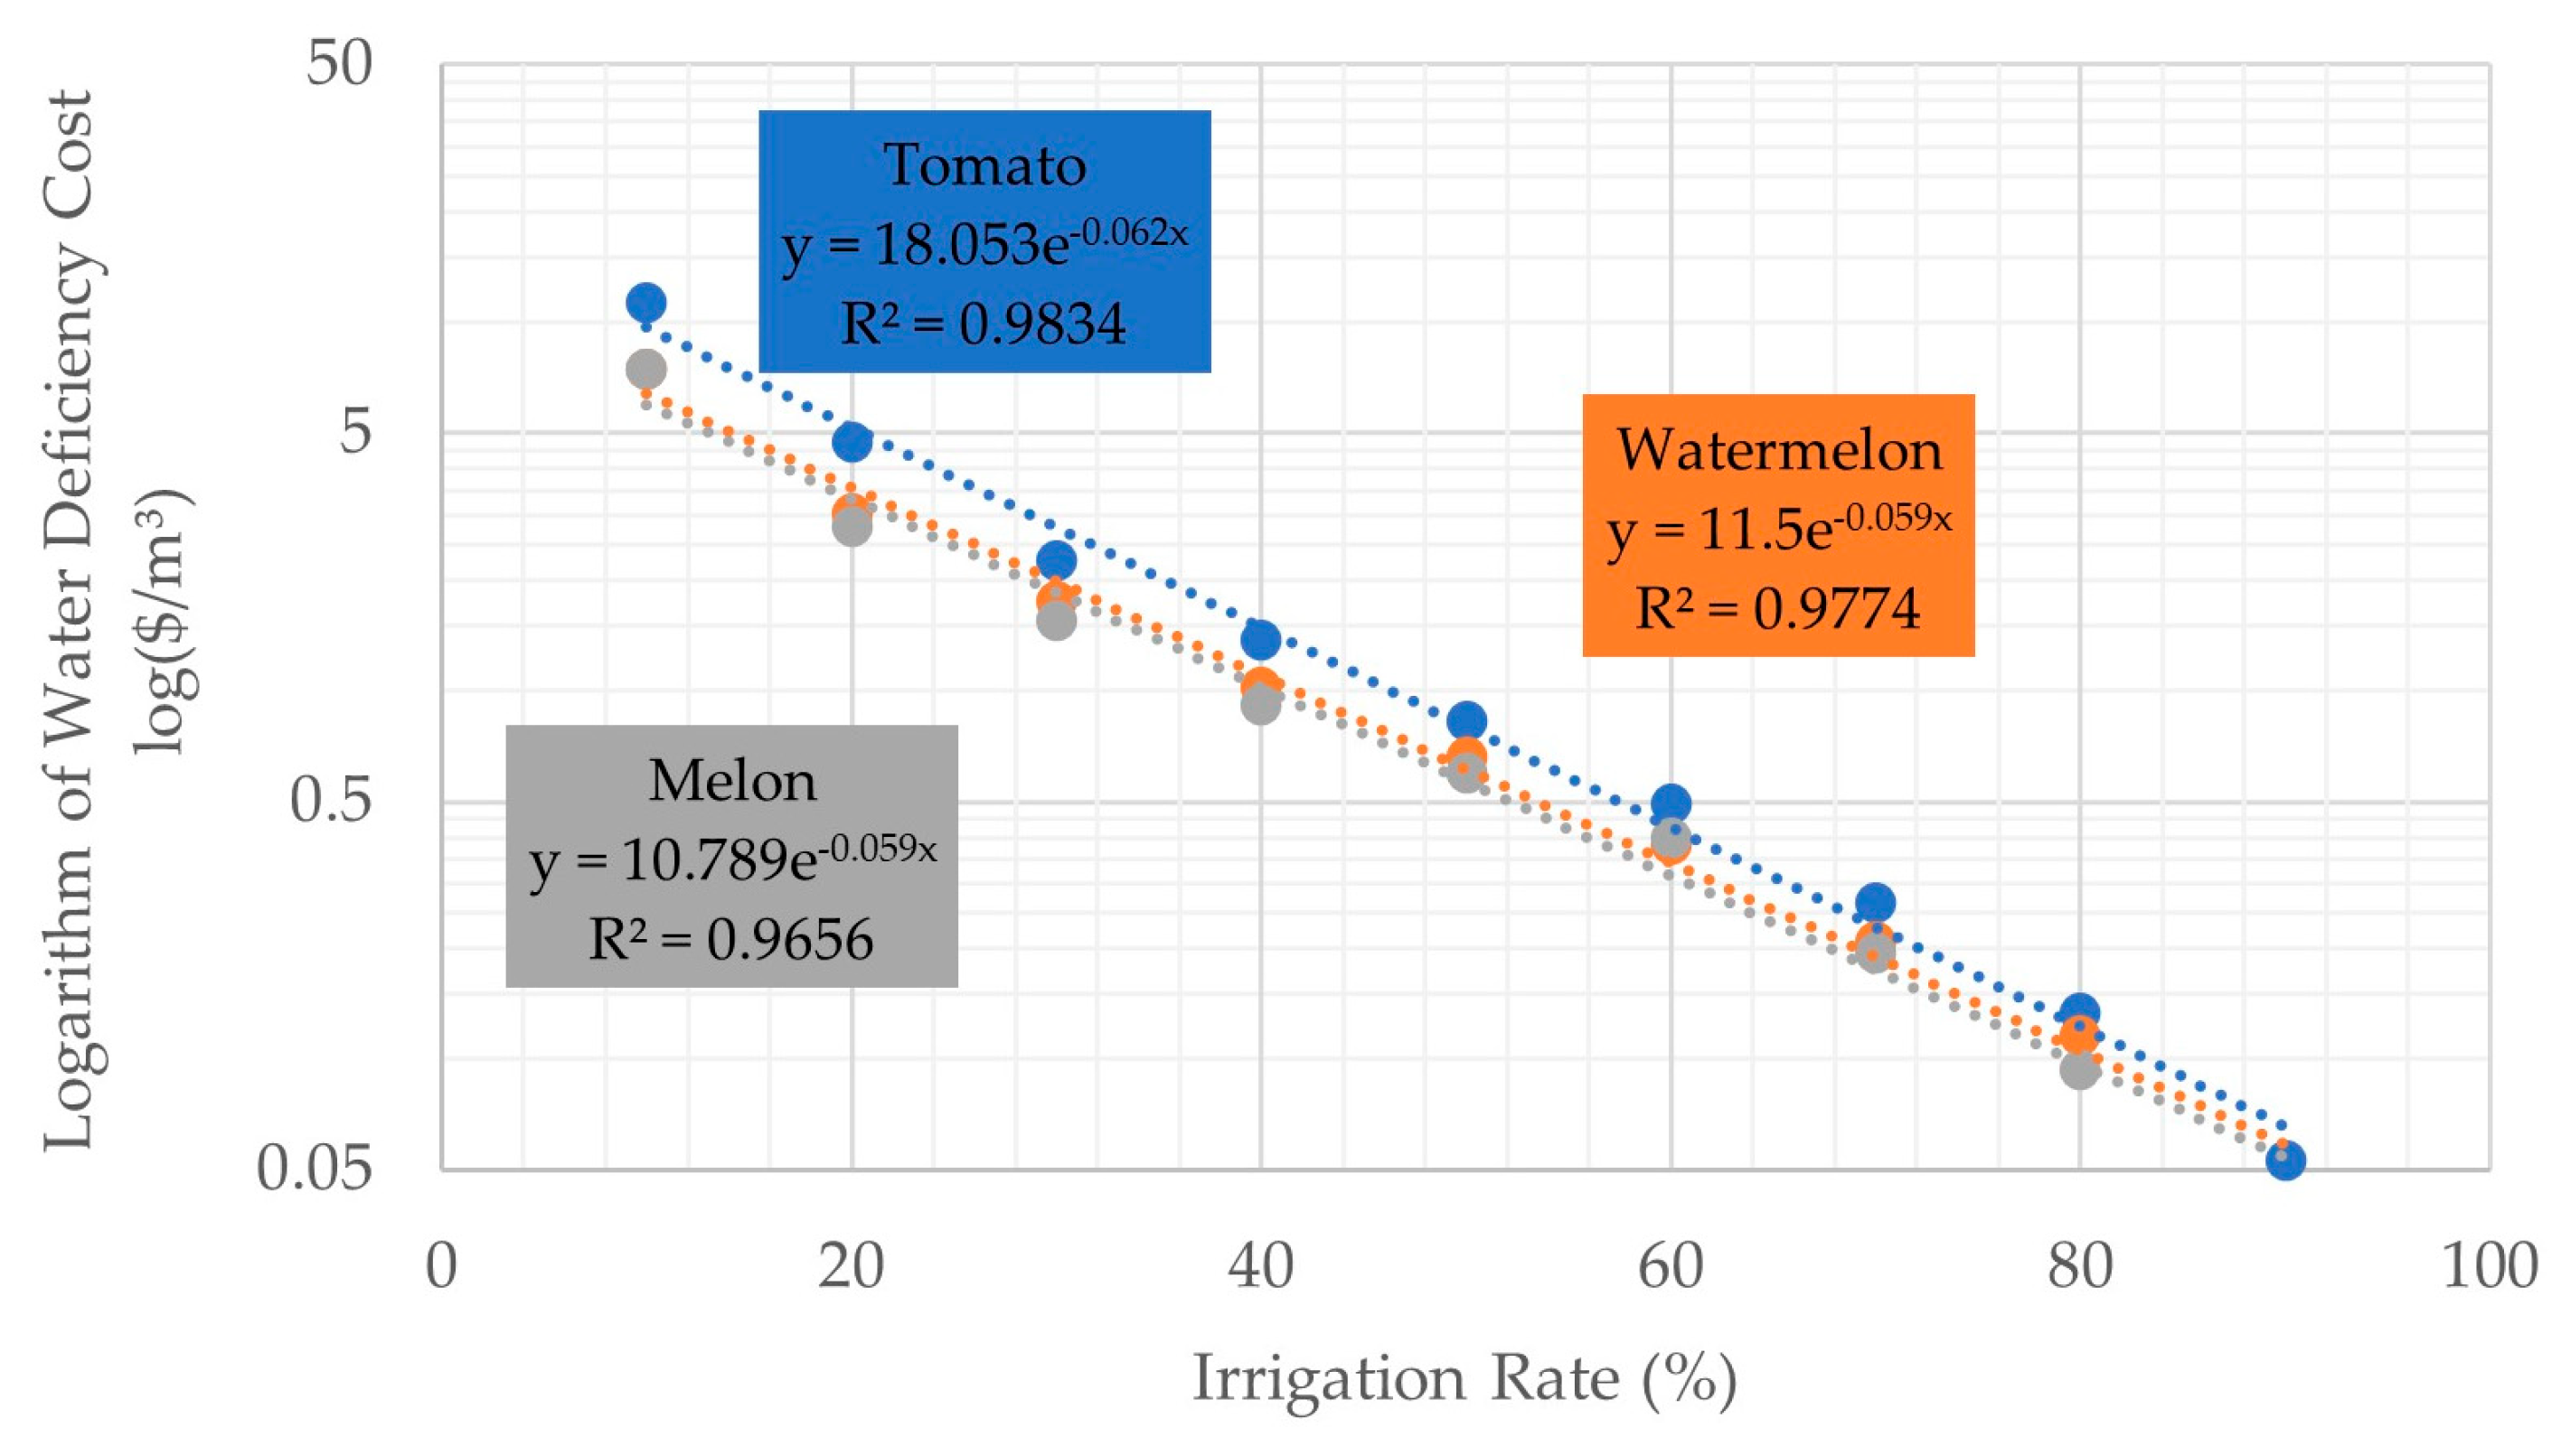
- Water Deficiency Cost is the economic value of the water deficiency, representing the cost per cubic meter of water not supplied. This value rises significantly as the irrigation rate decreases, highlighting the increased economic impact of severe water constraints.

| Crop Water Demand (dn, mm) | Irrigation Water Demand (dt, m3/ha/y) | Irrigation Rate (%) | Yield Decrease (%) | Yield Loss (kg/ha) | Total Yield Loss (Metric Tons) | Irrigational Water Volume (Thousand m3) | Loss of Revenue (Thousand USD) | Water Deficiency Cost (USD/m3) |
|---|---|---|---|---|---|---|---|---|
| 357.57 | 1051.68 | 100 | 0.00 | 0.00 | 0.00 | 12,046.95 | 0.00 | ----- |
| 321.80 | 946.47 | 90 | 1.80 | 81.00 | 927.86 | 10,841.81 | 163.17 | 0.02 |
| 286.07 | 841.38 | 80 | 3.13 | 140.85 | 1613.44 | 9638.01 | 283.73 | 0.03 |
| 250.27 | 736.09 | 70 | 5.03 | 226.35 | 2592.84 | 8431.91 | 455.96 | 0.05 |
| 214.53 | 630.97 | 60 | 6.83 | 307.35 | 3520.69 | 7227.76 | 619.13 | 0.09 |
| 178.80 | 525.88 | 50 | 8.80 | 396.00 | 4536.18 | 6023.96 | 797.70 | 0.13 |
| 143.03 | 420.68 | 40 | 9.67 | 435.15 | 4984.64 | 4818.89 | 876.57 | 0.18 |
| 107.30 | 315.59 | 30 | 11.87 | 534.15 | 6118.69 | 3615.08 | 1075.99 | 0.30 |
| 71.50 | 210.29 | 20 | 16.53 | 743.85 | 8520.80 | 2408.87 | 1498.41 | 0.62 |
| 35.77 | 105.21 | 10 | 19.57 | 880.65 | 10,087.85 | 1205.18 | 1773.98 | 1.47 |
| Crop Water Demand (dn, mm) | Irrigation Water Demand (dt, m3/ha/y) | Irrigation Rate (%) | Yield Decrease (%) | Yield Loss (kg/ha) | Total Yield Loss (Metric Tons) | Irrigational Water Volume (Thousand m3) | Loss of Revenue (Thousand USD) | Water Deficiency Cost (USD/m3) |
|---|---|---|---|---|---|---|---|---|
| 486.13 | 14,291.80 | 100 | 0.00 | 0.00 | 0.00 | 5980.30 | 0.00 | ----- |
| 437.50 | 1286.76 | 90 | 2.20 | 953.33 | 3987.41 | 5382.00 | 116.39 | 0.02 |
| 388.90 | 1143.82 | 80 | 4.33 | 1877.78 | 7853.99 | 4784.14 | 229.26 | 0.05 |
| 340.30 | 1000.88 | 70 | 7.80 | 3380.00 | 14,137.19 | 4186.28 | 412.67 | 0.10 |
| 291.67 | 857.84 | 60 | 10.70 | 4636.67 | 19,393.32 | 3588.00 | 566.10 | 0.16 |
| 243.10 | 715.00 | 50 | 14.03 | 6081.11 | 25,434.85 | 2990.56 | 742.45 | 0.25 |
| 194.47 | 571.96 | 40 | 17.83 | 7727.78 | 32,322.20 | 2392.28 | 943.49 | 0.39 |
| 145.83 | 428.92 | 30 | 29.43 | 12,754.44 | 53,346.74 | 1794.00 | 1557.20 | 0.87 |
| 87.23 | 256.57 | 20 | 33.40 | 14,473.33 | 60,536.16 | 1073.13 | 1767.06 | 1.65 |
| 48.63 | 143.04 | 10 | 47.03 | 20,381.11 | 85,246.03 | 598.28 | 2488.35 | 4.16 |
| Crop Water Demand (dn, mm) | Irrigation Water Demand (dt, m3/ha/y) | Irrigation Rate (%) | Yield Decrease (%) | Yield Loss (kg/ha) | Total Yield Loss (Metric Tons) | Irrigational Water Volume (Thousand m3) | Loss of Revenue (Thousand USD) | Water Deficiency Cost (USD/m3) |
|---|---|---|---|---|---|---|---|---|
| 568.37 | 1671.67 | 100 | 0.00 | 0.00 | 0.00 | 46,999.00 | 0.00 | ---- |
| 511.53 | 1504.51 | 90 | 1.40 | 20,066.66 | 5641.74 | 42,299.30 | 54,225.11 | 1.28 |
| 454.70 | 1337.35 | 80 | 2.30 | 32,966.66 | 9268.58 | 37,599.60 | 89,084.12 | 2.37 |
| 397.87 | 1170.20 | 70 | 4.53 | 64,977.76 | 18,268.50 | 32,900.17 | 175,586.07 | 5.34 |
| 341.00 | 1002.94 | 60 | 7.20 | 103,199.98 | 29,014.67 | 28,197.66 | 278,872.02 | 9.89 |
| 284.23 | 835.98 | 50 | 8.97 | 128,522.19 | 36,134.01 | 23,503.58 | 347,298.93 | 14.78 |
| 227.37 | 668.73 | 40 | 11.97 | 171,522.18 | 48,223.46 | 18,801.35 | 463,495.60 | 24.65 |
| 170.53 | 501.57 | 30 | 15.57 | 223,122.17 | 62,730.80 | 14,101.64 | 602,931.61 | 42.76 |
| 113.67 | 334.31 | 20 | 23.93 | 343,044.36 | 96,446.92 | 9399.13 | 926,991.20 | 98.63 |
| 56.87 | 167.25 | 10 | 32.27 | 462,488.78 | 130,028.72 | 4702.24 | 1,249,759.74 | 265.78 |
| Crop Water Demand (dn, mm) | Irrigation Water Demand (dt, m3/ha/y) | Irrigation Rate (%) | Yield Decrease (%) | Yield Loss (kg/ha) | Total Yield Loss (Metric Tons) | Irrigational Water Volume (Thousand m3) | Loss of Revenue (Thousand USD) | Water Deficiency Cost (USD/m3) |
|---|---|---|---|---|---|---|---|---|
| 560.00 | 1647.06 | 100 | 0.00 | 0.00 | 0.00 | 1564.21 | 0.00 | ---- |
| 504.00 | 1482.35 | 90 | 2.20 | 836.00 | 793.95 | 1407.79 | 74.90 | 0.05 |
| 448.00 | 1317.65 | 80 | 4.90 | 1862.00 | 1768.34 | 1251.37 | 166.82 | 0.13 |
| 392.00 | 1152.94 | 70 | 8.57 | 3255.33 | 3091.59 | 1094.95 | 291.64 | 0.27 |
| 335.97 | 988.14 | 60 | 13.57 | 5155.33 | 4896.02 | 938.44 | 461.86 | 0.49 |
| 280.03 | 823.63 | 50 | 18.90 | 7182.00 | 6820.75 | 782.20 | 643.43 | 0.82 |
| 224.03 | 658.92 | 40 | 25.30 | 9614.00 | 9130.42 | 625.78 | 861.31 | 1.38 |
| 168.00 | 494.12 | 30 | 31.23 | 11,868.67 | 11,271.67 | 469.27 | 1063.30 | 2.27 |
| 112.00 | 329.41 | 20 | 43.60 | 16,568.00 | 15,734.63 | 312.84 | 1484.31 | 4.74 |
| 56.00 | 164.71 | 10 | 51.93 | 19,734.67 | 18,742.01 | 156.43 | 1768.01 | 11.30 |
| Crop Water Demand (dn, mm) | Irrigation Water Demand (dt, m3/ha/y) | Irrigation Rate (%) | Yield Decrease (%) | Yield Loss (kg/ha) | Total Yield Loss (Metric Tons) | Irrigational Water Volume (Thousand m3) | Loss of Revenue (Thousand USD) | Water Deficiency Cost (USD/m3) |
|---|---|---|---|---|---|---|---|---|
| 450.57 | 1325.20 | 100 | 0.00 | 0.00 | 0.00 | 1137.42 | 0.00 | ----- |
| 405.50 | 1192.65 | 90 | 1.97 | 662.11 | 568.29 | 1023.65 | 49.36 | 0.05 |
| 360.47 | 1060.20 | 80 | 4.20 | 1414.00 | 1213.64 | 909.97 | 105.41 | 0.12 |
| 315.40 | 927.65 | 70 | 6.60 | 2222.00 | 1907.14 | 796.20 | 165.65 | 0.21 |
| 270.33 | 795.10 | 60 | 10.40 | 3501.33 | 3005.19 | 682.44 | 261.03 | 0.38 |
| 225.23 | 662.45 | 50 | 14.93 | 5027.56 | 4315.15 | 568.58 | 374.81 | 0.66 |
| 180.23 | 530.10 | 40 | 18.60 | 6262.00 | 5374.68 | 454.99 | 466.84 | 1.03 |
| 135.17 | 397.55 | 30 | 23.83 | 8023.89 | 6886.90 | 341.22 | 598.19 | 1.75 |
| 90.10 | 265.00 | 20 | 27.53 | 9269.56 | 7956.06 | 227.45 | 691.05 | 3.04 |
| 45.07 | 132.55 | 10 | 33.83 | 11,390.56 | 9776.51 | 113.77 | 849.18 | 7.46 |
| Crop Water Demand (dn, mm) | Irrigation Water Demand (dt, m3/ha/y) | Irrigation Rate (%) | Yield Decrease (%) | Yield Loss (kg/ha) | Total Yield Loss (Metric tons) | Irrigational Water Volume (Thousand m3) | Loss of Revenue (Thousand USD) | Water Deficiency Cost (USD/m3) |
|---|---|---|---|---|---|---|---|---|
| 465.33 | 1368.63 | 100 | 0.00 | 0.00 | 0.00 | 1459.37 | 0.00 | ---- |
| 418.83 | 1231.86 | 90 | 2.10 | 471.74 | 503.02 | 1313.53 | 62.67 | 0.05 |
| 372.27 | 1094.90 | 80 | 3.67 | 823.67 | 878.28 | 1167.49 | 109.43 | 0.09 |
| 325.73 | 958.04 | 70 | 6.63 | 1490.10 | 1588.89 | 1021.56 | 197.96 | 0.19 |
| 279.20 | 821.18 | 60 | 11.63 | 2613.29 | 2786.55 | 875.63 | 347.18 | 0.40 |
| 232.70 | 684.41 | 50 | 14.63 | 3287.20 | 3505.14 | 729.79 | 436.71 | 0.60 |
| 186.13 | 547.45 | 40 | 17.90 | 4021.02 | 4287.61 | 583.75 | 534.20 | 0.91 |
| 139.63 | 410.69 | 30 | 22.80 | 5121.75 | 5461.32 | 437.92 | 680.44 | 1.55 |
| 93.07 | 273.73 | 20 | 27.17 | 6102.67 | 6507.27 | 291.88 | 810.76 | 2.78 |
| 46.53 | 136.86 | 10 | 36.30 | 8154.36 | 8694.99 | 145.93 | 1083.33 | 7.42 |
| Crop Water Demand (dn, mm) | Irrigation Water Demand (dt, m3/ha/y) | Irrigation Rate (%) | Yield Decrease (%) | Yield Loss (kg/ha) | Total Yield Loss (Metric Tons) | Irrigational Water Volume (Thousand m3) | Loss of Revenue (Thousand USD) | Water Deficiency Cost (USD/m3) |
|---|---|---|---|---|---|---|---|---|
| 604.20 | 1777.06 | 100 | 0.00 | 0.00 | 0.00 | 3373.39 | 0.00 | ---- |
| 543.80 | 1599.41 | 90 | 2.00 | 600.00 | 1138.98 | 3036.16 | 144.34 | 0.05 |
| 483.37 | 1421.67 | 80 | 4.97 | 1490.00 | 2828.47 | 2698.76 | 358.45 | 0.13 |
| 422.93 | 1243.92 | 70 | 7.37 | 2210.00 | 4195.24 | 2361.33 | 531.66 | 0.23 |
| 362.50 | 1066.18 | 60 | 10.37 | 3110.00 | 5903.71 | 2023.93 | 748.17 | 0.37 |
| 302.10 | 888.53 | 50 | 13.53 | 4060.00 | 7707.10 | 1686.70 | 976.71 | 0.58 |
| 241.70 | 710.88 | 40 | 17.97 | 5390.00 | 10,231.84 | 1349.46 | 1296.66 | 0.96 |
| 181.27 | 533.14 | 30 | 22.23 | 6670.00 | 12,661.66 | 1012.06 | 1604.59 | 1.59 |
| 120.83 | 355.39 | 20 | 28.53 | 8560.00 | 16,249.45 | 674.64 | 2059.26 | 3.05 |
| 60.40 | 177.65 | 10 | 35.40 | 10,620.00 | 20,159.95 | 337.23 | 2554.84 | 7.58 |
| Crop Water Demand (dn, mm) | Irrigation Water Demand (dt, m3/ha/y) | Irrigation Rate (%) | Yield Decrease (%) | Yield Loss (kg/ha) | Total Yield Loss (Metric tons) | Irrigational Water Volume (Thousand m3) | Loss of Revenue (Thousand SUD) | Water Deficiency Cost (USD/m3) |
|---|---|---|---|---|---|---|---|---|
| 589.97 | 1735.20 | 100 | 0.00 | 0.00 | 0.00 | 6125.26 | 0.00 | ----- |
| 531.07 | 1561.96 | 90 | 2.20 | 321.04 | 1133.27 | 5513.72 | 282.39 | 0.05 |
| 472.03 | 1388.33 | 80 | 4.23 | 617.76 | 2180.68 | 4900.81 | 543.40 | 0.11 |
| 413.03 | 1214.80 | 70 | 9.57 | 1396.03 | 4927.99 | 4288.24 | 1227.98 | 0.29 |
| 354.00 | 1041.18 | 60 | 15.80 | 2305.64 | 8138.92 | 3675.37 | 2028.09 | 0.55 |
| 295.07 | 867.84 | 50 | 19.60 | 2860.16 | 10,096.38 | 3063.48 | 2515.86 | 0.82 |
| 236.07 | 694.31 | 40 | 25.80 | 3764.91 | 13,290.13 | 2450.91 | 3311.70 | 1.35 |
| 177.03 | 520.69 | 30 | 31.33 | 4572.37 | 16,140.47 | 1838.04 | 4021.96 | 2.19 |
| 118.03 | 347.16 | 20 | 36.80 | 5370.10 | 18,956.46 | 1225.48 | 4723.66 | 3.85 |
| 59.00 | 173.53 | 10 | 40.50 | 5910.03 | 20,862.41 | 612.56 | 5198.59 | 8.49 |
| Crop Water Demand (dn, mm) | Irrigation Water Demand (dt, m3/ha/y) | Irrigation Rate (%) | Yield Decrease (%) | Yield Loss (kg/ha) | Total Yield Loss (Metric tons) | Irrigational Water Volume (Thousand m3) | Loss of Revenue (Thousand USD) | Water Deficiency Cost (USD/m3) |
|---|---|---|---|---|---|---|---|---|
| 571.55 | 1681.03 | 100 | 0.00 | 0.00 | 0.00 | 351.84 | 0.00 | ----- |
| 514.40 | 1512.94 | 90 | 2.85 | 513.00 | 107.37 | 316.66 | 24.46 | 0.08 |
| 457.25 | 1344.85 | 80 | 7.00 | 1260.00 | 263.72 | 281.48 | 60.08 | 0.21 |
| 400.05 | 1176.62 | 70 | 9.35 | 1683.00 | 352.25 | 246.27 | 80.25 | 0.33 |
| 342.90 | 1008.53 | 60 | 13.90 | 2502.00 | 523.67 | 211.09 | 119.31 | 0.57 |
| 285.80 | 840.59 | 50 | 19.70 | 3546.00 | 742.18 | 175.94 | 169.09 | 0.96 |
| 228.65 | 672.50 | 40 | 22.35 | 4023.00 | 842.01 | 140.76 | 191.83 | 1.36 |
| 171.50 | 504.41 | 30 | 25.65 | 4617.00 | 966.34 | 105.57 | 220.16 | 2.09 |
| 114.30 | 336.18 | 20 | 34.60 | 6228.00 | 1303.52 | 70.36 | 296.98 | 4.22 |
| 57.15 | 168.09 | 10 | 41.70 | 7506.00 | 1571.01 | 35.18 | 357.92 | 10.17 |
| Crop | Coefficient a | Standard Error (a) | Coefficient b | Standard Error (b) | R2 |
|---|---|---|---|---|---|
| Wheat | 1.8624 | 0.053 | −0.053 | 0.006 | 0.9613 |
| Maize | 5.9854 | 0.065 | −0.062 | 0.007 | 0.9773 |
| Clover | 365.16 | 3.65 | −0.063 | 0.007 | 0.9668 |
| Tomato | 18.053 | 0.180 | −0.062 | 0.006 | 0.9834 |
| Watermelon | 11.5 | 0.115 | −0.059 | 0.006 | 0.9774 |
| Melon | 10.789 | 0.108 | −0.059 | 0.006 | 0.9656 |
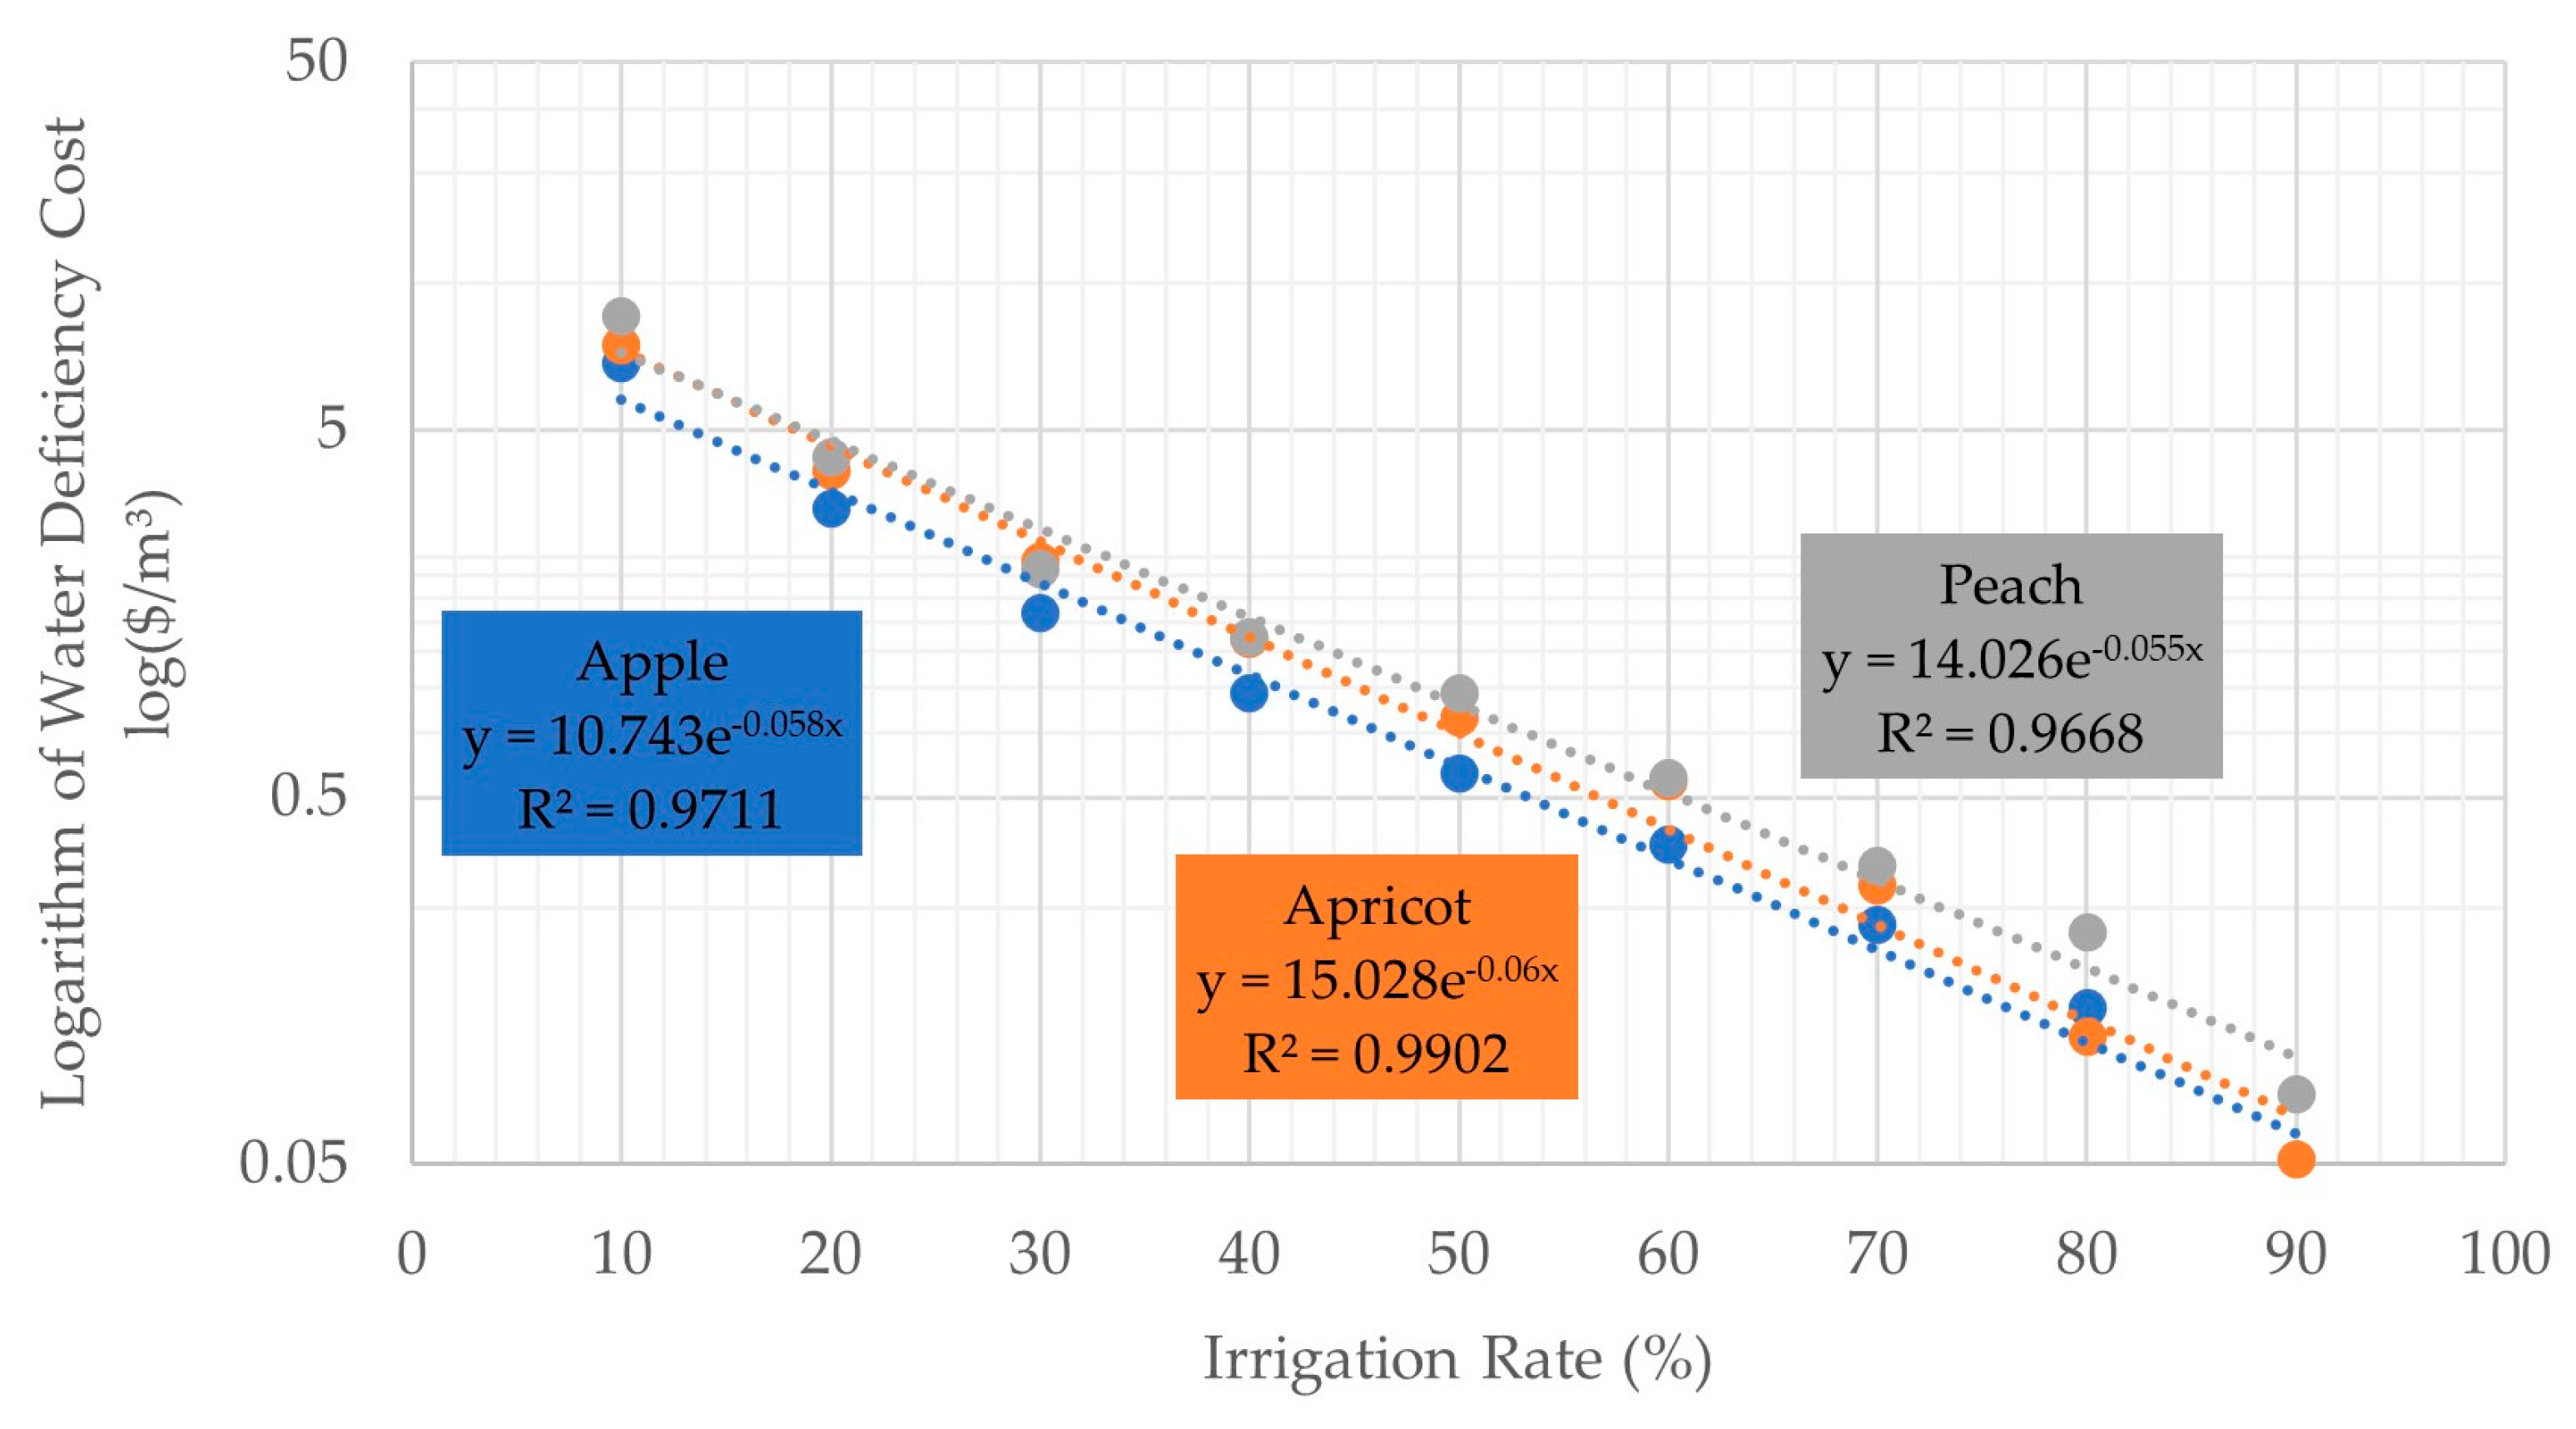
| Apple | 10.743 | 0.107 | −0.058 | 0.006 | 0.9711 |
| Apricot | 15.028 | 0.150 | −0.060 | 0.007 | 0.9902 |
| Peach | 14.026 | 0.140 | −0.055 | 0.006 | 0.9668 |
References
- Aydogdu, M.H.; Aydoğdu, İ.; Cevheri, A.C.; Sevinç, M.R.; Küçük, N. Şanlıurfa’daki yem bitkileri eken çiftçilerin sosyo-ekonomik profilinin analizi. J. Ekon. 2020, 10–15, 2390–2687. [Google Scholar]
- Hemathilake, D.M.K.S.; Gunathilake, D.M.C.C. Chapter 31—Agricultural Productivity and Food Supply to Meet Increased Demands. In Future Foods; Bhat, R., Ed.; Academic Press: Cambridge, MA, USA, 2022; pp. 539–553. ISBN 9780323910019. [Google Scholar] [CrossRef]
- Parlakçı, D.H.; Aydogdu, M.H.; Sevinç, M.R.; Cançelik, M. Farmers’ Willingness to Pay for Services to Ensure Sustainable Agricultural Income in the GAP-Harran Plain, Sanlıurfa, Turkey. Agriculture 2020, 10, 152. [Google Scholar]
- Aydogdu, M.H.; Sevinç, M.R.; Cançelik, M.; Parlakçı Doğan, H.; Şahin, Z. Determination of Farmers’ Willingness to Pay for Sustainable Agricultural Land Use in the GAP-Harran Plain of Turkey. Land 2020, 9, 261. [Google Scholar] [CrossRef]
- Aydogdu, M.H.; Yenigün, K. Farmers’ Risk Perception towards Climate Change: A Case of the GAP-Sanlıurfa Region, Turkey. Sustainability 2016, 8, 806. [Google Scholar] [CrossRef]
- Chu, E.W.; Karr, J.R. Environmental Impact: Concept, Consequences, Measurement Reference Module. Life Sci. 2017. [Google Scholar] [CrossRef]
- CROPWAT. 2024. Available online: https://www.fao.org/land-water/databases-and-software/cropwat/en/ (accessed on 6 April 2024).
- Sanjeet, S.; Gagan, D.S.; Magdalena, R.; Daniel, B.L.; Pooja, B. Do natural resources impact economic growth: An investigation of P5 + 1 countries under sustainable management. Geosci. Front. 2024, 15, 101595. [Google Scholar] [CrossRef]
- Wassie, S.B. Natural resource degradation tendencies in Ethiopia: A review. Environ. Syst. Res. 2020, 9, 33. [Google Scholar] [CrossRef]
- Aydogdu, M.H. Farmers Attitudes to the Pricing of Natural Resources for Sustainability: GAP-Şanlıurfa Sampling of Turkey. Water 2019, 11, 1772. [Google Scholar] [CrossRef]
- Qilong, W.; Xiaodong, M.; Sahar, A. Dynamic effects of natural resource abundance, green financing, and government environmental concerns toward the sustainable environment in China. Resour. Policy 2022, 79, 102954. [Google Scholar] [CrossRef]
- Water Scarcity. Available online: https://www.unwater.org/water-facts/water-scarcity (accessed on 6 April 2024).
- Beckman, J.; Countryman, A.M. The Importance of Agriculture in the Economy: Impacts from COVID-19. Am. J. Agric. Econ. 2021, 103, 1595–1611. [Google Scholar] [CrossRef] [PubMed] [PubMed Central]
- Ahmad, M.; Ahmed, Z.; Yang, X.; Can, M. Natural Resources Depletion, Financial Risk, and Human Well-Being: What is the Role of Green Innovation and Economic Globalization. Soc. Indic. Res. 2023, 167, 269–288. [Google Scholar] [CrossRef] [PubMed]
- Lencucha, R.; Pal, N.E.; Appau, A.; Thow, A.M.; Drope, J. Government policy and agricultural production: A scoping review to inform research and policy on healthy agricultural commodities. Glob. Health Res. Policy 2020, 16, 11. [Google Scholar] [CrossRef] [PubMed]
- Demirok, A.; Tuylu, G.İ. Harran Ovası’nda Mısır Bitkisi (Zea mays L.) için Planlanan ve Gerçekleşen Sulama Zamanı Programının Değerlendirilmesi. Harran Tarım Gıda Bilim. Derg. 2017, 21, 84–90. [Google Scholar] [CrossRef]
- General Directorate of Water Management. Methodological Guide on Water Efficiency in the Agriculture Sector; General Directorate of Water Management: Ankara, Turkey, 2021. [Google Scholar]
- Cheng, H.; Liu, D.; Ming, G.; Hussain, F.; Ma, L.; Huang, Q.; Meng, X. Evaluation of Water Balance and Water Use Efficiency with the Development of Water-Saving Irrigation in the Yanqi Basin Irrigation District of China. Agronomy 2023, 13, 2990. [Google Scholar] [CrossRef]
- He, D.; Gao, P.; Sun, Z.; Lau, Y. Measuring Water Transport Efficiency in the Yangtze River Economic Zone, China. Sustainability 2017, 9, 2278. [Google Scholar] [CrossRef]
- Mangrio, M.; Mirjat, M.; Leghari, N.; Zardari, N.H.; Shaikh, I. Evaluating Water Application Efficiencies of Surface Irrigation Methods At Farmer’s Field. Pak. J. Agric. Agric. Eng. Vet. 2015, 31, 279–288. [Google Scholar]
- Hedley, C.B.; Yule, I.J.; Tuohy, M.P.; Vogeler, I. Key Performance Indicators for Simulated Variable-Rate Irrigation of Variable Soils in Humid Regions. ASABE 2009, 52, 1575–1584. [Google Scholar] [CrossRef]
- Karam, F.; Nassif, N.; Mouneimne, A.H.; El Hachem, C.; Saadeh, I. Determination of Some Key Performance Indicators for Some Strategic Crops within South Bekaa Irrigation Scheme in Lebanon. 2022. Available online: https://crea.uclm.es/crea/act_files/doc/SUPWAS_Conference_2022/Block_9/44%202022_KPIs_Full%20paper_Karam%20et%20al_Final.pdf (accessed on 6 April 2024).
- Fredrick, M.K.E.; Mwanzia, J.; Nyabuto, W. Influencers of Performance Contracting in Service Delivery: A Trend Analysis in the State Department of Water and Irrigation of Kenya. Int. J. Acad. Res. Bus. Soc. Sci. 2020, 10, 193–214. [Google Scholar] [CrossRef] [PubMed]
- Parra, L.; Botella-Campos, M.; Puerto, H.; Roig-Merino, B.; Lloret, J. Evaluating Irrigation Efficiency with Performance Indicators: A Case Study of Citrus in the East of Spain. Agronomy 2020, 10, 1359. [Google Scholar] [CrossRef]
- Ogata, R.; Mahasneh, S.; Alananbeh, A.; Fujii, N. Insights into water service quality in Jordan from key performance indicators and consumer perceptions. Util. Policy 2022, 78, 101406. [Google Scholar] [CrossRef]
- Ahmed, N.; Turchini, G.M. Recirculating aquaculture systems (RAS) Environmental solution and climate change adaptation. J. Clean. Prod. 2021, 297, 126604. [Google Scholar] [CrossRef]
- Allan, C.; Xia, J.; Pahl-Wostl, C. Climate change and water security: Challenges for adaptive water management, Current Opinion in Environmental. Sustainability 2013, 5, 625–632. [Google Scholar] [CrossRef]
- Chartzoulakis, K.; Bertaki, M. Sustainable Water Management in Agriculture under Climate Change. Agric. Agric. Sci. Procedia 2015, 4, 88–98. [Google Scholar] [CrossRef]
- Devi, K.P.; Chaturvedi, H. Chapter 9—An overview of nanotechnology in water treatment applications and combating climate change. In Water Conservation in the Era of Global Climate Change; Thokchom, B., Qiu, P., Singh, P., Iyer, P.K., Eds.; Elsevier: Amsterdam, The Netherlands, 2021; pp. 191–212. [Google Scholar] [CrossRef]
- Filho, W.L.; Wall, T.; Mucova, S.A.R.; Nagy, G.J.; Balogun, A.; Luetz, J.M.; Artie, W.N.; Kovaleva, M.; Azam, F.M.S.; Alves, F.; et al. Deploying artificial intelligence for climate change adaptation. Technol. Forecast Soc. 2022, 180, 121662. [Google Scholar] [CrossRef]
- Gago, J.; Douthe, C.; Florez-Sarasa, I.; Jose, M.E.; Jeroni, G.; Alisdair, R.F.; Jaume, F.; Hipolito, M. Opportunities for improving leaf water use efficiency under climate change conditions. Plant Sci. J. 2014, 226, 108–119. [Google Scholar] [CrossRef] [PubMed]
- Hong, N.B.; Yabe, M. Improvement in irrigation water use efficiency: A strategy for climate change adaptation and sustainable development of Vietnamese tea production. Environ. Dev. Sustain. 2017, 19, 1247–1263. [Google Scholar] [CrossRef]
- Jerry, L.H.; Christian, D. Water-Use Efficiency: Advances and Challenges in a Changing Climate. Front. Plant Sci. Sec. Plant Physiol. 2019, 10, 103. [Google Scholar] [CrossRef]
- Lorenzo, R. Adapting agriculture to climate change via sustainable irrigation: Biophysical potentials and feedbacks. Environ. Res. Lett. 2022, 17, 063008. [Google Scholar] [CrossRef]
- Malek, K.; Adam, J.; Stockle, C.; Brady, M.; Rajagopalan, K. Water Resources Research, When Should Irrigators Invest in More Water-Efficient Technologies as an Adaptation to Climate Change. Water Resour. Res. 2018, 54, 8999–9032. [Google Scholar] [CrossRef]
- Nikolaou, G.; Neocleous, D.; Christou, A.; Kitta, E.; Katsoulas, N. Implementing Sustainable Irrigation in Water-Scarce Regions under the Impact of Climate Change. Agronomy 2020, 10, 1120. [Google Scholar] [CrossRef]
- Rafiei-Sardooi, E.; Azareh, A.; Shooshtari, S.J.; Parteli, E.J.R. Long-term assessment of land-use and climate change on water scarcity in an arid basin in Iran. Ecol. Model. 2022, 467, 109934. [Google Scholar] [CrossRef]
- Sheikha-Bagem Ghaleh, S.; Babazadeh, H.; Rezaie, H.; Sarai-Tabrizi, M. The effect of climate change on surface and groundwater resources using WEAP-MODFLOW models. Appl. Water Sci. 2023, 13, 121. [Google Scholar] [CrossRef]
- Zhang, F.; Ju, W.; Shen, S.; Wang, S.; Yu, G.; Han, S. How recent climate change influences water use efficiency in East Asia. Theor. Appl. Climatol. 2014, 116, 359–370. [Google Scholar] [CrossRef]
- Zhang, S.; Zhang, J.; Jing, X.; Wang, Y.; Wang, Y.; Yue, T. Water saving efficiency and reliability of rainwater harvesting systems in the context of climate change. J. Clean. Prod. 2018, 196, 1341–1355. [Google Scholar] [CrossRef]
- Organik Tarım İstatistikleri. 2023. Available online: https://www.tarimorman.gov.tr/Konular/Bitkisel-Uretim/Organik-Tarim/Istatistikler (accessed on 6 April 2024).
- Bitkisel Üretim Verileri. Available online: https://www.tarimorman.gov.tr/sgb/Belgeler/SagMenuVeriler/BUGEM.pdf (accessed on 6 April 2024).
- Bitkisel Üretim İstatistikleri. 2014–2021. Available online: https://data.tuik.gov.tr/Kategori/GetKategori?p=Tarim-111 (accessed on 6 April 2024).
- Türkiye’de Sulanan Bitkilerin Su Tüketim Rehberi. Ankara 2017. Available online: https://www.tarimorman.gov.tr/TAGEM/Belgeler/yayin/Tu%CC%88rkiyede%20Sulanan%20Bitkilerin%20Bitki%20Su%20Tu%CC%88ketimleri.pdf (accessed on 6 April 2024).
- Directorate General of Water Management. Aras Basin Drought Management Plan Project Preliminary Report; Directorate General of Water Management: Ankara, Turkey, 2021. [Google Scholar]
- Öztürk, Y.; Yulu, A.; Turgay, O. Remote sensing supported analysis of the effect of wind erosion on local air pollution in arid regions: A case study from Iğdır province in eastern Türkiye. Environ. Syst. Res. 2023, 12, 13. [Google Scholar] [CrossRef]
- Adrese Dayalı Nüfus Kayıt Sistemi Sonuçları. 2022. Available online: https://data.tuik.gov.tr/Bulten/Index?p=Adrese-Dayali-Nufus-Kayit-Sistemi-Sonuclari-2022-49685 (accessed on 6 April 2024).
- Şimşek, M.; Gülsoy, E.; Karadaş, K. Iğdır İlinin Meyvecilik Potansiyeli ve İl Ekonomisine Katkısı. Iğdır Üni. Fen Bilimleri Enst. Derg. 2018, 8, 39–44. [Google Scholar] [CrossRef]
- Toprak ve Su Kaynakları. Available online: https://bolge24.dsi.gov.tr/Sayfa/Detay/967 (accessed on 6 April 2024).
- Iğdır Büyük Ova Koruma Alanı Genişletme Çalışmaları. Available online: https://igdir.tarimorman.gov.tr/Haber/599/Igdir-Buyukova-Koruma-Alani-Genisletme-Calismalari-Baslatildi (accessed on 9 June 2020).
- Iğdır İklim Verileri. Available online: https://www.mgm.gov.tr/veridegerlendirme/il-ve-ilceler-istatistik.aspx?m=IGDIR (accessed on 6 April 2024).
- 2022 yılı Türkiye İklim Raporu ve Değerlendirmeleri. Available online: https://www.mgm.gov.tr/iklim/iklim-raporlari.aspx (accessed on 1 January 2023).
- Cançelik, M.; Şahin, Z.; Sevinç, M.R.; Küçük, N.; Aydoğdu, M.H. The Analysis of the Recent Periods of Wheat Market in Turkey. ITEGAM-JETIA 2021, 7, 57–62. [Google Scholar] [CrossRef]
- Buğday Tarımı. Available online: https://arastirma.tarimorman.gov.tr (accessed on 6 April 2024).
- Bitkisel Üretim Destekleme Tebliği. Available online: https://www.tarimorman.gov.tr/Duyuru/1716/2022-Yili-Havzalarda-Desteklenecek-Urun-Listeleri (accessed on 29 September 2023).
- Kazak, G.; Özşenler, S.; Artukoğlu, M.M.; Yıldız, Ö. Sanayi Domatesi Üretimi ve Pazarlamasında Karşılaşılan Sorunlar: İzmir İli Torbalı İlçesi Örneği. Tarım Ekon. Derg. 2018, 24, 215–223. [Google Scholar] [CrossRef]
- Baran, M.F.; Gökdoğan, O. Karpuz ve Kavun Yetiştiriciliğinde Enerji Girdi-Çıktı Analizi: Kırklareli İli Örneği. Anadolu Tarım Bilim. Derg. 2014, 29, 217–224. [Google Scholar] [CrossRef]
- Bashimov, G. Elma İhracatında Türkiye’nin Karşılaştırmalı Üstünlüğü. Adnan Menderes Üniversitesi Ziraat Fakültesi Derg. 2016, 13, 9–15. [Google Scholar] [CrossRef]
- Tarımsal Ekonomi ve Politika Geliştirme Ensitüsü. Available online: https://arastirma.tarimorman.gov.tr/tepge/Belgeler/PDF%20Tar%C4%B1m%20%C3%9Cr%C3%BCnleri%20Piyasalar%C4%B1/2021-Haziran%20Tar%C4%B1m%20%C3%9Cr%C3%BCnleri%20Raporu/Elma,%20Haziran-2021,%20Tar%C4%B1m%20%C3%9Cr%C3%BCnleri%20Piyasa%20Raporu,%20TEPGE.pdf (accessed on 2 June 2021).
- Özüpekçe, S. Malatya’da Tarımsal Arazi Kullanımı ve Kayısı Tarımının Önemi. Al-Farabi Int. J. Soc. Sci. 2021, 61, 62–77. [Google Scholar]
- Vural, H.; Çakan, V.A. Türkiye Şeftali Piyasasının Ekonomik Analizi ve Pazarlama Marjları. KSÜ Tarım Doğa Derg. 2021, 24, 379–387. [Google Scholar] [CrossRef]
- English, M.; Raja, N.S. Perspectives on deficit irrigation. Agric. Water Manag. 1996, 32, 1–14. [Google Scholar] [CrossRef]
- Fereres, E.; Soriano, A. Deficit irrigation for reducing agricultural water use. J. Exp. Bot. 2007, 58, 147–159. [Google Scholar] [CrossRef] [PubMed]
- Yu, L.; Zhao, X.; Gao, X.; Siddique, K. Improving/maintaining water-use efficiency and yield of wheat by deficit irrigation: A global meta-analysis. Agric. Water Manag. 2020, 228, 105906. [Google Scholar] [CrossRef]
- Klocke, L.N.; Currie, S.R.; Tomsicek, J.D.; Koehn, J. Corn Yield Response to Deficit Irrigation. ASABE 2011, 54, 931–940. [Google Scholar] [CrossRef]
- Payero, J.; Melvin, S.; Irmak, S.; Tarkalson, D. Yield response of corn to deficit irrigation in a semiarid climate. Agric. Water Manag. 2006, 84, 101–112. [Google Scholar] [CrossRef]
- Yang, C. Water Deficiency and Rice Production in Taiwan. J. Agric. Meteorol. 1997, 52, 735–744. [Google Scholar] [CrossRef]
- Geerts, S.; Raes, D. Deficit irrigation as an on-farm strategy to maximize crop water productivity in dry areas. Agric. Water Manag. 2009, 96, 1275–1284. [Google Scholar] [CrossRef]
- Comas, L.; Trout, T.; DeJonge, K.; Zhang, H.; Gleason, S. Water productivity under strategic growth stage-based deficit irrigation in maize. Agric. Water Manag. 2019, 212, 433–440. [Google Scholar] [CrossRef]
| Key performance indicators for water production and transmission performance | Abstraction Performance (%) | The ratio of the water volume at the beginning of the transmission line to the water volume abstracted from the resource (×100). |
| Transmission Performance (%) | The ratio of water directed for irrigation to the water volume at the beginning of the transmission line (×100). | |
| Water Losses Per the Length of Infrastructure (m3/km) | The ratio of the volume of water loss to the length of the pipeline (ducts or pipes). | |
| Water Losses Per Irrigation Area (m3/ha) | The ratio of the amount of water loss to the surface area of the irrigation area served. | |
| Key performance indicators for irrigation and agricultural performance | Crop Water Demands (m3/ha) | The ratio of the amount of water used for each crop to the surface area of the cultivated crop. |
| Irrigation System Performance (for Flood, Sprinkler, and Drip Irrigation Systems) (%) | The ratio of the evapotranspiration of the crop to the volume used for irrigation by the system (×100). | |
| Application Performance (%) | The ratio of the evapotranspiration of the crop to the volume of water allocated for irrigation of the crop (×100). | |
| Crop Yield Performance (m3/kg) | The ratio of the volume of water allocated for irrigation of the crop (m3/ha) to the crop yield (kg/ha). | |
| Water Use Performance (kg/m3) | The ratio of the volume of water allocated for irrigation of the crop under consideration. |
| Crop Pattern in the Plain | Total (Hectares) | Ratio (%) | |
|---|---|---|---|
| I. Crop Groups: Field Crops | Barley | 3067.70 | 5.7 |
| Wheat * | 11,455.00 | 21.2 | |
| Beans (Dried) | 57.00 | 0.1 | |
| Vetch (Green Grass) | 200.00 | 0.4 | |
| Sainfoin (Green Grass) | 1450.00 | 2.7 | |
| Maize (Grain)—First Cultivation | 2595.00 | 4.8 | |
| Maize (Silage) * | 6327.60 | 11.7 | |
| Chickpeas | 31.50 | 0.1 | |
| Cotton (Unseeded)—First Cultivation | 310.00 | 0.6 | |
| Potato (Other)—First Cultivation | 60.20 | 0.1 | |
| Sugar Beet | 146.60 | 0.3 | |
| Clover (Greengrass) * | 28,115.00 | 52.0 | |
| Paddy—First Cultivation | 205.00 | 0.4 | |
| Total Field Crops | 54,020.60 | 100 | |
| II. Crop Groups: Vegetables | Pepper | 150.30 | 4.2 |
| Tomato (Table) * | 949.70 | 26.7 | |
| Beans (Fresh) | 104.30 | 2.9 | |
| Cucumber (Table) | 234.30 | 6.6 | |
| Spinach | 45.00 | 1.3 | |
| Watermelon * | 858.30 | 24.2 | |
| Melon * | 1066.30 | 30.0 | |
| Aubergine | 142.50 | 4.0 | |
| Total Vegetables | 3550.70 | 100 | |
| III. Crop Groups: Fruits | Pear | 35.00 | 0.6 |
| Apple * | 1898.30 | 32.4 | |
| Plum | 29.70 | 0.5 | |
| Apricot * | 3530.00 | 60.2 | |
| Cherries | 40.00 | 0.7 | |
| Peach * | 209.30 | 3.6 | |
| Walnut | 110.00 | 1.9 | |
| Cherry | 13.50 | 0.2 | |
| Total Fruits | 5865.80 | 100 | |
| Total Irrigated Crops | 63,437.10 | 100 |
| Crop | The Relationship between Irrigation Rate (x) and Water Deficiency Cost (y) | R2 | Average Water Deficiency Cost ($/m3) | Average Product Loss (Tons) |
|---|---|---|---|---|
| Wheat | log(y) = 1.8624 − 0.053x | 0.9613 | 0.32 | 4767 |
| Maize | log(y) = 5.9854 − 0.062x | 0.9773 | 0.85 | 33,584 |
| Clover | log(y) = 365.16 − 0.063x | 0.9668 | 51.69 | 48,417 |
| Tomato | log(y) = 18.053 − 0.062x | 0.9834 | 2.39 | 5945 |
| Watermelon | log(y) = 11.5 − 0.059x | 0.9774 | 0.80 | 3469 |
| Melon | log(y) = 10.789 − 0.059x | 0.9656 | 1.56 | 3801 |
| Apple | log(y) = 10.743 − 0.058x | 0.9711 | 1.61 | 9008 |
| Apricot | log(y) = 15.028 − 0.06x | 0.9902 | 1.96 | 10,636 |
| Peach | log(y) = 14.026 − 0.055x | 0.9668 | 2.22 | 741 |
Disclaimer/Publisher’s Note: The statements, opinions and data contained in all publications are solely those of the individual author(s) and contributor(s) and not of MDPI and/or the editor(s). MDPI and/or the editor(s) disclaim responsibility for any injury to people or property resulting from any ideas, methods, instructions or products referred to in the content. |
© 2024 by the author. Licensee MDPI, Basel, Switzerland. This article is an open access article distributed under the terms and conditions of the Creative Commons Attribution (CC BY) license (https://creativecommons.org/licenses/by/4.0/).
Share and Cite
Karaaslan, Y. Examining Crop Yield Losses in Iğdır Plain Irrigation Systems in Türkiye Amidst Water Constraints. Sustainability 2024, 16, 5859. https://doi.org/10.3390/su16145859
Karaaslan Y. Examining Crop Yield Losses in Iğdır Plain Irrigation Systems in Türkiye Amidst Water Constraints. Sustainability. 2024; 16(14):5859. https://doi.org/10.3390/su16145859
Chicago/Turabian StyleKaraaslan, Yakup. 2024. "Examining Crop Yield Losses in Iğdır Plain Irrigation Systems in Türkiye Amidst Water Constraints" Sustainability 16, no. 14: 5859. https://doi.org/10.3390/su16145859