Article

Effect of Surface Area, Particle Size and Acid Washing on the Quality of Activated Carbon Derived from Lower Rank Coal by KOH Activation

Centre for Water Energy and Waste, Harry Butler Institute, College of Science, Health, Engineering and Education, Murdoch University, 90 South Street, Murdoch, Perth, WA 6150, Australia
*
Author to whom correspondence should be addressed.
Sustainability 2024, 16(14), 5876; https://doi.org/10.3390/su16145876
Submission received: 20 June 2024 / Revised: 7 July 2024 / Accepted: 9 July 2024 / Published: 10 July 2024

Abstract

:
The use of coal-derived activated carbon (AC) for water treatment applications demands more sustainable production methods, with chemical activation emerging as a promising alternative to thermal activation due to its higher AC quality, lower carbon burn-off, and higher yield. The study explored the effect of surface area, particle size and acid washing on the quality of AC derived from three seams of lower-rank Collie coal under the same activation conditions with potassium hydroxide (KOH). The quality of AC was determined by surface area and iodine number. The study demonstrates that Collie coal, suitable for AC production via KOH activation, yielded iodine numbers of 640 and 900 mg/g, with yields of 53 and 57 wt.%. Particle size influenced AC yield, with finer particle sizes yielding AC at 57–59 wt.%, whereas coarser ones yielded around 58–65 wt.%. SEM analysis shows the well-developed porous structure in Collie coal-derived activated carbons, with cleaner particles after acid washing. A positive correlation exists between coal surface area and AC iodine numbers, with higher values in coal samples correlating to increased iodine numbers in resulting AC. The regression model’s predicted values yield a coefficient of determination (R²) of 0.99.

1. Introduction

Activated carbon (AC) is widely used in water treatment, as well as in the recovery of gold and silver through carbon-in-pulp (CIP) and carbon-in-leach (CIL) metallurgical processes, and emission control [1,2,3]. AC is valuable due to its large surface area and intricate pore structure, which can be assessed through various tests such as phenol, tannin, iodine number, and molasses adsorption. Among these, the iodine number is particularly favoured by industry, especially in water treatment applications, as it provides valuable insights into the carbon’s iodine absorption capacity. Iodine numbers above 700 are preferred for wastewater treatment. The most common method for producing AC from coal is thermal activation, which involves heating coal at elevated temperatures in the presence of steam to create microporosity in the devolatilised char. However, this approach is unsustainable due to its high coal consumption and associated emissions. Chemical activation presents a more viable alternative, offering enhanced AC quality, reduced emissions, and increased yields.
The commonly used raw materials for producing AC are coal, bamboo, fruit shells, wood and agricultural waste [4,5,6,7]. With more than 67% of global AC production derived from coal, the forecast indicates that coal-based AC plays a critical role in meeting increasing demand. Different coals contain varying properties that change depending on geological sources, with physical and chemical properties undergoing alterations in response to differing levels of metamorphism [8]. It is well known that coal properties, such as coal rank, particle size, activation method and activation parameters, influence AC quality and yield [9,10,11].
Permian coal in Collie, Western Australia, discovered by Arthur Perrin in 1883, commenced production in 1898 [12]. Collie coal is a sub-bituminous and lower-rank coal, mainly used in power generation and industrial applications, including use as a reducing agent in synthetic rutile production from ilmenite [13,14,15]. This coal, containing sedimentary rocks from the Permian era, resembles black coal, with chemical and physical properties ranging from lignite to highly volatile bituminous coal [16]. The Permian coal measures are characterised by variability in coal seams and properties.
With a decline in the use of coal for power generation, adopting chemical activation to produce AC from Collie coal offers an opportunity to meet the increasing demand for AC. Producing good quality AC is challenging due to the variability of coal seams and properties. Properties such as coal porosity and particle size influence mining, preparation, and utilisation, with precursor rank and pore structure guiding predictions for the suitability of conversion processes [17]. Previous studies indicate that coal particle size notably impacts pyrolysis, influencing char size distributions and yield [18,19]. Coal reactivity declines as particle size increases, while an increase in particle size correlates with higher char yield. A study of coal properties, particularly the effect of surface area and particle size on iodine number, will further improve the current understanding of AC production and aid in selecting suitable coals, minimising carbon wastage.
The AC from coal is produced through thermal or chemical activation [20,21]. Figure 1 depicts a schematic overview of different AC production methods from coal and major applications. Thermal activation involves drying, carbonisation, and activation processes, eliminating moisture and volatiles from coal to produce char [22]. Char undergoes thermal activation at temperatures above 800 °C with activating gases such as steam, CO2, or air to develop microporosity [11]. However, this method has its drawbacks, as it requires approximately 4 to 5 tonnes of lower-rank coal to produce 1 tonne of AC, leading to the generation of emissions. Consequently, an alternative AC production method that minimises emission without compromising the product’s quality and grade is desirable.
Figure 1 shows conventional chemical activation involving a two-step process: coal is volatilised to produce char, which is then impregnated with a chemical agent before activation. In contrast, this study employs a single-step activation method by directly impregnating coal with KOH for activation. Chemical activation uses a suitable chemical agent as an activating agent at temperatures ranging from 500 to 800 °C [23]. A subsequent washing step removes the chemicals and impurities, enhancing the product’s quality. Factors that affect chemical activation include particle size, surface area, mineral content, the type and concentration of the activating agent, the activation temperature, the reaction time, and post-treatment conditions. Commonly used chemical activating agents include zinc chloride, sodium hydroxide, and potassium hydroxide (KOH), which act as dehydrating agents and improve AC porosity and overall quality [24,25]. NaOH and KOH enhance carbon yield by preventing tar or ash formation and increasing micro and meso porosity and surface area. However, KOH-activated ACs yield more with narrower pores, which is important for water treatment applications. KOH activation is widely recognised for efficiently producing a variety of microporous carbons from various carbon precursors [26]. Using KOH as the activating agent in chemical AC production not only reduces waste but also facilitates a more sustainable process, as demonstrated by Montes and Hill’s emphasis on KOH recovery and recycling in the production of AC from carbon black [27].
The AC produced through the chemical activation method offers some advantages, primarily attributed to its activation at temperatures below 800 °C, leading to reduced emissions and increased product yields compared with thermal activation. In this method, 1 tonne of AC production requires approximately 2 to 3 tonnes of lower-rank coal. The AC has highly coveted properties, characterised by high internal surface area, high microporosity, and exceptional adsorption properties [28,29]. The demand for AC products has continuously grown due to stringent environmental regulations [30,31]. Research has focused on the production of AC from diverse coal seams.
There are limited studies on the effects of coal surface area and particle size on AC quality. The current literature shows no AC production from Collie coal via chemical activation. Therefore, this study focused on producing AC from three coal seams under the same chemical activation conditions (Figure 1). The study aims to characterise three coal samples and investigate how their properties, including surface area, particle size, and the acid washing step, affect the iodine number and yield of AC.

2. Materials and Methods

2.1. Sample Preparation

Three representative bulk coal samples, A to C, were collected from distinct seams at the Collie coal mine. The samples displayed minor differences in their physical and chemical properties attributable to lithography. Subsequently, the samples were processed using a jaw crusher. After crushing, the coal was screened using a 3 mm sieve, separating two fractions: the −3 mm fraction and the +3 mm fraction for each coal.

2.2. Activation of Coal

In each activation test, a 50 g coal sample was thoroughly mixed with a 0.1 M KOH solution and allowed to soak overnight before undergoing drying in an oven at 110 °C for 1440 min. Subsequently, the dried coal samples were introduced into an activation furnace at room temperature. The furnace’s temperature was gradually raised from room temperature to an activation temperature of 700 °C at a rate of 10 °C per minute. The samples were then held at 700 °C for 60 min before being gradually cooled to room temperature at a rate of 10 °C per minute. The activated samples were washed with acid (0.01 M HCl solution) and water. The acid-washed samples were dried in the oven at 110 °C for 240 min.

2.3. Analytical Methods

2.3.1. Calorimetry

The calorific values of coal samples were determined using a CAL3K-U oxygen bomb calorimeter device in accordance with the ISO 18125 method [32].

2.3.2. Proximate and Ultimate Analyses

The composition and characteristics of coal samples were analysed through proximate and ultimate analyses. The proximate analysis in air-dried samples was conducted using a Leco TGA 701 thermogravimetric analyser (Leco, St. Joseph, MI, USA). The ultimate analysis was performed using an isotope ratio mass spectrometer (IRMS) with an elemental analyser.

2.3.3. Size Analysis

A standard vibrating sieve shaker (Endcotts Titan, 450, Endcotts, London, UK) with a brass diameter of 450 mm and screens of different sizes was used for sizing analysis. A standard time of 15 min was used.

2.3.4. Thermal Analysis

The thermal properties of the coal samples were measured by using a PerkinElmer STA 8000 instrument (PerkinElmer, Waltham, MA, USA). This instrument has the capability of both differential scanning calorimetry (DSC) and thermogravimetric analysis. A sample of air-dried coal samples with a mass of 21 ± 1 mg and an alumina ceramic crucible was used for this analysis.

2.3.5. Fourier Transform Infrared Analysis

A PerkinElmer Fourier transform infrared (FTIR) spectrometer equipped with an attenuated total reflection (ATR) accessory was used to obtain a high-quality spectrum at a resolution of 1 cm−1.

2.3.6. Surface Area Analysis

A Micromeritics TriStar II 3020 automated surface area and porosity analysis instrument (Micromeritics, Norcross, GA, USA) was used to measure the Brunauer–Emmett–Teller (BET) surface area, Langmuir, and t-Plot micropore area of the coal and AC samples. The samples were dried and degassed before the analysis. Liquid nitrogen at 77 K was used as the adsorption gas during analysis after degassing.

2.3.7. Iodine Analysis

The iodine number was determined using the method specified by ASTM International standard D4607 [33]. The AR-grade chemicals, including the iodine solution (0.01 M), sodium thiosulfate (0.1 M), hydrochloric acid (10.2 M), and titration agents, were purchased from Rowe Scientific, Western Australia.
The AC samples were milled and oven-dried before weighing. A sample mass of 0.8 to 1.2 g AC was added into a 250 mL beaker with 20 mL of a 5% (w/w) HCl solution, followed by gentle swirling for 10 s. The beaker was then placed on a hot plate (set at a temperature of 100 °C) for 30 s. After the heating period, the beaker was removed. Once the beaker had cooled, we added 100 mL of a 0.01 M iodine solution and shook it for 10 s before filtering it through a filter paper. A 50 mL filtered solution was titrated with a standard sodium thiosulfate solution to determine the amount of iodine that the AC had adsorbed. The iodine number of the activated carbon was then calculated by dividing the amount of iodine adsorbed by the weight of the sample.

2.3.8. Mineralogical Analyses

An X-ray fluorescence (XRF) spectrometer (Panalytical AxiosMax, Malvern, UK) was utilised to measure the elemental composition of the coal ash. The X-ray diffraction (XRD) spectra were obtained by using a Rigaku SmartLab XRD instrument (Rigaku, Washington, DC, USA), with a Cu radiation source. Scanning electron microscopy (SEM) was performed with a benchtop SEM instrument (Joel NeoScope, Joel, Tokyo, Japan).

3. Results and Discussion

3.1. Characterisation of the Coal Samples

3.1.1. Calorimetry

The net calorific values of the coal samples had heating values between 22 and 24 MJ/kg on a dry basis. Coal A had the lowest net calorific value of 22 MJ/kg, while Coal C had the highest net calorific value of 24 MJ/kg. According to ASTM standards, sub-bituminous coals have a net calorific value in the range of 19 to 27 MJ/kg (Hore-Lacy 2010). All the samples belong to the lower rank sub-bituminous B by the calorific value. The mean heating values (MJ/kg) for benzoic acid (standard), Coal A, B, and C were 27, 22, 23, and 24, respectively, with a standard deviation of 0.1.

3.1.2. Proximate and Ultimate Analyses

The proximate and ultimate analysis results of the coals are shown in Table 1. Variations in the moisture, volatiles, ash, and fixed carbon content among the samples were moderate. Coal C displayed the lowest ash content (2 wt.%) and a high fixed carbon content (56 wt.%), whereas Coal A showed a high volatile matter yield (41 wt.%) and low fixed carbon (52 wt.%). The volatile matter and fixed carbon content of Coal B fell between those of Coal A and Coal C. The air-dried samples had an average moisture content of approximately 4 wt.%. The total carbon and hydrogen content in the three coal samples ranged from 60 to 63 wt.% and from 6 to 7 wt.%, respectively. The ultimate analysis showed impurities such as nitrogen and sulphur in these coals. The sulphur content varied from 1 to 3 wt.%, and the nitrogen content was approximately 1 wt.%. When Coal A was burned for energy or the production of activated carbon, it may produce more sulphur dioxide (SO2), while Coal B could emit more nitrogen oxides (NOx) compared with Coals A and C. Coal C, with its low ash content, is more suitable for the production of AC [11], producing less carbon waste compared with Coals A and B.
The high volatile and ash content in the air-dried coals causes faster burning rates and generates more ash, leading to environmental pollution, acid rain and damage. However, cleaning strategies can mitigate these emissions through sulphur capture. According to USGS, fluidised bed combustion (FBC) is increasingly accepted for controlling sulphur emissions in coal combustion [34]. Finely ground coal and limestone are fed into a furnace on a moving grate and ignited at low temperatures with forced air. This process allows for the burning of high-sulphur coal while capturing up to 95 wt.% of SO2 and nitrogen oxides [35].

3.1.3. Particle Size Analysis

The particle size distributions of the as-received bulk coal samples, as shown in Figure 2, revealed significant variations among them. Coals A, B and C had 50% passing (P50) at 19, 21 and 30 mm, respectively. Coal A had smaller particles compared with Coal B and C. The size of coal particles is important, as it affects how the coal burns. Larger particles burn slowly, while smaller ones with more surface area burn faster, influencing the heat released during combustion. These differences in the burning rates may impact carbonisation and, consequently, how the activation of carbon occurs. Another factor that affects activation is the presence of certain ash species containing catalytic elements, such as alkali and alkaline earth metals, which can influence gasification and porosity formation [36].
In the current study, two size fractions were used. The as-received bulk coal samples were crushed to achieve 100% passing at 6 mm and then screened at 3 mm, resulting in two product sizes: fractions of −3 mm and +3 mm. The subsequent activation work was performed on the two fractions.

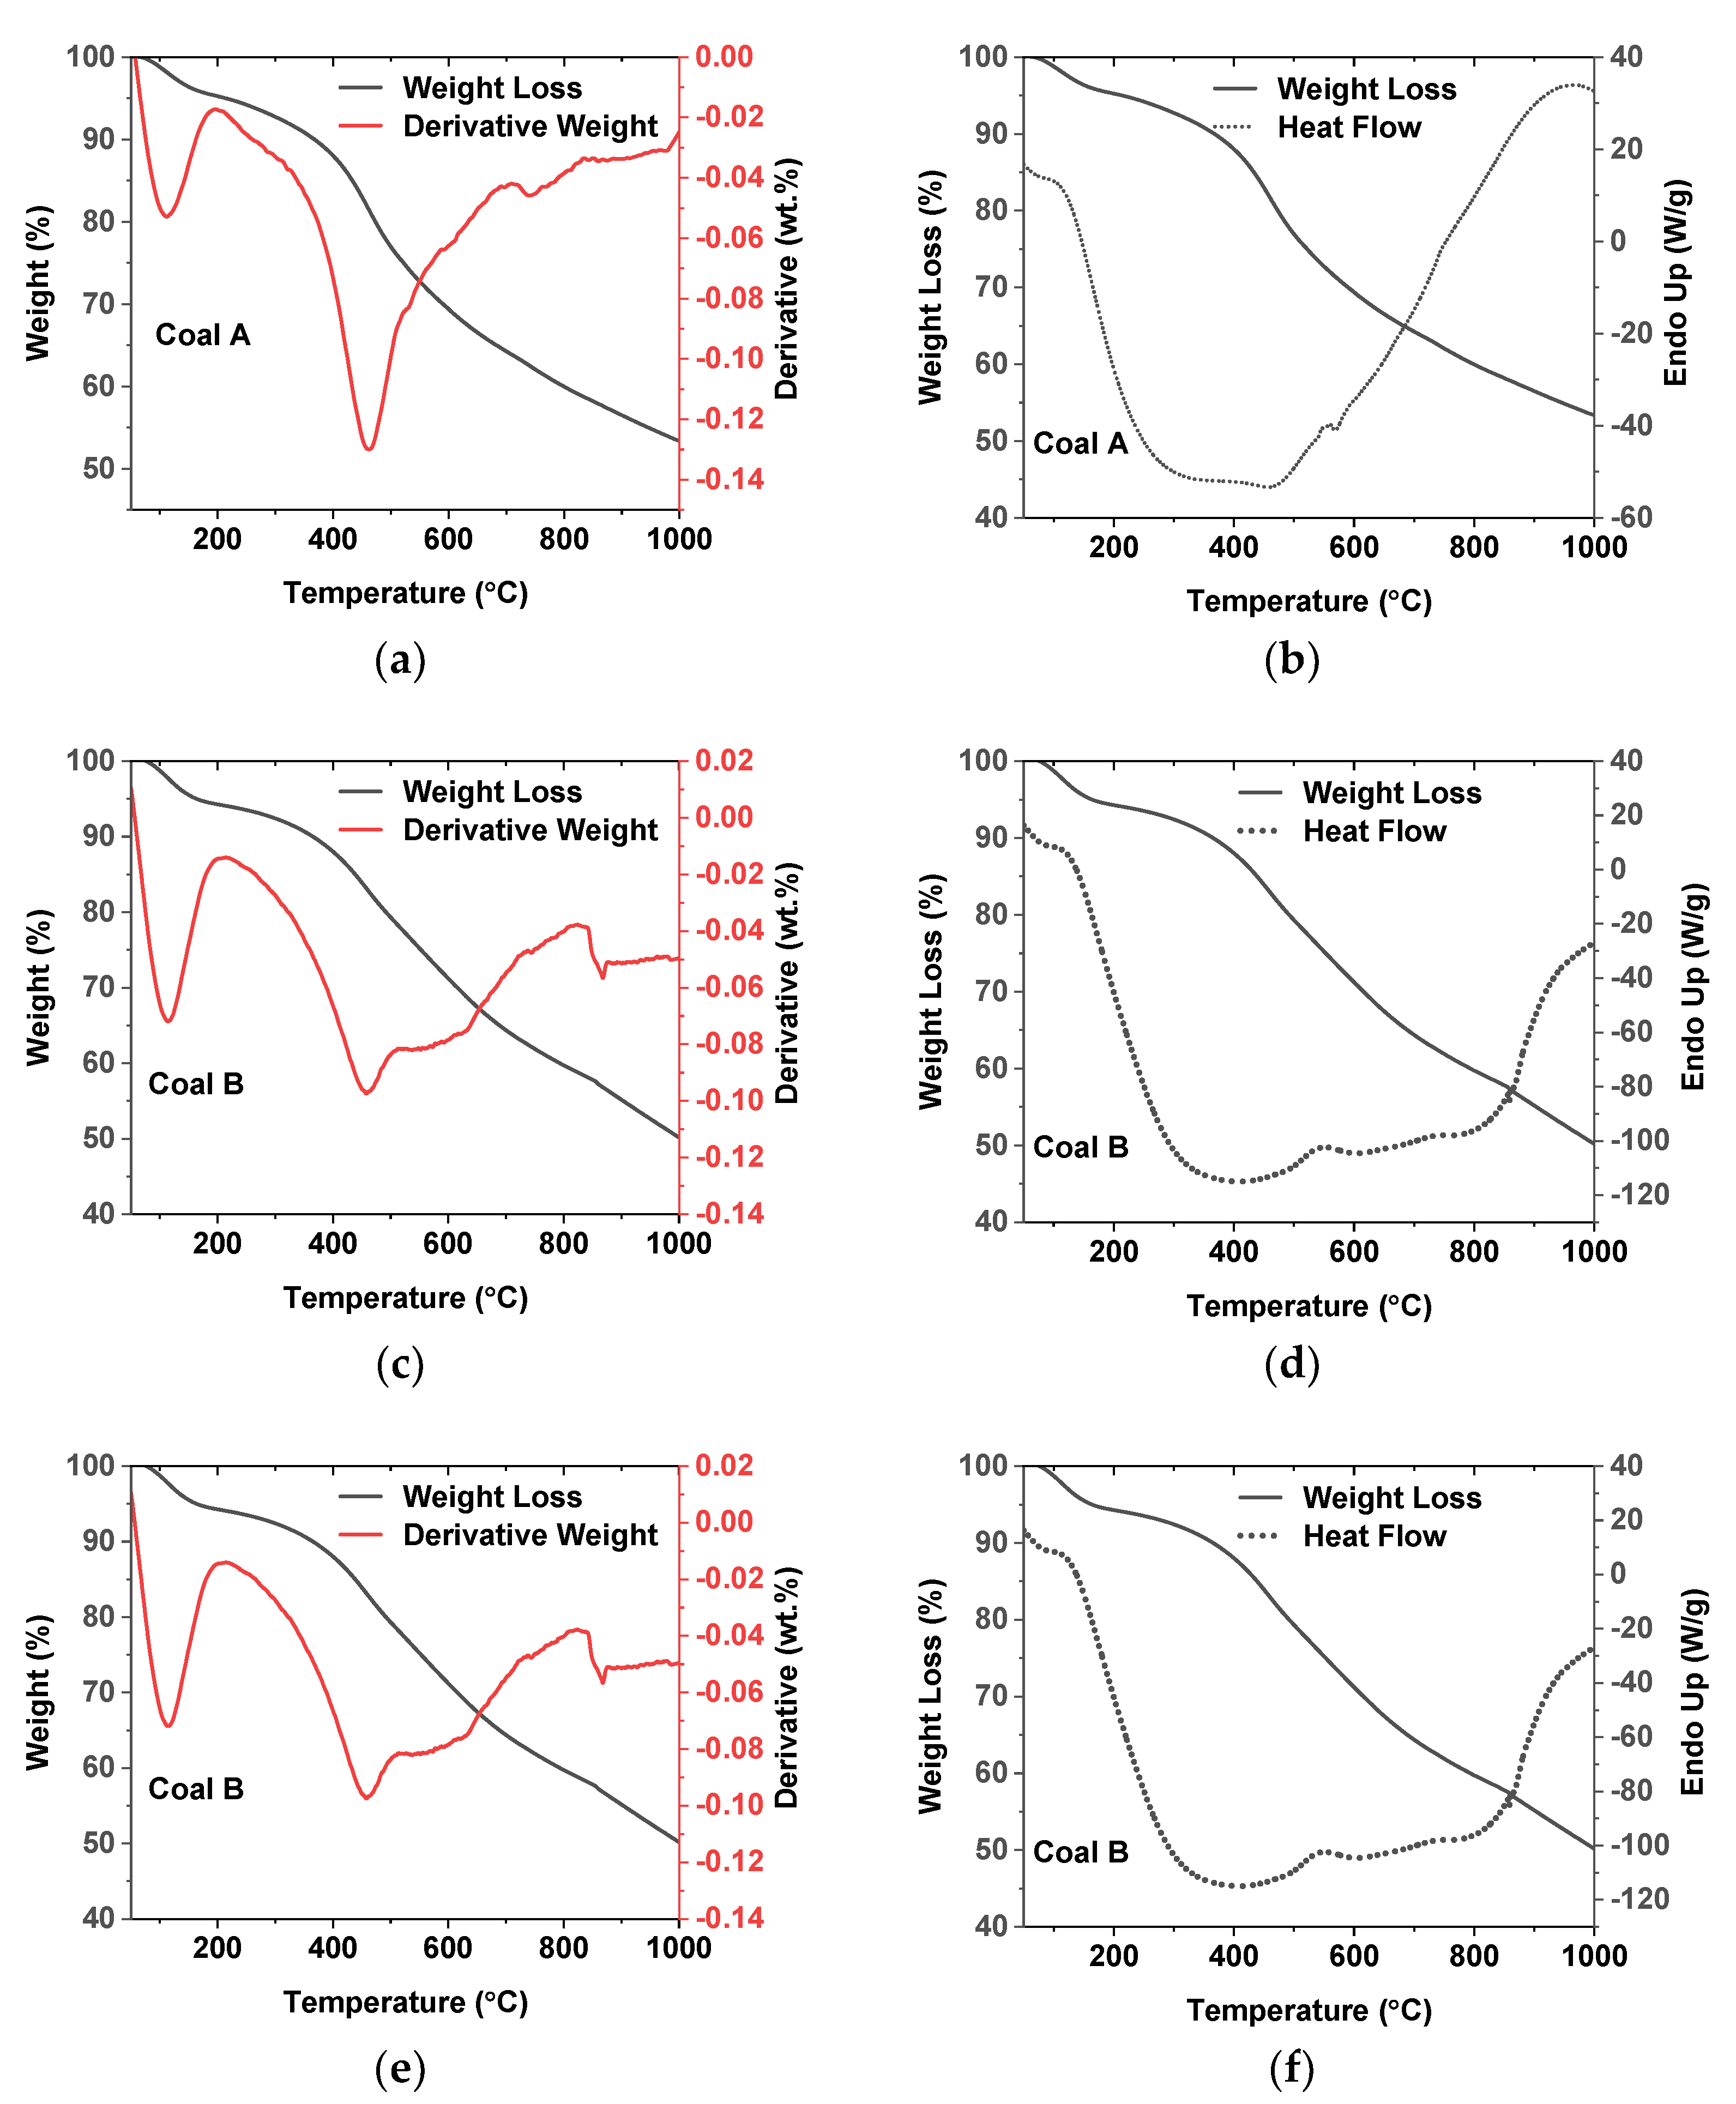
3.1.4. Thermal Analyses

The results obtained from the preliminary analysis of the coal samples are presented in Figure 3. Figure 3a,c,e display coal sample weight percentage and derivative weight percentage data with respect to temperature, whilst Figure 3b,d,f show weight percentage loss and heat flow data as functions of temperature. The change in the samples’ weight is reported as the weight loss (%) as the samples underwent thermal treatment. From the calculated derivate weight profiles and weight loss profiles, it was evident that most of the weight loss occurred due to the removal of moisture at approximately 110 °C and the removal of volatiles at around 460 °C. Weight loss amounts of 47%, 50% and 42% were observed for as-received Coals A, B and C, respectively.
The heat flow data indicated that the exothermic behaviour of the samples increased in the order of Coal B > Coal C > Coal A. Despite Coal A having a higher weight percentage of volatiles, its exothermic behaviour was still lower than that of Coals B and C. A possible explanation might be that a higher ratio of hydrogen to fixed carbon in coals generally produces higher energy upon combustion [37]. Coals A, B and C had hydrogen-fixed carbon ratios of 11.9, 12.6 and 12.5, respectively. These results indicated that Coal B exhibited higher exothermic behaviour than the other samples.

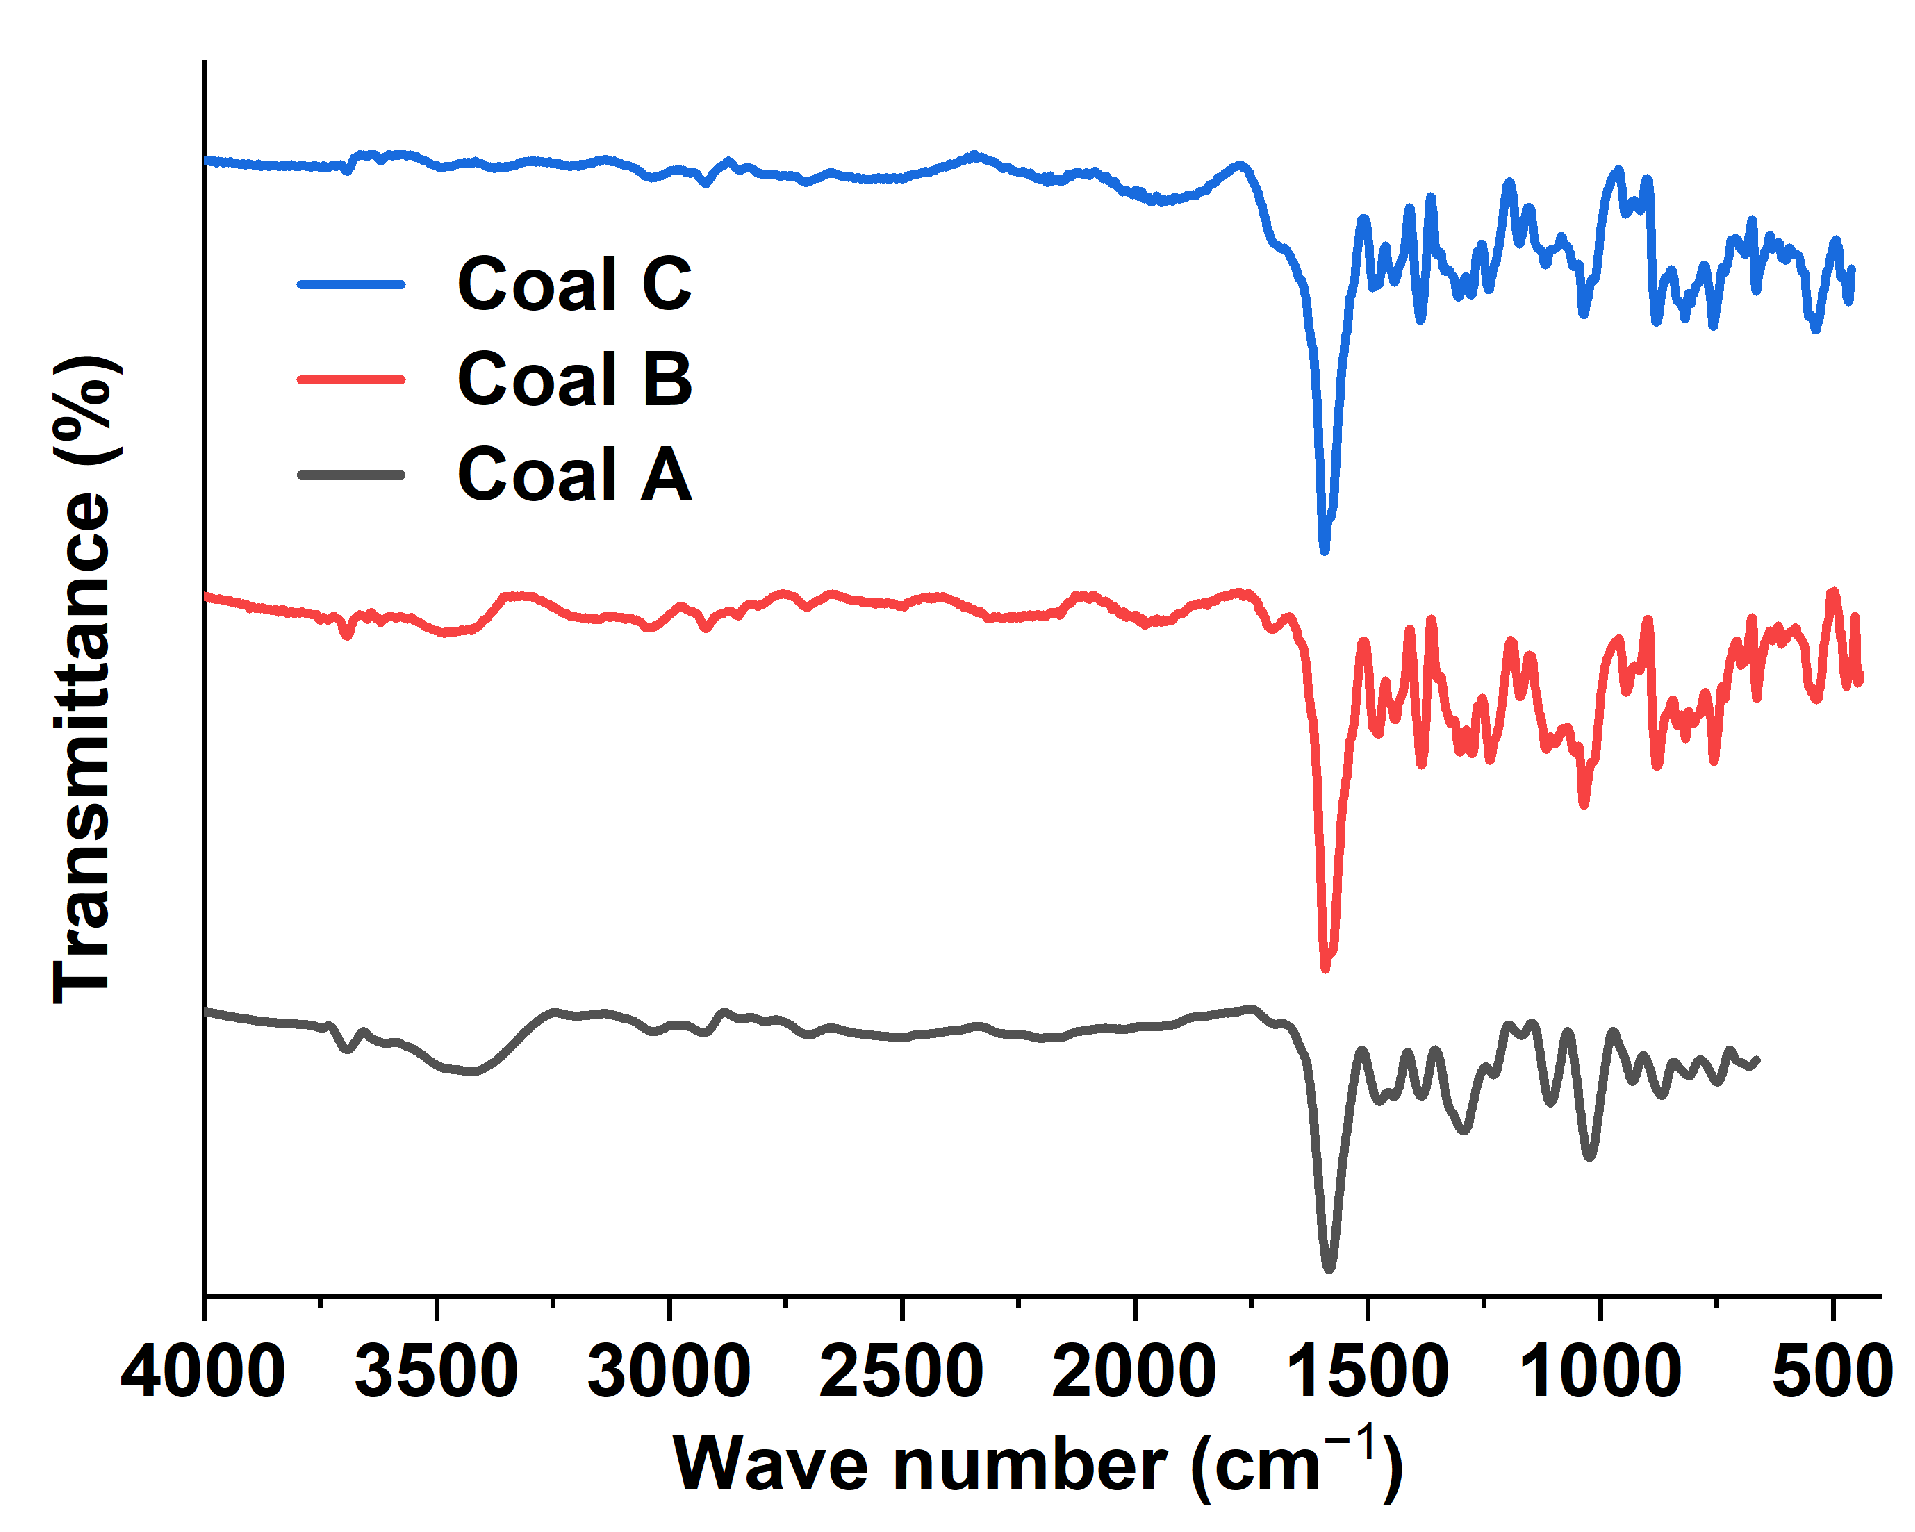
3.1.5. Fourier Transform Infrared Analysis

The FTIR analysis of the coal samples is shown in Figure 4. The FTIR peak positions observed in the coal samples were mostly within the spectral region of 1700 to 400 cm−1. Coal A had two more additional peaks at 3335 and 3694 cm−1, which belong to O-H stretching and surface hydroxyl groups, respectively. This observation supports that additional peaks could be due to the higher calculated oxygen content from the ultimate analysis.
The FTIR data (Appendix A, Table A1) displayed differences in the variations in the spectral bands, which could be related to the variation in the chemical composition of the coal samples. All the samples had C-O and Si-O-Al in the region of 1180 and 535 cm−1. The FTIR spectra of C=O stretching for Coal B and C appeared at 1640 cm−1, and those of C=C stretching for Coal A and B appeared at 1585 cm−1. The FTIR spectra provide valuable information on the presence of functional groups in coal samples. For example, the reactivity of a molecule, its interactions with other molecules, its structure, and the mechanism of a reaction can all be predicted using knowledge of the functional groups present. The presence of the C=O bond was a result of the decomposition of carboxylic acids in Coals B and C, which was significant, as it is a highly stable bond in coals [38]. The formation of C-O bonds in Coals A, B and C was a consequence of coalification, which occurs when the oxygen atoms in organic compounds react with carbon atoms to form carbon–oxygen bonds.

3.1.6. Surface Area Analysis

The results of the BET analysis, presented in Table 2, provided insights into the physical properties, including surface area and micropore area. Notably, differences in the surface area and micropore area were apparent. Moreover, the BET results showed an intriguing trend for the surface area, which increased in the following order: Coal C > B > A.
The activation of carbon is a controlled process achieved through the internal gasification of coal, leading to an increase in porosity. The surface area of coal has a significant impact on the C–O reaction during activation, facilitating faster kinetics by exposing more active sites to activating gas, thereby enhancing the efficiency of carbon activation. A previous study supported this, indicating that an increased surface area in coal char results in a higher gasification rate and a lower temperature [39]. The BET analysis of the coal samples provided valuable insights into the differences in surface area and porosity. These variations aid in assessing coal’s reactivity and gasification. A larger surface area aids the activation of carbon during gasification, improving efficiency and optimising industrial energy use.

3.1.7. Iodine Analysis

The iodine number is widely used to evaluate AC adsorptive capacity, representing the milligrams of iodine adsorbed by 1 g of carbon when the concentration of iodine in the residual filtrate is 0.02 N [40]. Coals A, B and C showed iodine numbers of 100, 110 and 120, respectively. The iodine number is a meaningful indicator of the microporosity in carbon samples.

3.1.8. Chemical Analysis of the Coal Ash

The ashed samples, processed through ashing at 830 °C for 360 min, were subjected to chemical analysis using XRF analysis. The ash composition of the samples is shown in Table 3. The ash consisted mainly of metalloid oxide (SiO2) and the metal oxides Al2O3, Fe2O3, MgO, CaO and TiO2. The main components of the ash were silica and alumina, contributing nearly 29–43% and 22–34%, respectively. Iron was another major element present as an oxide, contributing 12–19% of the ash (oxide basis).
The analysis of the ash’s chemical composition indicates the coal’s quality. The presence of high alumina and silica contents was mainly due to kaolinite, a clay mineral with the chemical formula of Al2Si2O5(OH)4, the most common mineral found in coal [41]. Sulphur in coals primarily originates from pyrite (FeS2), formed when sulphide interacts with iron. Pyrite, commonly found in coal seams, serves as an indicator of coal’s thermal maturity. The presence of iron, titanium, vanadium, cerium and phosphorous may be associated with ilmenite (FeTiO3) and monazite [(Ce, La, Nd, Th)PO4], typically found in beach sands.

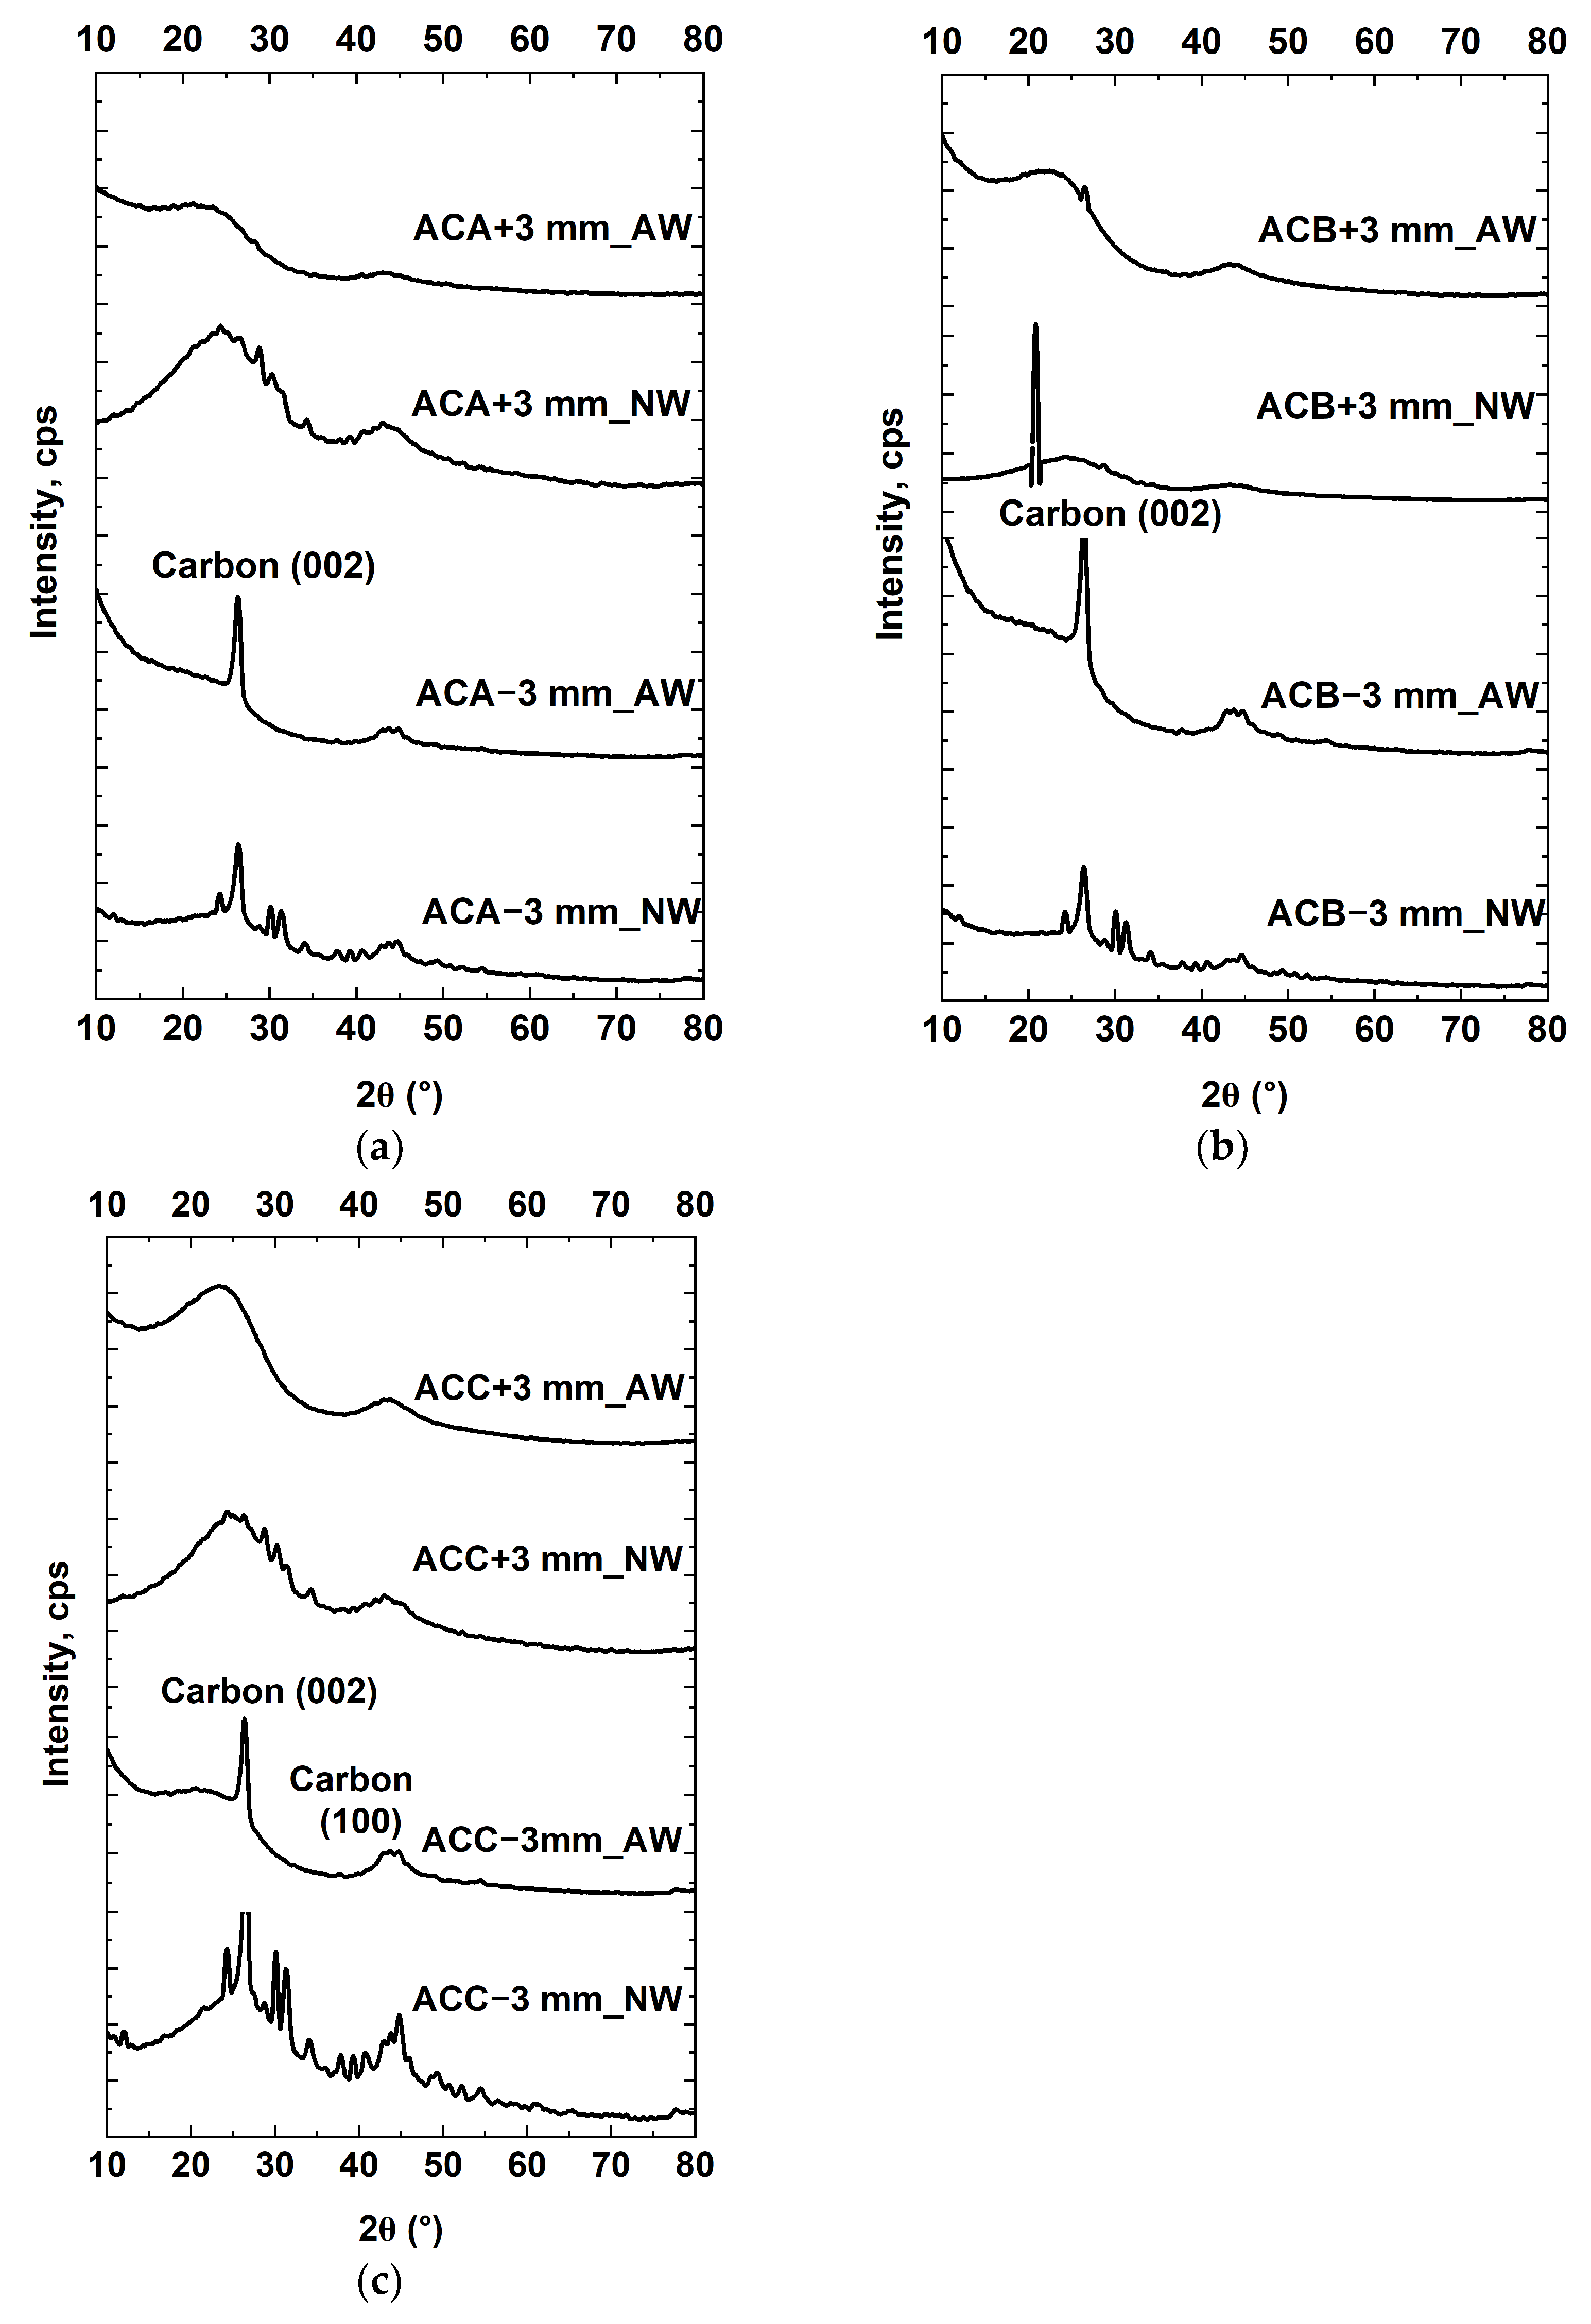
3.1.9. Mineralogical Analyses of Coal Samples

Figure 5 shows the XRD spectra of the coal samples. The results indicated that all the samples had similar spectra peaks, but minor differences in the presence of mineral phases. Two major mineralogical phases identified through the XRD analysis were kaolinite and quartz, as shown in Figure 5. Match XRD software version 3.15 was used to quantify the amorphous and crystalline contents in the samples. Coals A, B and C had an amorphous content of 82%, 80% and 79%, respectively. The degree of crystallinity was between 18% and 21% in the samples.
Figure 6 shows SEM images of the coal samples analysed at 500 µm magnification. It was evident from the SEM analysis that coal samples contained surface cracks of varying lengths. Moreover, the presence of some mineral matter on the surfaces was observed. The observations were consistent with the chemical analyses and mineralogical data.

3.2. Characterisation of Activated Carbons

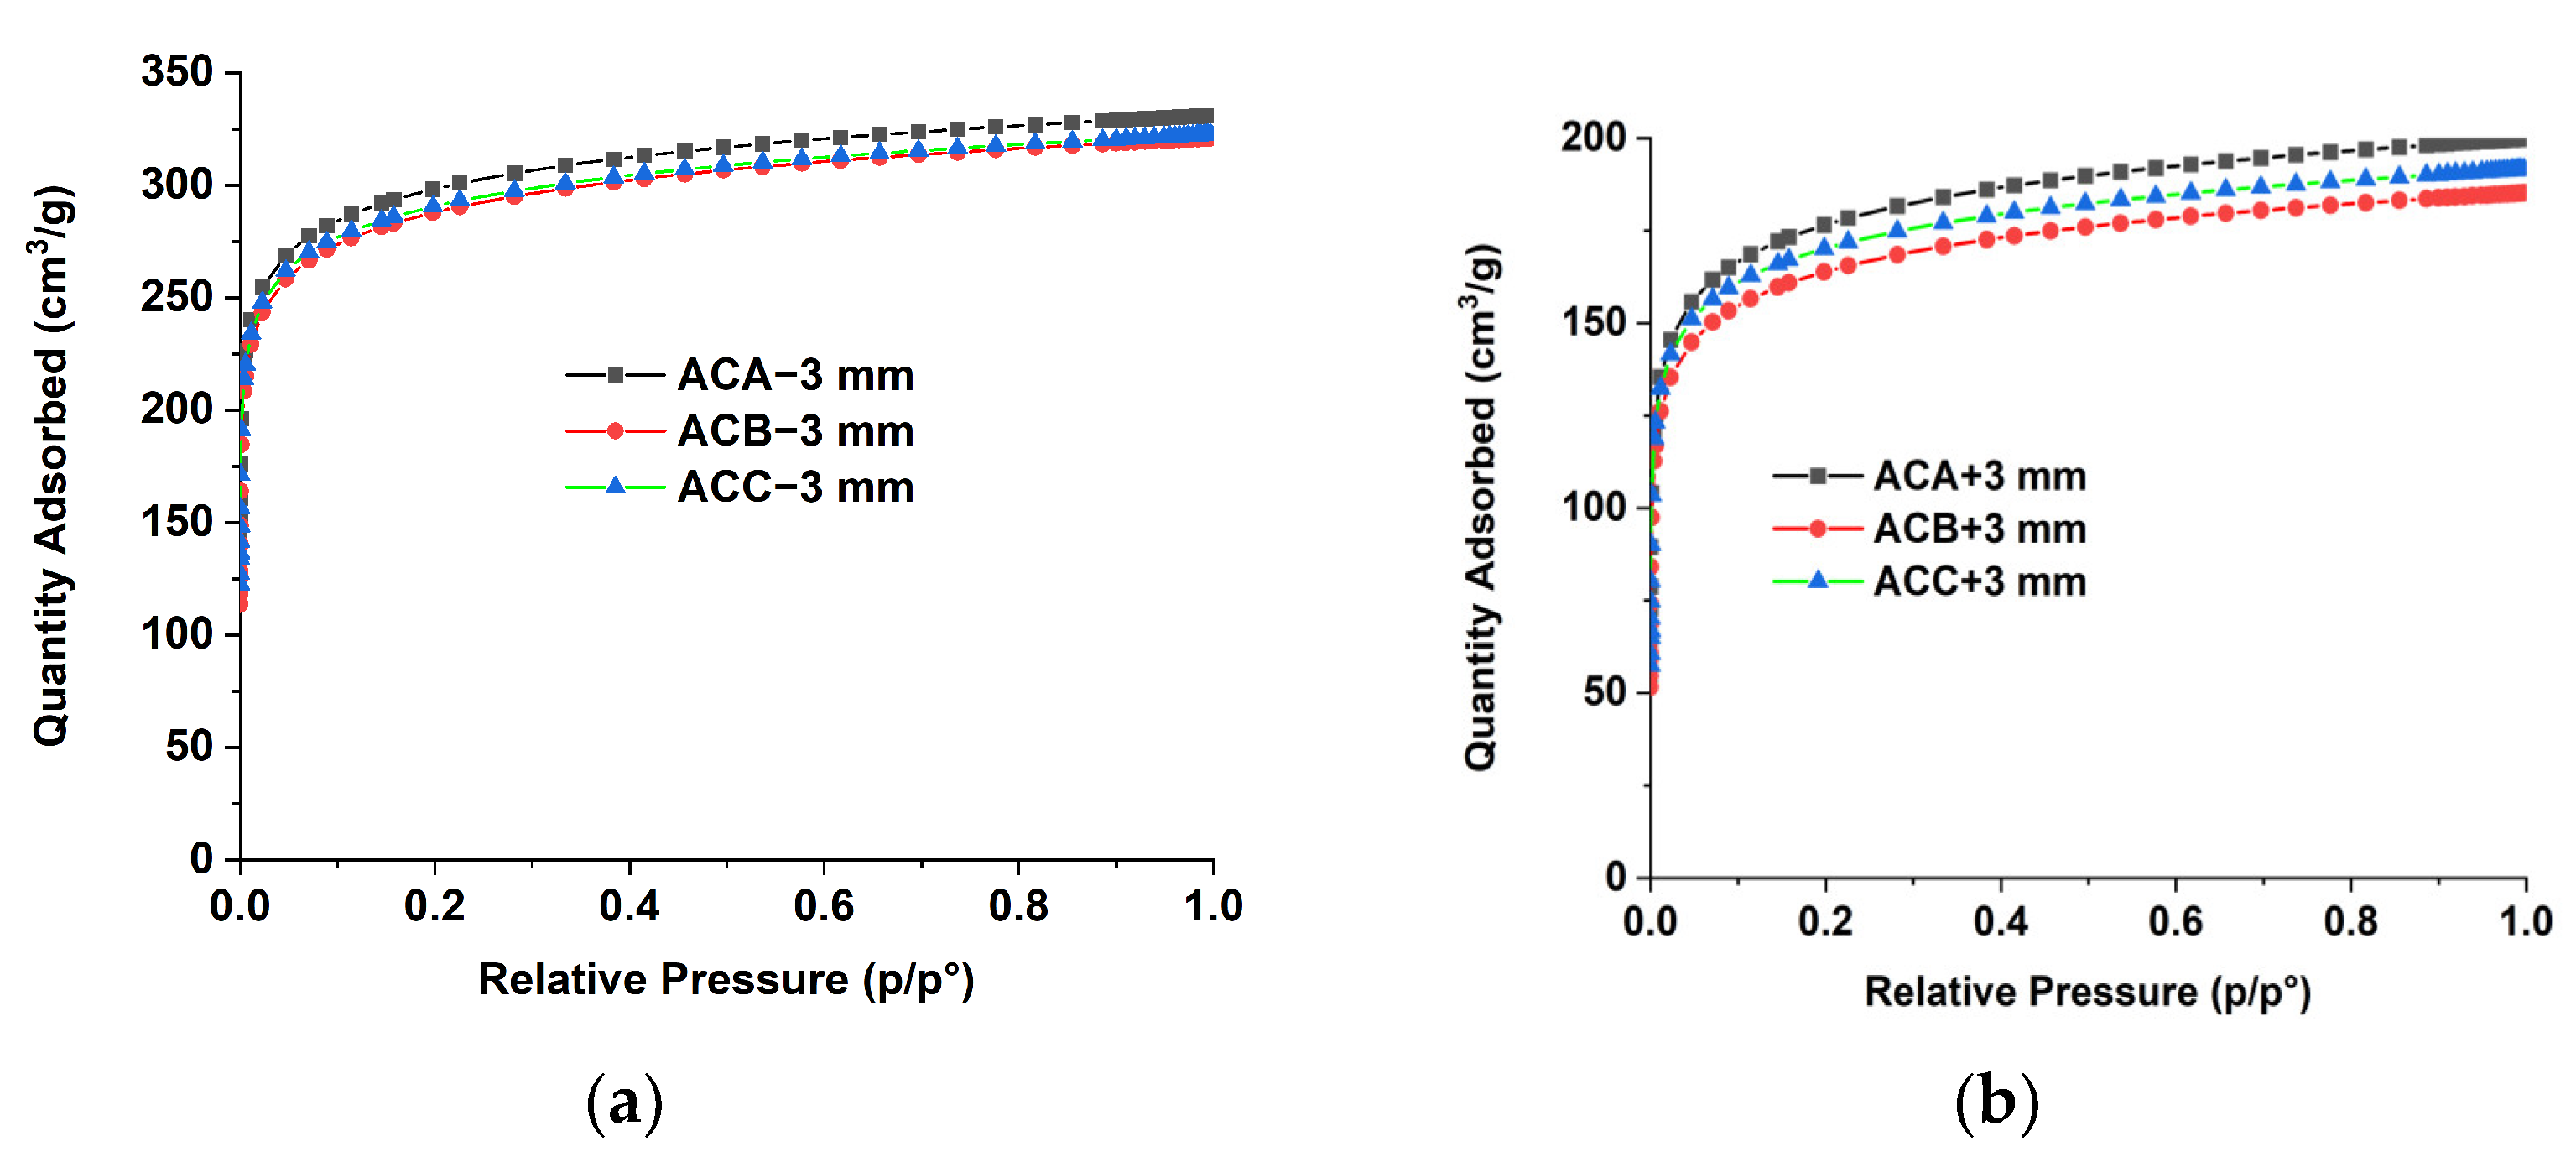
3.2.1. Surface Area Analysis

Figure 7 shows the N2 adsorption isotherms of AC samples, indicating a typical Type I pore structure according to the IUPAC classification [42], which is predominantly microporous. Table 4 presents the surface area properties, including the BET, Langmuir and micropore area results. Langmuir analysis is commonly used to study the monolayer behaviour of AC samples. In contrast, the BET surface area is a multilayer adsorption model, and its values of surface area are generally lower than the Langmuir surface area [43]. There was a substantial difference in surface area among size cuts. The BET surface area measurements for the current AC samples ranged from 514 to 973 m2/g, with finer particles generally displaying higher values. The Langmuir surface area was higher between 1330 and 1392 m2/g for the AC −3 mm_AW samples compared with 712 and 738 m2/g for the AC + 3 mm_AW samples.
The t-plot method is widely used to determine the micropore area in the carbon samples. The micropores’ volume and area for the AC −3 mm samples were within a relatively narrow range of 0.32 and 0.33 cm3/g and 658 to 674 m2/g, respectively. The coarse AC samples (+3 mm) had a micropore area between 427 and 465 m2/g. This indicates that microporosity development in small particles was better than in coarse particles during carbon activation.

3.2.2. Iodine Analysis

The iodine analysis showed that AC particles smaller than 3 mm had higher iodine numbers (800 to 900 mg/g) compared with their +3 mm (640 to 760 mg/g) counterparts. An iodine number below 500 renders granular AC unsuitable for water treatment applications [44]. The present study successfully activated all samples with KOH, yielding iodine numbers above 500. The high iodine number in fine particles aligns with the well-established principle that smaller particles have a larger surface area, promoting increased reactivity and activation, ultimately leading to higher iodine numbers. The AC produced in the current study indicates its suitability for water treatment applications.

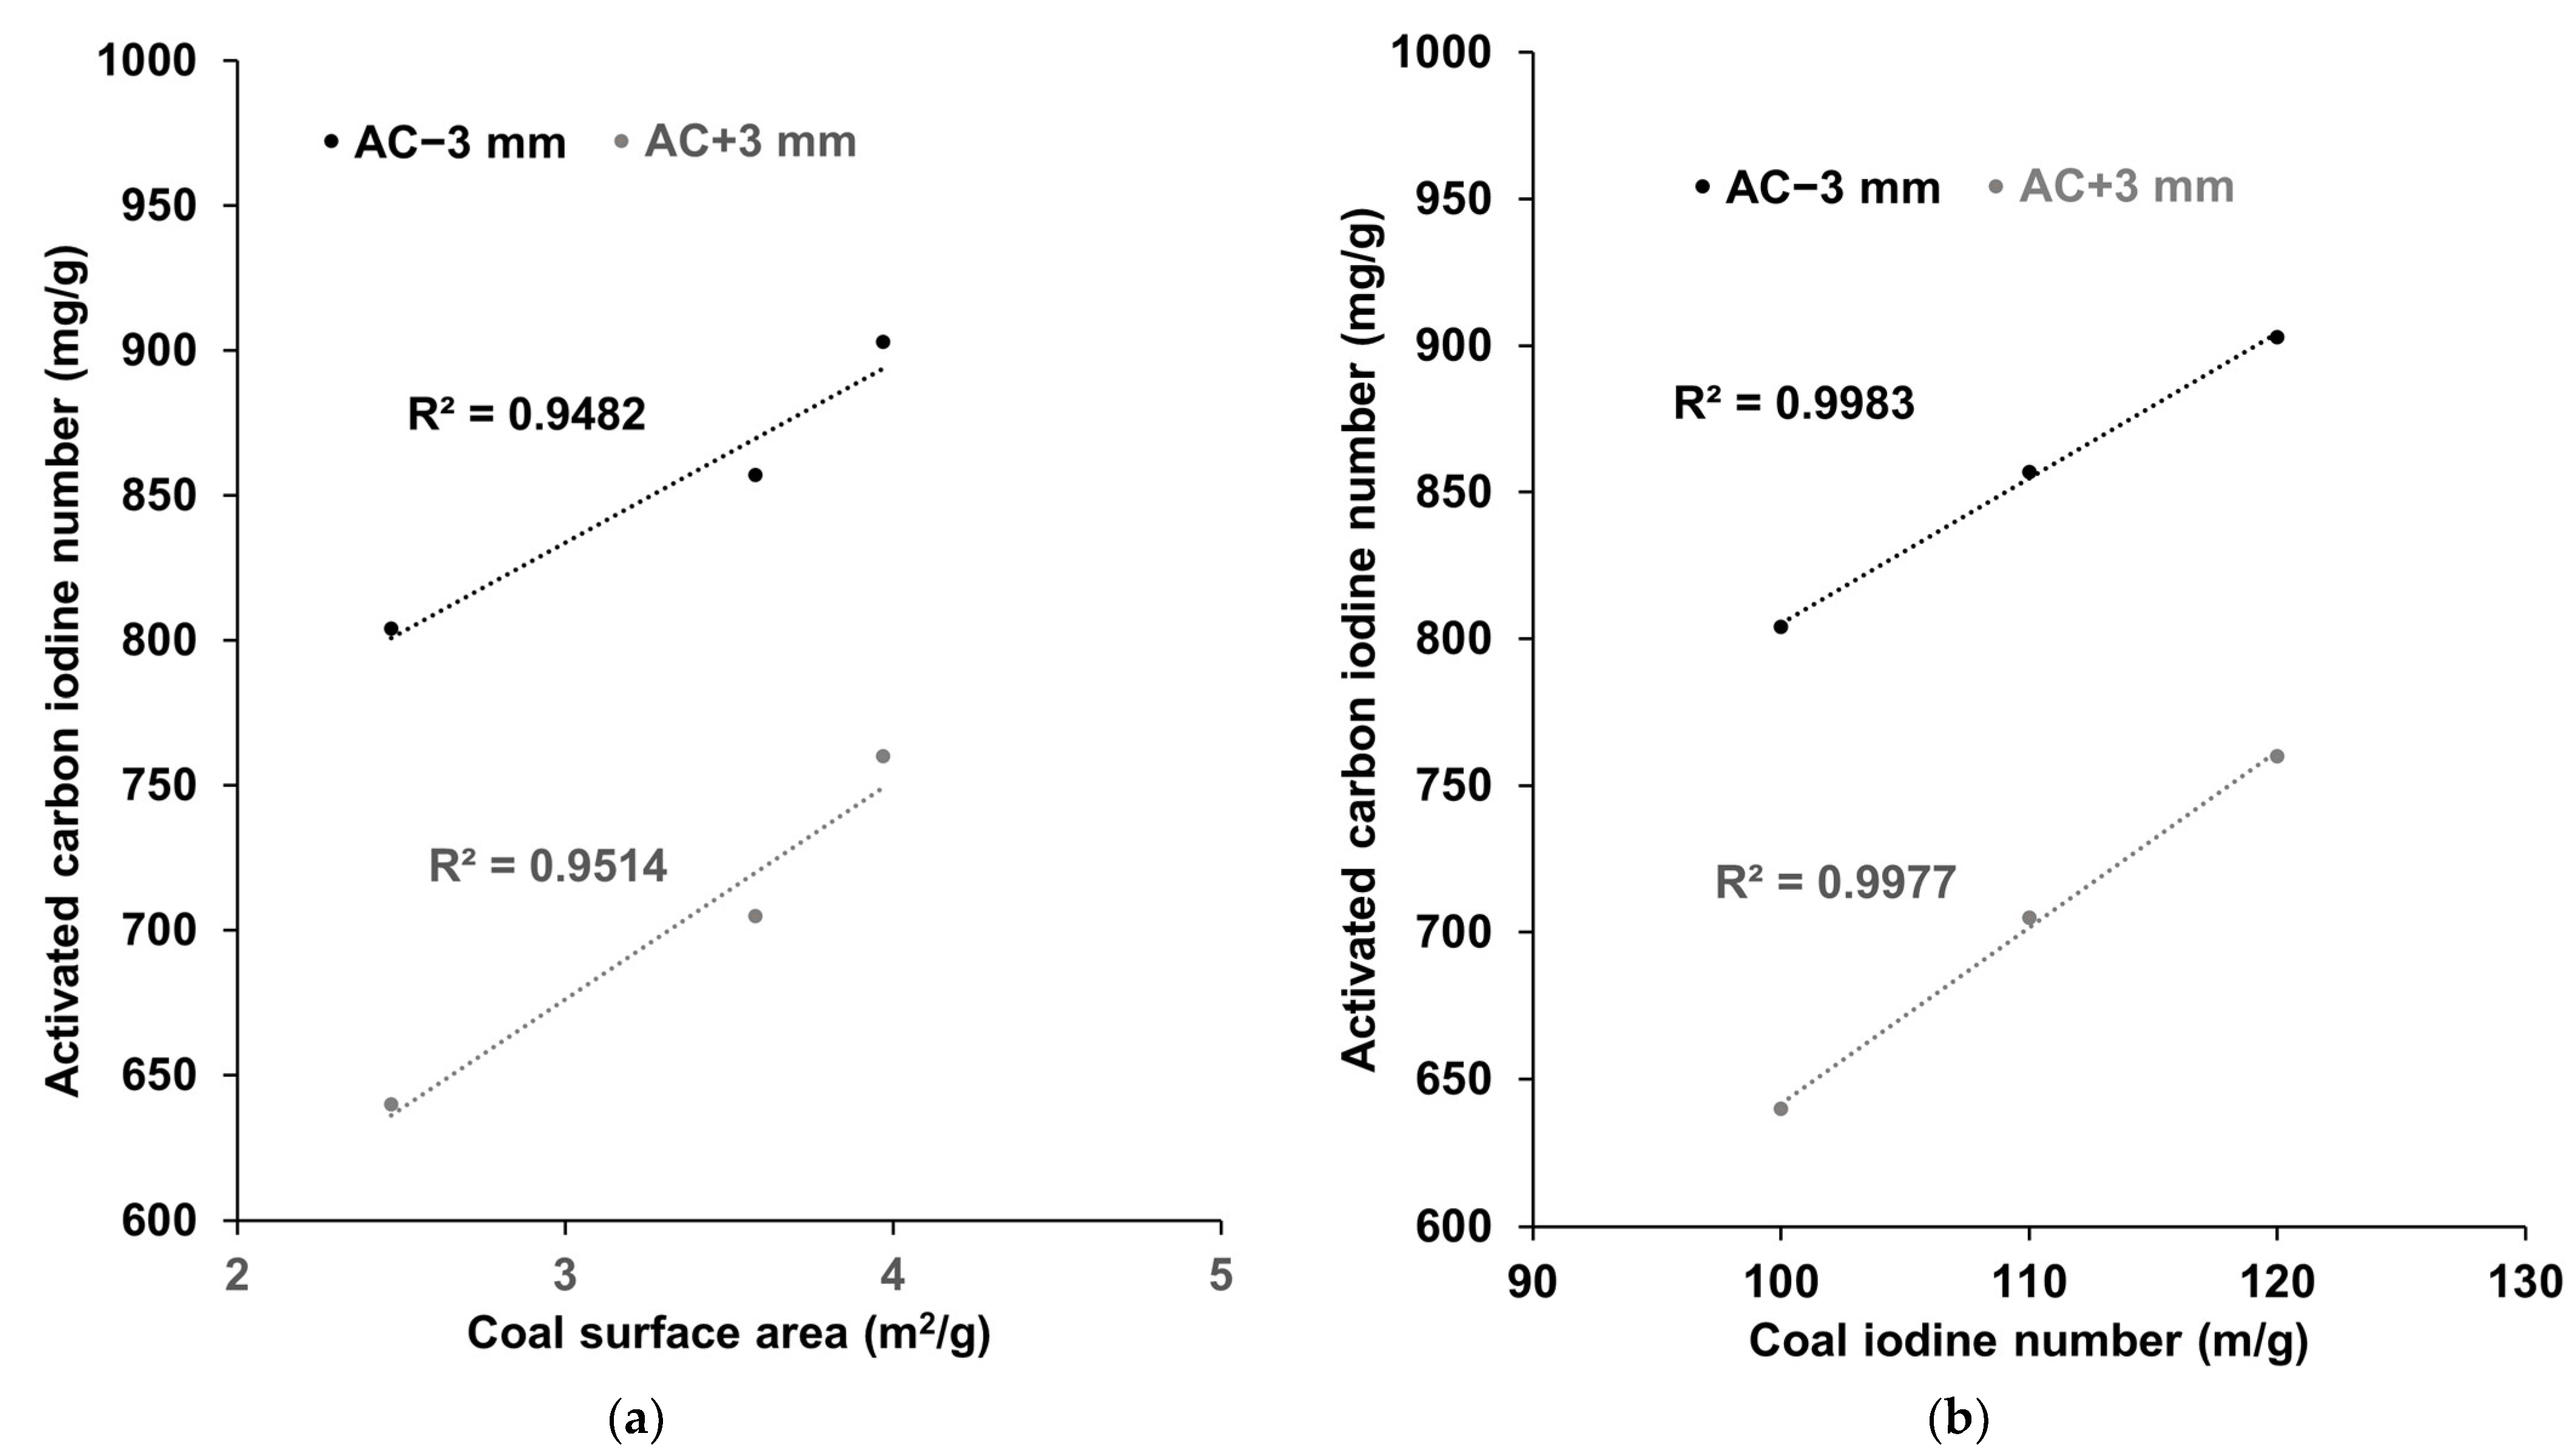
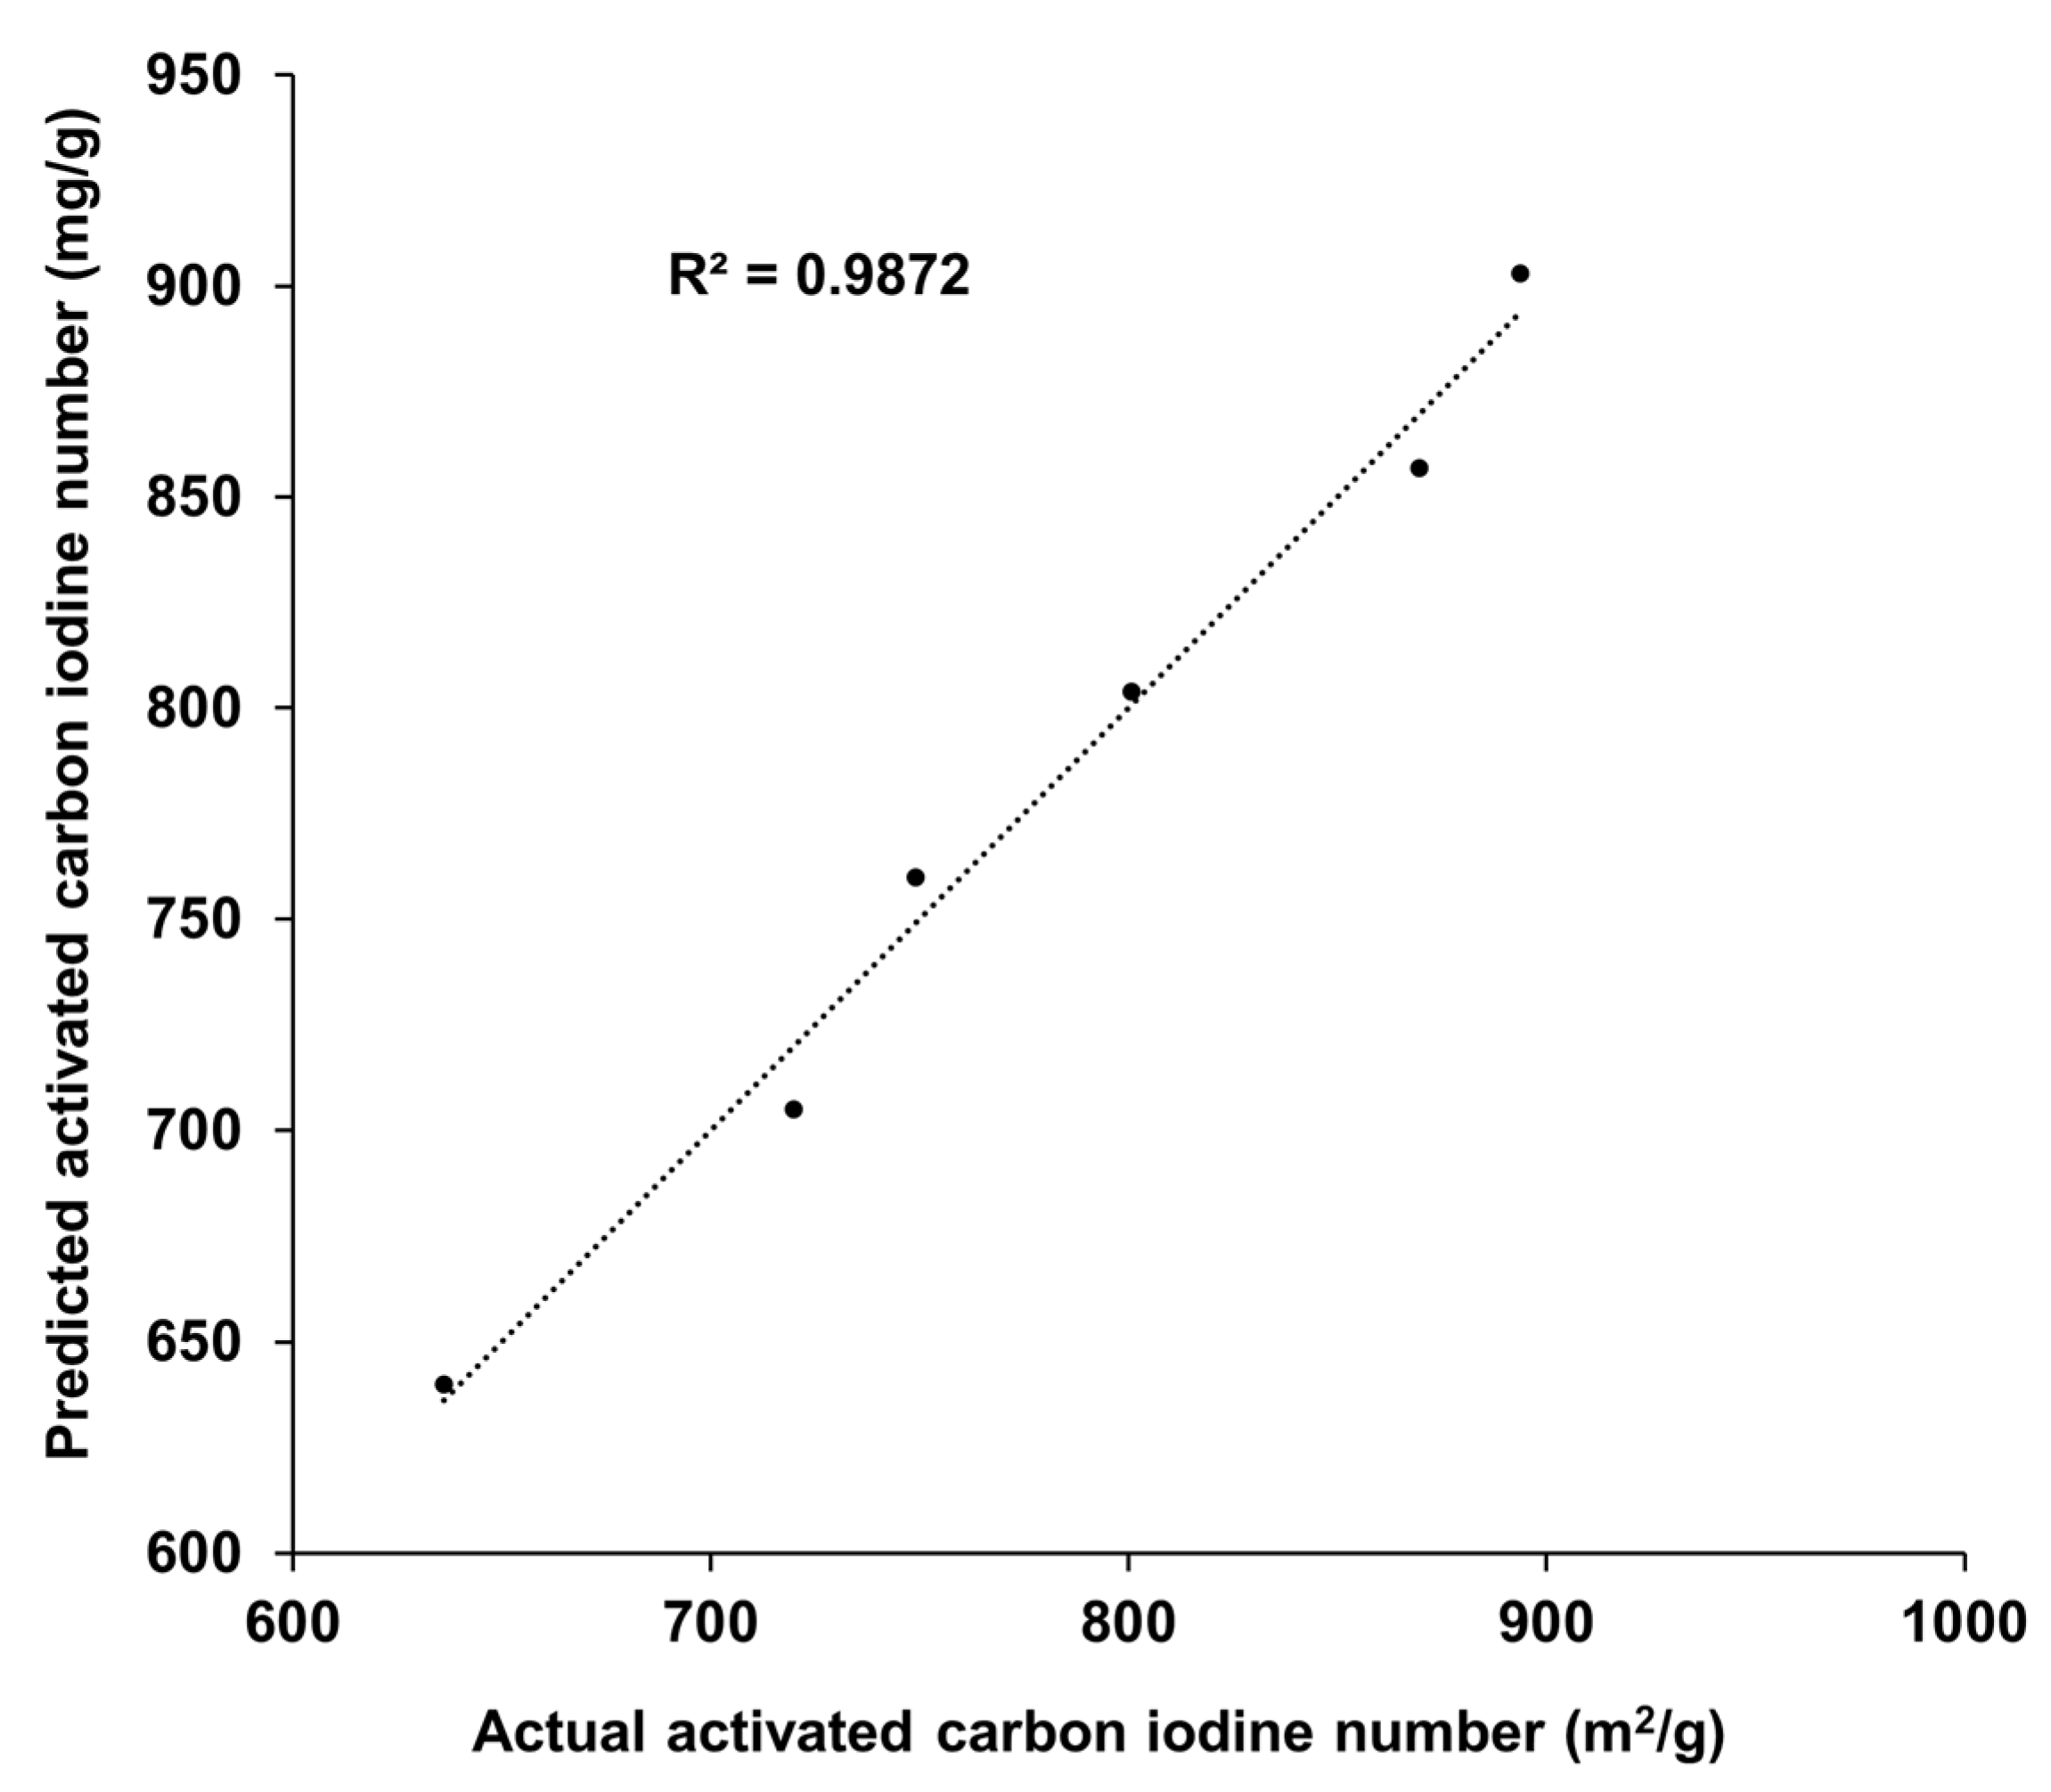
3.3. Effect of Coal Surface Area on Activated Carbon Iodine Number

A positive correlation is observed between coal surface area and AC iodine numbers, as shown in Figure 8a. The coal samples (A to C) with high surface area and iodine number before activation correlated with an increased iodine number in the resulting AC (A to C). A stronger correlation is evident in Figure 8b when plotting coal iodine numbers against AC iodine numbers. The iodine numbers followed the order of ACC > ACB > ACA for both particle sizes among the different AC samples. The AC samples with highly developed microporosity displayed higher iodine numbers. The −3 mm size cuts had higher iodine numbers than the +3 mm.
Figure 9 displays a scatter plot showing the predicted and actual iodine numbers for the AC generated in the present study. The predicted values were calculated using the respective slope and intercept parameters derived from regression analysis of coal surface area and KOH AC iodine numbers. The dots below 800 iodine numbers represent AC with a +3 mm size, and those above 800 represent AC with a −3 mm cut size. The current model’s prediction coefficient of determination (R2) of 0.99 indicates a high accuracy level.

3.4. Effect of Acid Washing on Activated Quality

Acid washing is essential in producing AC through chemical activation, minimising dissolved contaminants such as mineral matter and ashes to reduce the ash content in the final product. The acid-washing procedure resulted in a notable increase of 100 in the iodine number by effectively removing the ultrafine kaolinite clays, primarily composed of alumina and silica, from the AC samples. Previous studies suggest no correlation between total ash content and surface area, while acid washings increase surface area by removing chemically bound minerals from the structure [45]. The removal of mineral matter reduces ash content by nearly 10 wt.%, improving the overall quality of AC.
The analysis of the XRD spectra of the AC samples, including the unwashed (NW) and acid-washed (AW) samples, are compared in Figure 10. The removal of alumina and silica reduces their contribution after acid washing. The Match XRD phase analysis software estimated a nearly 10 wt.% increase in the amorphous carbon contents for acid-washed AC samples. The XRD results show the observation of the crystalline phase of graphitic carbon (002) at around 26° on the crystal plane (100) and around 43° (Figure 10). The elimination of inorganic mineral phases, particularly alumina and silica, certainly improved the quality of the AC in terms of the surface area and iodine number.
The SEM images of the AC samples before and after acid washing are presented in Figure 11 and Figure 12. Only one pair of SEM images is presented here, with additional pairs available in Appendix B (Figure A1) and Appendix C (Figure A2). The results indicate a well-developed porous structure attributed to the removal of volatiles and carbons and the high reactivity of Collie coal with KOH. The surface of acid-washed AC samples showed cleaner particles with porous structures and cracks from removing mineral particles.

3.5. Effect of Coal Particle Size on Activated Carbon Quality and Yield

Table 5 shows the calculated AC product yield using Equation 1. The −3 mm fractions displayed AC yields ranging from 57 to 59 wt.%, while the +3 mm AC samples generally showed higher yields of approximately 65 wt.%, except for ACA (58 wt.%). The yield disparity could be attributed to differences in burn-off rates, possibly caused by residual volatile matter, such as hydrocarbons, in the AC precursors. Additionally, finer particles have a higher surface area-to-volume ratio, making them more susceptible to faster activation. The study findings align with previous research indicating that larger particle sizes yield higher AC yield, but their adsorption capacity decreases with increasing size [11,46]. The results show that the size of the AC precursors can influence the yield of the AC products.
Yield   ( % ) = D r i e d   a c i d   w a s h e d   A C   ( g ) I n i t i a l   s a m p l e   m a s s   f e d   i n o   a c t i v a t i o n   f u r n a c e   ( g ) × 100

4. Conclusions

This study confirmed that Collie coal is suitable for activated carbon (AC) production via KOH activation. Coal samples had net calorific values ranging from 22 to 24 MJ/kg, falling within the sub-bituminous B classification. Coal C, with the lowest ash content (2 wt.%) and highest fixed carbon content (56 wt.%), emerged as a promising candidate for AC production, demonstrating high surface area and microporosity, while XRF and XRD analyses identified the predominant presence of silica and alumina, mainly from kaolinite. The current work on one-step KOH activation yielded positive results, as the AC samples showed Type I N2 adsorption isotherms, indicative of predominantly microporous structures. The study found that finer particles had higher BET surface area ranging from 514 to 973 m2/g) and iodine numbers (800 to 900 mg/g) compared to coarser particles (640 to 760 mg/g). Acid washing improved the quality of AC by eliminating ultrafine clay particles from micropores, leading to higher iodine numbers. It notably increased iodine numbers by 100 and reduced ash content by nearly 10 wt.%. Particle size influenced AC yield, with finer particles yielding 57–59 wt.% and coarser ones yielding 58–65 wt.%. The study predicted iodine numbers for the KOH-activated carbon using regression analysis of coal surface area, highlighting effective forecasting of AC performance based on initial coal properties. Understanding these factors is essential for the production of AC and enhancing its performance, contributing to the sustainable use of coal resources for valuable applications.

Author Contributions

Conceptualization, W.S., D.I., P.S. and A.N.N.; Methodology, W.S., D.I. and P.S.; Validation, D.I., P.S. and A.N.N.; Formal analysis, W.S. and A.N.N.; Investigation, W.S., D.I., P.S. and A.N.N.; Resources, W.S. and A.N.N.; Data curation, A.N.N.; Writing—original draft, W.S.; Writing—review & editing, D.I., P.S. and A.N.N.; Supervision, D.I., P.S. and A.N.N.; Project administration, A.N.N. All authors have read and agreed to the published version of the manuscript.

Funding

This research received no external funding.

Informed Consent Statement

Not applicable.

Data Availability Statement

The original contributions presented in the study are included in the article, further inquiries can be directed to the corresponding author.

Acknowledgments

The authors would like to thank Dennis Plester for providing coal samples. The authors acknowledge the facilities, and the scientific and technical assistance of Microscopy Australia at the Centre for Microscopy, Characterisation and Analysis, The University of Western Australia, a facility funded by the University, State and Commonwealth Governments.

Conflicts of Interest

The author declares no conflict of interest.

Appendix A. FTIR Functional Groups Identified in the Coal Samples

Table A1. FTIR functional groups identified in the coal samples.
Organic/Inorganic Functional GroupsWave Number (cm−1)Coal ACoal BCoal CReferences
Transmittance (%)
Surface hydroxyl groups369493 [47]
O-H stretching333593 [48]
C=O stretching1640 9394[48]
Aromatic C=C stretching15858893 [49]
Alcohols, C-O stretching1180849092[50]
Kaolinite, Al2(Si2O5)(OH)4109586 [48]
C-O-H deformation in cellulose103483 [51]
Kaolinite OH bending91387 [48]
Si-O-Al of clay minerals535668083[48]
Si-O-Si of clay minerals46763 76[48]

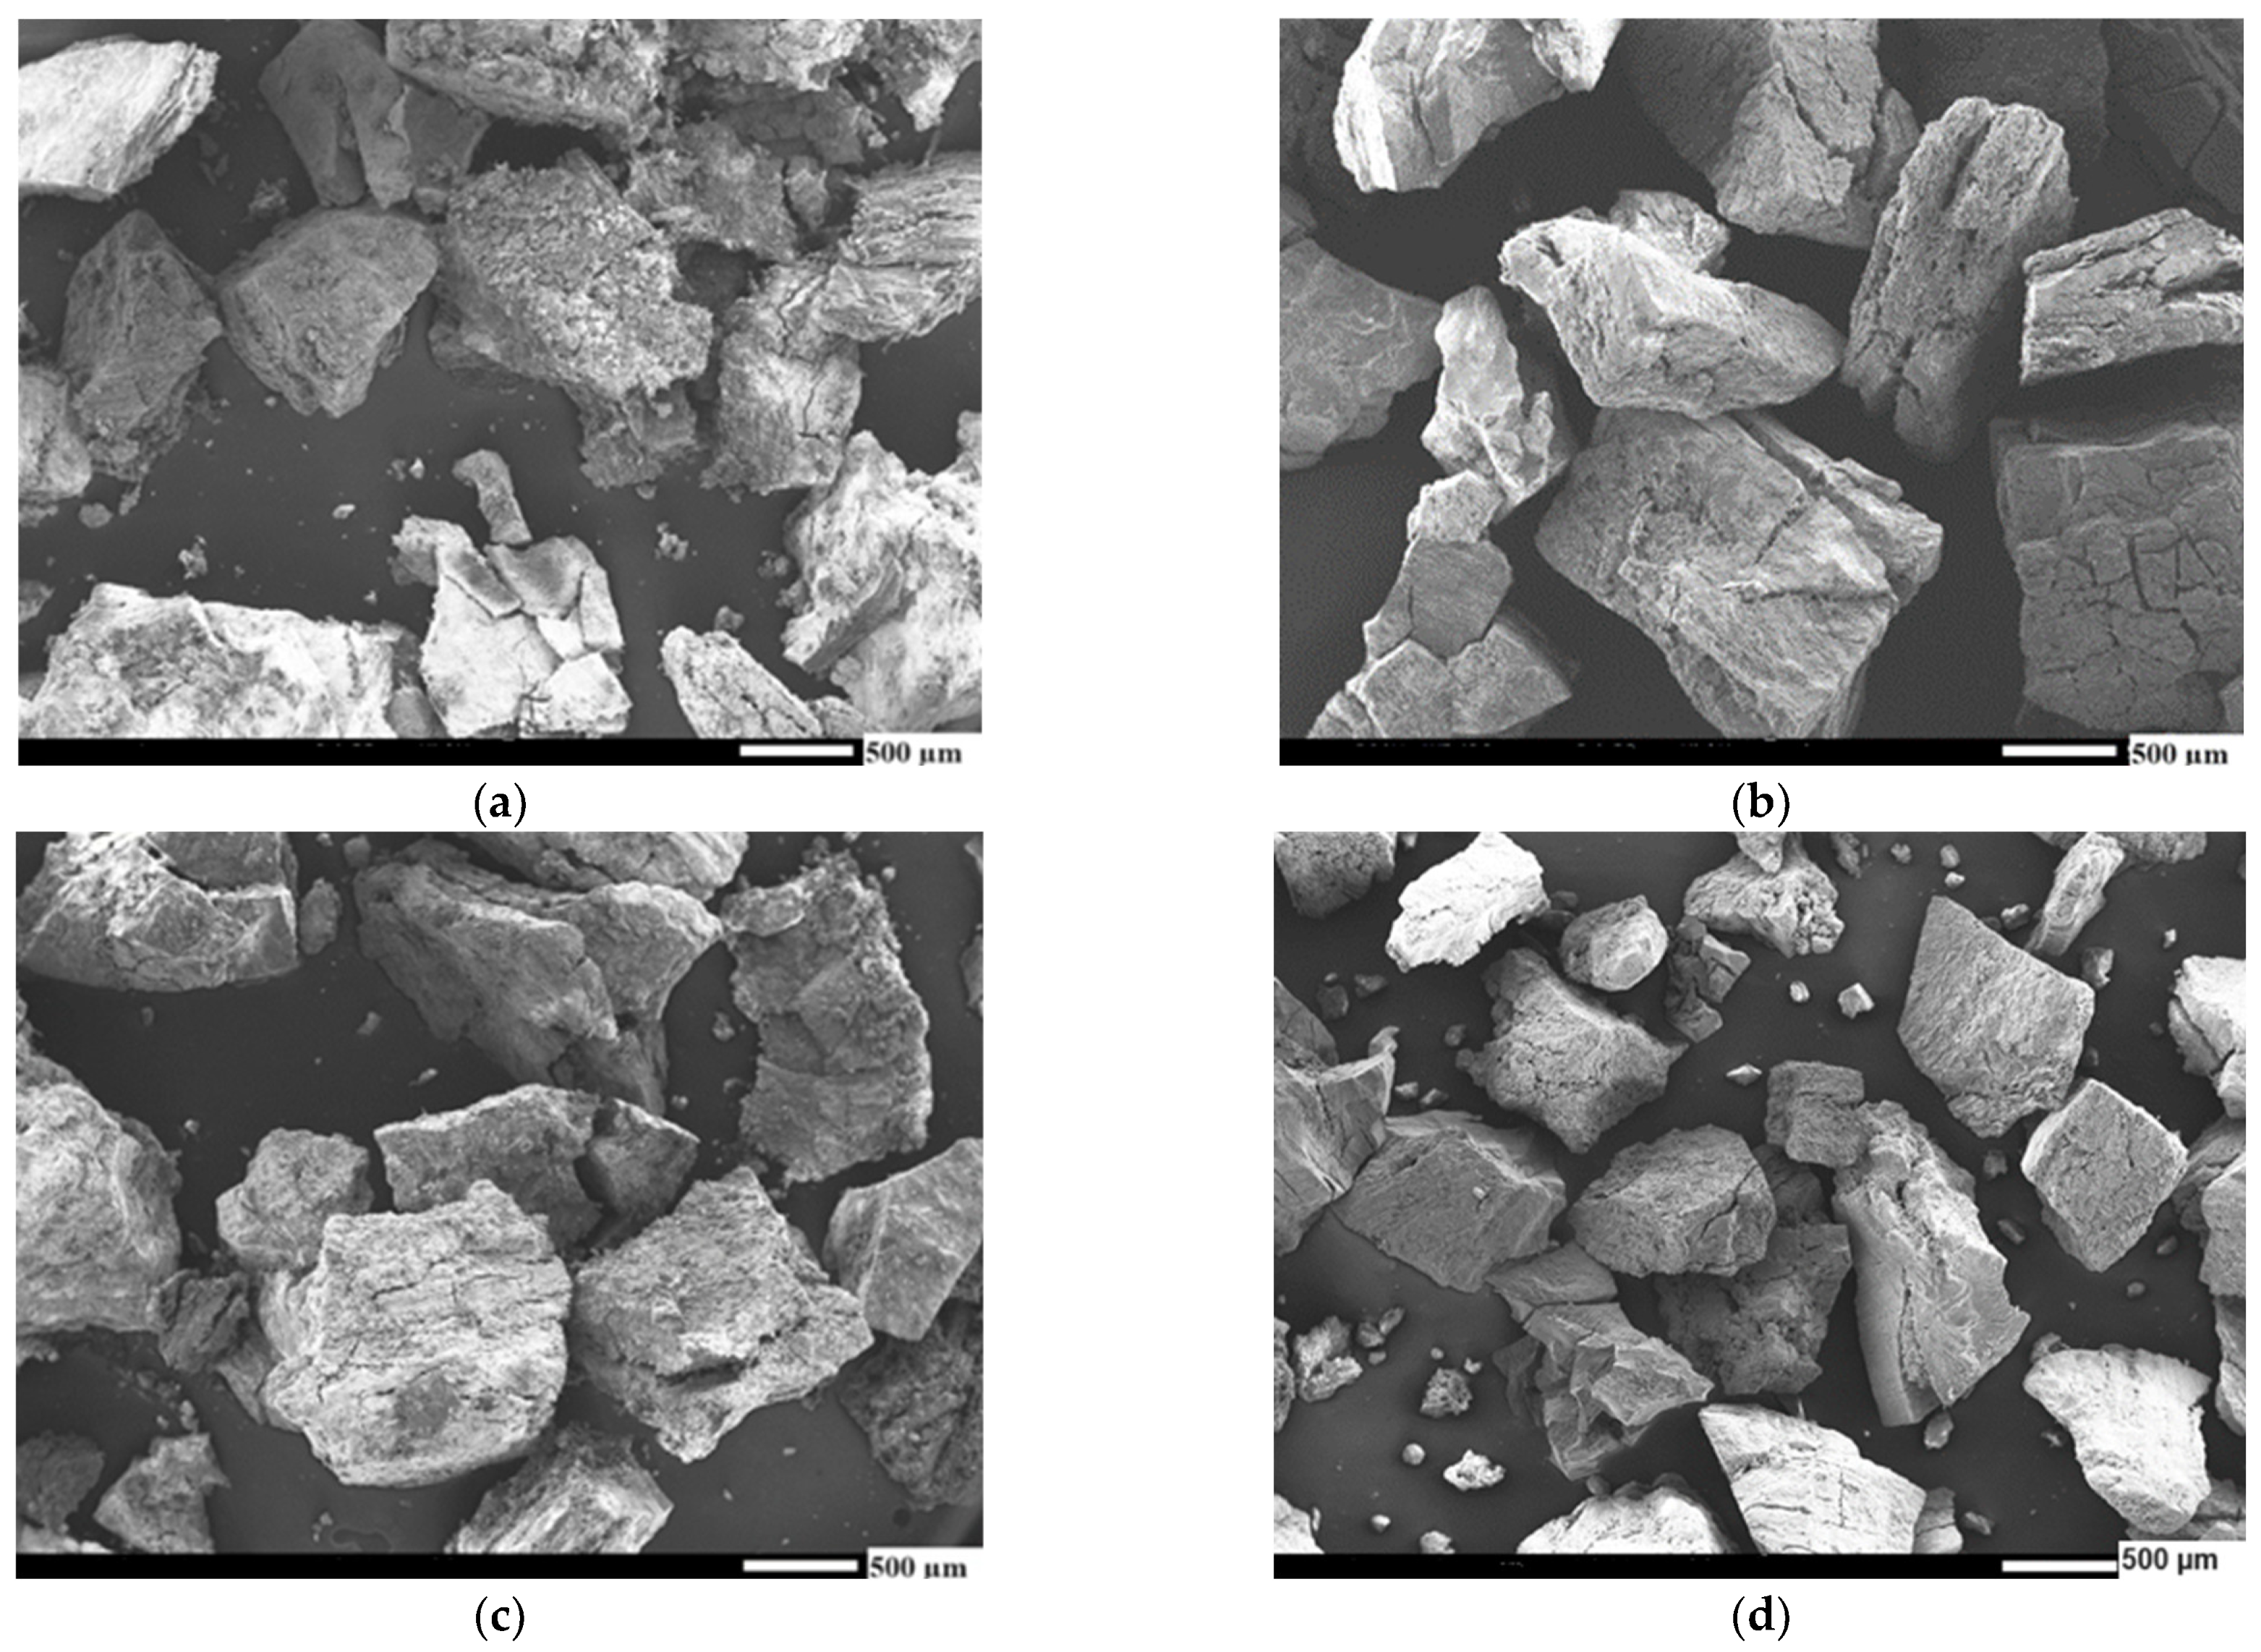
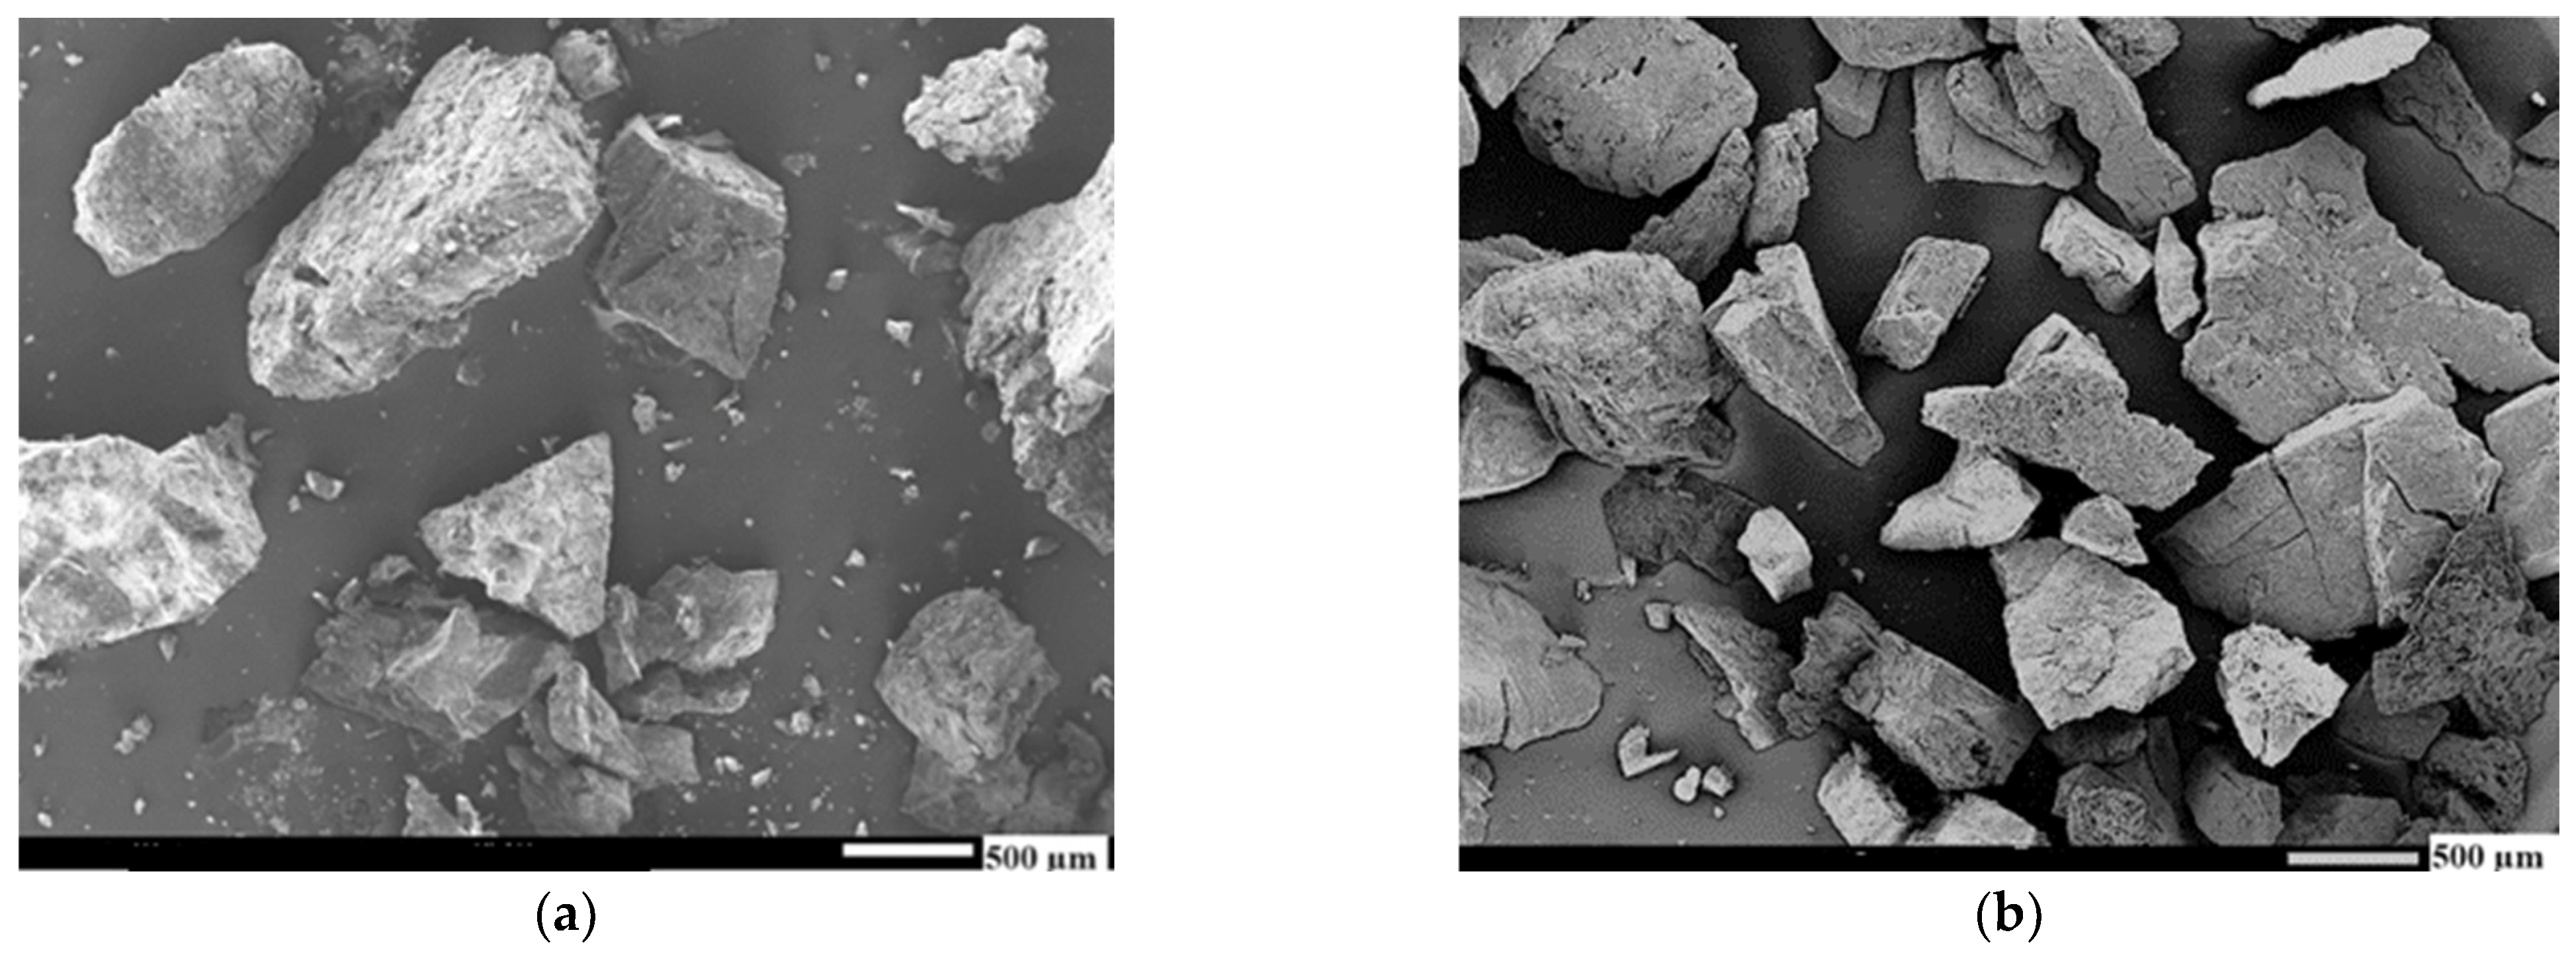
Appendix B. SEM Images of AC (–3 mm) Samples

Figure A1. SEM images of AC (−3 mm) samples: (a) ACB −3 mm_NW, (b) ACB −3 mm_AW, (c) ACC −3 mm_NW, and (d) ACC −3 mm_AW.
Sustainability 16 05876 g0a1

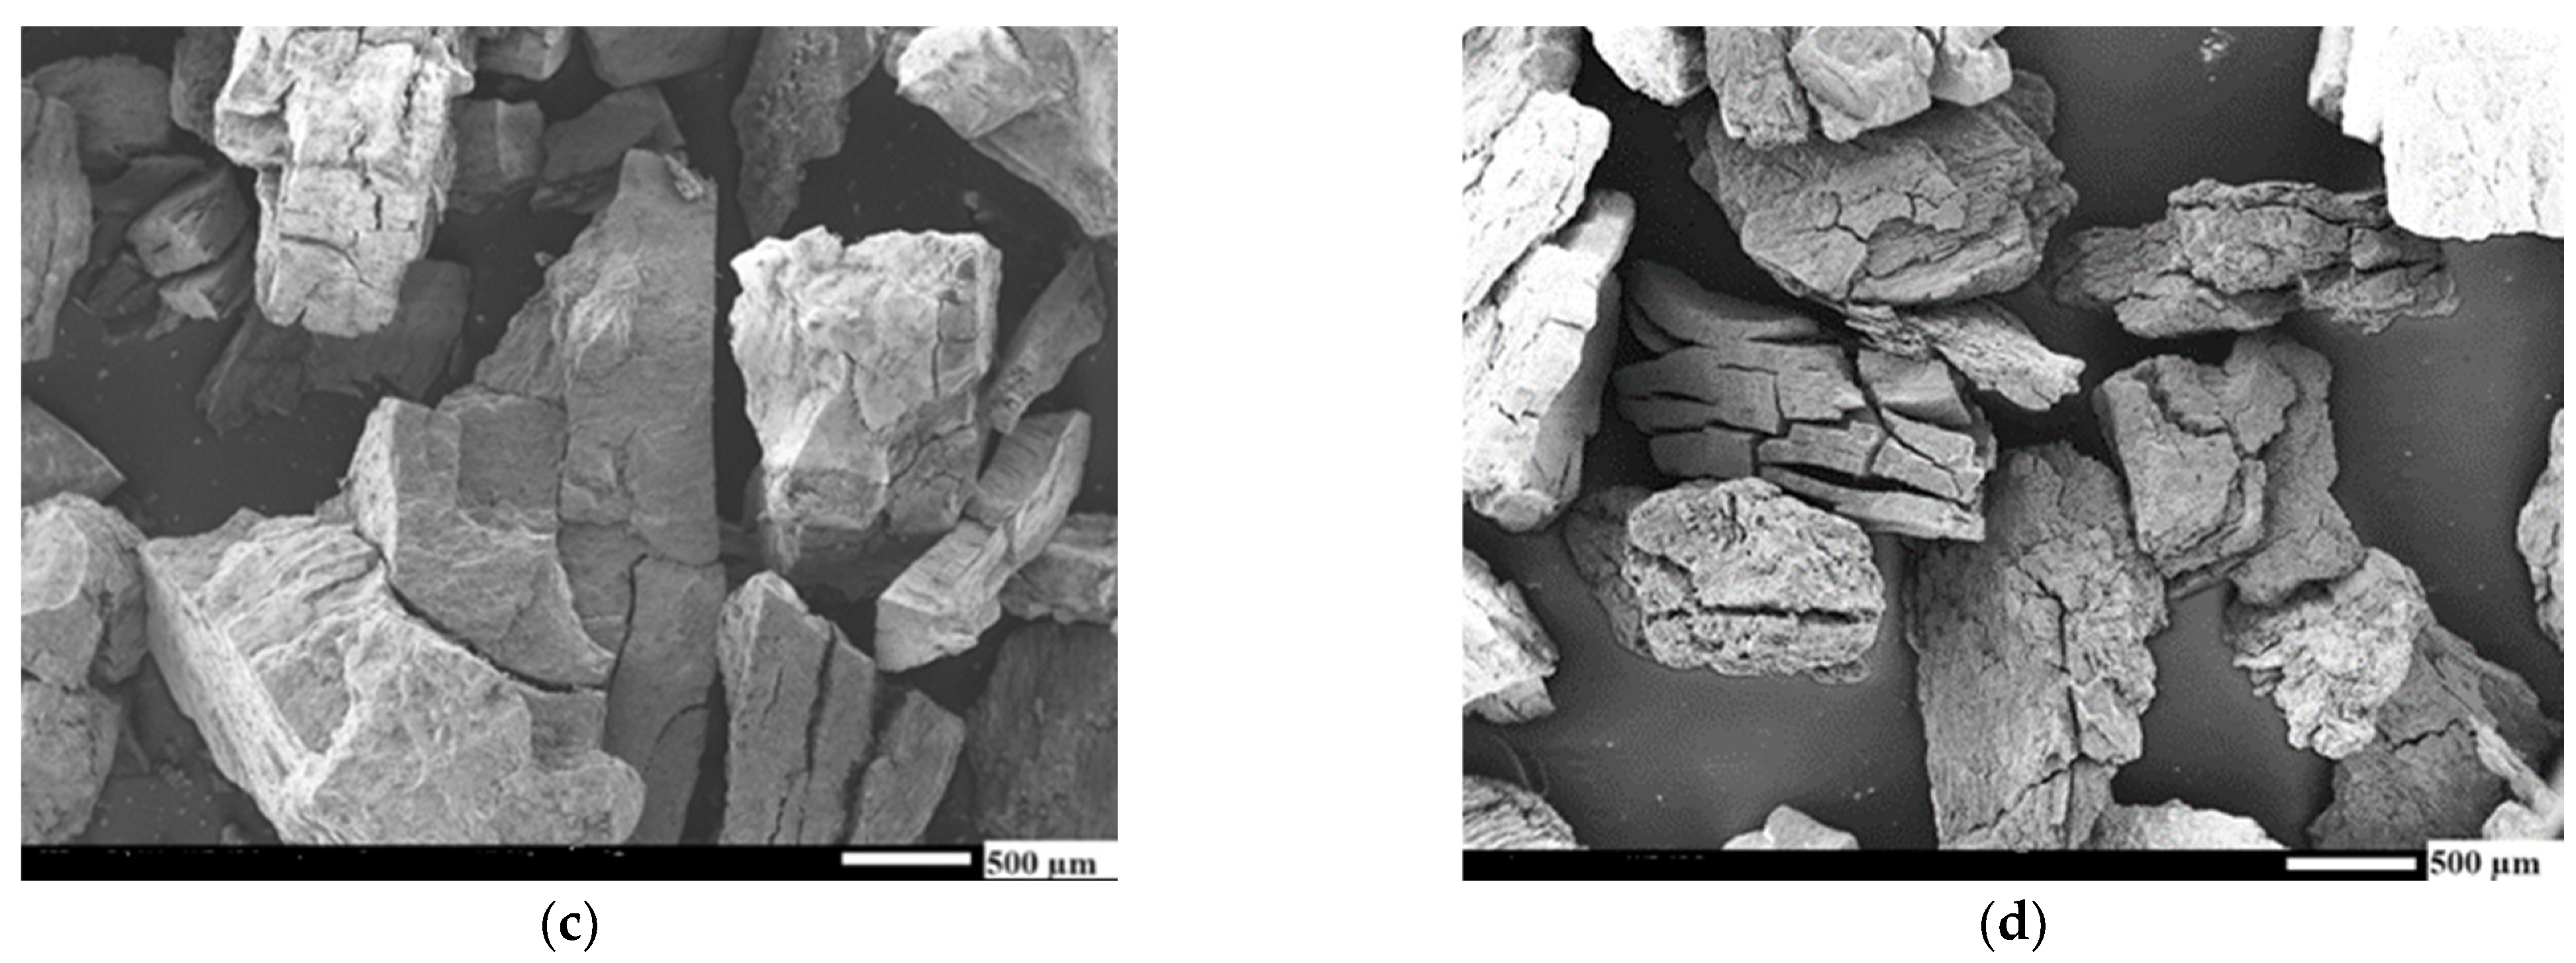
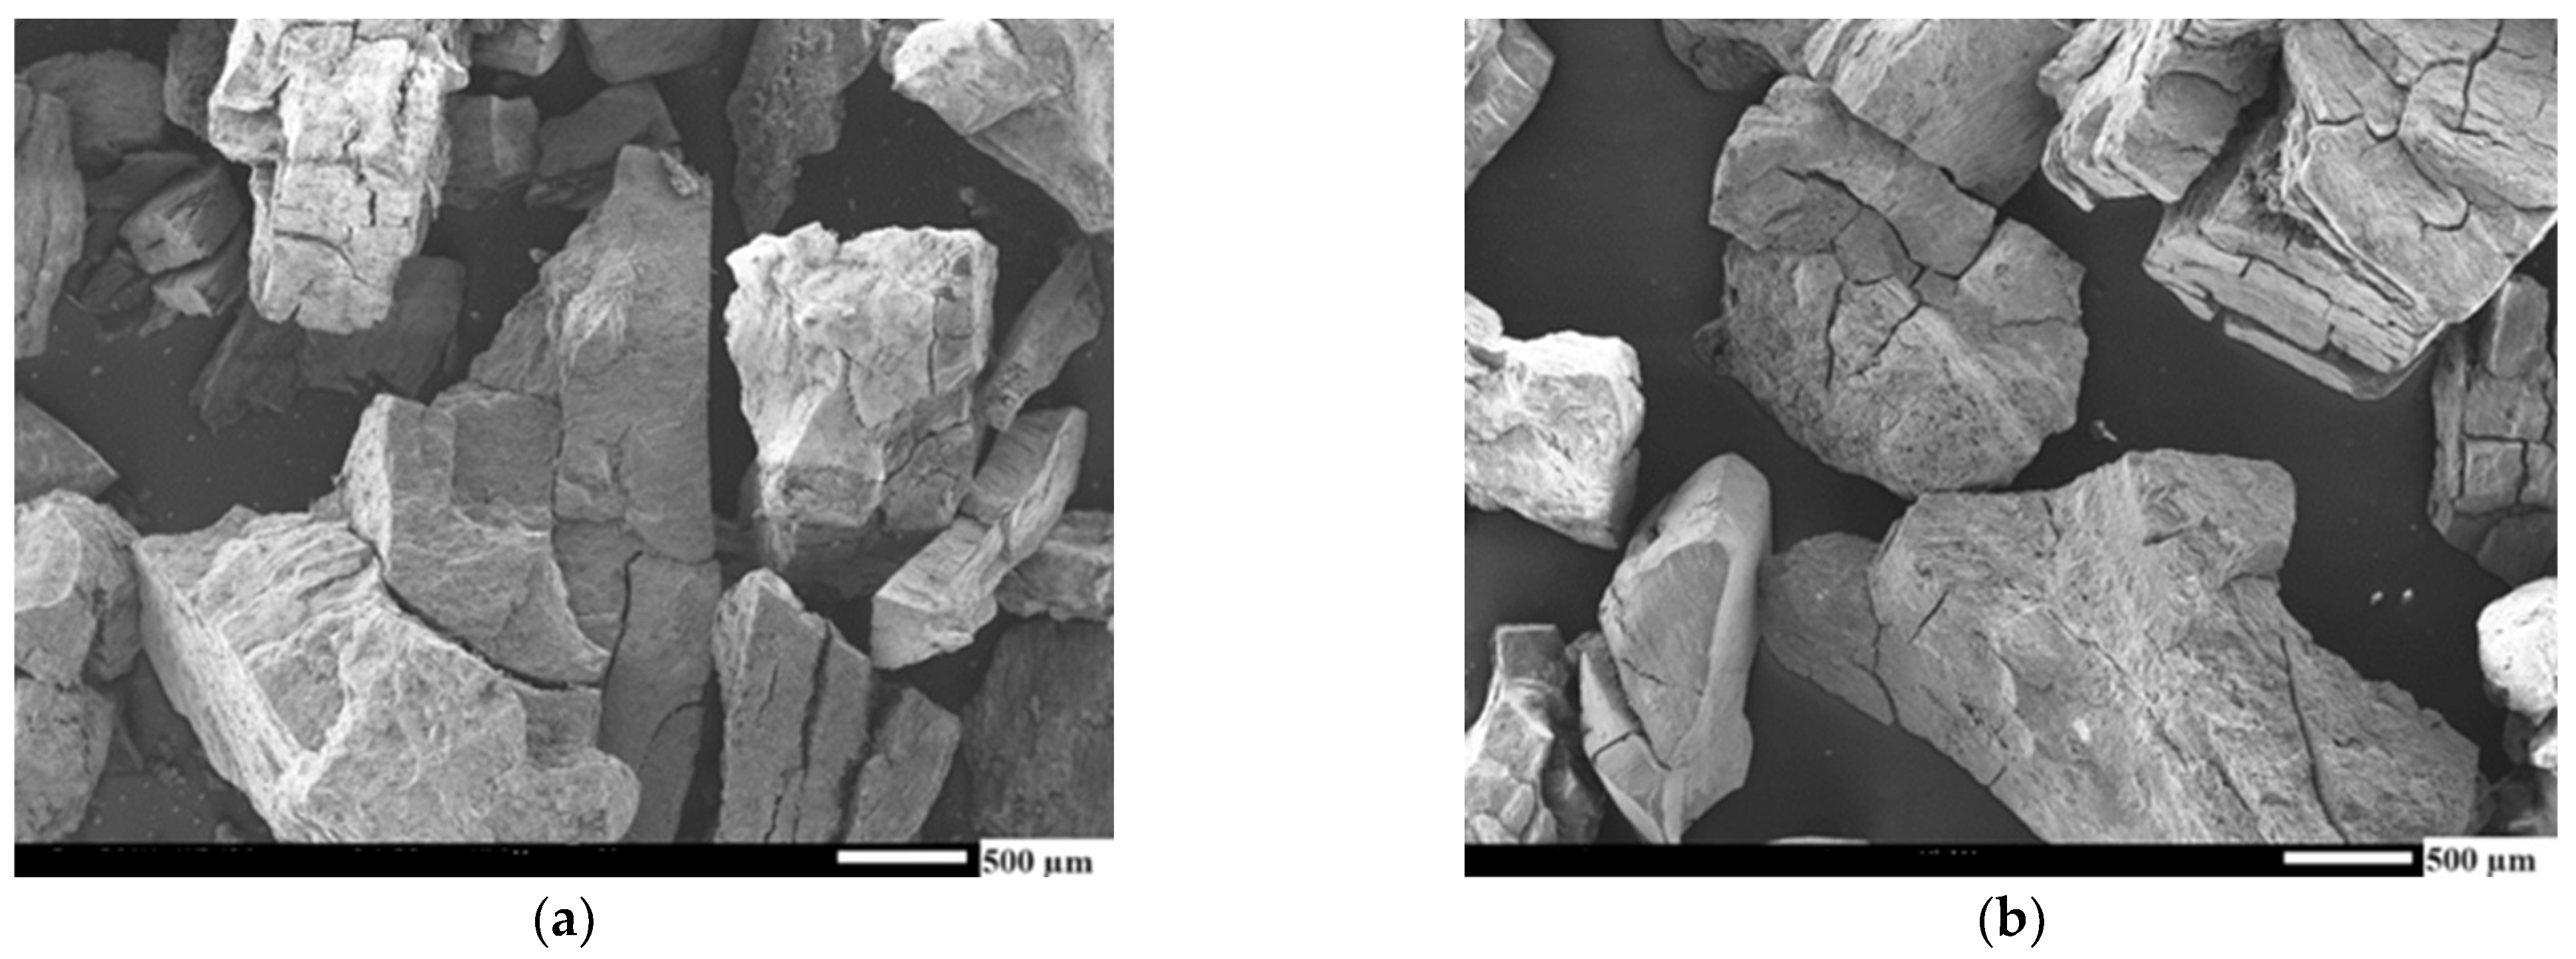
Appendix C. SEM Images of AC (+3 mm) Samples

Figure A2. SEM images of AC (+3 mm) samples: (a) ACB +3 mm_NW, (b) ACB +3 mm_AW, (c) ACC +3 mm_NW, and (d) ACC +3 mm_AW.
Sustainability 16 05876 g0a2aSustainability 16 05876 g0a2b

References

  1. Simate, G.S.; Maledi, N.; Ochieng, A.; Ndlovu, S.; Zhang, J.; Walubita, L.F. Coal-based adsorbents for water and wastewater treatment. J. Environ. Chem. Eng. 2016, 4, 2291–2312. [Google Scholar] [CrossRef]
  2. Edahbi, M.; Mermillod-Blondin, R.; Plante, B.; Benzaazoua, M. CIL gold loss characterization within oxidized leach tails: Creating a synergistic approach between mineralogical characterization, diagnostic leach tests, and preg-robbing tests. Minerals 2019, 9, 557. [Google Scholar] [CrossRef]
  3. Al-Azzawi, M.; Bowtell, L.; Hancock, K.; Preston, S. Addition of activated carbon into a cattle diet to mitigate GHG emissions and improve production. Sustainability 2021, 13, 8254. [Google Scholar] [CrossRef]
  4. Turkyilmaz, A.; Isinkaralar, K.; Dogan, M.; Kizilduman, B.K.; Bicil, Z. Production, characterization, and hydrogen storage properties of activated carbon from horse chestnut shell. Sustain. Chem. Pharm. 2024, 40, 101634. [Google Scholar] [CrossRef]
  5. Bao, Q.; Zhang, M.; Li, J.; Wang, X.; Zhu, M.; Sun, G. The optimal micro-and meso-pores oriented development of Eucommia ulmoides oliver wood derived activated carbons for capacitive performance. Renew. Energy 2024, 225, 120209. [Google Scholar] [CrossRef]
  6. Lei, Y.; Zhao, Y.; Lian, H.; Wang, Y.; Xue, X.; Zhang, G.; Zhang, Y. Enhancement of CH4/N2 separation capacity of coal-based porous carbons via hydrothermal coupled KOH activation. J. Environ. Chem. Eng. 2024, 12, 112477. [Google Scholar] [CrossRef]
  7. Xia, Y.; Zuo, H.; Lv, J.; Wei, S.; Yao, Y.; Liu, Z.; Lin, Q.; Yu, Y.; Yu, W.; Huang, Y. Preparation of multi-layered microcapsule-shaped activated biomass carbon with ultrahigh surface area from bamboo parenchyma cells for energy storage and cationic dyes removal. J. Clean. Prod. 2023, 396, 136517. [Google Scholar] [CrossRef]
  8. Nie, B.; Liu, X.; Yang, L.; Meng, J.; Li, X. Pore structure characterization of different rank coals using gas adsorption and scanning electron microscopy. Fuel 2015, 158, 908–917. [Google Scholar] [CrossRef]
  9. Karaman, I.; Yagmur, E.; Banford, A.; Aktas, Z. The effect of process parameters on the carbon dioxide based production of activated carbon from lignite in a rotary reactor. Fuel Process. Technol. 2014, 118, 34–41. [Google Scholar] [CrossRef]
  10. Oglou, R.C.; Gokce, Y.; Yagmur, E.; Aktas, Z. Production of demineralised high quality hierarchical activated carbon from lignite and determination of adsorption performance using methylene blue and p-nitrophenol: The role of surface functionality, accessible pore size and surface area. J. Environ. Manag. 2023, 345, 118812. [Google Scholar] [CrossRef]
  11. Spencer, W.; Senanayake, G.; Altarawneh, M.; Ibana, D.; Nikoloski, A.N. Review of the effects of coal properties and activation parameters on activated carbon production and quality. Miner. Eng. 2024, 212, 108712. [Google Scholar] [CrossRef]
  12. Lord, J.H. Mineral Deposits of Western Australia. In Proceedings of the Annual Conference the AusIMM, Perth, Australia, 18 July 1966. [Google Scholar]
  13. Moody, W. Overview of Western Australia’s coal industry. Energy News 2017, 35, 14–16. [Google Scholar]
  14. Spencer, W.; Ibana, D.; Singh, P.; Nikoloski, A.N. Effect of ilmenite properties on synthetic rutile quality. Miner. Eng. 2022, 177, 107365. [Google Scholar] [CrossRef]
  15. Spencer, W.; Ibana, D.; Singh, P.; Nikoloski, A.N. Biofuels as renewable reductants for the processing of ilmenite to produce synthetic rutile. Miner. Eng. 2022, 187, 107808. [Google Scholar] [CrossRef]
  16. Sappal, K. Organic Petrology and Geochemistry of Coal in the Muja Coal Measures, Collie Basin, Western Australia. 1996. Available online: https://www.osti.gov/etdeweb/biblio/431903 (accessed on 19 June 2024).
  17. Zhou, Y.; Li, S.; Bai, Y.; Long, H.; Cai, Y.; Zhang, J. Joint Characterization and Fractal Laws of Pore Structure in Low-Rank Coal. Sustainability 2023, 15, 9599. [Google Scholar] [CrossRef]
  18. Hanson, S.; Patrick, J.; Walker, A. The effect of coal particle size on pyrolysis and steam gasification. Fuel 2002, 81, 531–537. [Google Scholar] [CrossRef]
  19. Zhu, W.; Song, W.; Lin, W. Effect of the coal particle size on pyrolysis and char reactivity for two types of coal and demineralized coal. Energy Fuels 2008, 22, 2482–2487. [Google Scholar] [CrossRef]
  20. Kim, D.-G.; Kim, T.-H.; Ko, S.-O. Enhanced catalytic activity of a coal-based powdered activated carbon by thermal treatment. Water 2022, 14, 3308. [Google Scholar] [CrossRef]
  21. Kim, S.; Lee, S.-E.; Baek, S.-H.; Choi, U.; Bae, H.-J. Preparation of Activated Carbon from Korean Anthracite: Simultaneous Control of Ash Reduction and Pore Development. Processes 2023, 11, 2877. [Google Scholar] [CrossRef]
  22. Quan, C.; Wang, H.; Jia, X.; Gao, N. Effect of carbonization temperature on CO2 adsorption behavior of activated coal char. J. Energy Inst. 2021, 97, 92–99. [Google Scholar] [CrossRef]
  23. Guo, Y.; Wang, Q. Fabrication and characterization of activated carbon from phyllostachys edulis using single-step KOH activation with different temperatures. Processes 2022, 10, 1712. [Google Scholar] [CrossRef]
  24. Carneiro, M.T.; Morais, A.Í.S.; de Carvalho Melo, A.L.F.; Ferreira, F.J.L.; Santos, F.E.P.; Viana, B.C.; Osajima, J.A.; Bezerra, R.D.; Del Mar Orta Cuevas, M.; Peña-Garcia, R.R. Biochar derived from water hyacinth biomass chemically activated for dye removal in aqueous solution. Sustainability 2023, 15, 14578. [Google Scholar] [CrossRef]
  25. Dobele, G.; Volperts, A.; Plavniece, A.; Zhurinsh, A.; Upskuviene, D.; Balciunaite, A.; Niaura, G.; Colmenares-Rausseo, L.C.; Tamasauskaite-Tamasiunaite, L.; Norkus, E. Thermochemical Activation of Wood with NaOH, KOH and H3PO4 for the Synthesis of Nitrogen-Doped Nanoporous Carbon for Oxygen Reduction Reaction. Molecules 2024, 29, 2238. [Google Scholar] [CrossRef] [PubMed]
  26. Labus, K.; Gryglewicz, S.; Machnikowski, J. Granular KOH-activated carbons from coal-based cokes and their CO2 adsorption capacity. Fuel 2014, 118, 9–15. [Google Scholar] [CrossRef]
  27. Montes, V.; Hill, J.M. Activated carbon production: Recycling KOH to minimize waste. Mater. Lett. 2018, 220, 238–240. [Google Scholar] [CrossRef]
  28. Plavniece, A.; Dobele, G.; Volperts, A.; Zhurinsh, A. Hydrothermal carbonization vs. pyrolysis: Effect on the porosity of the activated carbon materials. Sustainability 2022, 14, 15982. [Google Scholar] [CrossRef]
  29. Khamkeaw, A.; Asavamongkolkul, T.; Perngyai, T.; Jongsomjit, B.; Phisalaphong, M. Interconnected micro, meso, and macro porous activated carbon from bacterial nanocellulose for superior adsorption properties and effective catalytic performance. Molecules 2020, 25, 4063. [Google Scholar] [CrossRef]
  30. Lewoyehu, M. Comprehensive review on synthesis and application of activated carbon from agricultural residues for the remediation of venomous pollutants in wastewater. J. Anal. Appl. Pyrolysis 2021, 159, 105279. [Google Scholar] [CrossRef]
  31. Baresel, C.; Harding, M.; Fang, J. Ultrafiltration/granulated active carbon-biofilter: Efficient removal of a broad range of micropollutants. Appl. Sci. 2019, 9, 710. [Google Scholar] [CrossRef]
  32. ISO 18125; Solid Biofuels—Determination of Calorific Value. ISO: Geneva, Switzerland, 2017.
  33. ASTM International Standard D4607; Standard Test Method for Determination of Iodine Number of Activated Carbon. ASTM: West Conshohocken, PA, USA, 2021.
  34. Li, L.; Sun, G.; Qi, W.; Chen, Q.; Sun, Z.; Hao, D.; Duan, L. NOx and SO2 emission of oxygen carrier aided combustion in fluidized bed. J. Energy Inst. 2024, 112, 101463. [Google Scholar] [CrossRef]
  35. USDOE Office of Fossil Energy. Clean Coal Technology Demonstration Program: Project Fact Sheets 2000, Status as of June 30, 2000; American Water Works Association: Denver, CO, USA, 2000; Medium: P; 195p. [Google Scholar]
  36. Zhang, Y.; Jia, W.; Wang, R.; Guo, Y.; Guo, F.; Wu, J.; Dai, B. Investigation of the characteristics of catalysis synergy during co-combustion for coal gasification fine slag with bituminous coal and bamboo residue. Catalysts 2021, 11, 1152. [Google Scholar] [CrossRef]
  37. Bilgen, S.; Kaygusuz, K. The calculation of the chemical exergies of coal-based fuels by using the higher heating values. Appl. Energy 2008, 85, 776–785. [Google Scholar] [CrossRef]
  38. Dormans, H.; Huntjens, F.; Van Krevelen, D. Chemical structure and properties of coal XX-composition of the individual macerals (vitrinites, fusinites, micrinites and exinites). Fuel 1957, 36, 321–339. [Google Scholar]
  39. Davini, P.; Ghetti, P.; Bonfanti, L.; De Michele, G. Investigation of the combustion of particles of coal. Fuel 1996, 75, 1083–1088. [Google Scholar] [CrossRef]
  40. AWWA. AWWA B604-18 Granular Activated Carbon. American Water Works Association. 2018. Available online: https://engage.awwa.org/PersonifyEbusiness/Bookstore/Product-Details/productId/69295320 (accessed on 24 November 2023).
  41. Ward, C.R. Analysis, origin and significance of mineral matter in coal: An updated review. Int. J. Coal Geol. 2016, 165, 1–27. [Google Scholar] [CrossRef]
  42. Rahman, M.M.; Shafiullah, A.Z.; Pal, A.; Islam, M.A.; Jahan, I.; Saha, B.B. Study on optimum IUPAC adsorption isotherm models employing sensitivity of parameters for rigorous adsorption system performance evaluation. Energies 2021, 14, 7478. [Google Scholar] [CrossRef]
  43. Shimizu, S.; Matubayasi, N. Surface Area Estimation: Replacing the Brunauer–Emmett–Teller Model with the Statistical Thermodynamic Fluctuation Theory. Langmuir 2022, 38, 7989–8002. [Google Scholar] [CrossRef] [PubMed]
  44. Ashtaputrey, P.; Ashtaputrey, S. Preparation and characterization of activated charcoal derived from wood apple fruit shell. J. Sci. Res 2020, 64, 236–240. [Google Scholar] [CrossRef]
  45. Oglou, R.C.; Gokce, Y.; Yagmur, E.; Ghobadi, T.G.U.; Aktas, Z. Highly stable Megalopolis lignite based N and S self-doped hierarchically porous activated carbons for high performance supercapacitors and ash content effects on performance. J. Energy Storage 2022, 46, 103817. [Google Scholar] [CrossRef]
  46. Zou, Y.; Han, B.-X. High-surface-area activated carbon from Chinese coal. Energy Fuels 2001, 15, 1383–1386. [Google Scholar] [CrossRef]
  47. Yuan, P.; Wu, D.; He, H.; Lin, Z. The hydroxyl species and acid sites on diatomite surface: A combined IR and Raman study. Appl. Surf. Sci. 2004, 227, 30–39. [Google Scholar] [CrossRef]
  48. Fujioka, Y.; Nishifuji, M.; Saito, K.; Kato, K. Analysis of Thermal Decomposition Behavior of Coals Using High Temperature Infrared Spectrophotometer System. SHINNITTETSU GIHO 2006, 384, 53. [Google Scholar]
  49. Ibarra, J.; Munoz, E.; Moliner, R. FTIR study of the evolution of coal structure during the coalification process. Org. Geochem. 1996, 24, 725–735. [Google Scholar] [CrossRef]
  50. Lorenc-Grabowska, E.; Gryglewicz, G.; Gryglewicz, S. Development of mesoporosity in activated carbons via coal modification using Ca-and Fe-exchange. Microporous Mesoporous Mater. 2004, 76, 193–201. [Google Scholar] [CrossRef]
  51. Zhuang, J.; Li, M.; Pu, Y.; Ragauskas, A.J.; Yoo, C.G. Observation of potential contaminants in processed biomass using fourier transform infrared spectroscopy. Appl. Sci. 2020, 10, 4345. [Google Scholar] [CrossRef]
Figure 1. Schematic overview of activated carbon production methods and applications.
Sustainability 16 05876 g001
Figure 2. Size distribution of the coal samples.
Sustainability 16 05876 g002
Figure 3. Thermal analysis curves of coal samples: (a,b) Coal A, (c,d) Coal B and (e,f) Coal C.
Sustainability 16 05876 g003
Figure 4. FTIR analysis of coal samples.
Sustainability 16 05876 g004
Figure 5. XRD spectra of the coal samples.
Sustainability 16 05876 g005
Figure 6. SEM images of coal samples: (a) Coal A, (b) Coal B and (c) Coal C.
Sustainability 16 05876 g006
Figure 7. Adsorption isotherms of N2 at −196.15 °C on activated carbon samples: (a) AC −3 mm (b) AC +3 mm.
Sustainability 16 05876 g007
Figure 8. The effect of coal properties on activated carbon iodine number. (a) Coal BET surface area versus activated carbon iodine number and (b) coal iodine number versus activated carbon iodine number.
Sustainability 16 05876 g008
Figure 9. A plot of predicted versus actual iodine numbers of activated carbon.
Sustainability 16 05876 g009
Figure 10. XRD spectra of the AC samples: (a) ACA, (b) ACB, and (c) ACC.
Sustainability 16 05876 g010
Figure 11. SEM images of AC (−3 mm) samples: (a) ACA −3 mm_NW, (b) ACA −3 mm_AW.
Sustainability 16 05876 g011
Figure 12. SEM images of AC (+3 mm) samples: (a) ACA + 3 mm_NW, (b) ACA + 3 mm_AW.
Sustainability 16 05876 g012
Table 1. Proximate and ultimate analyses of coal samples.
Coal ACoal BCoal C
Proximate analysis (wt.%, air-dried)
Moisture3.57 ± 0.24.34 ± 0.33.64 ± 0.2
Volatile matter40.77 ± 0.937.00 ± 0.737.34 ± 0.8
Ash4.07 ± 0.45.01 ± 0.52.48 ± 0.3
Fixed carbon51.6 ± 0.853.7 ± 0.956.5 ± 0.9
Ultimate analysis (wt.%, air-dried)
C59.78 ± 0.361.31 ± 0.463.42 ± 0.4
H6.14 ± 0.16.74 ± 0.17.08 ± 0.2
N0.77 ± 0.11.36 ± 0.11.26 ± 0.1
O *30.44 ± 0.229.88 ± 0.227.33 ± 0.2
S2.87 ± 0.10.70 ± 0.10.91 ± 0.1
* Oxygen was calculated by the difference.
Table 2. BET surface area and porosity results for the coal samples.
PropertyUnitsCoal ACoal BCoal C
BET surface area m2/g2.53.64.0
Langmuir surface area m2/g3.65.35.8
t-Plot micropore area m2/g0.20.10.1
Table 3. Chemical composition of ash samples.
OxidesCoal ACoal BCoal C
% (w/w)
SiO243.3255.0529.08
Al2O326.9322.1533.95
Fe2O316.1512.0018.69
MgO2.021.873.46
TiO21.241.572.44
CaO1.981.322.71
Cr2O30.130.020.03
MnO0.170.110.16
ZrO20.070.070.09
CeO20.060.060.12
V2O50.070.010.02
P2O50.040.271.55
Others7.825.497.68
Table 4. The surface area and porosity of the AC samples.
Surface AreaACA
−3 mm
ACA
+3 mm
ACB
−3 mm
ACB
+3 mm
ACC
−3 mm
ACC
+3 mm
AW
BET (m2/g)973 ± 19538 ± 10940 ± 15514 ± 10935 ± 21539 ± 10
Langmuir (m2/g) 1392 ± 9737 ± 21330 ± 7712 ± 31334 ± 7739 ± 2
Pore size (Å)
Adsorption average pore diameter (4 V/A by BET)14.6516.6114.7416.6715.1316.73
Desorption average pore diameter (4 V/A by BET)18.4820.3715.9613.6114.8715.71
Micropore volume (cm3/g)0.330.220.330.210.330.22
Micropore area (m2/g)658457665427674465
Table 5. Product yield (%) of the AC samples.
SampleACA
−3 mm
ACA
+3 mm
ACB
−3 mm
ACB
+3 mm
ACC
−3 mm
ACC
+3 mm
AW
Yield (%)58.658.448.564.457.165.0
Disclaimer/Publisher’s Note: The statements, opinions and data contained in all publications are solely those of the individual author(s) and contributor(s) and not of MDPI and/or the editor(s). MDPI and/or the editor(s) disclaim responsibility for any injury to people or property resulting from any ideas, methods, instructions or products referred to in the content.

