
Exploration of Eco-Environment and Urbanization Changes Based on Multi-Source Remote Sensing Data—A Case Study of Yangtze River Delta Urban Agglomeration

Abstract
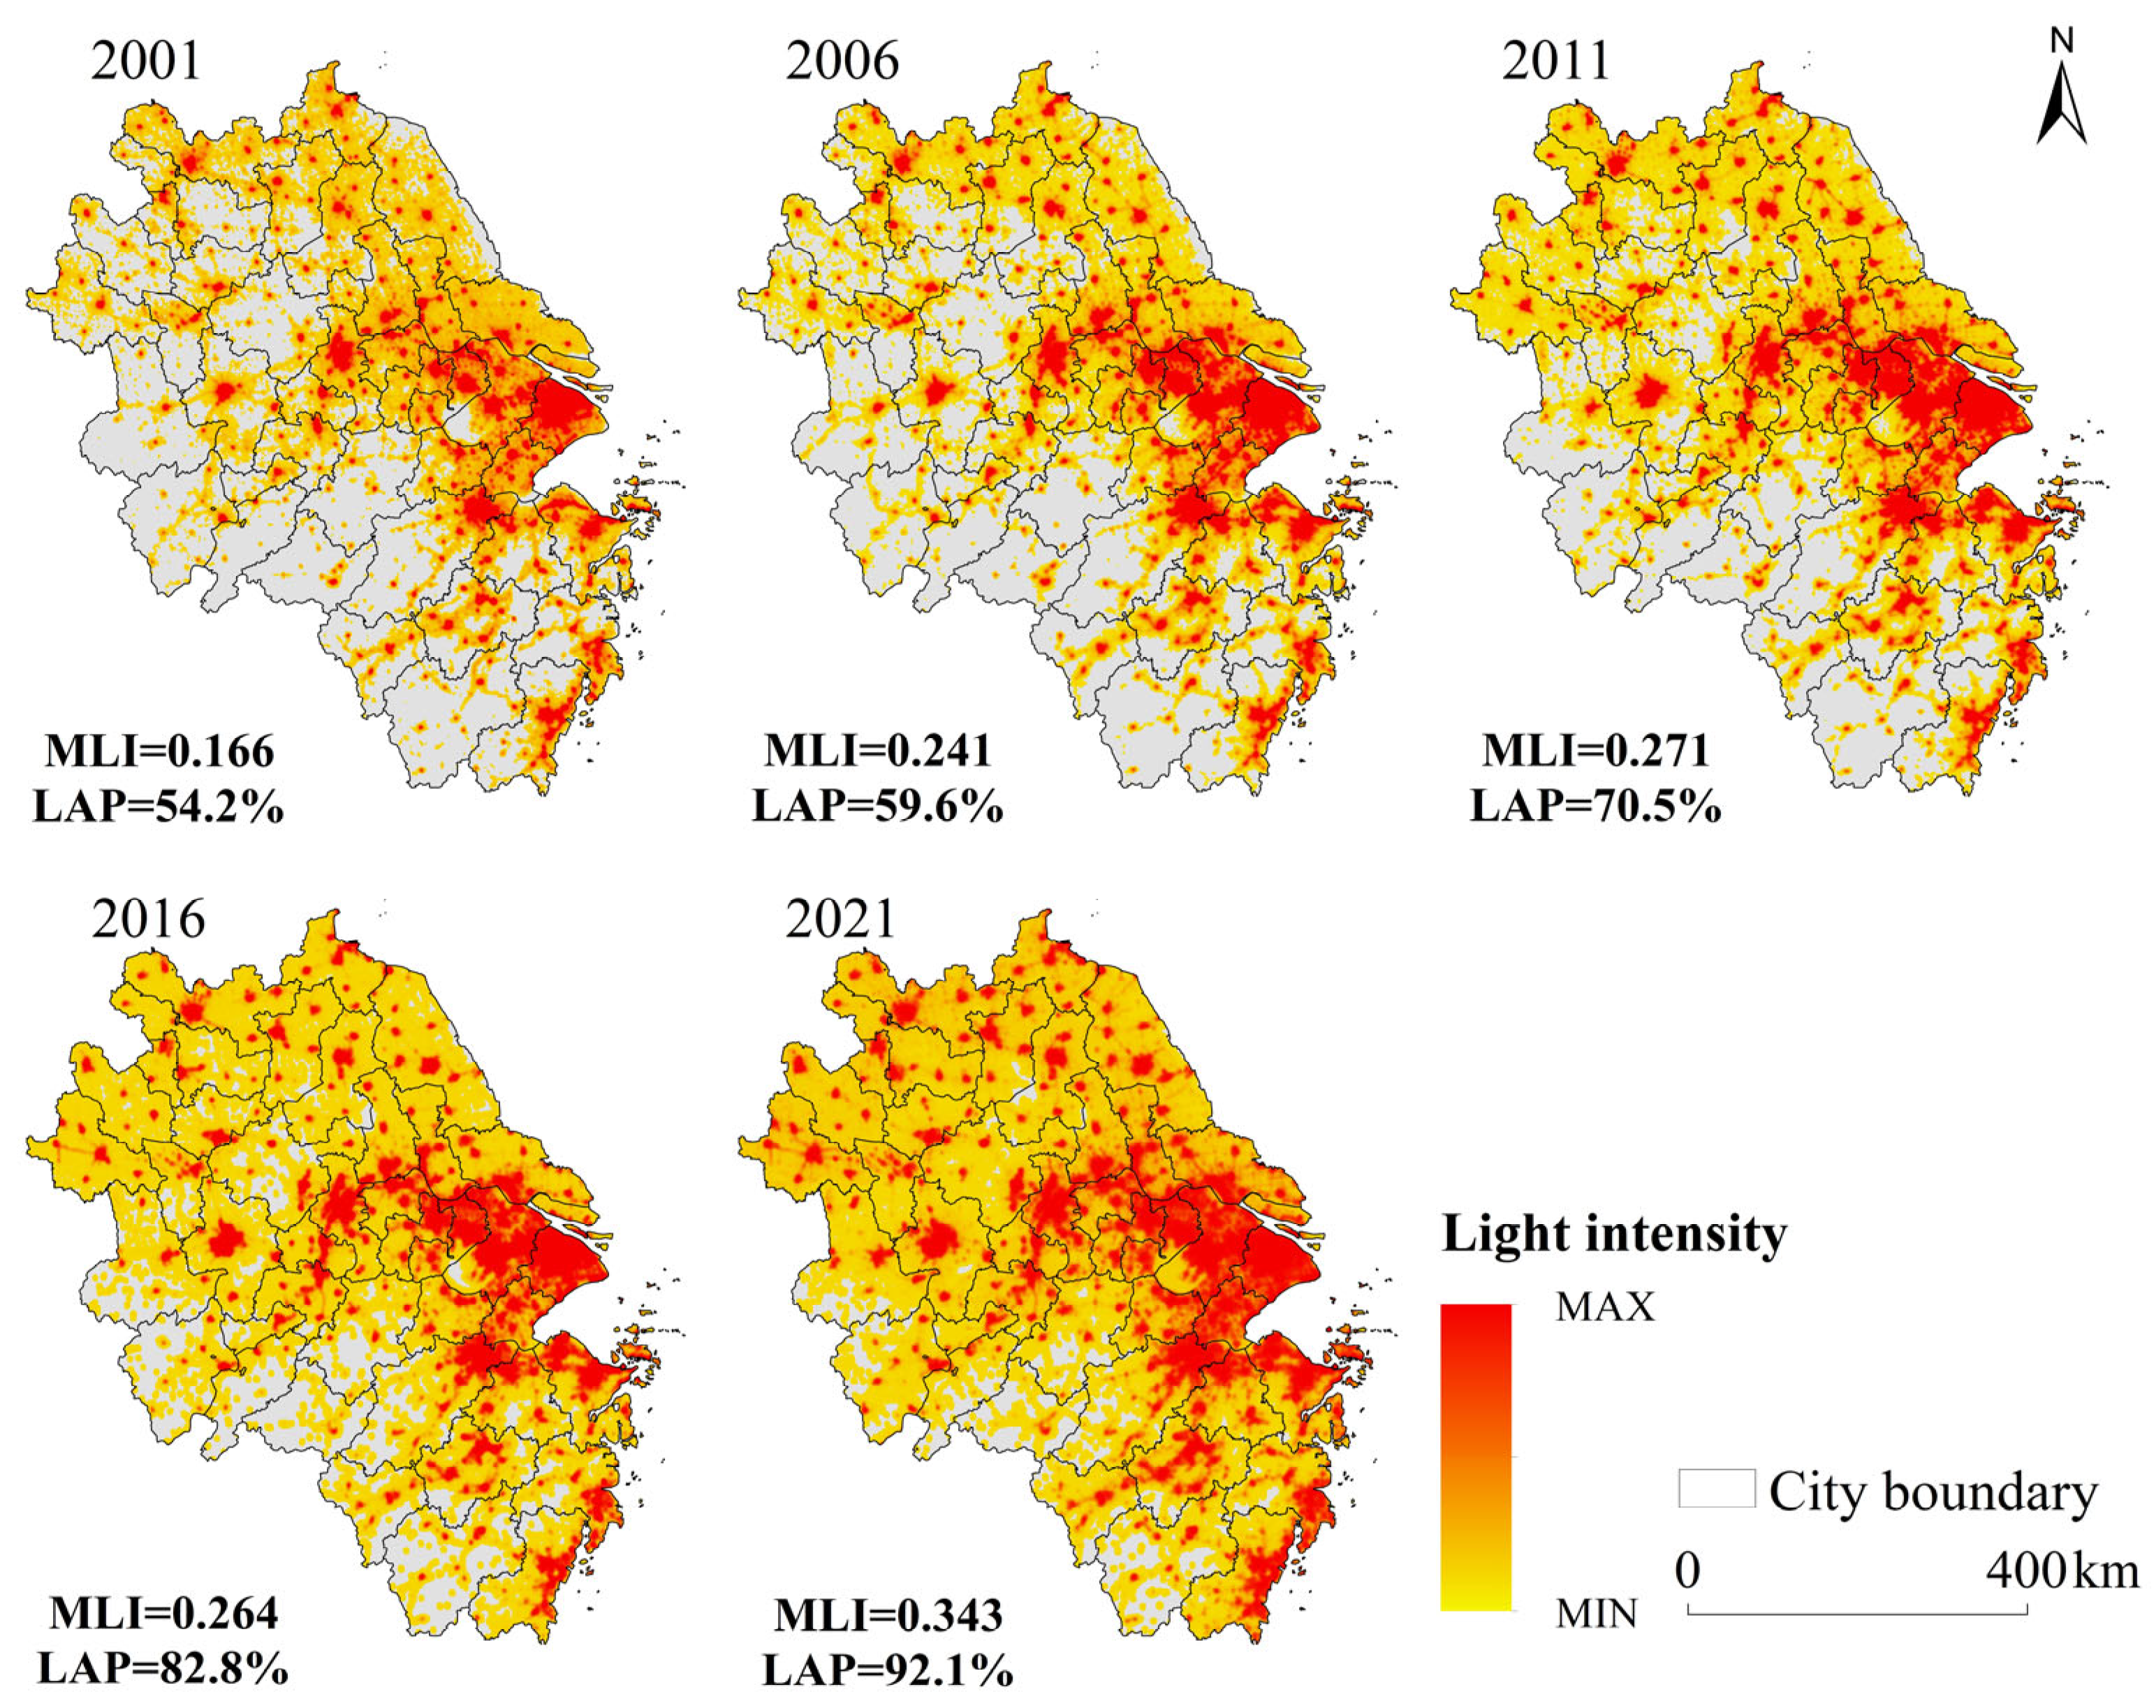
1. Introduction
- Is there a negative correlation between the quality of the urban ecological environment and the level of urbanization?
- In the coupling and coordination relationship between the ecological environment and urbanization, which factor plays a decisive role?
2. Materials and Methods
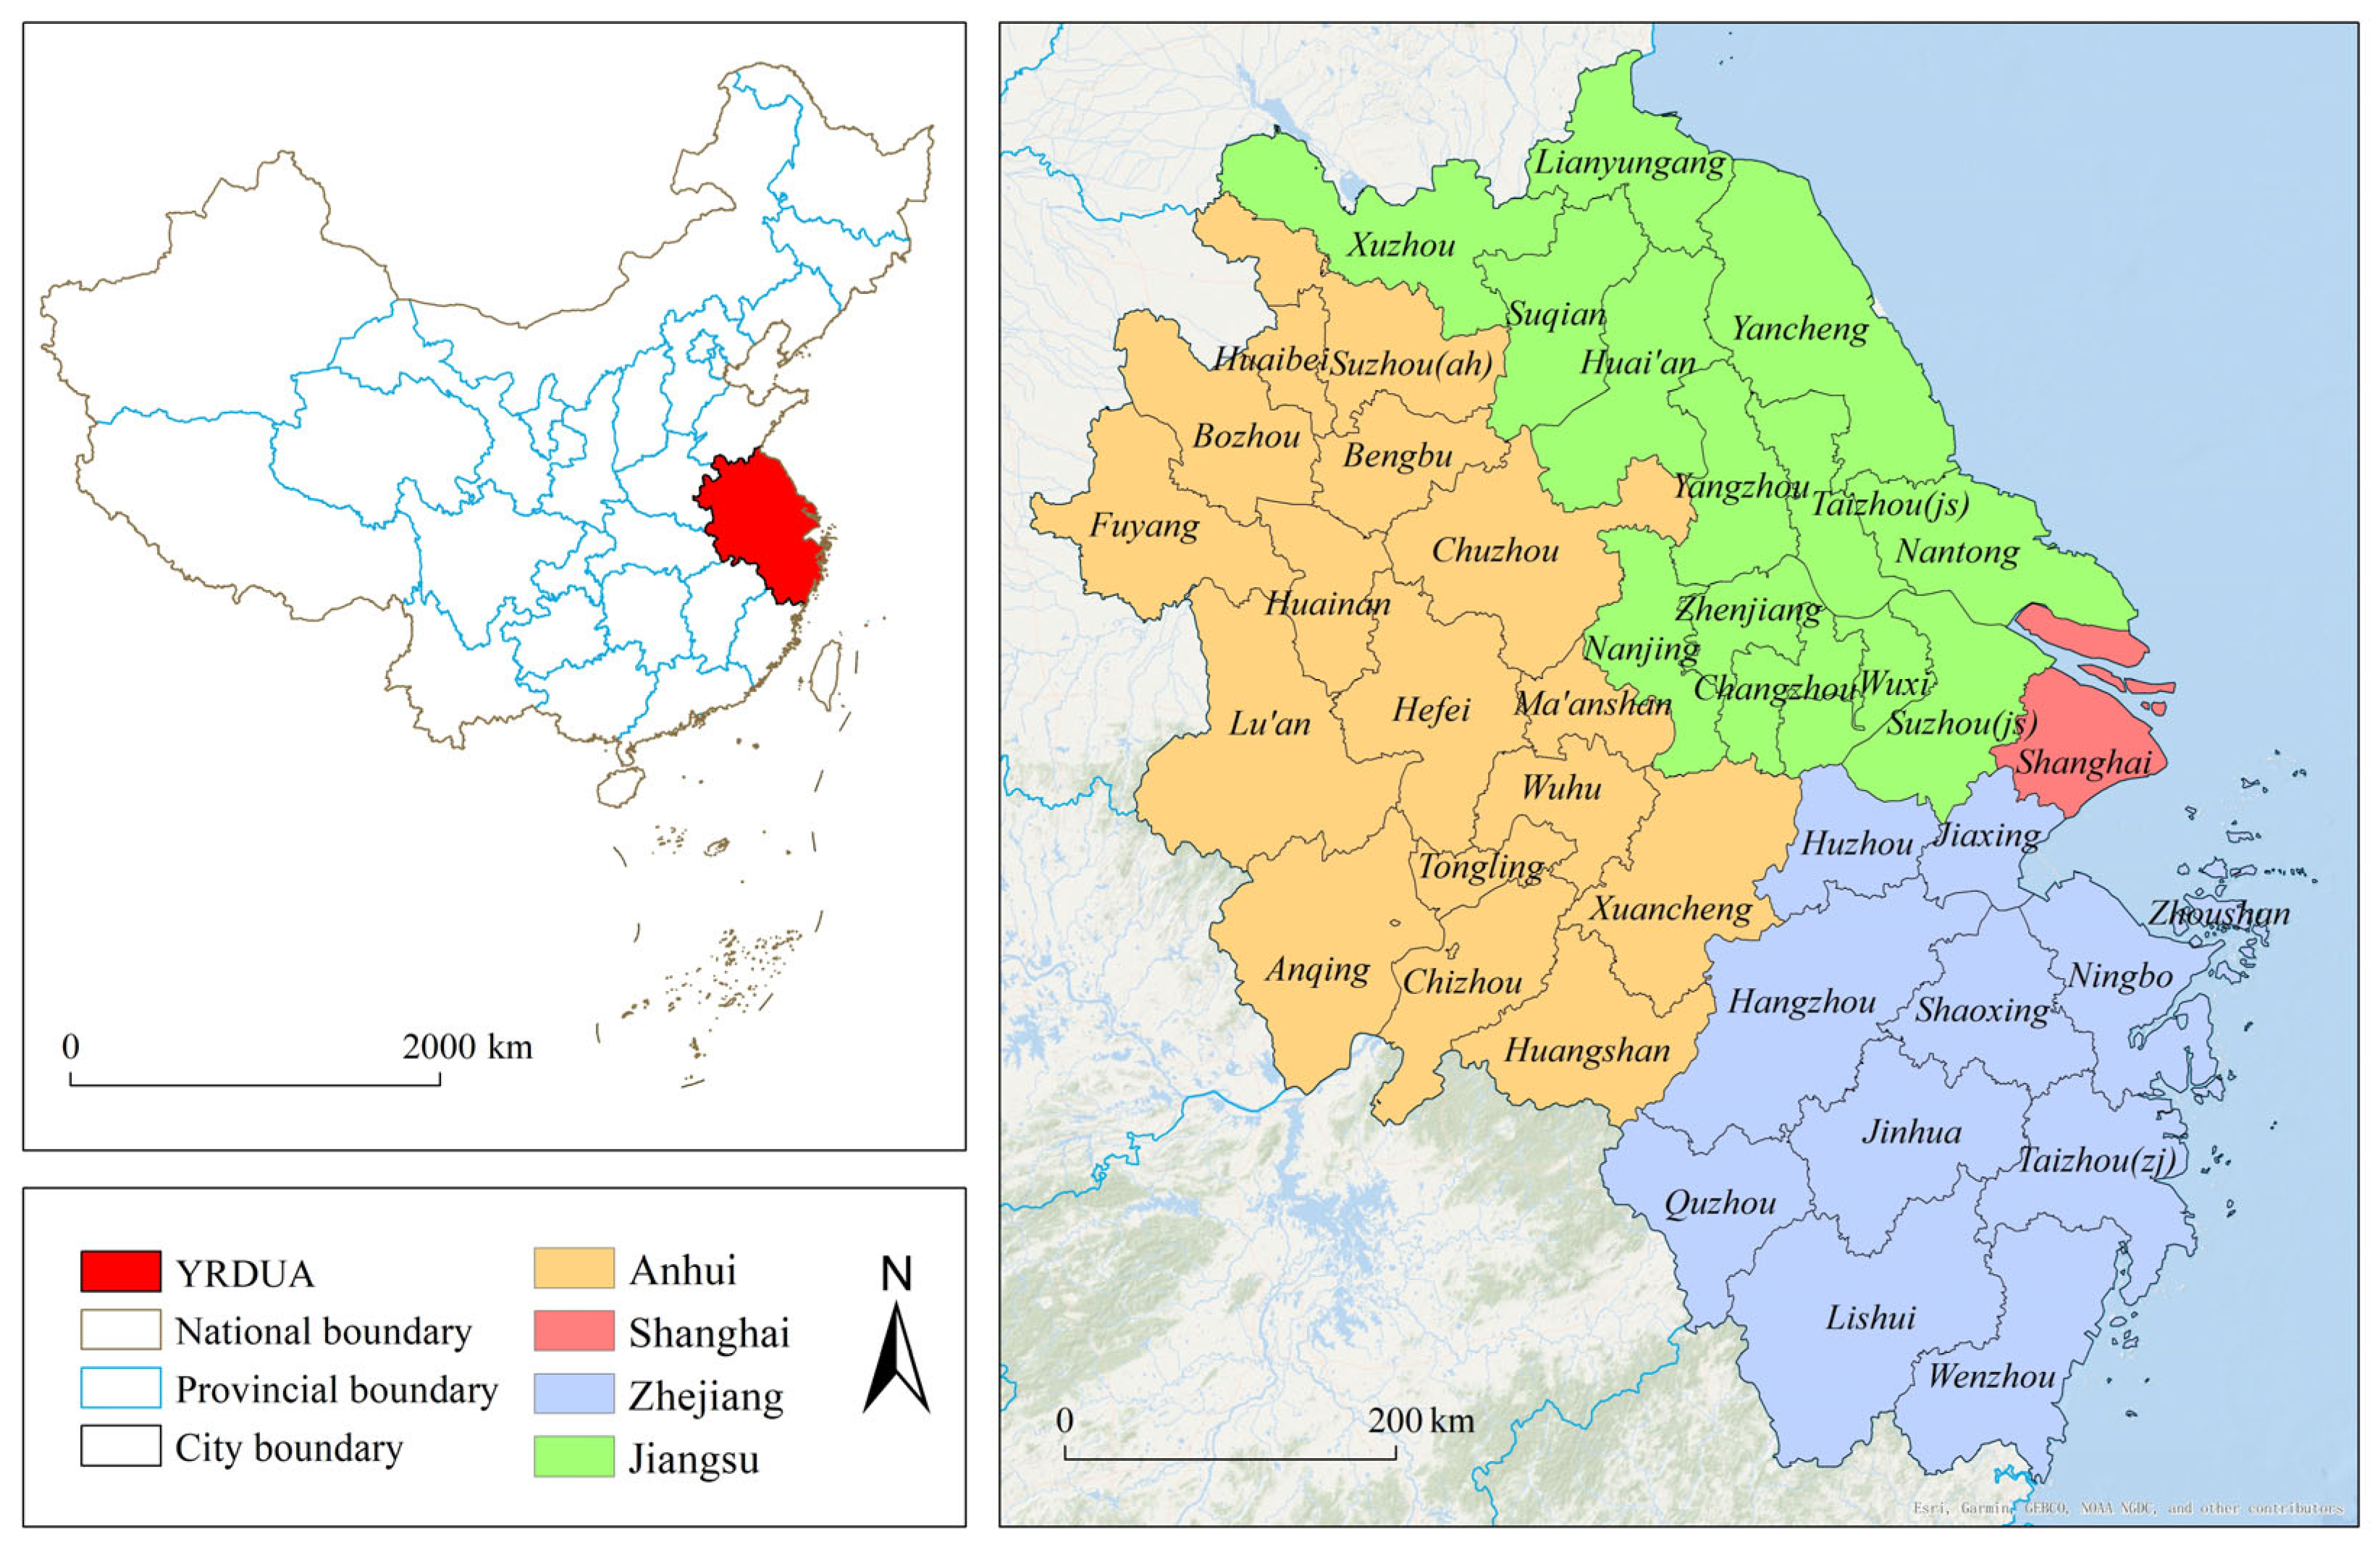
2.1. Study Area
2.2. Data
2.3. Methods
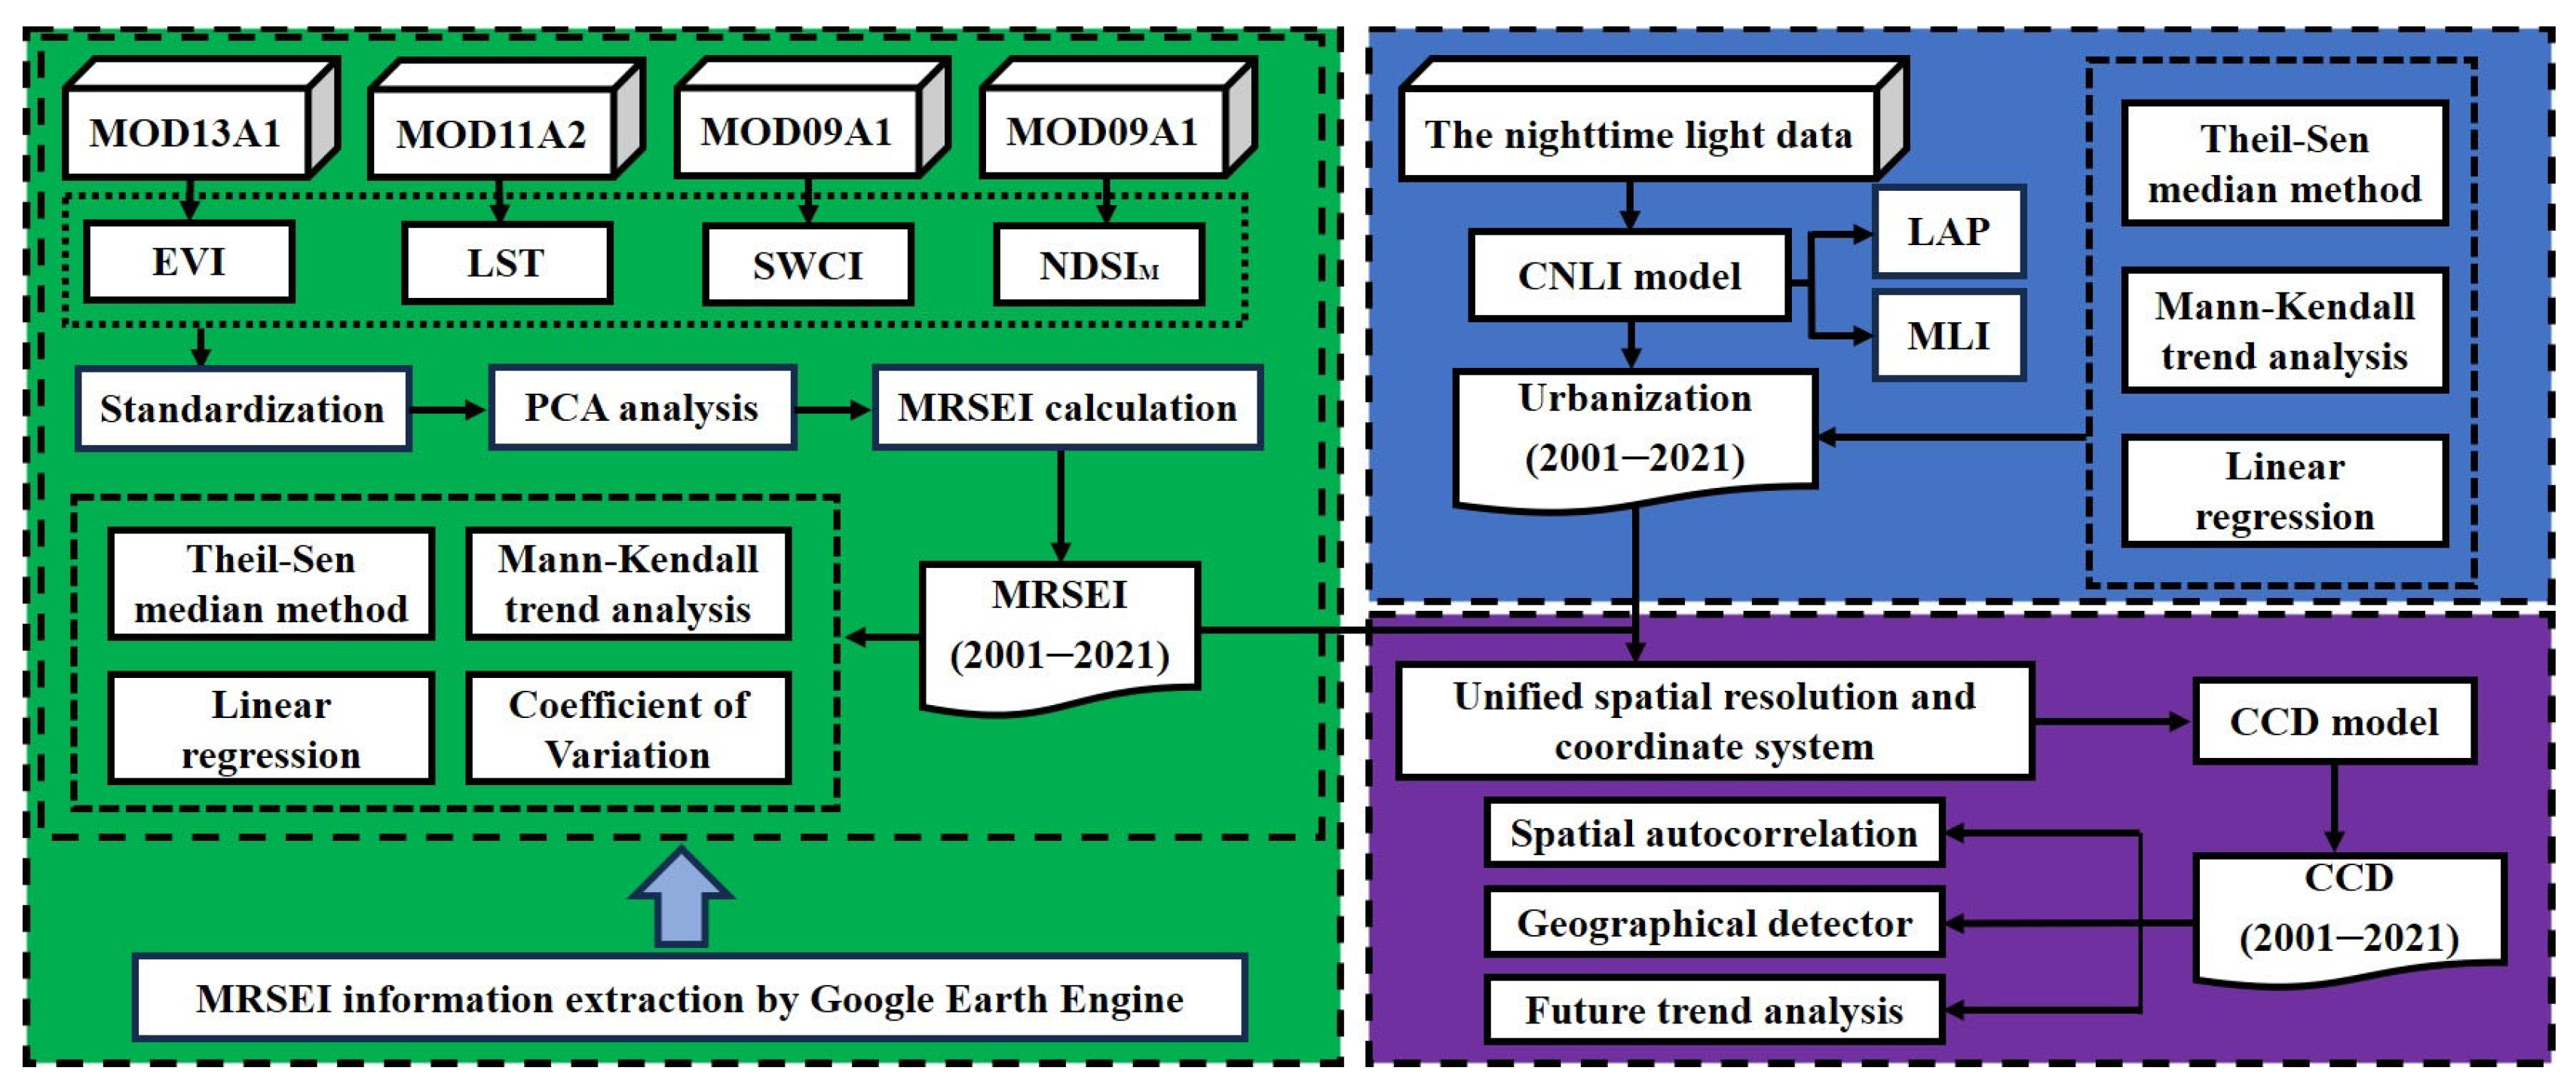
2.3.1. Research Framework
2.3.2. Calculation of the MRSEI
2.3.3. Calculation of the CNLI
2.3.4. Trend Analysis
2.3.5. CCD Model
2.3.6. Geodetector
3. Results
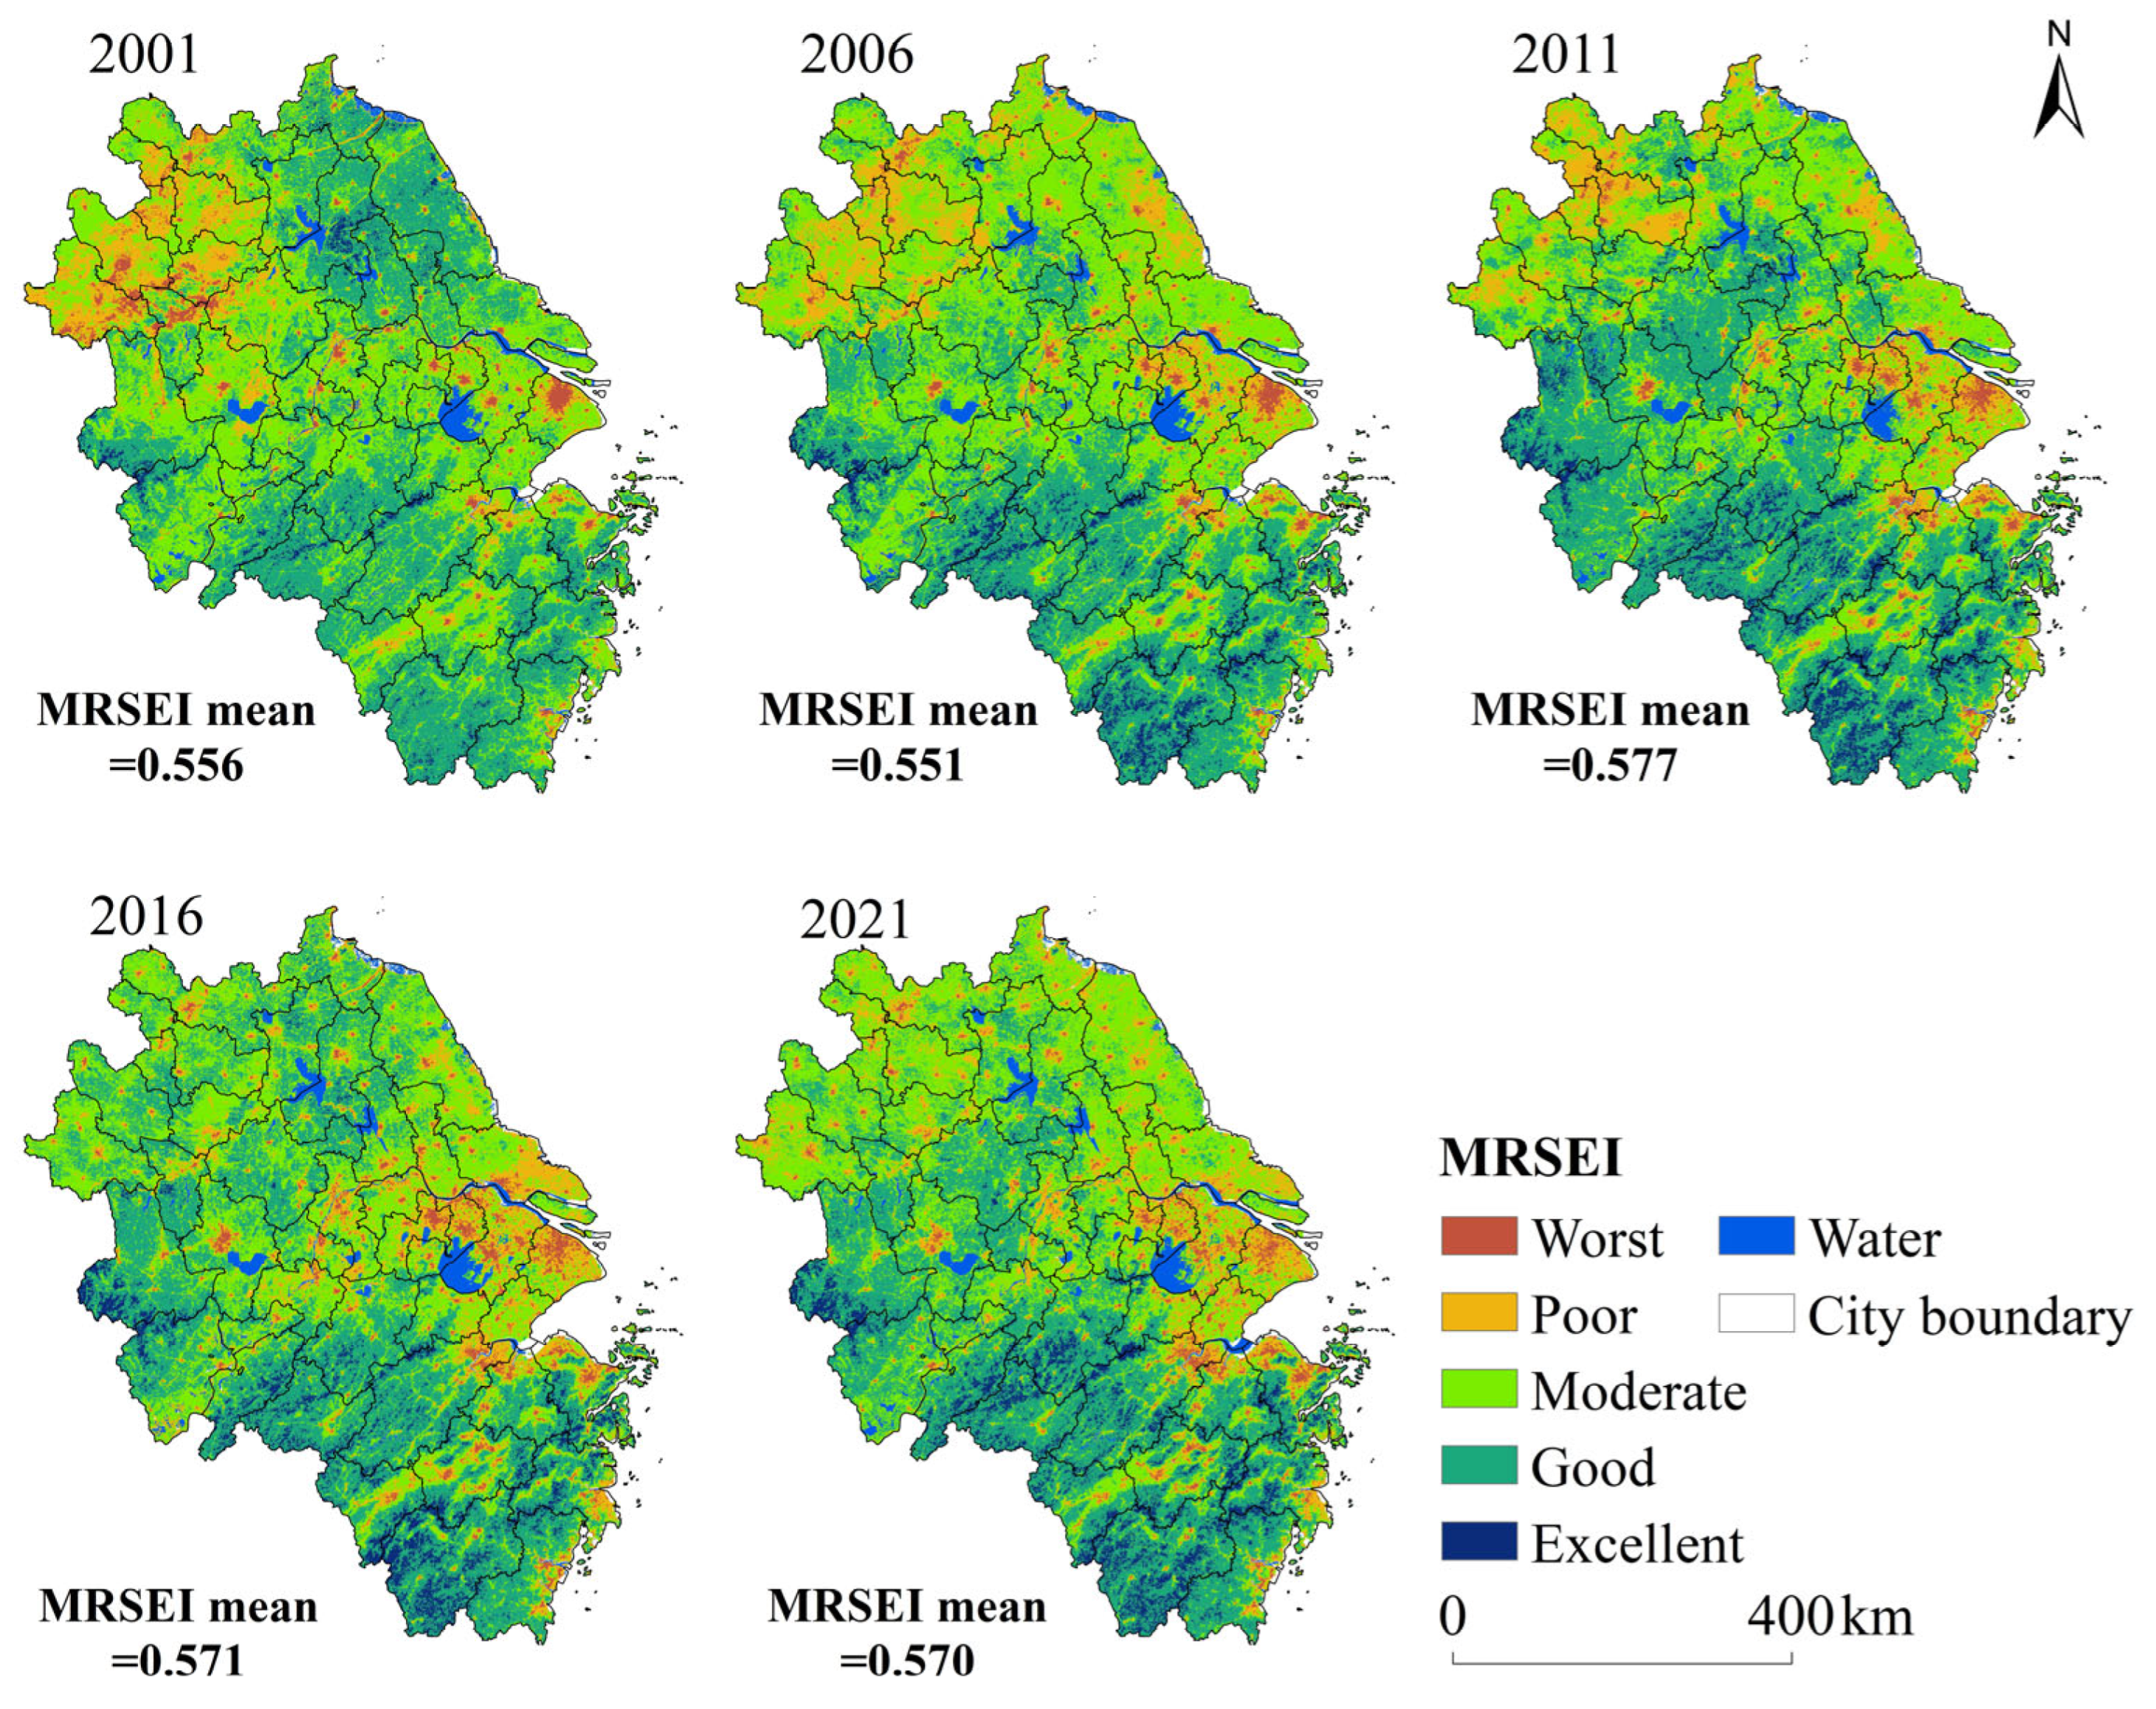
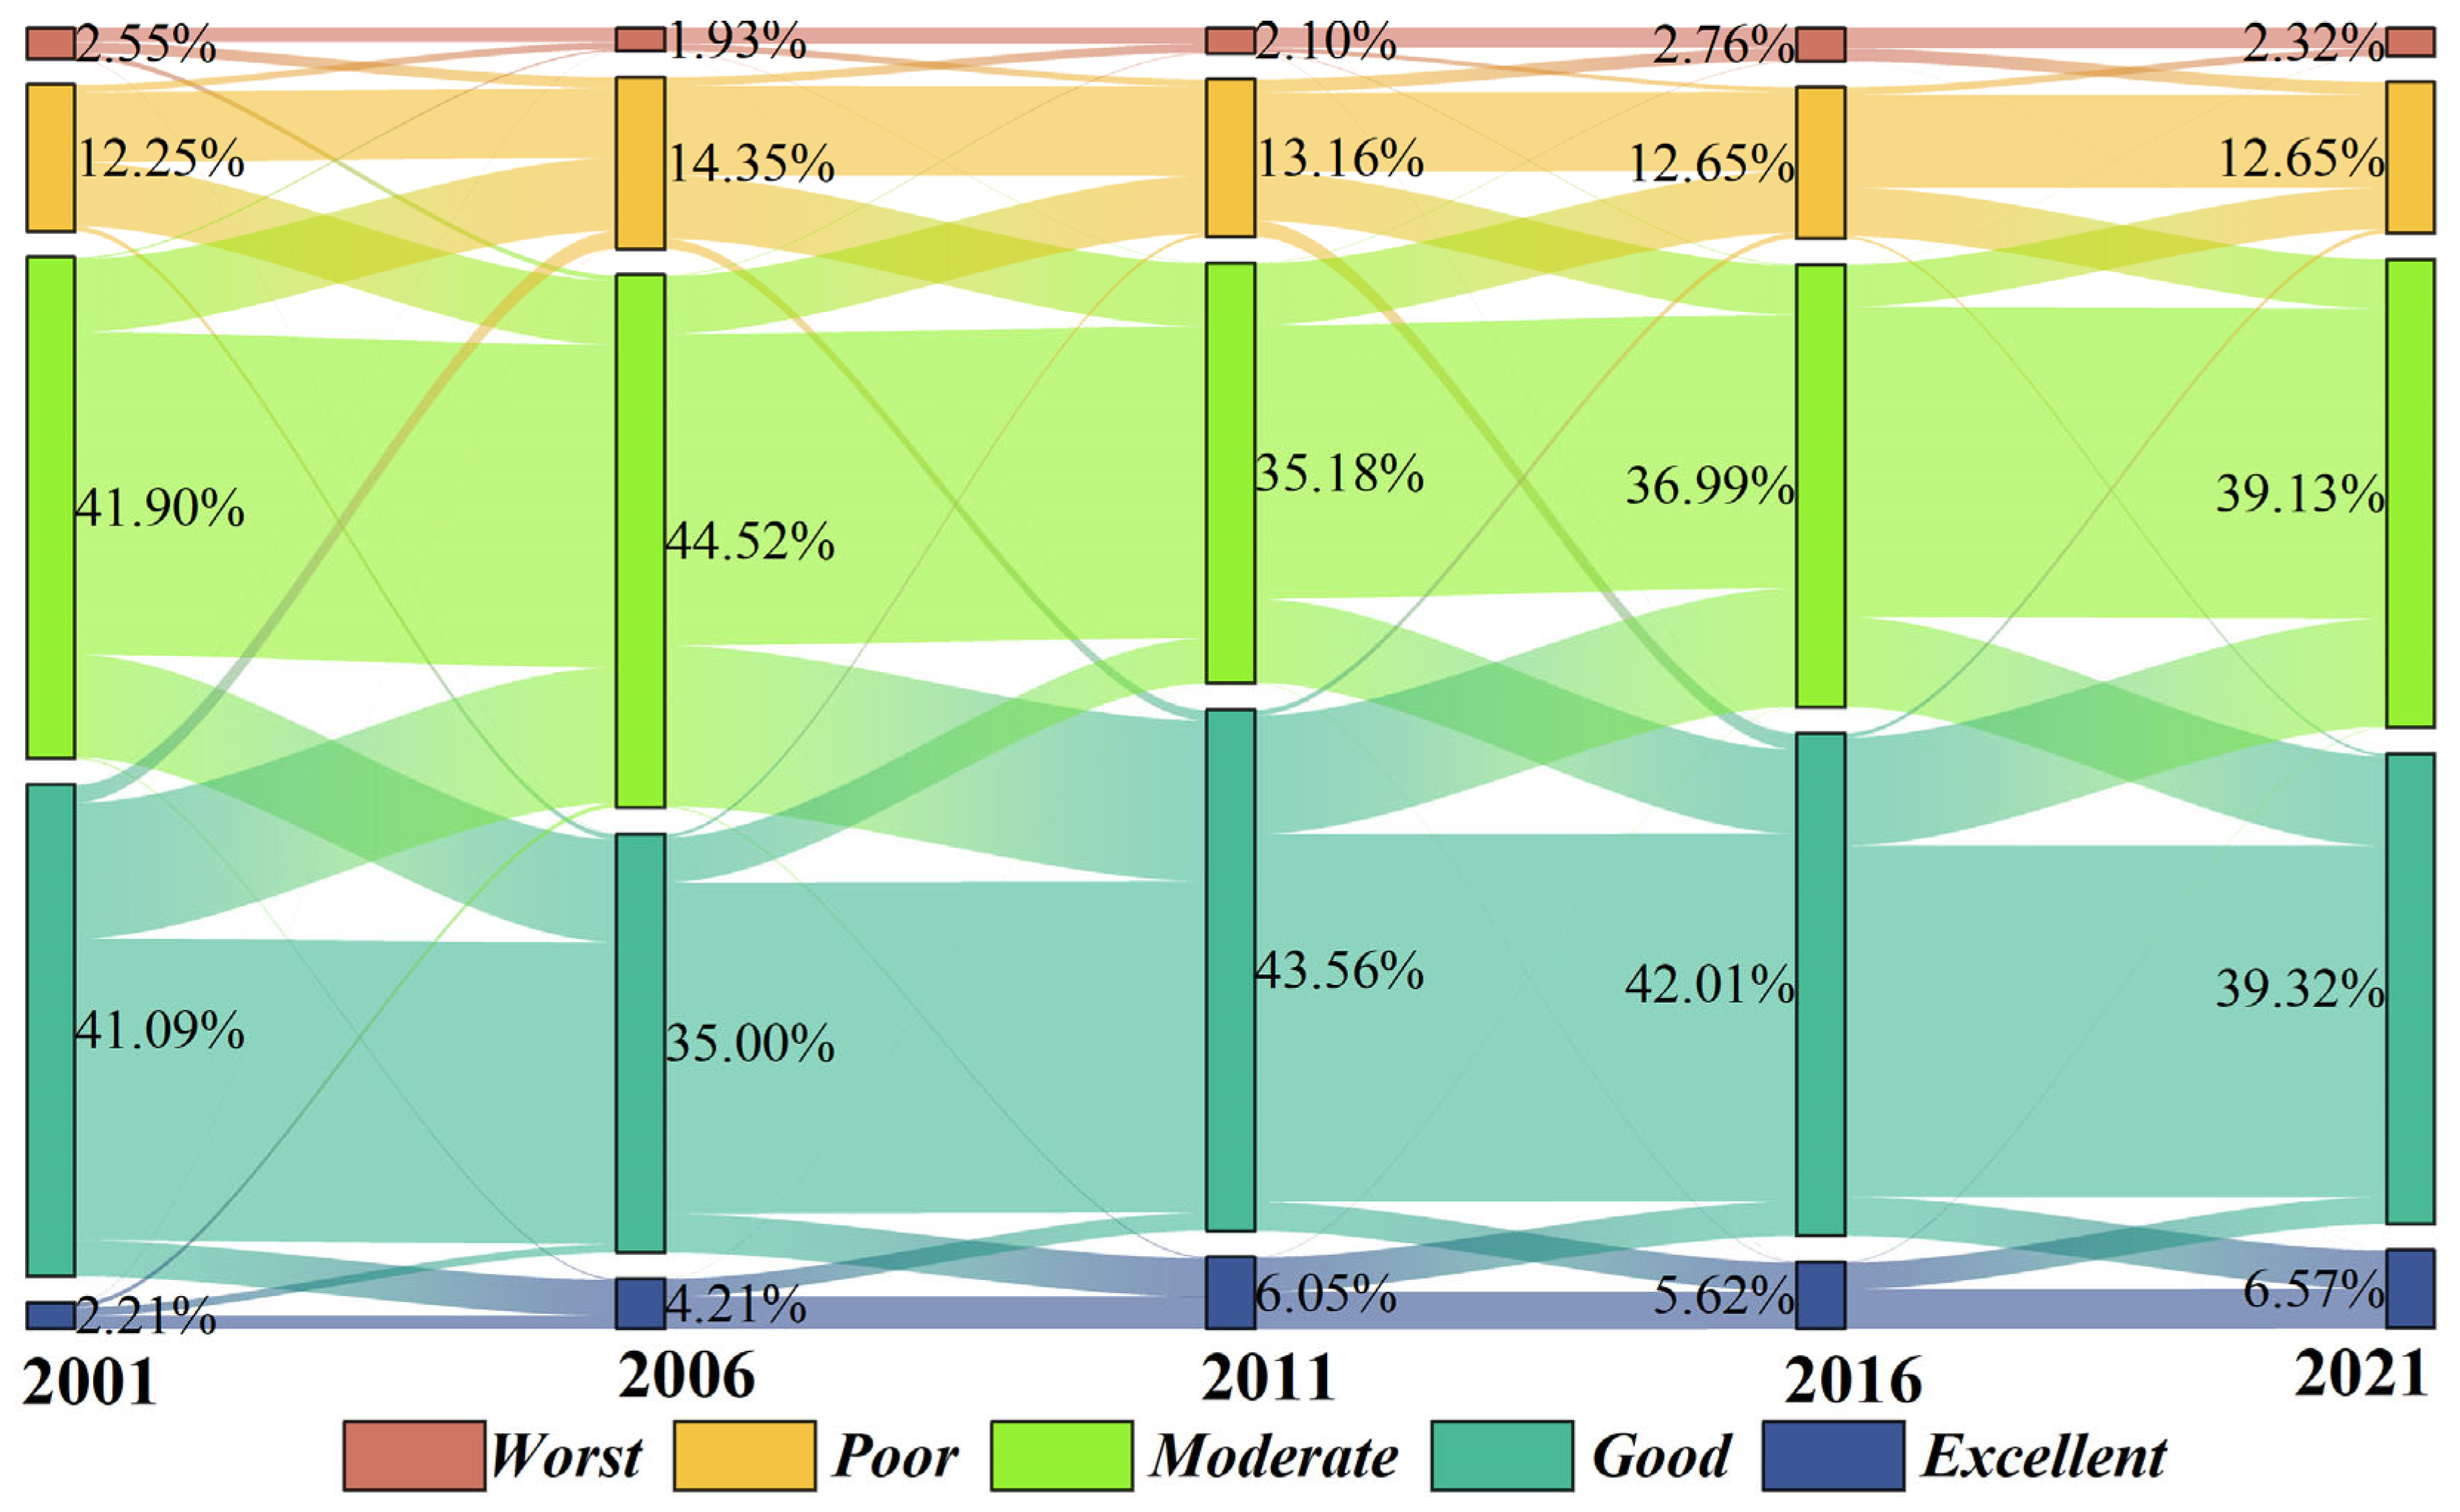
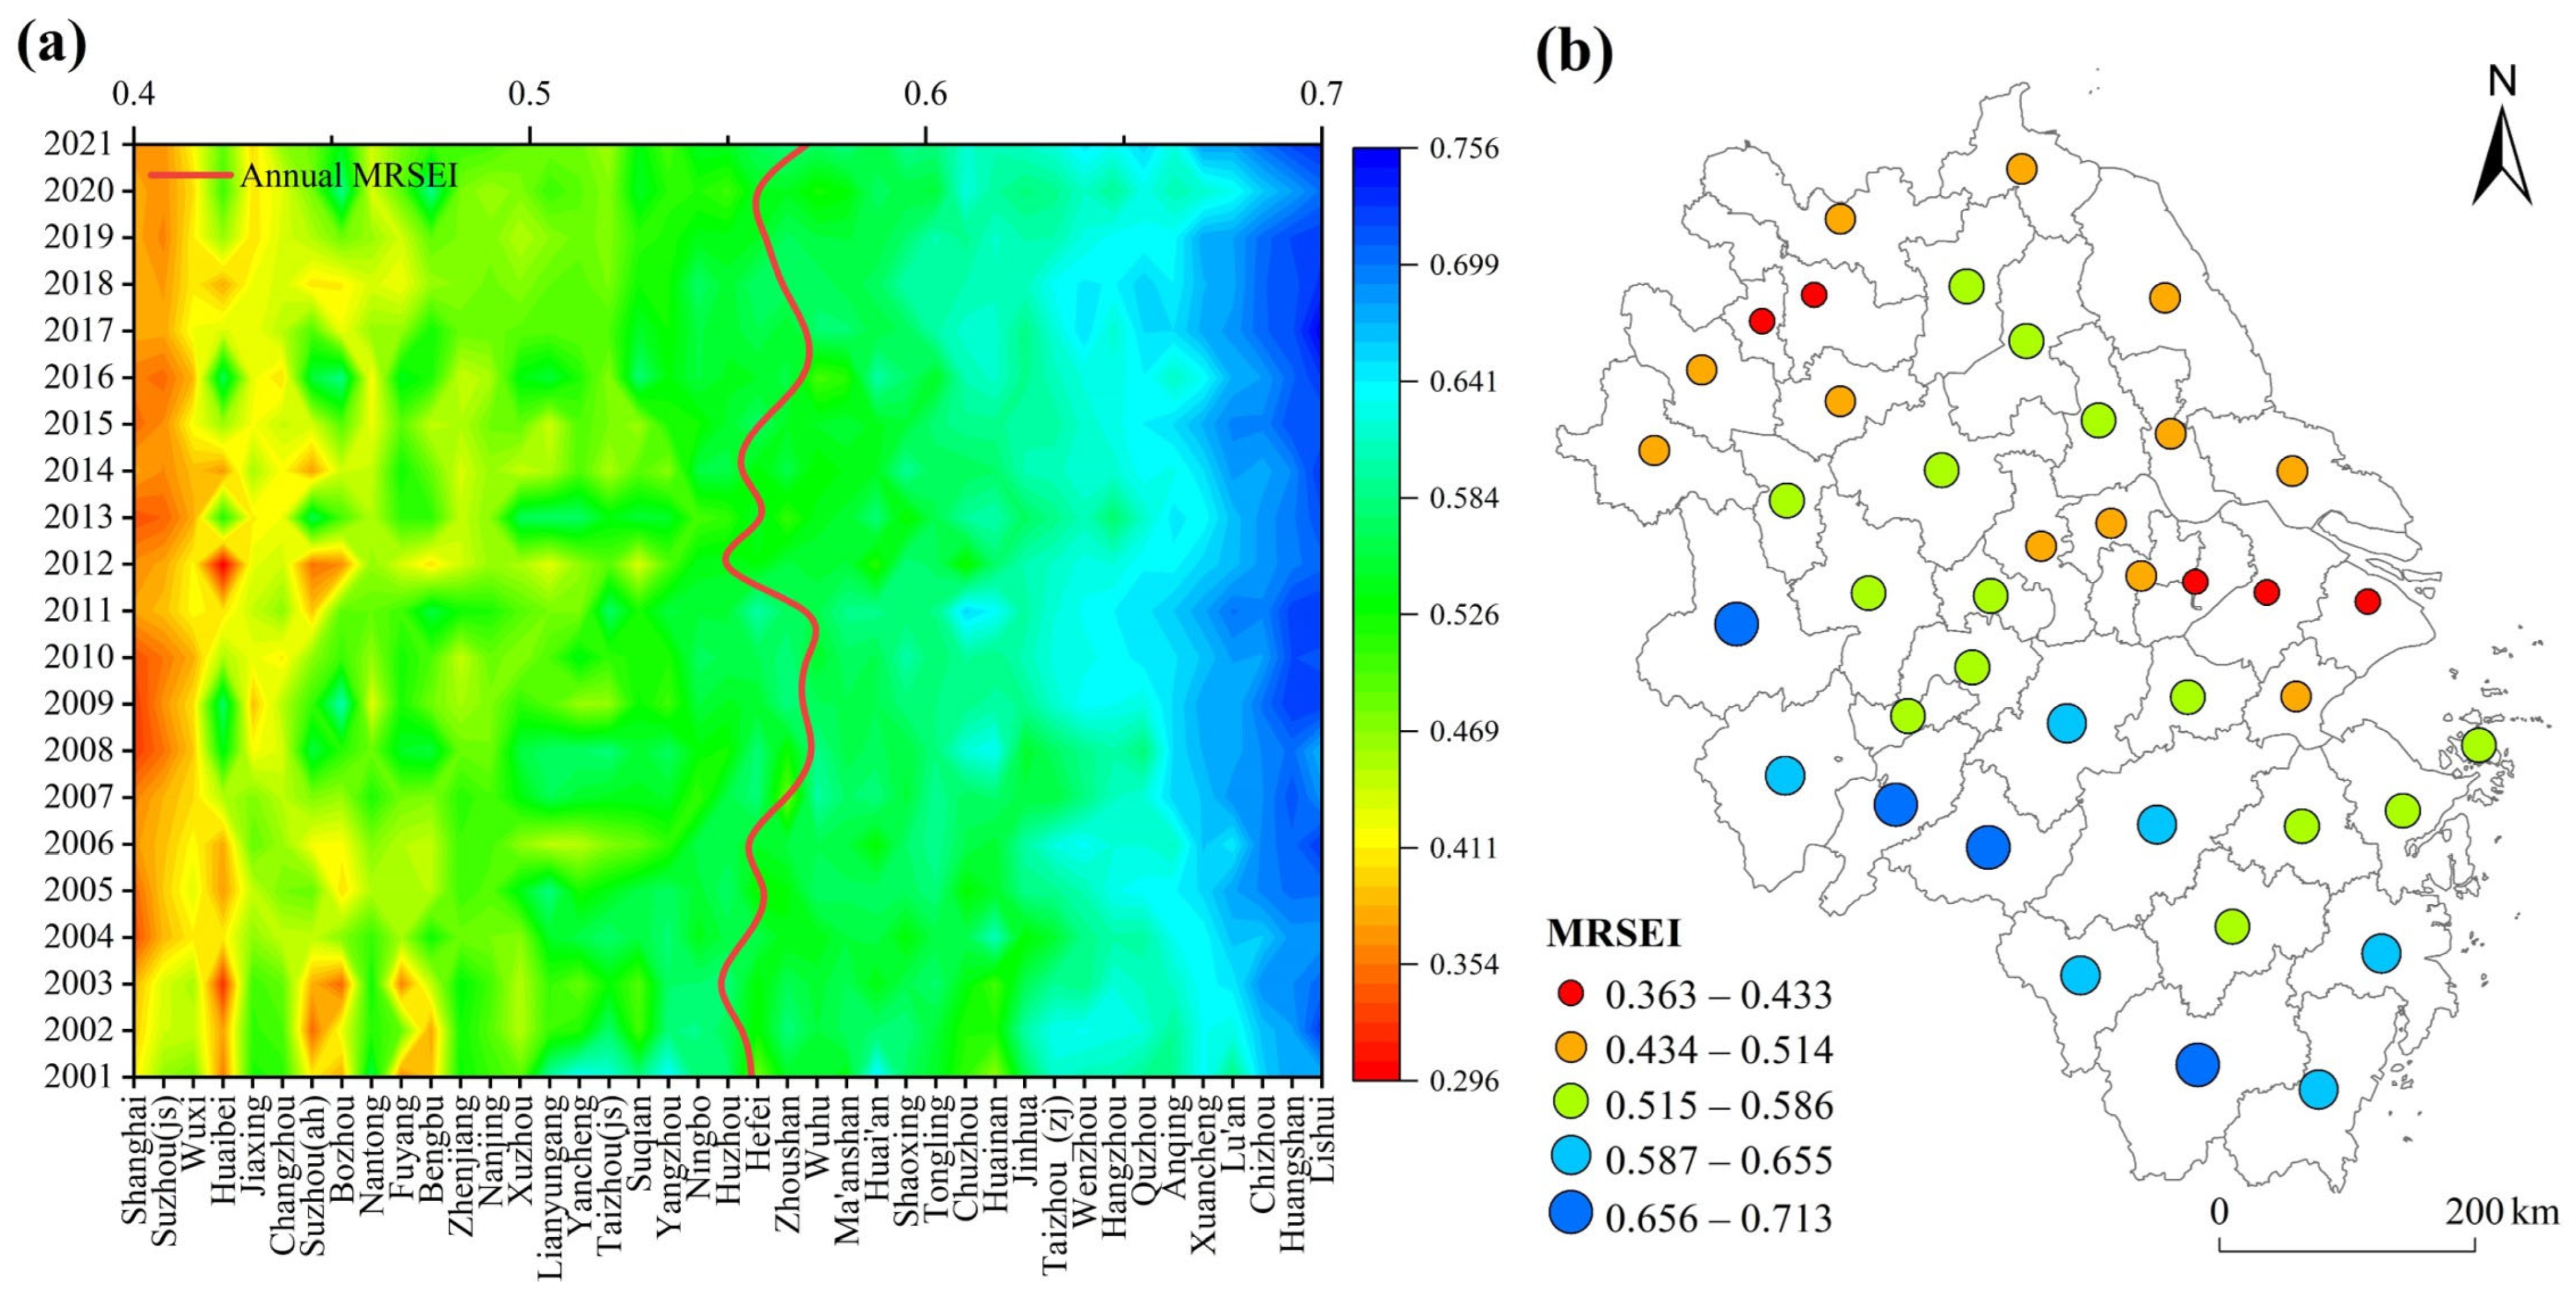
3.1. Analysis of Spatiotemporal Variations and Trends in the MRSEI within the YRDUA
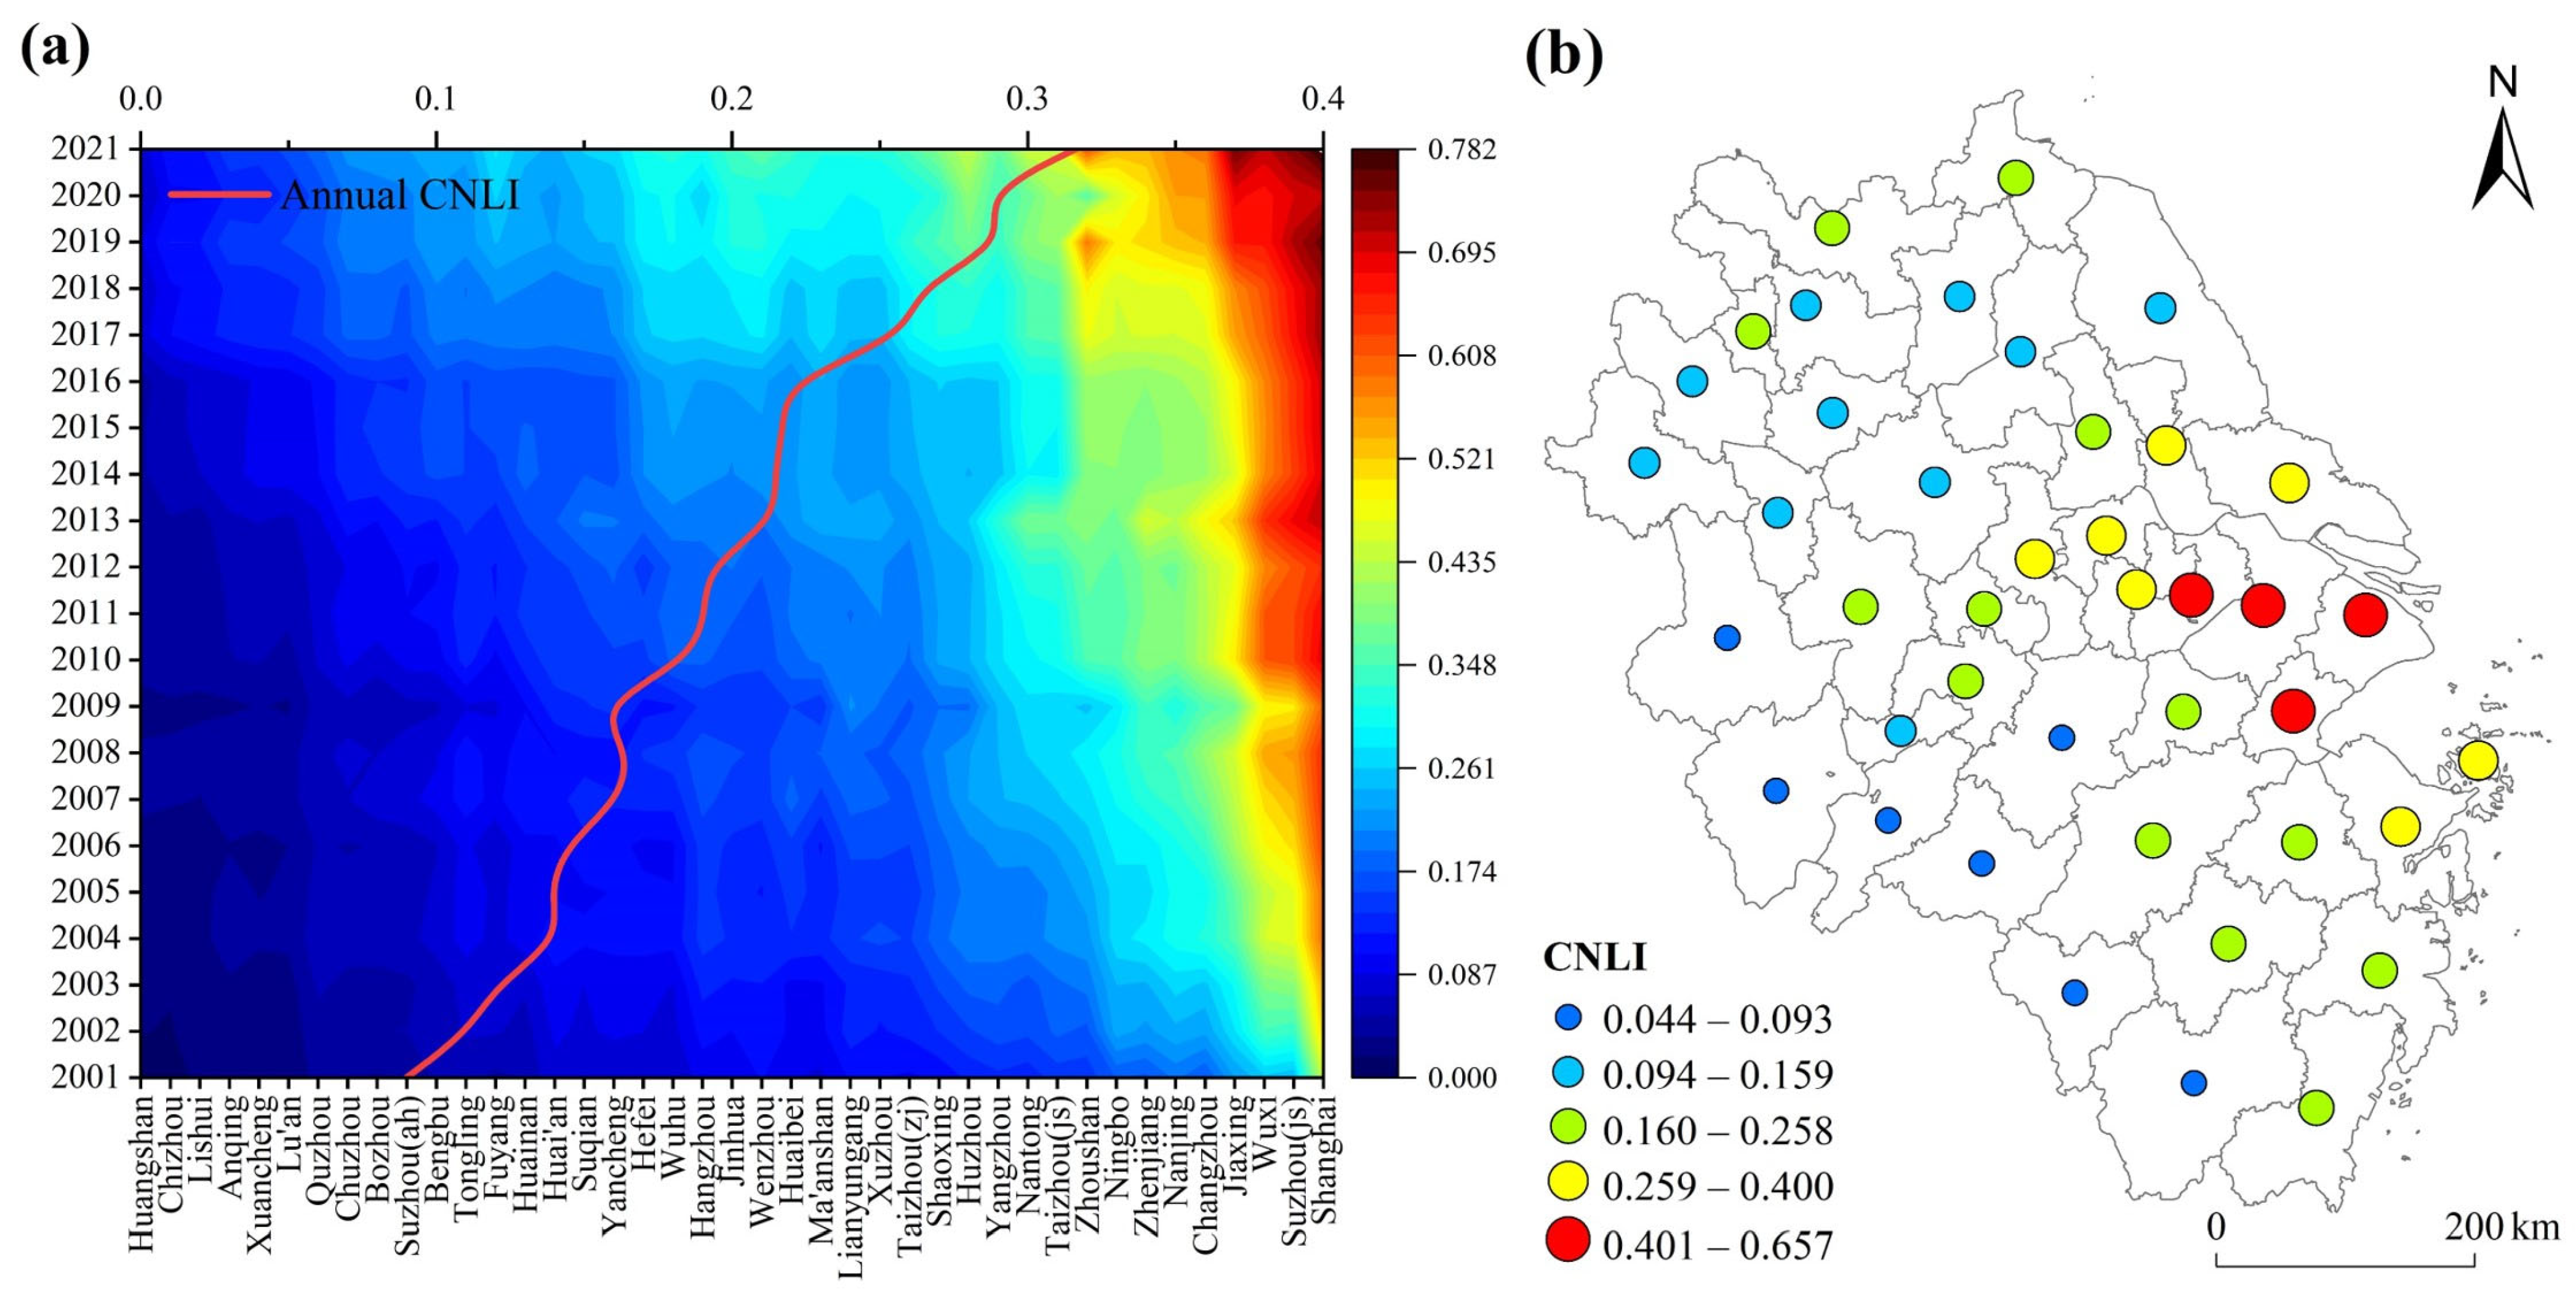
3.2. Analysis of Spatiotemporal Variations and Trends in the CNLI within the YRDUA
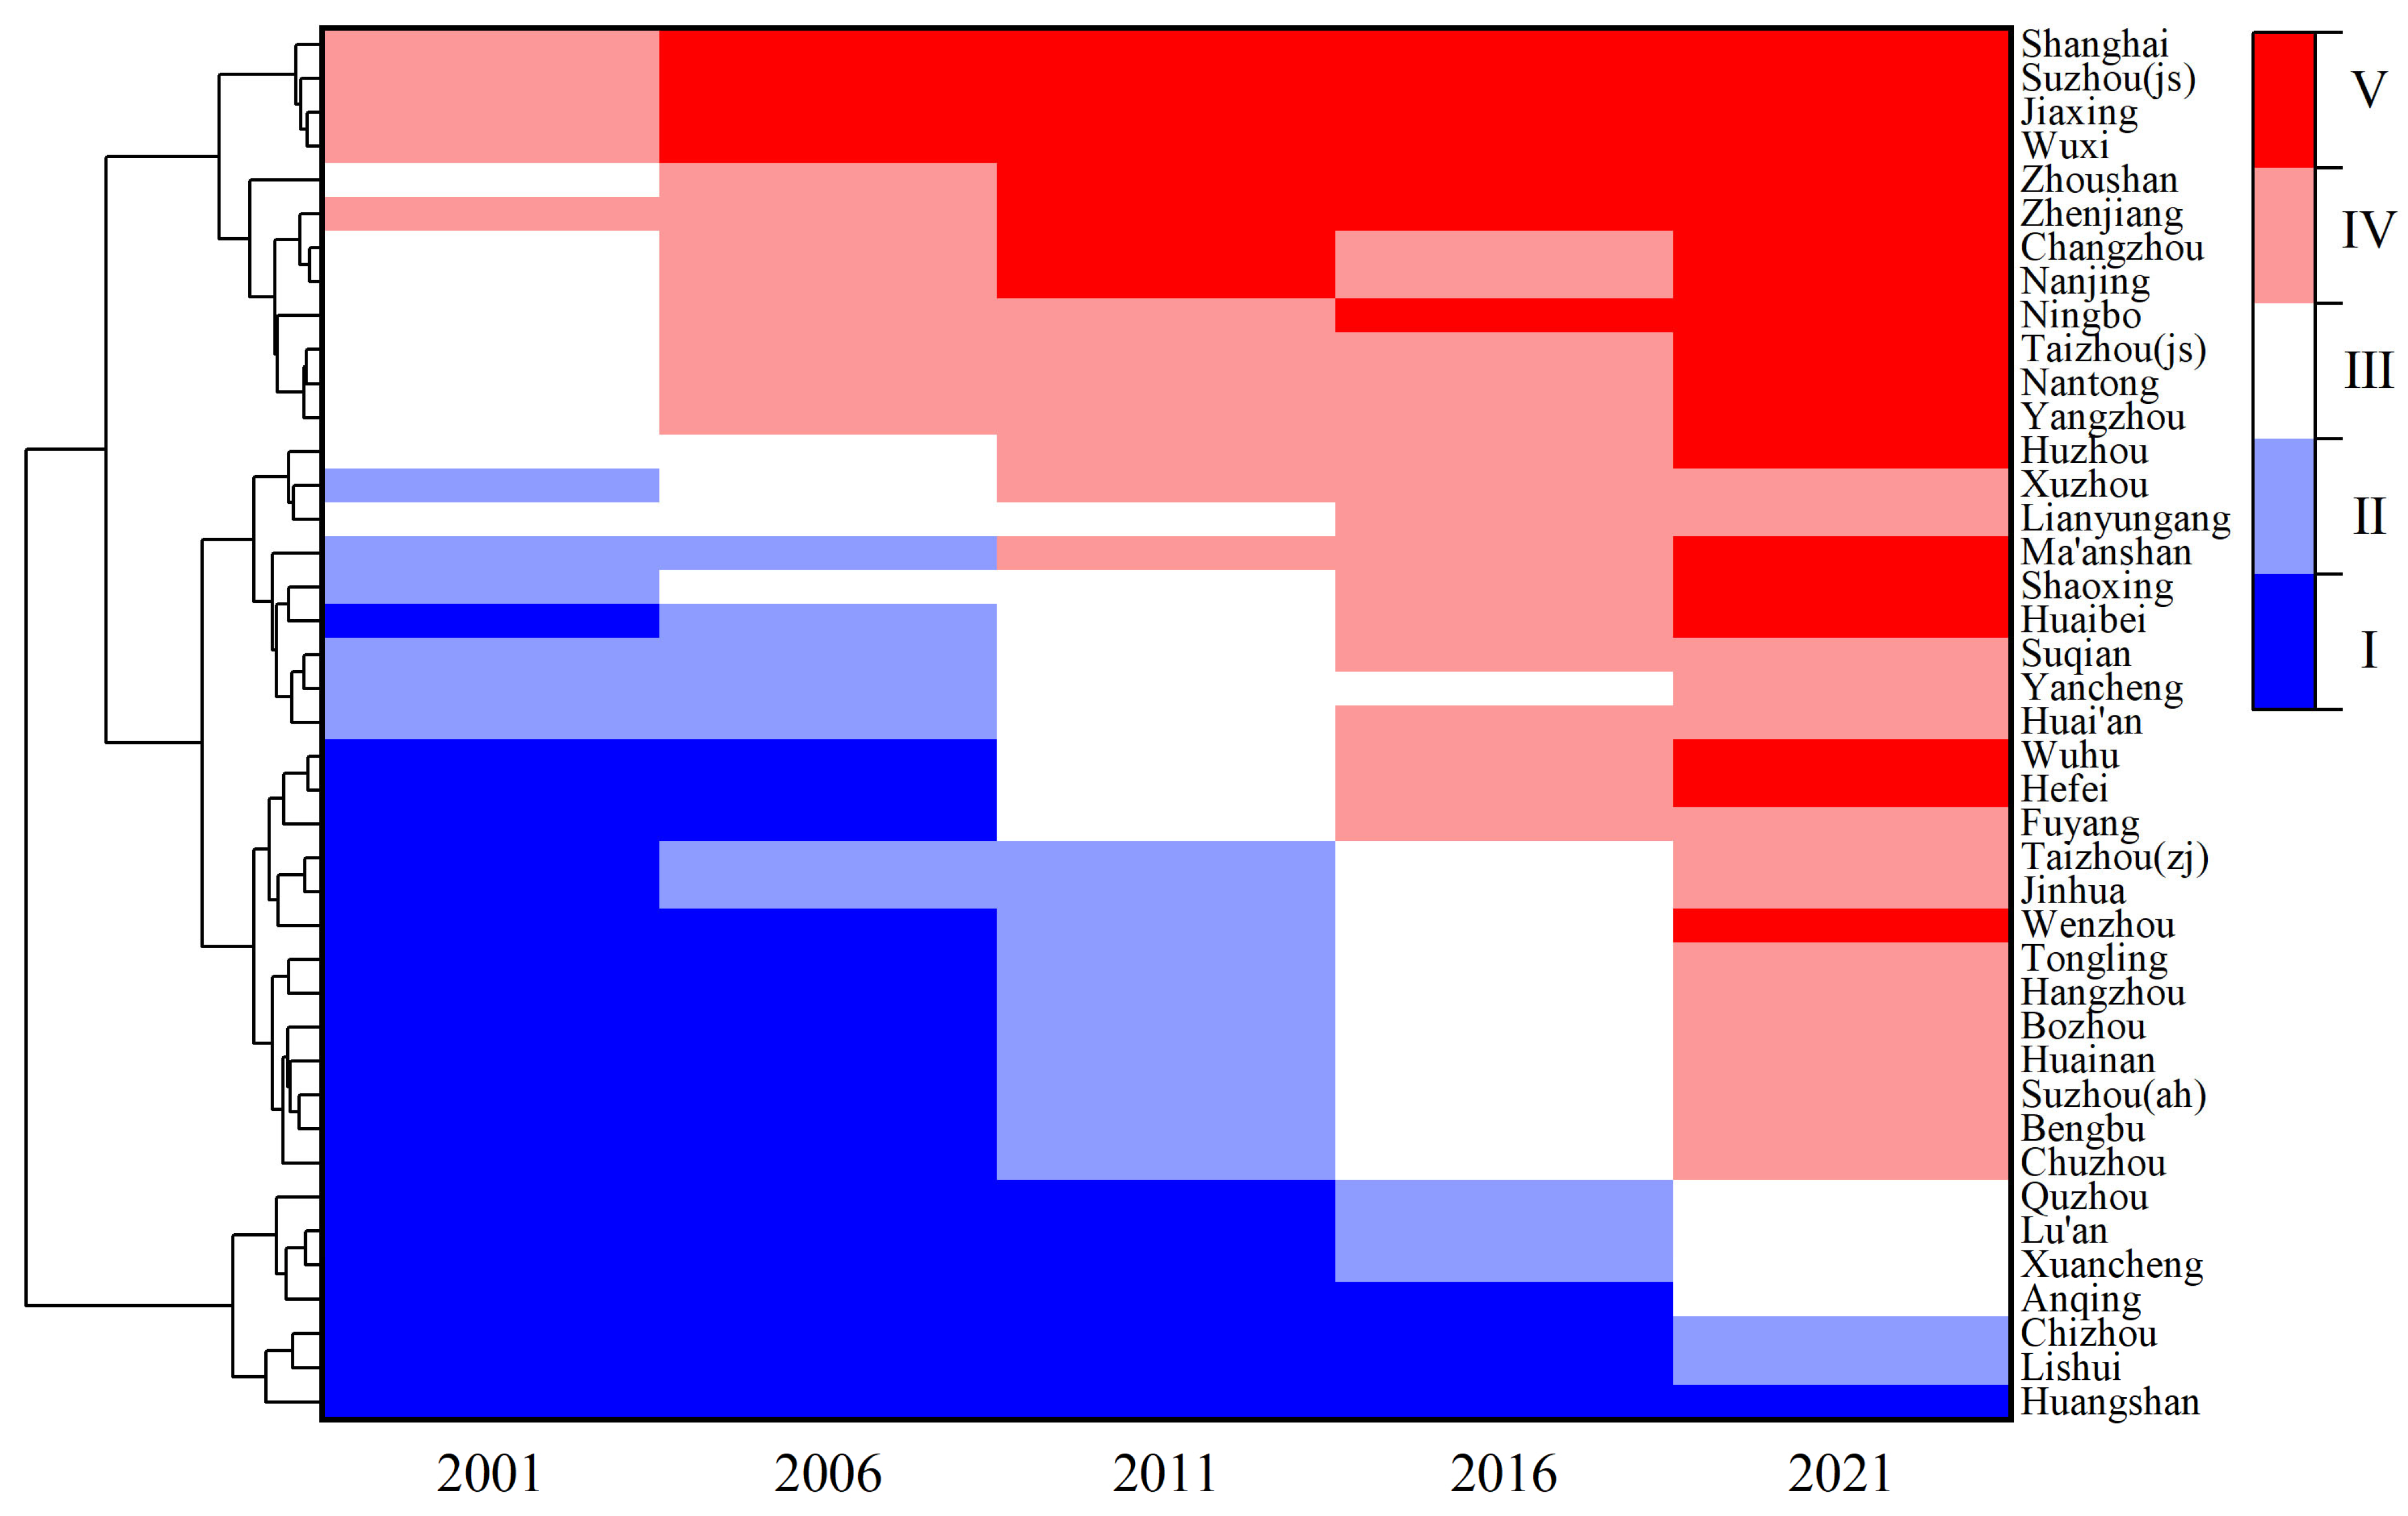
3.3. Analysis of Spatiotemporal Variations and Statistics for the CCD in the YRDUA
3.3.1. Temporal Evolution of the CCD Levels
3.3.2. Spatial Dependency of the CCD
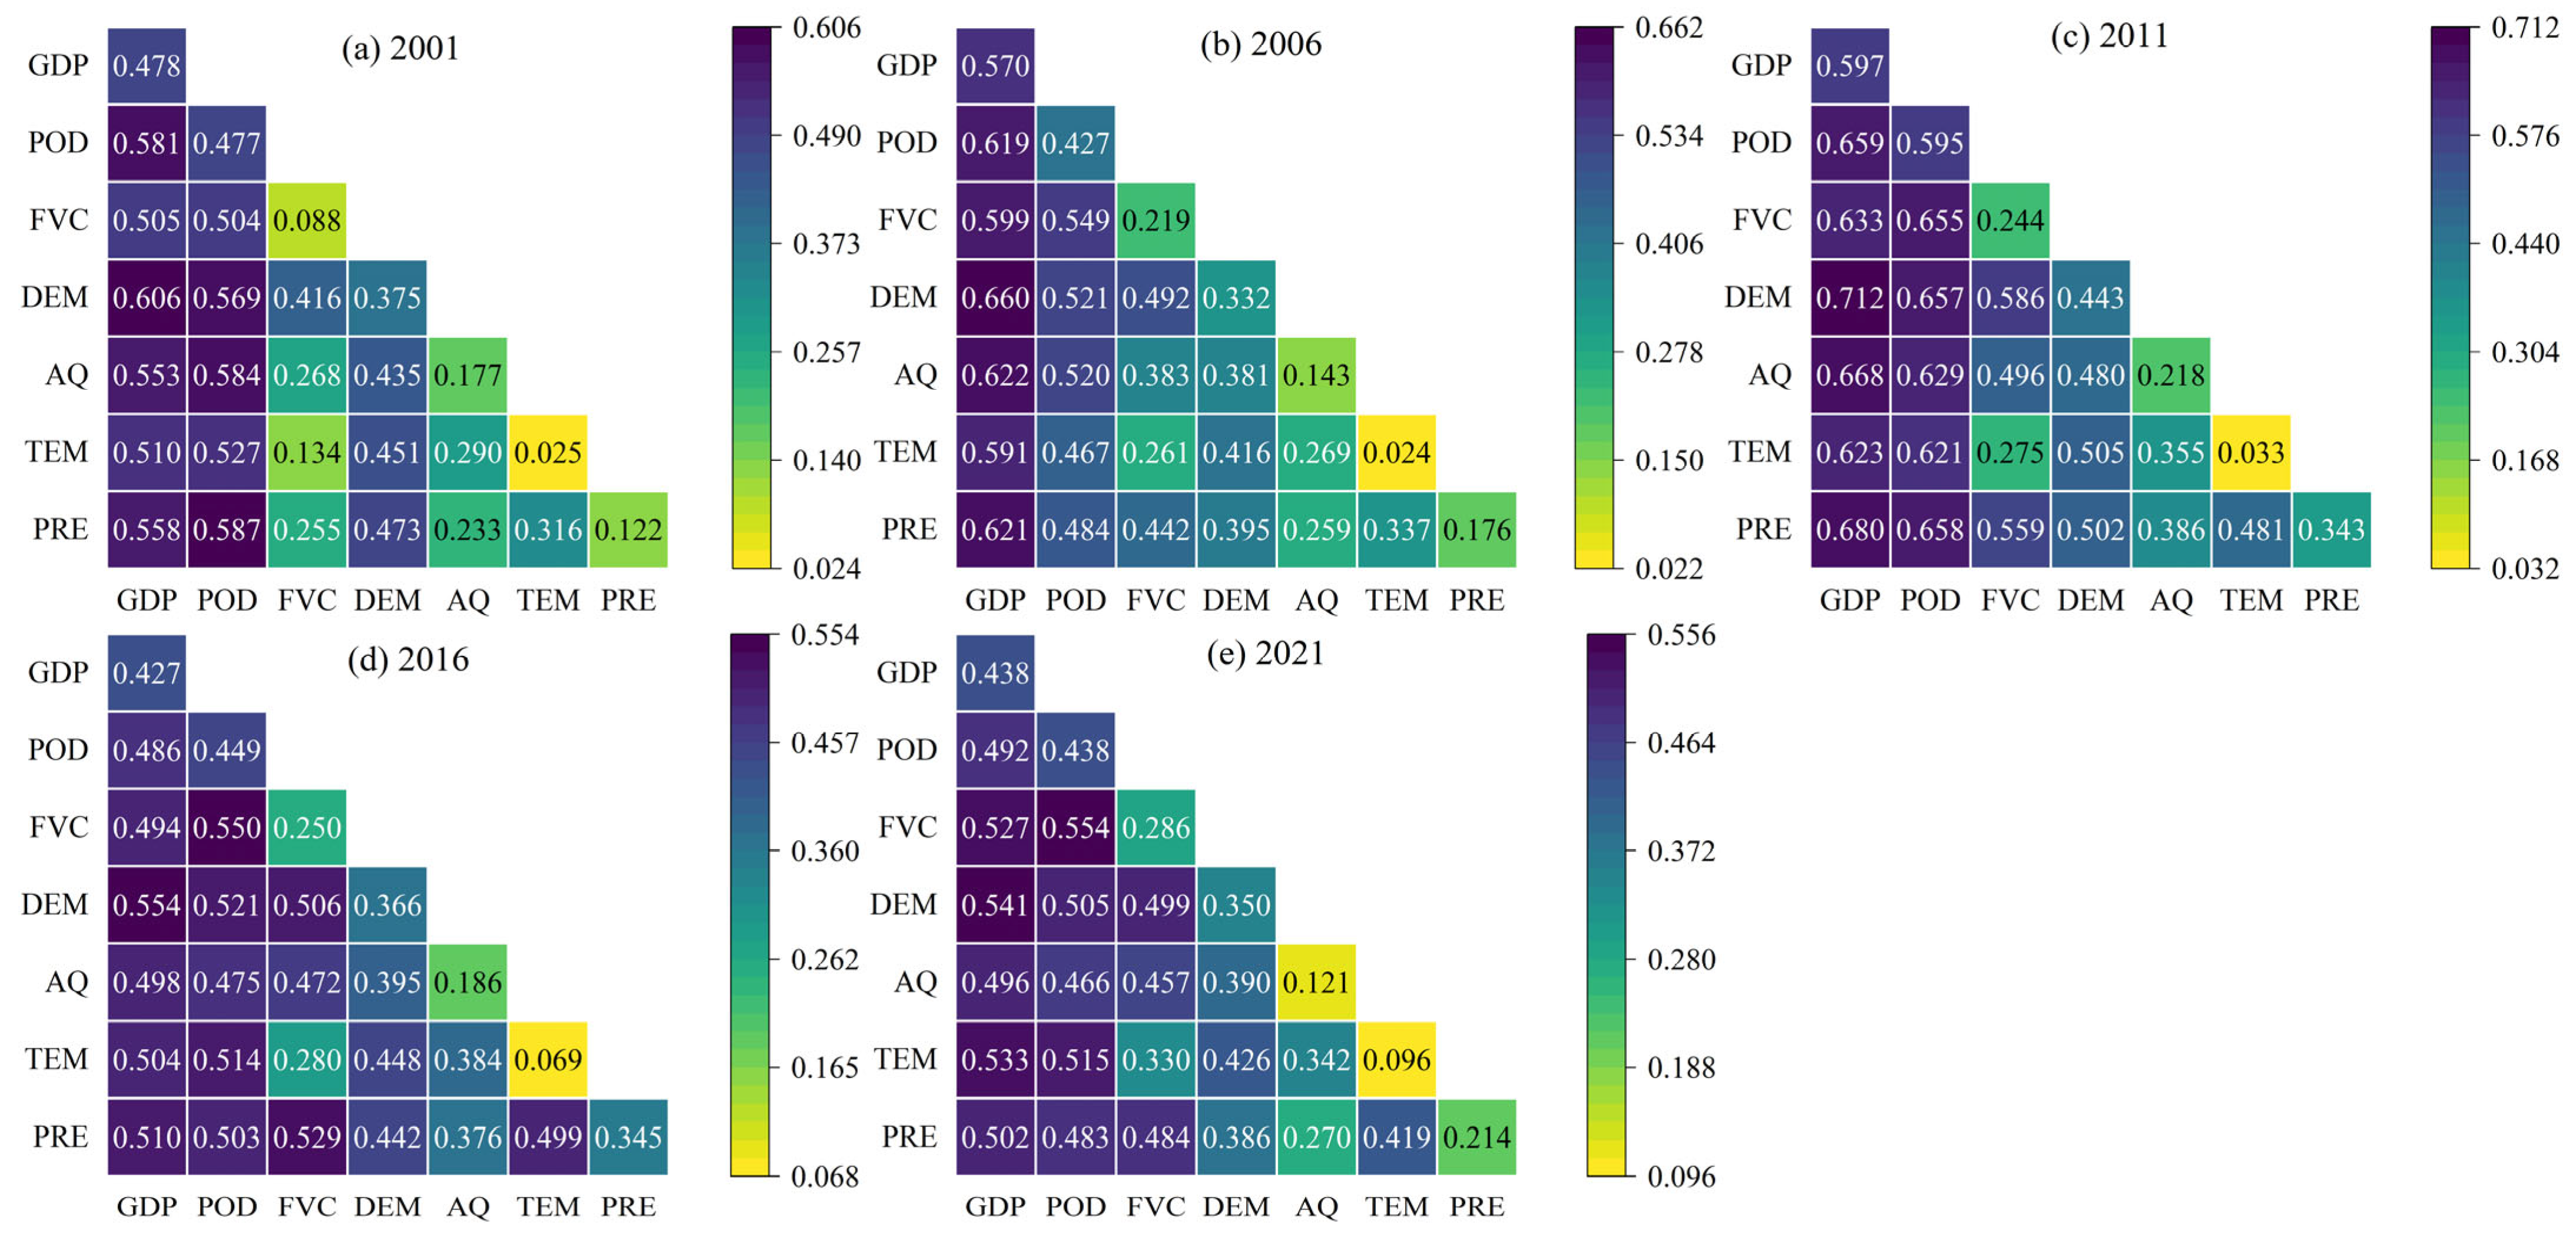
3.3.3. Factors Affecting the CCD Based on Geodetector
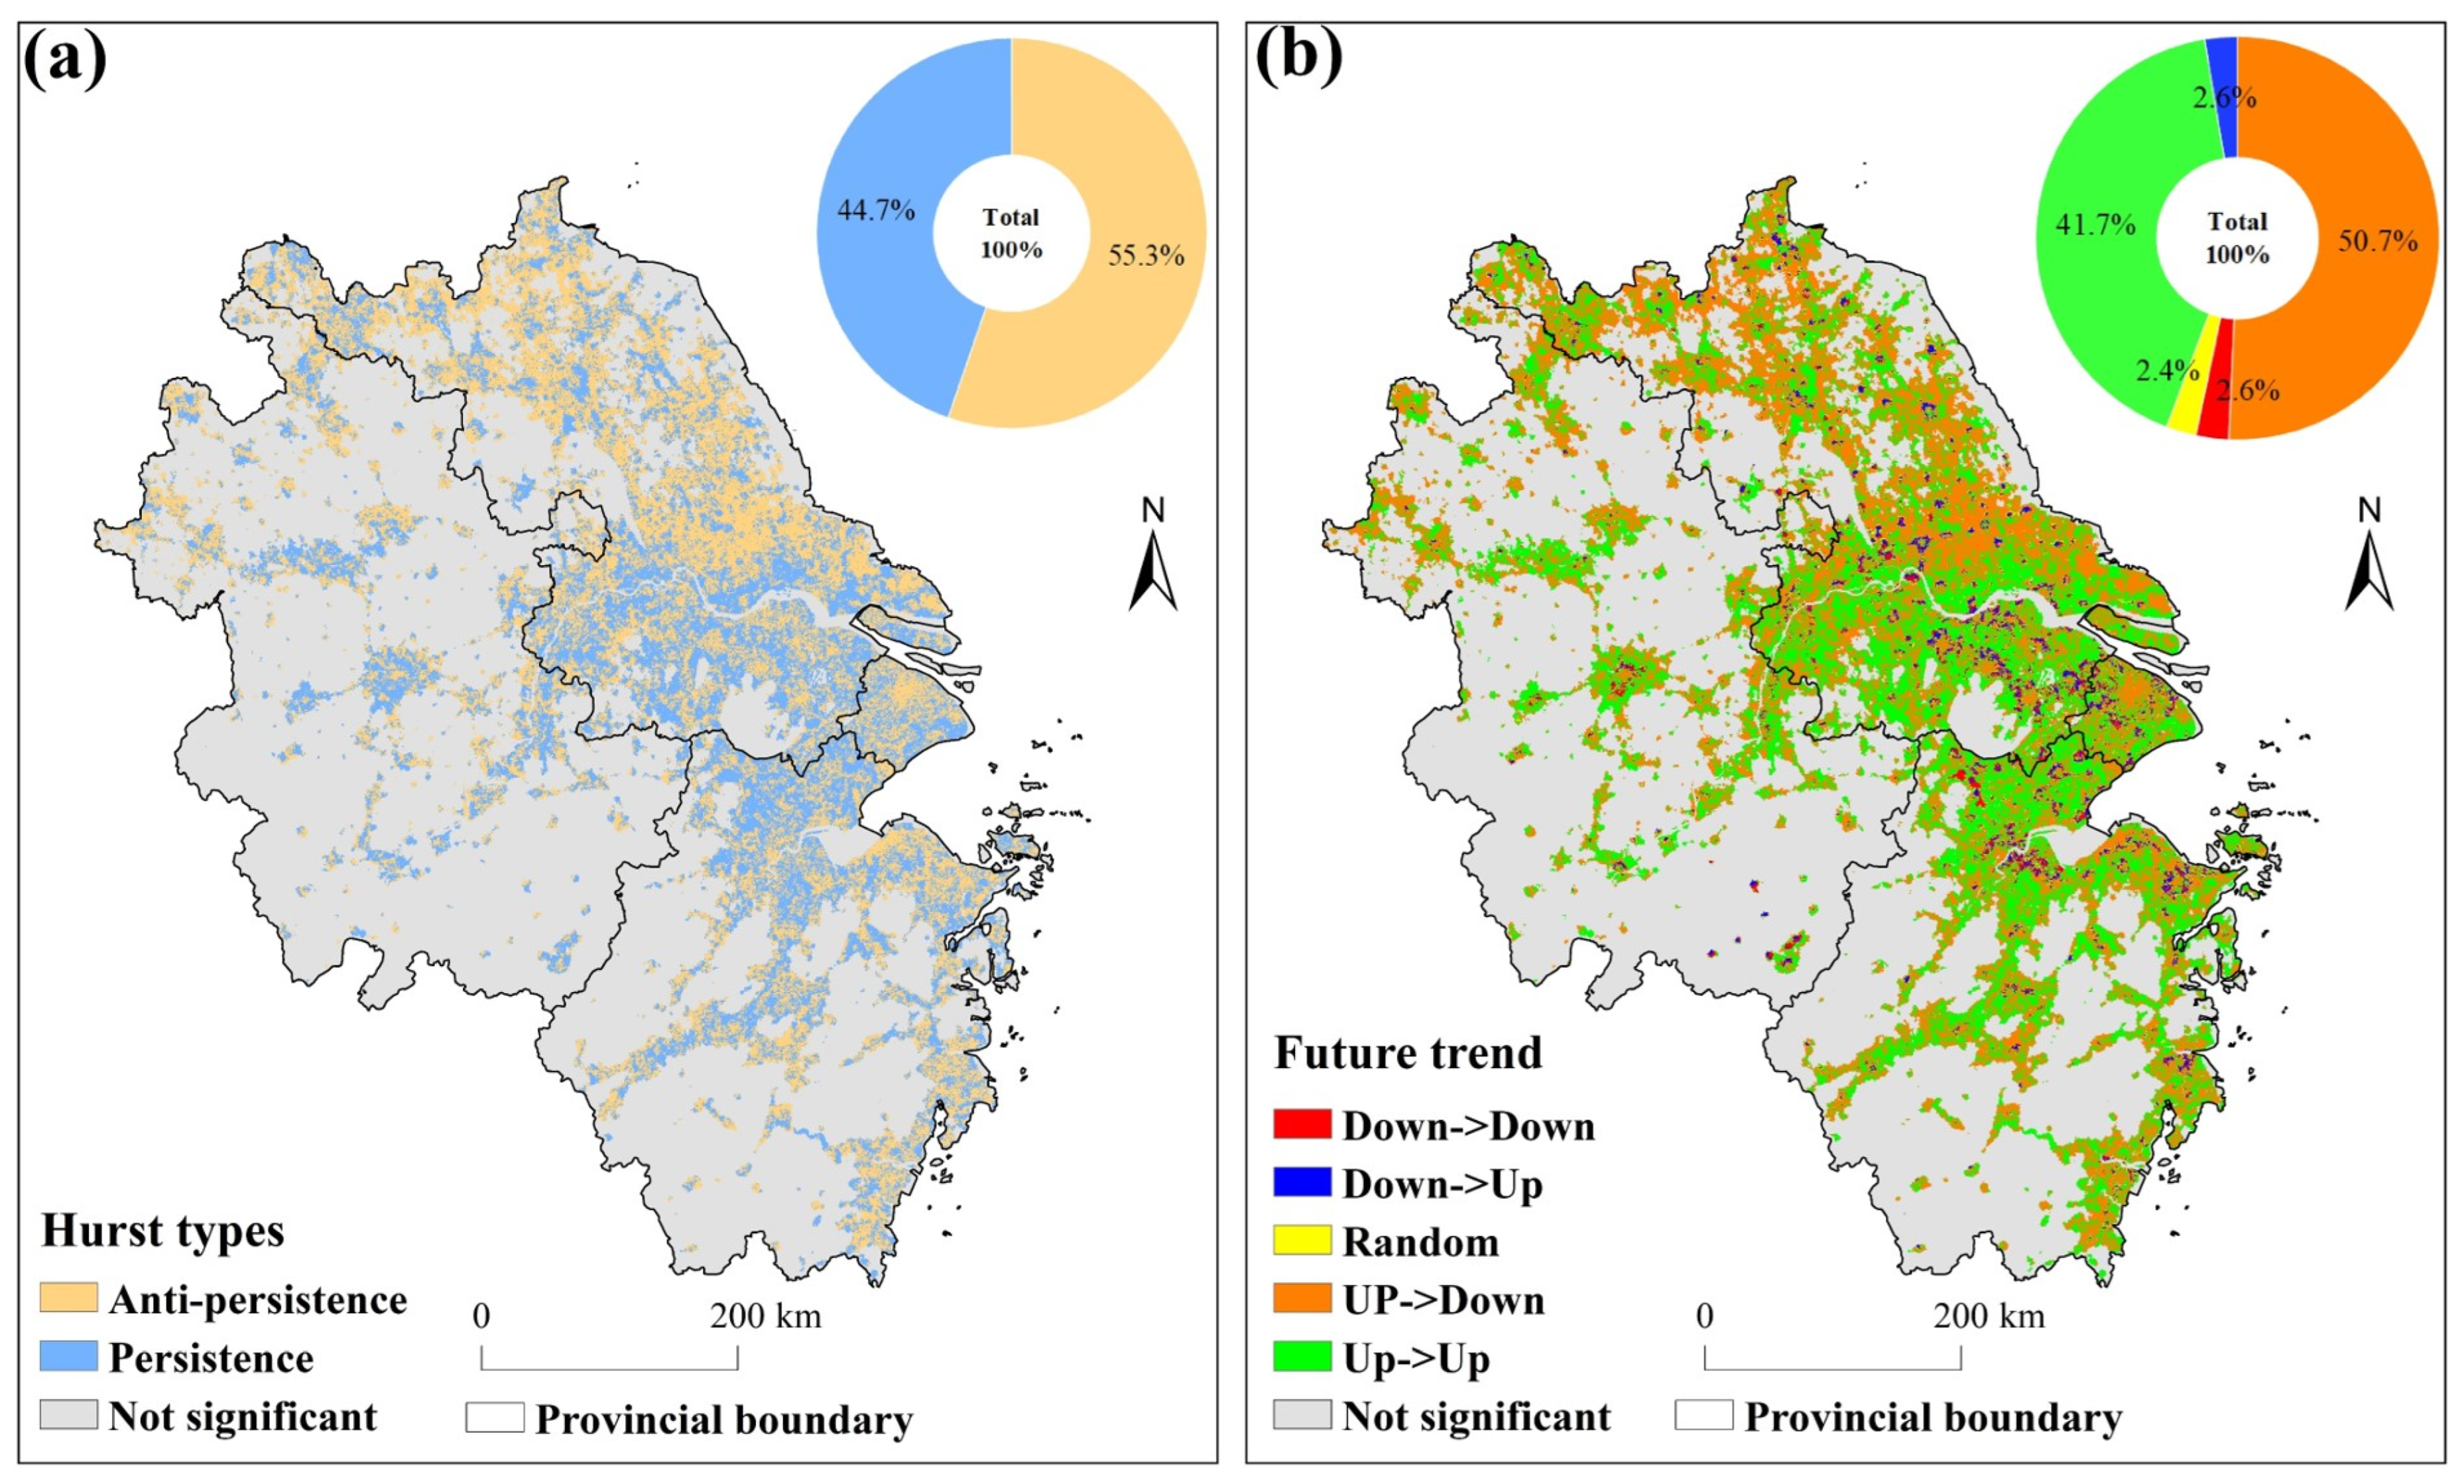
3.3.4. Prediction of Future CCD
4. Discussion
4.1. Exploring the Relationship among the MRSEI, CNLI, and CCD
4.2. Analysis of the Factors Influencing the CCD
4.3. Suggestions
4.4. Limitations and Prospects
5. Conclusions
- (1)
- During the study period, the MRSEI fluctuations within the YRDUA were relatively minor, indicating a stable ecological environment, yet regional disparities were pronounced. Cities with high MRSEI values were predominantly located in the southwestern part of the YRDUA, while cities with low MRSEI values were mainly situated around Shanghai and within Jiangsu Province. Areas experiencing ecological degradation were primarily concentrated in cities with higher CNLI change rates, whereas regions showing ecological improvement were mostly found in cities with lower CNLI change rates;
- (2)
- All cities progressed towards greater coordination, and in the end, cities with severe imbalances had virtually disappeared, with the majority reaching at least a basic level of coordination. Cities with high (low) CCD values exhibit spatial clustering, indicating significant regional imbalances in development. Given the diverse urban development trajectories in the YRDUA, urban and ecological planning should be tailored to the specific conditions and challenges of each city to promote balanced development and improve the region’s overall sustainability and quality of life;
- (3)
- In the single-factor analysis, GDP and POD had the highest explanatory power for the CCD, indicating that socioeconomic factors more substantially influence CCD than natural factors do. Under interaction, the combined effect of GDP and DEM further amplified the explanatory power, making it the most influential interaction for understanding CCD dynamics;
- (4)
- The CCD was found to be positively correlated with the CNLI and negatively correlated with the MRSEI. Urbanization is a critical factor in enhancing the CCD, thus optimizing urban spatial layout and forms, particularly within urban agglomerations and metropolitan areas, is crucial for fostering coordinated development among cities and towns of various sizes, thereby ensuring sustainable urbanization. The MRSEI and CNLI were negatively correlated, indicating that urban expansion inevitably damages the ecological environment. Therefore, during urban development, it is vital to prioritize ecological preservation and green development, focusing on ecosystem restoration and protection.
Author Contributions
Funding
Institutional Review Board Statement
Informed Consent Statement
Data Availability Statement
Acknowledgments
Conflicts of Interest
References
- Zhang, X.; Song, W.; Wang, J.; Wen, B.; Yang, D.; Jiang, S.; Wu, Y. Analysis on Decoupling between Urbanization Level and Urbanization Quality in China. Sustainability 2020, 12, 6835. [Google Scholar] [CrossRef]
- Bureau of Statistics Website Statistical Bulletin on National Economic and Social Development of the People’s Republic of China in 2021 [EB/OL]. Available online: https://www.gov.cn/xinwen/2022-02/28/content_5676015.htm (accessed on 10 June 2024).
- Xu, D.; Cheng, J.; Xu, S.; Geng, J.; Yang, F.; Fang, H.; Xu, J.; Wang, S.; Wang, Y.; Huang, J.; et al. Understanding the Relationship between China’s Eco-Environmental Quality and Urbanization Using Multisource Remote Sensing Data. Remote Sens. 2022, 14, 198. [Google Scholar] [CrossRef]
- Jiang, Q.; Bei, N.; Wu, J.; Li, X.; Wang, R.; Yu, J.; Lu, Y.; Tie, X.; Li, G. Impacts of Urban Expansion on Meteorology and Air Quality in North China Plain during Wintertime: A Case Study. Urban Clim. 2023, 52, 101696. [Google Scholar] [CrossRef]
- Zhao, F.-J.; Ma, Y.; Zhu, Y.-G.; Tang, Z.; McGrath, S.P. Soil Contamination in China: Current Status and Mitigation Strategies. Environ. Sci. Technol. 2015, 49, 750–759. [Google Scholar] [CrossRef] [PubMed]
- Peng, J.; Pan, Y.; Liu, Y.; Zhao, H.; Wang, Y. Linking Ecological Degradation Risk to Identify Ecological Security Patterns in a Rapidly Urbanizing Landscape. Habitat Int. 2018, 71, 110–124. [Google Scholar] [CrossRef]
- Chen, Y.; Xu, Y.; Zhou, K. The Spatial Stress of Urban Land Expansion on the Water Environment of the Yangtze River Delta in China. Sci. Rep. 2022, 12, 17011. [Google Scholar] [CrossRef]
- Zhang, Q.; Kong, Q.; Zhang, M.; Huang, H. New-Type Urbanization and Ecological Well-Being Performance: A Coupling Coordination Analysis in the Middle Reaches of the Yangtze River Urban Agglomerations, China. Ecol. Indic. 2024, 159, 111678. [Google Scholar] [CrossRef]
- Han, X.; Fu, L.; Lv, C.; Peng, J. Measurement and Spatio-Temporal Heterogeneity Analysis of the Coupling Coordinated Development among the Digital Economy, Technological Innovation and Ecological Environment. Ecol. Indic. 2023, 151, 110325. [Google Scholar] [CrossRef]
- Zhang, Y.; Zhu, T.; Guo, H.; Yang, X. Analysis of the Coupling Coordination Degree of the Society-Economy-Resource-Environment System in Urban Areas: Case Study of the Jingjinji Urban Agglomeration, China. Ecol. Indic. 2023, 146, 109851. [Google Scholar] [CrossRef]
- Li, Y.; Sang, S.; Mote, S.; Rivas, J.; Kalnay, E. Challenges and Opportunities for Modeling Coupled Human and Natural Systems. Natl. Sci. Rev. 2023, 10, nwad054. [Google Scholar] [CrossRef]
- Yin, J.; Dong, J.; Hamm, N.A.S.; Li, Z.; Wang, J.; Xing, H.; Fu, P. Integrating Remote Sensing and Geospatial Big Data for Urban Land Use Mapping: A Review. Int. J. Appl. Earth Obs. Geoinf. 2021, 103, 102514. [Google Scholar] [CrossRef]
- Bagyaraj, M.; Senapathi, V.; Karthikeyan, S.; Chung, S.Y.; Khatibi, R.; Nadiri, A.A.; Asgari Lajayer, B. A Study of Urban Heat Island Effects Using Remote Sensing and GIS Techniques in Kancheepuram, Tamil Nadu, India. Urban Clim. 2023, 51, 101597. [Google Scholar] [CrossRef]
- Gillespie, T.W.; Ostermann-Kelm, S.; Dong, C.; Willis, K.S.; Okin, G.S.; MacDonald, G.M. Monitoring Changes of NDVI in Protected Areas of Southern California. Ecol. Indic. 2018, 88, 485–494. [Google Scholar] [CrossRef]
- Wang, W.; Liu, K.; Tang, R.; Wang, S. Remote Sensing Image-Based Analysis of the Urban Heat Island Effect in Shenzhen, China. Phys. Chem. Earth Parts A/B/C 2019, 110, 168–175. [Google Scholar] [CrossRef]
- Wicaksono, A.; Wicaksono, P. Geometric Accuracy Assessment for Shoreline Derived from NDWI, MNDWI, and AWEI Transformation on Various Coastal Physical Typology in Jepara Regency Using Landsat 8 OLI Imagery in 2018. Geoplanning J. Geomat. Plan. 2019, 6, 55. [Google Scholar] [CrossRef]
- Xu, H.Q. A Remote Sensing Urban Ecological Index and Its Application. Acta Ecol. Sin. 2013, 33, 7853–7862. [Google Scholar]
- Zheng, Z.; Wu, Z.; Chen, Y.; Yang, Z.; Marinello, F. Exploration of Eco-Environment and Urbanization Changes in Coastal Zones: A Case Study in China over the Past 20 Years. Ecol. Indic. 2020, 119, 106847. [Google Scholar] [CrossRef]
- Liu, Y.; Zhou, T.; Yu, W. Analysis of Changes in Ecological Environment Quality and Influencing Factors in Chongqing Based on a Remote-Sensing Ecological Index Mode. Land 2024, 13, 227. [Google Scholar] [CrossRef]
- Song, W.; Gu, H.-H.; Song, W.; Li, F.-P.; Cheng, S.-P.; Zhang, Y.-X.; Ai, Y.-J. Environmental Assessments in Dense Mining Areas Using Remote Sensing Information over Qian’an and Qianxi Regions China. Ecol. Indic. 2023, 146, 109814. [Google Scholar] [CrossRef]
- Zhang, X.; Fan, H.; Sun, L.; Liu, W.; Wang, C.; Wu, Z.; Lv, T. Identifying Regional Eco-Environment Quality and Its Influencing Factors: A Case Study of an Ecological Civilization Pilot Zone in China. J. Clean. Prod. 2024, 435, 140308. [Google Scholar] [CrossRef]
- Xiao, H.; Ma, Z.; Mi, Z.; Kelsey, J.; Zheng, J.; Yin, W.; Yan, M. Spatio-Temporal Simulation of Energy Consumption in China’s Provinces Based on Satellite Night-Time Light Data. Appl. Energy 2018, 231, 1070–1078. [Google Scholar] [CrossRef]
- Ding, Y.; Hu, J.; Yang, Y.; Ma, W.; Jiang, S.; Pan, X.; Zhang, Y.; Zhu, J.; Cao, K. Monitoring the Distribution and Variations of City Size Based on Night-Time Light Remote Sensing: A Case Study in the Yangtze River Delta of China. Remote Sens. 2022, 14, 3403. [Google Scholar] [CrossRef]
- Kumar, P.; Sajjad, H.; Joshi, P.K.; Elvidge, C.D.; Rehman, S.; Chaudhary, B.S.; Tripathy, B.R.; Singh, J.; Pipal, G. Modeling the Luminous Intensity of Beijing, China Using DMSP-OLS Night-Time Lights Series Data for Estimating Population Density. Phys. Chem. Earth Parts A/B/C 2019, 109, 31–39. [Google Scholar] [CrossRef]
- Xin, X.; Liu, B.; Di, K.; Zhu, Z.; Zhao, Z.; Liu, J.; Yue, Z.; Zhang, G. Monitoring Urban Expansion Using Time Series of Night-Time Light Data: A Case Study in Wuhan, China. Int. J. Remote Sens. 2017, 38, 6110–6128. [Google Scholar] [CrossRef]
- Chen, J.; Wei, H.; Li, N.; Chen, S.; Qu, W.; Zhang, Y. Exploring the Spatial-Temporal Dynamics of the Yangtze River Delta Urban Agglomeration Based on Night-Time Light Remote Sensing Technology. IEEE J. Sel. Top. Appl. Earth Obs. Remote Sens. 2020, 13, 5369–5383. [Google Scholar] [CrossRef]
- Bennett, M.M.; Smith, L.C. Advances in Using Multitemporal Night-Time Lights Satellite Imagery to Detect, Estimate, and Monitor Socioeconomic Dynamics. Remote Sens. Environ. 2017, 192, 176–197. [Google Scholar] [CrossRef]
- Zhao, F.; Ding, J.; Zhang, S.; Luan, G.; Song, L.; Peng, Z.; Du, Q.; Xie, Z. Estimating Rural Electric Power Consumption Using NPP-VIIRS Night-Time Light, Toponym and POI Data in Ethnic Minority Areas of China. Remote Sens. 2020, 12, 2836. [Google Scholar] [CrossRef]
- Li, Y.; Chen, Y.; Cai, Q.; Zhu, L. Calculation of CO2 Emissions from China at Regional Scales Using Remote Sensing Data. Remote Sens. 2024, 16, 544. [Google Scholar] [CrossRef]
- Xiao, Y.; Zhong, J.-L.; Zhang, Q.-F.; Xiang, X.; Huang, H. Exploring the Coupling Coordination and Key Factors between Urbanization and Land Use Efficiency in Ecologically Sensitive Areas: A Case Study of the Loess Plateau, China. Sustain. Cities Soc. 2022, 86, 104148. [Google Scholar] [CrossRef]
- Sun, J.; Hu, Y.; Li, Y.; Weng, L.; Bai, H.; Meng, F.; Wang, T.; Du, H.; Xu, D.; Lu, S. A Temporospatial Assessment of Environmental Quality in Urbanizing Ethiopia. J. Environ. Manag. 2023, 332, 117431. [Google Scholar] [CrossRef]
- Huang, Z.; Chen, Y.; Zheng, Z.; Wu, Z. Spatiotemporal Coupling Analysis between Human Footprint and Ecosystem Service Value in the Highly Urbanized Pearl River Delta Urban Agglomeration, China. Ecol. Indic. 2023, 148, 110033. [Google Scholar] [CrossRef]
- Han, X.; He, X.; Xiong, W.; Shi, W. Effects of Urbanization on CO2 Emissions, Water Use and the Carbon-Water Coupling in a Typical Dual-Core Urban Agglomeration in China. Urban Clim. 2023, 49, 101572. [Google Scholar] [CrossRef]
- Ren, F.; Yu, X. Coupling Analysis of Urbanization and Ecological Total Factor Energy Efficiency—A Case Study from Hebei Province in China. Sustain. Cities Soc. 2021, 74, 103183. [Google Scholar] [CrossRef]
- Fang, C.; Wang, S.; Li, G. Changing Urban Forms and Carbon Dioxide Emissions in China: A Case Study of 30 Provincial Capital Cities. Appl. Energy 2015, 158, 519–531. [Google Scholar] [CrossRef]
- Song, Q.; Zhou, N.; Liu, T.; Siehr, S.A.; Qi, Y. Investigation of a “Coupling Model” of Coordination between Low-Carbon Development and Urbanization in China. Energ. Policy 2018, 121, 346–354. [Google Scholar] [CrossRef]
- Beloin-Saint-Pierre, D.; Rugani, B.; Lasvaux, S.; Mailhac, A.; Popovici, E.; Sibiude, G.; Benetto, E.; Schiopu, N. A Review of Urban Metabolism Studies to Identify Key Methodological Choices for Future Harmonization and Implementation. J. Clean. Prod. 2017, 163, S223–S240. [Google Scholar] [CrossRef]
- Fanning, A.L.; O’Neill, D.W.; Büchs, M. Provisioning Systems for a Good Life within Planetary Boundaries. Glob. Environ. Chang. 2020, 64, 102135. [Google Scholar] [CrossRef]
- Wang, S.; Kong, W.; Ren, L.; Zhi, D.; Dai, B. Research on misuses and modification of coupling coordination degree model in China. J. Nat. Resour. 2021, 36, 793. [Google Scholar] [CrossRef]
- Wu, J.; Sun, W. Regional Integration and Sustainable Development in the Yangtze River Delta, China: Towards a Conceptual Framework and Research Agenda. Land 2023, 12, 470. [Google Scholar] [CrossRef]
- Guo, Y.; Zhao, S.; Zhao, X.; Wang, H.; Shi, W. Evaluation of the Spatiotemporal Change of Ecological Quality under the Context of Urban Expansion—A Case Study of Typical Urban Agglomerations in China. Remote Sens. 2023, 16, 45. [Google Scholar] [CrossRef]
- Shanghai Municipal Statistics Bureau. National Economic and Social Development Statistics Bulletin of Shanghai. 2021. Available online: https://tjj.sh.gov.cn/tjgb/20220314/e0dcefec098c47a8b345c996081b5c94.html (accessed on 6 June 2024).
- Statistical Bureau of Jiangsu Province. National Economic and Social Development Statistics Bulletin of Jiangsu Province. 2021. Available online: https://tj.jiangsu.gov.cn/art/2022/3/3/art_85764_10520810.html (accessed on 6 June 2024).
- Statistical Bureau of Zhejiang Province. National Economic and Social Development Statistics Bulletin of Zhejiang Province. 2021. Available online: https://tjj.zj.gov.cn/art/2022/2/24/art_1229129205_4883213.html (accessed on 6 June 2024).
- Statistical Bureau of Anhui Province. National Economic and Social Development Statistics Bulletin of Anhui Province. 2021. Available online: http://tjj.ah.gov.cn/ssah/qwfbjd/tjgb/sjtjgb/146518001.html (accessed on 6 June 2024).
- Xu, H. A Study on Information Extraction of Water Body with the Modified Normalized Difference Water Index (MNDWI). J. Remote Sens. 2005, 9, 595. [Google Scholar]
- Li, X.; Zhou, Y.; Zhao, M.; Zhao, X. A Harmonized Global Nighttime Light Dataset 1992–2018. Sci. Data 2020, 7, 168. [Google Scholar] [CrossRef] [PubMed]
- Gao, J.; Shi, Y.; Zhang, H.; Chen, X.; Zhang, W.; Shen, W.; Xiao, T.; Zhang, Y. China Regional 250m Fractional Vegetation Cover Data Set (2000–2023); National Tibetan Plateau Data Center: Beijing, China, 2024. [Google Scholar]
- Wei, J.; Li, Z.; Cribb, M.; Huang, W.; Xue, W.; Sun, L.; Guo, J.; Peng, Y.; Li, J.; Lyapustin, A.; et al. Improved 1 Km Resolution PM2.5 Estimates across China Using Enhanced Space-Time Extremely Randomized Trees. Atmos. Chem. Phys. 2020, 20, 3273–3289. [Google Scholar] [CrossRef]
- Kaššaj, M.; Peráček, T. Synergies and Potential of Industry 4.0 and Automated Vehicles in Smart City Infrastructure. Appl. Sci. 2024, 14, 3575. [Google Scholar] [CrossRef]
- Almuqrin, A.; Mutambik, I.; Alomran, A.; Zhang, J.Z. Information System Success for Organizational Sustainability: Exploring the Public Institutions in Saudi Arabia. Sustainability 2023, 15, 9233. [Google Scholar] [CrossRef]
- Wu, Y.J.; Zhao, X.; Xi, Y.; Liu, H.; Li, C. Comprehensive Evaluation and Spatial-Temporal Changes of Eco-Environmental Quality Based on MODIS in Tibet during 2006–2016. Acta Geogr. Sin. 2019, 74, 1438–1449. (In Chinese) [Google Scholar]
- Guo, T.; Yu, H.B.; Ma, Z.C.; Cao, C.M. Analysis of Spatial and Temporal Variations of Soil Moisture Content and Drought Degree Based on MODIS. Res. Soil Water Conserv. 2019, 26, 185–189. (In Chinese) [Google Scholar]
- Peng, L.; Wu, H.; Li, Z. Spatial–Temporal Evolutions of Ecological Environment Quality and Ecological Resilience Pattern in the Middle and Lower Reaches of the Yangtze River Economic Belt. Remote Sens. 2023, 15, 430. [Google Scholar] [CrossRef]
- Chen, J.; Zhuo, L.; Shi, P.-J.; Toshiaki, I. The Study on Urbanization Process in China Based on DMSP/OLS Data: Development of a Light Index for Urbanization Level Estimation. J. Remote Sens. 2003, 7, 168–175. (In Chinese) [Google Scholar]
- Geng, S.; Zhang, H.; Xie, F.; Li, L.; Yang, L. Vegetation Dynamics under Rapid Urbanization in the Guangdong–Hong Kong–Macao Greater Bay Area Urban Agglomeration during the Past Two Decades. Remote Sens. 2022, 14, 3993. [Google Scholar] [CrossRef]
- Yang, H.; Yu, J.; Xu, W.; Wu, Y.; Lei, X.; Ye, J.; Geng, J.; Ding, Z. Long-Time Series Ecological Environment Quality Monitoring and Cause Analysis in the Dianchi Lake Basin, China. Ecol. Indic. 2023, 148, 110084. [Google Scholar] [CrossRef]
- Sawut, R.; Li, Y.; Kasimu, A.; Ablat, X. Examining the Spatially Varying Effects of Climatic and Environmental Pollution Factors on the NDVI Based on Their Spatially Heterogeneous Relationships in Bohai Rim, China. J. Hydrol. 2023, 617, 128815. [Google Scholar] [CrossRef]
- Li, W.; An, M.; Wu, H.; An, H.; Huang, J.; Khanal, R. The Local Coupling and Telecoupling of Urbanization and Ecological Environment Quality Based on Multisource Remote Sensing Data. J. Environ. Manag. 2023, 327, 116921. [Google Scholar] [CrossRef] [PubMed]
- Dong, S.; Wang, X.-C.; Dong, X.; Kong, F. Unsustainable Imbalances in Urbanization and Ecological Quality in the Old Industrial Base Province of China. Ecol. Indic. 2024, 158, 111441. [Google Scholar] [CrossRef]
- Jiang, T.H.; Deng, L.T. Some Problems in Estimating a Hurst Exponent—A Case Study of Applicatings to Climatic Change. Sci. Geogr. Sin. 2004, 24, 177–182. (In Chinese) [Google Scholar]
- Li, W.; Wang, Y.; Xie, S.; Cheng, X. Coupling Coordination Analysis and Spatiotemporal Heterogeneity between Urbanization and Ecosystem Health in Chongqing Municipality, China. Sci. Total Environ. 2021, 791, 148311. [Google Scholar] [CrossRef]
- Zou, C.; Zhu, J.; Lou, K.; Yang, L. Coupling Coordination and Spatiotemporal Heterogeneity between Urbanization and Ecological Environment in Shaanxi Province, China. Ecol. Indic. 2022, 141, 109152. [Google Scholar] [CrossRef]
- Hu, H.; Lv, T.; Zhang, X.; Xie, H.; Fu, S.; Wang, L. Spatiotemporal Coupling of Multidimensional Urbanization and Resource–Environment Performance in the Yangtze River Delta Urban Agglomeration of China. Phys. Chem. Earth Parts A/B/C 2023, 129, 103360. [Google Scholar] [CrossRef]
- Wang, J.F.; Xu, C.D. Geodetector: Principle and Prospective. Acta Geogr. Sin. 2017, 72, 116–134. [Google Scholar]
- Liu, H.; Zhou, L.; Tang, D. Exploring the Impact of Urbanization on Ecological Quality in the Middle Reaches of the Yangtze River Urban Agglomerations, China. Hum. Ecol. Risk Assess. Int. J. 2023, 29, 1276–1298. [Google Scholar] [CrossRef]
- Zhang, X.; Fan, H.; Liu, F.; Lv, T.; Sun, L.; Li, Z.; Shang, W.; Xu, G. Coupling Coordination between the Ecological Environment and Urbanization in the Middle Reaches of the Yangtze River Urban Agglomeration. Urban Clim. 2023, 52, 101698. [Google Scholar] [CrossRef]
- Lei, X.; Liu, H.; Li, S.; Luo, Q.; Cheng, S.; Hu, G.; Wang, X.; Bai, W. Coupling Coordination Analysis of Urbanization and Ecological Environment in Chengdu-Chongqing Urban Agglomeration. Ecol. Indic. 2024, 161, 111969. [Google Scholar] [CrossRef]
- Bai, T.; Cheng, J.; Zheng, Z.; Zhang, Q.; Li, Z.; Xu, D. Drivers of Eco-Environmental Quality in China from 2000 to 2017. J. Clean. Prod. 2023, 396, 136408. [Google Scholar] [CrossRef]
- Liu, R.; Dong, X.; Wang, X.; Zhang, P.; Liu, M.; Zhang, Y. Relationship and Driving Factors between Urbanization and Natural Ecosystem Health in China. Ecol. Indic. 2023, 147, 109972. [Google Scholar] [CrossRef]
- Xu, D.; Yang, F.; Yu, L.; Zhou, Y.; Li, H.; Ma, J.; Huang, J.; Wei, J.; Xu, Y.; Zhang, C.; et al. Quantization of the Coupling Mechanism between Eco-Environmental Quality and Urbanization from Multisource Remote Sensing Data. J. Clean. Prod. 2021, 321, 128948. [Google Scholar] [CrossRef]
- Guo, L.; Li, P.; Zhang, J.; Xiao, X.; Peng, H. Do Socio-Economic Factors Matter? A Comprehensive Evaluation of Tourism Eco-Efficiency Determinants in China Based on the Geographical Detector Model. J. Environ. Manag. 2022, 320, 115812. [Google Scholar] [CrossRef]
- Liu, Q.P.; Tian, H.Z.; Yang, Y.C. Quantitative Study of the Relationship Between the Distribution of Cities and the Natural Environment Based on GIS and RS in China. Sci. Geogr. Sin. 2012, 32, 686–693. (In Chinese) [Google Scholar]
- Wang, X.; Zhang, S.; Zhao, X.; Shi, S.; Xu, L. Exploring the Relationship between the Eco-Environmental Quality and Urbanization by Utilizing Sentinel and Landsat Data: A Case Study of the Yellow River Basin. Remote Sens. 2023, 15, 743. [Google Scholar] [CrossRef]


| Theme | Sen | Z | Trend |
|---|---|---|---|
| 1 | ≥0.0005 | >1.96 | Significant improvement |
| 2 | ≥0.0005 | −1.96–1.96 | Slight improvement |
| 3 | −0.0005–0.0005 | −1.96–1.96 | Stable |
| 4 | ≤0.0005 | −1.96–1.96 | Slight degradation |
| 5 | ≤0.0005 | <1.96 | Serious degradation |
| CCD Value | Levels | Degree of Coordination |
|---|---|---|
| 0 < CCD ≤ 0.3 | I | Seriously unbalanced |
| 0.3 < CCD ≤ 0.4 | II | Moderately unbalanced |
| 0.4 < CCD ≤ 0.5 | III | Basically balanced |
| 0.5 < CCD ≤ 0.6 | IV | Moderately balanced |
| 0.6 < CCD ≤ 1 | V | Highly balanced |
| Interaction Criterion | Interaction Type |
|---|---|
| Independent | |
| Nonlinear enhancement | |
| Two-factor enhancement | |
| Nonlinear weakening | |
| Single-factor nonlinear weakening |
| Ranking | City | Sen | Line | Slope | Ranking | City | Sen | Line | Slope |
|---|---|---|---|---|---|---|---|---|---|
| 1 | Bozhou | 0.00563 | 0.00552 | 0.00557 | 22 | Hangzhou | 0.00046 | 0.00034 | 0.00040 |
| 2 | Huaibei | 0.00561 | 0.00524 | 0.00542 | 23 | Shanghai | 0.00042 * | 0.00010 | 0.00026 |
| 3 | Huainan | 0.00439 ** | 0.00469 | 0.00454 | 24 | Ma’anshan | −0.00012 * | −0.00023 | −0.00018 |
| 4 | Bengbu | 0.00435 | 0.00462 | 0.00449 | 25 | Xuzhou | −0.00039 | −0.00025 | −0.00032 |
| 5 | Chuzhou | 0.00438 ** | 0.00435 | 0.00436 | 26 | Suqian | −0.00040 | −0.00039 | −0.00040 |
| 6 | Suzhou(ah) | 0.00291 | 0.00289 | 0.00290 | 27 | Wuhu | −0.00057 * | −0.00082 | −0.00070 |
| 7 | Fuyang | 0.00215 | 0.00253 | 0.00234 | 28 | Huai’an | −0.00080 | −0.00098 | −0.00089 |
| 8 | Quzhou | 0.00227 * | 0.00226 | 0.00227 | 29 | Ningbo | −0.00117 | −0.00126 | −0.00122 |
| 9 | Lishui | 0.00192 | 0.00192 | 0.00192 | 30 | Nanjing | −0.00111 * | −0.00133 | −0.00122 |
| 10 | Lu’an | 0.00183 | 0.00201 | 0.00192 | 31 | Wuxi | −0.00175 * | −0.00210 | −0.00192 |
| 11 | Jinhua | 0.00187 | 0.00188 | 0.00187 | 32 | Huzhou | −0.00197 | −0.00205 | −0.00201 |
| 12 | Wenzhou | 0.00175 | 0.00170 | 0.00173 | 33 | Zhenjiang | −0.00264 * | −0.00277 | −0.00271 |
| 13 | Hefei | 0.00168 * | 0.00163 | 0.00165 | 34 | Changzhou | −0.00264 * | −0.00284 | −0.00274 |
| 14 | Chizhou | 0.00126 | 0.00111 | 0.00118 | 35 | Yancheng | −0.00302 | −0.00328 | −0.00315 |
| 15 | Huangshan | 0.00112 | 0.00109 | 0.00110 | 36 | Suzhou(js) | −0.00331 * | −0.00372 | −0.00352 |
| 16 | Anqing | 0.00108 | 0.00096 | 0.00102 | 37 | Lianyungang | −0.00361 | −0.00362 | −0.00361 |
| 17 | Xuancheng | 0.00111 | 0.00087 | 0.00099 | 38 | Yangzhou | −0.00443 * | −0.00460 | −0.00451 |
| 18 | Taizhou(zj) | 0.00089 * | 0.00089 | 0.00089 | 39 | Jiaxing | −0.00479 | −0.00492 | −0.00485 |
| 19 | Tongling | 0.00089 * | 0.00075 | 0.00082 | 40 | Nantong | −0.00497 ** | −0.00492 | −0.00495 |
| 20 | Shaoxing | 0.00082 | 0.00074 | 0.00078 | 41 | Taizhou(js) | −0.00591 ** | −0.00588 | −0.00589 |
| 21 | Zhoushan | 0.00074 | 0.00075 | 0.00074 |
| Ranking | City | Sen | Line | Slope | Ranking | City | Sen | Line | Slope |
|---|---|---|---|---|---|---|---|---|---|
| 1 | Jiaxing | 0.01915 *** | 0.01994 | 0.01955 | 22 | Bengbu | 0.00850 *** | 0.00968 | 0.00909 |
| 2 | Zhoushan | 0.01887 *** | 0.01926 | 0.01907 | 23 | Yangzhou | 0.00865 *** | 0.00903 | 0.00884 |
| 3 | Suzhou(js) | 0.01744 *** | 0.01962 | 0.01853 | 24 | Bozhou | 0.00854 *** | 0.00910 | 0.00882 |
| 4 | Wuxi | 0.01507 *** | 0.01665 | 0.01586 | 25 | Xuzhou | 0.00855 *** | 0.00901 | 0.00878 |
| 5 | Changzhou | 0.01453 *** | 0.01598 | 0.01525 | 26 | Lianyungang | 0.00836 *** | 0.00875 | 0.00856 |
| 6 | Zhenjiang | 0.01498 *** | 0.01542 | 0.01520 | 27 | Hangzhou | 0.00765 *** | 0.00926 | 0.00845 |
| 7 | Nanjing | 0.01409 *** | 0.01555 | 0.01482 | 28 | Huainan | 0.00761 *** | 0.00917 | 0.00839 |
| 8 | Ningbo | 0.01412 *** | 0.01490 | 0.01451 | 29 | Suzhou(ah) | 0.00792 *** | 0.00886 | 0.00839 |
| 9 | Nantong | 0.01255 *** | 0.01288 | 0.01271 | 30 | Yancheng | 0.00802 *** | 0.00870 | 0.00836 |
| 10 | Taizhou(js) | 0.01225 *** | 0.01258 | 0.01241 | 31 | Chuzhou | 0.00746 *** | 0.00907 | 0.00827 |
| 11 | Wuhu | 0.01157 *** | 0.01248 | 0.01202 | 32 | Suqian | 0.00778 *** | 0.00863 | 0.00820 |
| 12 | Shanghai | 0.01091 *** | 0.01228 | 0.01159 | 33 | Tongling | 0.00650 *** | 0.00793 | 0.00722 |
| 13 | Huzhou | 0.01082 *** | 0.01184 | 0.01133 | 34 | Huai’an | 0.00648 *** | 0.00743 | 0.00696 |
| 14 | Ma’anshan | 0.01087 *** | 0.01147 | 0.01117 | 35 | Lu’an | 0.00517 *** | 0.00719 | 0.00618 |
| 15 | Wenzhou | 0.01028 *** | 0.01182 | 0.01105 | 36 | Xuancheng | 0.00493 *** | 0.00669 | 0.00581 |
| 16 | Hefei | 0.01020 *** | 0.01173 | 0.01097 | 37 | Quzhou | 0.00496 *** | 0.00663 | 0.00579 |
| 17 | Jinhua | 0.01003 *** | 0.01157 | 0.01080 | 38 | Anqing | 0.00379 *** | 0.00610 | 0.00494 |
| 18 | Shaoxing | 0.01027 *** | 0.01122 | 0.01074 | 39 | Chizhou | 0.00337 ** | 0.00528 | 0.00432 |
| 19 | Taizhou(zj) | 0.00979 *** | 0.01103 | 0.01041 | 40 | Lishui | 0.00337 ** | 0.00519 | 0.00428 |
| 20 | Fuyang | 0.00952 *** | 0.01053 | 0.01002 | 41 | Huangshan | 0.00147 * | 0.00297 | 0.00222 |
| 21 | Huaibei | 0.00957 *** | 0.01046 | 0.01001 |
| Influencing Factors | q-Value | |||||
|---|---|---|---|---|---|---|
| 2001 | 2006 | 2011 | 2016 | 2021 | Average | |
| GDP | 0.478 *** | 0.570 *** | 0.597 *** | 0.427 *** | 0.438 *** | 0.502 *** |
| POD | 0.477 *** | 0.427 *** | 0.595 *** | 0.449 *** | 0.438 *** | 0.477 *** |
| FVC | 0.088 *** | 0.219 *** | 0.244 *** | 0.250 *** | 0.286 *** | 0.218 *** |
| DEM | 0.375 *** | 0.332 *** | 0.443 *** | 0.366 *** | 0.350 *** | 0.373 *** |
| AQ | 0.177 *** | 0.143 *** | 0.218 *** | 0.186 *** | 0.121 *** | 0.169 *** |
| TEM | 0.025 *** | 0.024 *** | 0.033 *** | 0.069 *** | 0.096 *** | 0.049 *** |
| PRE | 0.122 *** | 0.176 *** | 0.343 *** | 0.345 *** | 0.214 *** | 0.240 *** |
Disclaimer/Publisher’s Note: The statements, opinions and data contained in all publications are solely those of the individual author(s) and contributor(s) and not of MDPI and/or the editor(s). MDPI and/or the editor(s) disclaim responsibility for any injury to people or property resulting from any ideas, methods, instructions or products referred to in the content. |
© 2024 by the authors. Licensee MDPI, Basel, Switzerland. This article is an open access article distributed under the terms and conditions of the Creative Commons Attribution (CC BY) license (https://creativecommons.org/licenses/by/4.0/).
Share and Cite
Li, Y.; Wang, S. Exploration of Eco-Environment and Urbanization Changes Based on Multi-Source Remote Sensing Data—A Case Study of Yangtze River Delta Urban Agglomeration. Sustainability 2024, 16, 5903. https://doi.org/10.3390/su16145903
Li Y, Wang S. Exploration of Eco-Environment and Urbanization Changes Based on Multi-Source Remote Sensing Data—A Case Study of Yangtze River Delta Urban Agglomeration. Sustainability. 2024; 16(14):5903. https://doi.org/10.3390/su16145903
Chicago/Turabian StyleLi, Yuhua, and Shihang Wang. 2024. "Exploration of Eco-Environment and Urbanization Changes Based on Multi-Source Remote Sensing Data—A Case Study of Yangtze River Delta Urban Agglomeration" Sustainability 16, no. 14: 5903. https://doi.org/10.3390/su16145903
APA StyleLi, Y., & Wang, S. (2024). Exploration of Eco-Environment and Urbanization Changes Based on Multi-Source Remote Sensing Data—A Case Study of Yangtze River Delta Urban Agglomeration. Sustainability, 16(14), 5903. https://doi.org/10.3390/su16145903