Article

Integrated Assessment of Methane Production from the Co-Digestion of Swine Wastewater and Other Organic Wastes

by
Izabelle de Paula Sousa
1,
André Pereira Rosa
1,*,
Guilherme Kurtemback Almeida
1,
Dilson Novais Rocha
1,
Thiago de Alencar Neves
2 and
Alisson Carraro Borges
1
1
Department of Agricultural Engineering, Federal University of Viçosa, Viçosa 36571-900, Brazil
2
Department of Sanitary and Environmental Engineering, Federal University of Minas Gerais, Belo Horizonte 31270-901, Brazil
*
Author to whom correspondence should be addressed.
Sustainability 2024, 16(14), 5938; https://doi.org/10.3390/su16145938
Submission received: 17 April 2024 / Revised: 29 June 2024 / Accepted: 2 July 2024 / Published: 12 July 2024
(This article belongs to the Special Issue Sustainable Waste Management and Recovery)

Abstract

:
The study aimed to evaluate and compare the co-digestion of swine wastewater (SW) and other co-substrates: grass residue (GR), food waste (FW), and poultry litter (PL). The comparisons were performed using the biochemical methane potential (BMP) test. The maximum accumulated methane (CH4) production was submitted to a joint analysis of variance. Tukey’s test (α = 0.05) was used to compare the results of the treatments, and Dunnett’s test (α = 0.05) was used to compare the ratios (100:0, 75:25, 50:50, 25:75, and 0:100) (based on volatile solids—VS). In addition, both the synergistic effect and kinetic adjustment of some models were evaluated. The results indicated that the co-digestion of all substrates (GR, FW, and PL) with SW improved the methane production yield in comparison with mono-digestion (GR, FW, and PL). A positive synergistic effect was observed for the FW:SW (25:75 and 75:25). According to both Tukey’s and Dunnett’s tests (α = 0.05), the FW:SW ratio of 25:75 did not show statistical difference compared with the mono-digestion (SW), which exhibited the largest CH4 production. Among the models evaluated, the modified Gompertz function presented the best fit. For the co-digestion treatments, the ratio of FW:SW of 25:75 exhibited the most promising potential for integrated management, demonstrating the best synergistic effect among the substrates. In this context, methane production from co-digestion equalled that of mono-digestion, while enabling integrated residue management.

Graphical Abstract

1. Introduction

In recent decades, the environmental implications of organic waste disposal have prompted authorities to seek environmentally safe and economically viable management strategies [1]. Notably, agricultural, livestock, and food waste are significant contributors to waste generation, characterised by their high proportion of biodegradable organic matter.
Anaerobic digestion has emerged as one of the primary strategies for managing organic waste [2,3]. This process involves a complex biochemical pathway facilitated by diverse groups of microorganisms that degrade organic substances present in the residue, resulting in the production of valuable byproducts such as biogas and biofertiliser [4,5].
These byproducts can contribute as a source of renewable energy (biogas) as well as in the recovery of nutrients for agriculture (digestate). Among its various advantages, anaerobic digestion offers the following: (i) low energy consumption; (ii) minimal land requirements; (iii) low construction costs; and (iv) reduced emissions of greenhouse gases, odours, and pathogens [6,7]. Despite being a well-established technique, anaerobic digestion still presents limitations, such as the need for post-treatment and the complexity of the process (biochemical and microbiological aspects) [8].
Co-digestion has been utilised as a viable strategy capable of enhancing the anaerobic digestion process, increasing the biodegradability of the substrate, and improving the conversion rate and biogas production that could be used as an additional energy source in treatment plants, in addition to allowing for the integrated management of residues, which contributes to a more sustainable approach [9].
Swine wastewater (SW) is recognised as a promising co-substrate due to its alkaline characteristics and buffering capacity [3]. Numerous studies have investigated the use of SW in various waste mixtures for enhancing methane production [10,11,12,13].
Previous studies have investigated the co-digestion of swine waste with various organic residues, primarily focusing on biochemical methane potential (BMP) tests and kinetic aspects. However, these studies often examined specific proportions of swine wastewater with a single substrate [14,15,16] or compared a known proportion with other organic substrates [12,17,18]. Nevertheless, expressive knowledge gaps persist regarding the optimal process conditions, including the types of wastes and proportions of substrates. This challenge arises due to the diverse array of wastes, each characterised by varying chemical compositions and biodegradability rates [9].
To date, few studies have systematically examined various proportions and substrates to assess methane yield production, particularly in co-digestion involving swine wastewater. For instance, Shen et al. [17] investigated different proportions of durian peel along with three other residues (beef, swine, and poultry); Himanshu et al. [18] evaluated the digestion of silage and animal waste (beef and swine); and Oladejo et al. [12] maintained the proportion of food waste with two other organic residues (beef and swine). In each study, the selection of the optimal BMP test conditions was primarily based on maximising the numeric value of CH4 production. However, there remains a lack of standardised protocols for decision-making in BMP tests. In this context, Xie et al. proposed that synergistic studies, coupled with statistical analysis, could enhance BMP results’ assessment, an approach that remains underexplored [19].
The specific objectives of this study were as follows: (i) to compare the co-digestion performance of different co-substrates (grass residue, food waste, and poultry litter) with swine wastewater; (ii) to evaluate and discuss the influence of organic residue characteristics on biodegradability; (iii) to identify the optimal conditions (residue type and proportion) for co-digestion with swine wastewater by integrating tools for decision-making (synergistic study and statistical analysis), along with kinetics studies; and (iv) to assess aspects related to co-digestion of swine wastewater compared to mono-digestion.

2. Material and Methods

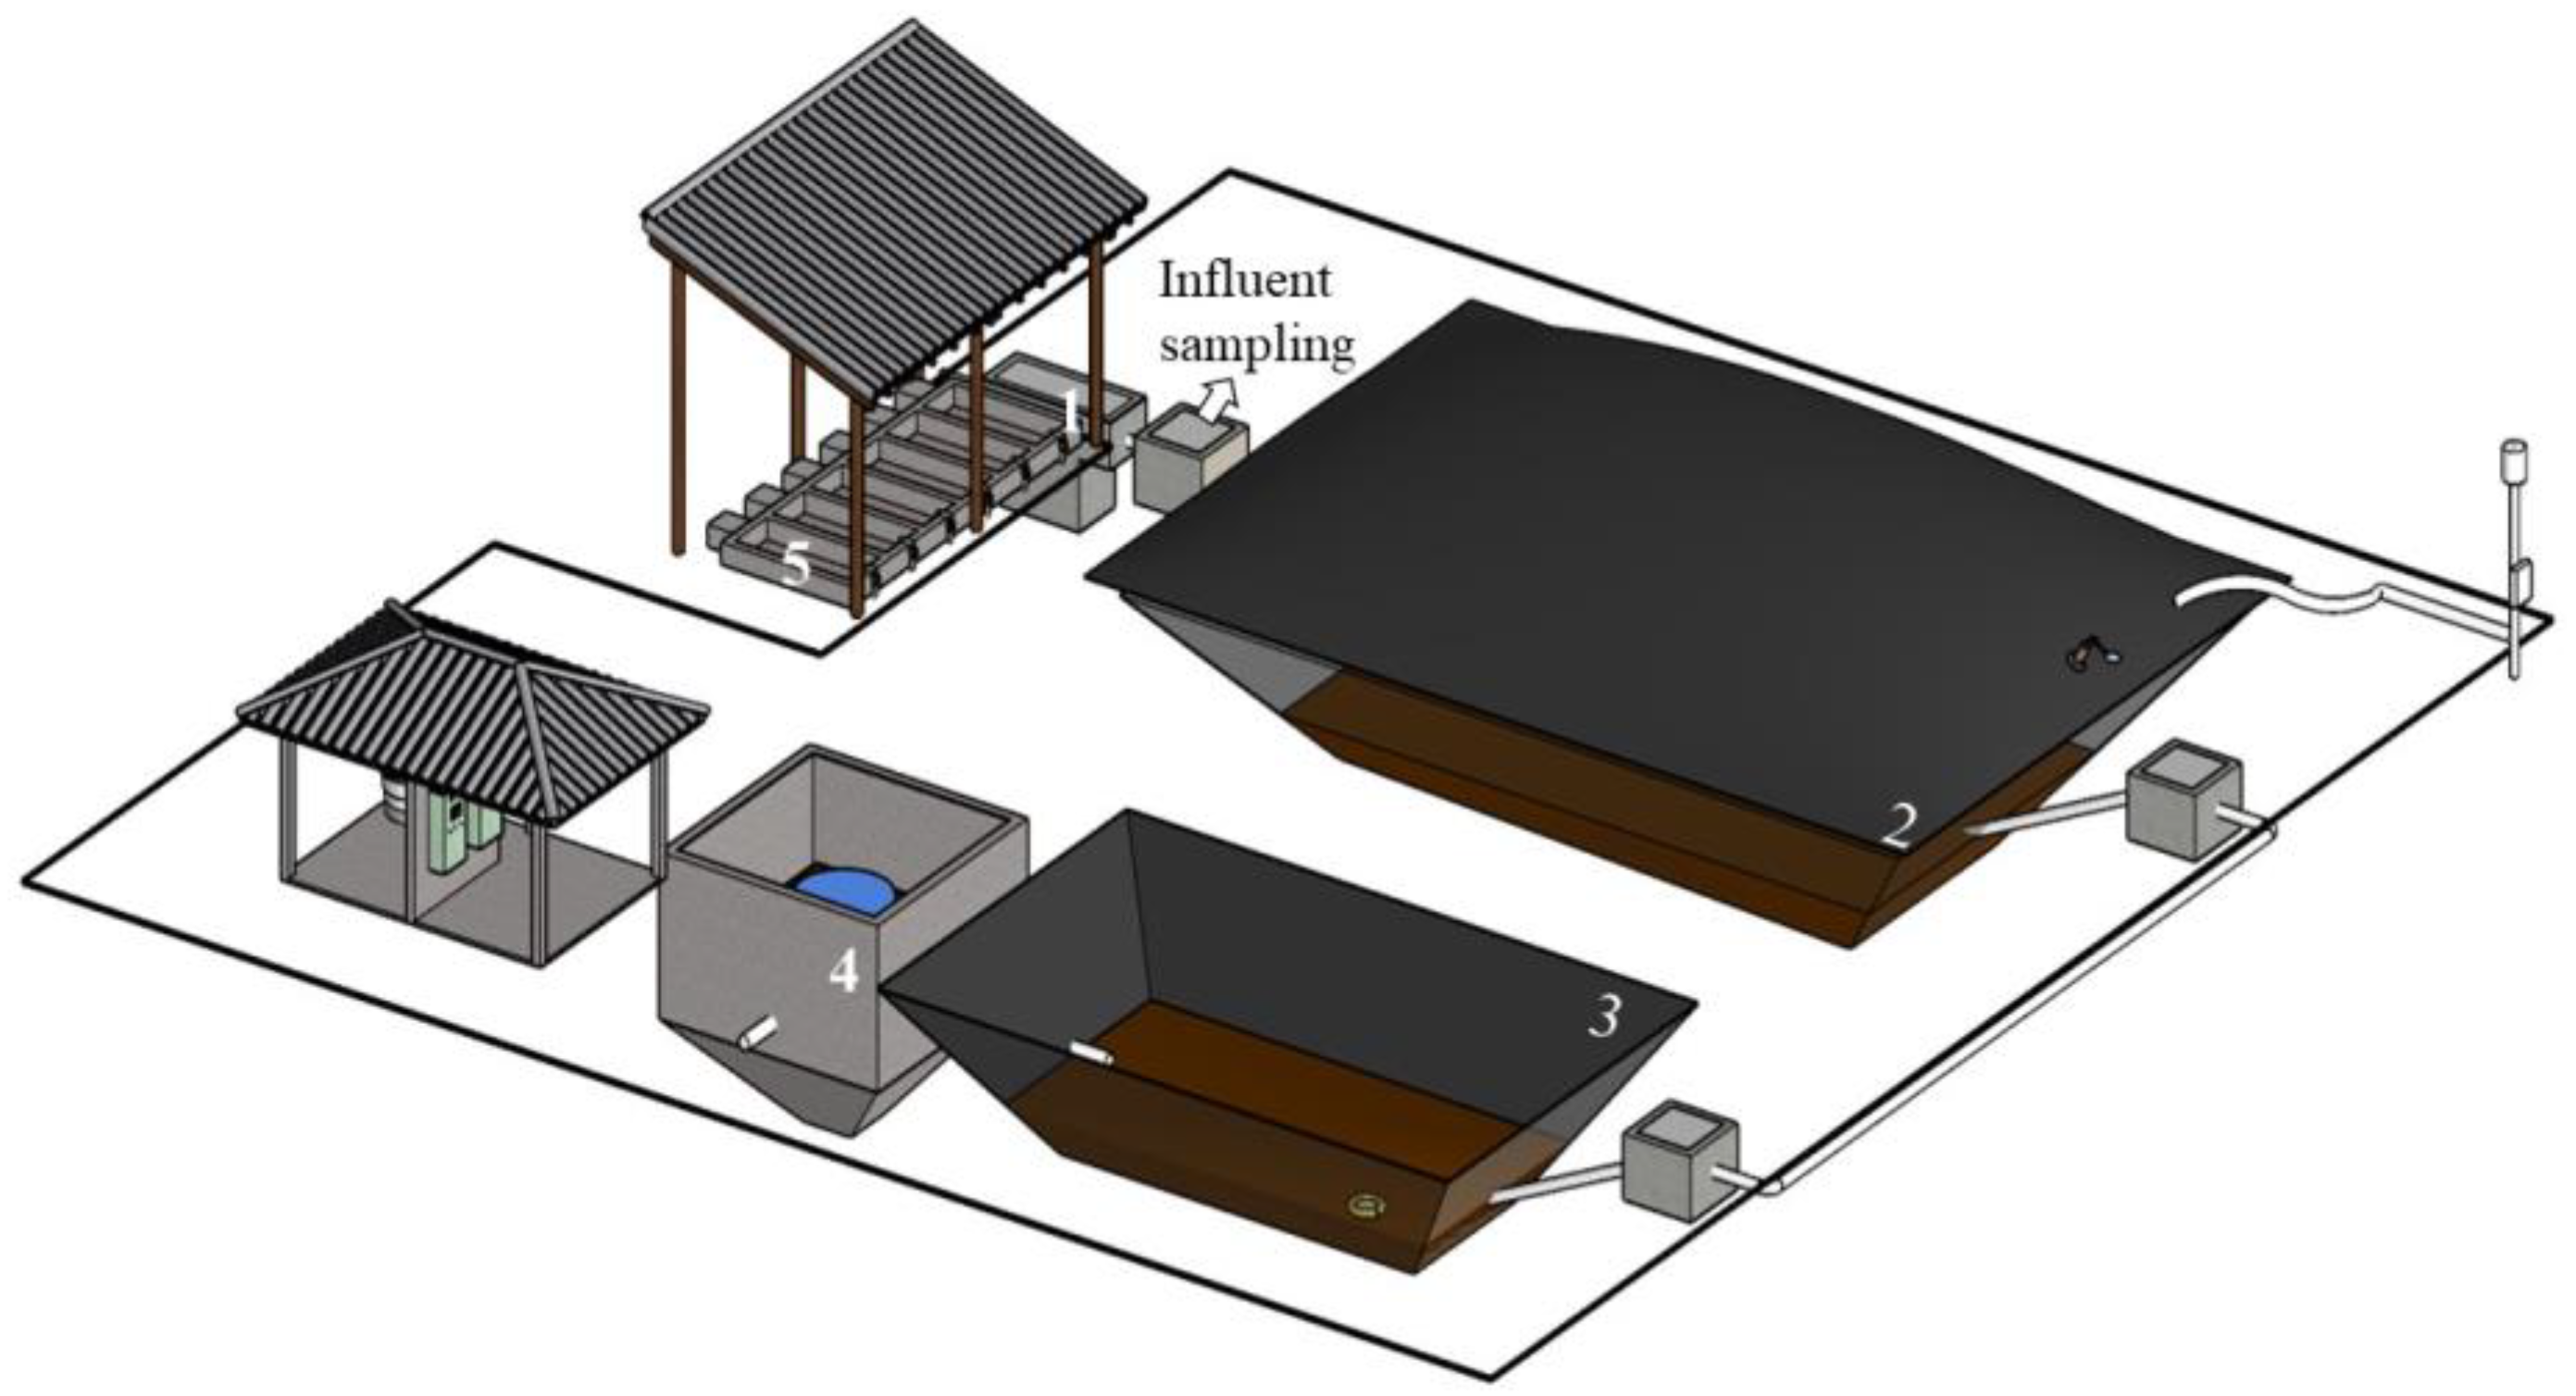
2.1. Substrate and Inoculum Preparation

The anaerobic sludge used as inoculum in the BMP test was sampled from a lateral access point at a depth of 1 m inside a full-scale covered lagoon digester (CLD), which treats swine wastewater at a pig farm. The effluent treatment system (Figure 1) comprises a sand traps, a CLD, and an aerated lagoon followed by a settler. The aerobic sludge from the aerated unit is disposed of in a sludge drying bed. The swine wastewater (SW) was sampled using a grab sample method (2 L) at a sampling point (Figure 1) in the CLD influent. The characteristics of swine wastewater (SW) (Table 1) were consistent with those reported by Cruz [20] during a 1-year monitoring period. The farm operates a complete cycle of confined animal breeding, managing a fluctuating population ranging from 440 to 288 animals from birth to maturity.
The other substrates (co-substrates) considered for the study were grass residue (GR), food waste (FW), and poultry litter (PL) The GR was collected, cut into 1–2 cm pieces (using scissors), and then dried in an oven at 65 °C for 24 h. The PL was obtained from a poultry house and was comprised of sawdust that was used for 75 days. FW was simulated in the laboratory to reflect a typical meal composition based on a healthy diet [21], consisting of 25% salad, 15% meat, 20% rice, 20% beans, 10% carrots, and 10% tomatoes [22]. All residues (GR, FW, and PL) were kiln-dried at 65 °C for 24 h, crushed to obtain particles smaller than 20 mesh, and subsequently stored at 4 °C until the start of the co-digestion tests. The inoculum was collected from the same CLD as the SW. The characteristics and elemental composition of the residues and inoculum are presented in Table 1. Elemental composition (C, H, and N) was determined using the Perkin Elmer Series II 2400 elemental analyser. The carbon/nitrogen (C/N) ratio was calculated based on the results of this analysis. Protein content was estimated by multiplying the total nitrogen, calculated using the Kjeldahl method, by a correction factor (6.25), as reported by Galvani and Gaertner [23], while carbohydrate content was determined according to DuBois et al. [24].

2.2. Evaluation of Anaerobic Digestion

The BMP test was performed using 120 mL vials with a working volume of 60 mL. The test was carried out in batch mode, where different proportions of residues (SW:GR, SW:FW, and SW:PL) were evaluated at varying ratios (0:100, 75:25, 50:50, 25:75, and 100:0) (based on volatile solids—VS). The inoculum/substrate ratio (I/S) was maintained at 2:1 (based on VS) [25,26], as it is the standard ratio recommended for any substrate type [27]. The total substrate and inoculum concentration in each vial was adjusted to 2% of VS. (m/v) [28], and the effective volume was standardised using distilled water. Control vials containing only inoculum and distilled water were utilised. Each experimental condition was conducted in quadruplicate. Vials were sealed with rubber septa and aluminium seals, then purged with nitrogen gas to eliminate oxygen. Subsequently, they were positioned in a thermostatic bath set at a constant temperature of 35 ± 2 °C, in darkness. The experiment was concluded upon reaching a daily gas production equivalent to 1% of the total production [25,29].
The physical and chemical characterisation of the substrate mixture at the onset of the experiment included pH, total solids (TS), volatile solids (VS), ammonia nitrogen (N-NH3), total alkalinity (TA), and chemical oxygen demand (COD). These parameters were analysed following the procedures outlined in the Standard Methods for the Examination of Water and Wastewater [30], employing closed reflux and colorimetric methods for COD determination.

2.2.1. Monitoring of Biogas Production and Composition

The biogas production was quantified using the manometric method [31]. Initially, the headspace pressure within the vial was measured using a digital manometer (INSTRUTHERM—mod. MVR-87), followed by purging of the headspace. Simultaneously, the temperature of a control vial containing an equivalent volume of water was measured to account for variations in headspace temperature. Subsequently, the pressure data were converted into biogas volume using Equations (1) and (2) [31].
V s t d = V m e a s × [ P m e a s   P H 2 O 101.325 × 273.15 T m e a s + 273.15 ]
P H 2 O = 0.61094 e ( 17.625 × T m e a s 243.04 +   T m e a s )  
where Vstd is the standardised gas volume (mL gVS−1); Vmeas is the headspace volume (mL); Pmeas is the gas pressure (kPa); Tmeas is the gas temperature at the time of pressure measurement (°C); PH2O is the water vapor partial pressure (kPa); 273.15 is the standard temperature (°C); and 101.325 is the standard pressure (kPa).
The cumulative biogas production in terms of vs. (mL gVS−1) was determined by subtracting the endogenous production of the inoculum (control vial). The cumulative methane production was calculated based on the methane content in the biogas. The biogas samples were collected using a gastight syringe, and the methane content was quantified by gas chromatograph (Shimadzu GC-2014, Kyoto, Japan) equipped with thermal conductivity (TCD) and flame ionisation (FID) detectors. Each biogas sample (100 μL) was injected into the equipment, which utilised helium as the carrier gas at a flow rate of 25 mL min−1. The temperature of the injector was maintained at 120 °C, while the FID temperature was set to 250 °C.

2.2.2. Statistical Analysis

The maximum cumulative methane productions obtained in the BMP tests (mL gVS−1) were subjected to a two-way analysis of variance (ANOVA). Tukey’s test, with a significance level of α = 0.05, was employed to compare the ratios (100:0, 75:25, 50:50, 25:75, and 0:100) of the substrates (GR:SW, FW:SW, and PL:SW), and this test was also applied to assess the substrates within each ratio. Additionally, to compare the methane production of residues with SW, Dunnett’s test was conducted, also with a significance level of α = 0.05. These statistical analyses were performed using R version 3.6.3 [32].

2.2.3. Synergistic Effect

The synergistic effect (SE) was calculated according to Equations (3) and (4) and determined by the difference between the specific experimental BMP and the weighted average of substrate mono-digestion (BMPw) [33]. According to Cárdenas-Cleves et al. [34], if the difference between the BMP and BMPw is positive and larger than the value of the weighted BMP, considering the standard deviation, a synergistic effect is observed, otherwise the effect is antagonistic.
S E = B M P B M P w
B M P w = Y a × F a + Y b × F b
where SE = synergistic effect (mLCH4 gVS−1); BMP = specific experimental biomethane potential (mLCH4 gVS−1); BMPw = weighted average of substrate mono-digestion; Ya = methane production from substrate mono-digestion (GR, FW, and PL); Yb = methane production from mono-digestion; Fa = proportions of substrates (25%, 50%, or 75%); and Fb = proportion of SW (75%, 50%, or 25%) (based on volatile solids—VS).

2.2.4. Kinetic Models

To elucidate the kinetics of methane production, three commonly applied methods in the literature [34,35] were selected: the first-order kinetic model, the modified Gompertz model, and the Cone model (Equations (5), (6), and (7), respectively). The kinetic parameters of these models were derived and subjected to statistical analysis using the “Solver” function in Microsoft Excel 2013.
Y i = Y m ( 1 e K t i )
Y i = Y m   exp ( exp   ( R m e   λ t i Y m ) + 1 )
Y i = Y m 1 + ( K t i ) n
where Yi is the specific yield of methane at time i (mLCH4 gVS−1); Ym = maximum methane yield (mLCH4 gVS−1); k = first-order coefficient (d−1); ti = digestion time (d); Rm = maximum methane production rate (mLCH4 gVS−1 d−1); λ = lag phase (d); and n = form factor.
The models were assessed based on the percentage relative root mean squared error normalised (RRMSE%) by the mean of the experimental values and the coefficient of determination (R2).

3. Results and Discussion

3.1. Stability of Anaerobic Process

The initial and final characterisation of mono-digestion and co-digestion are shown in Table 2.
At the end of the BMP test, the pH values of all treatments were below 8.0, within the acceptable range (6.0 to 8.3) to not inhibit methanogenic activity [36]. Lowering the pH could lead to the accumulation of fatty acids, potentially inhibiting methanogenic activity and reducing methane production [37]. However, the observed pH range for the treatments was within the optimal range. This pH stability can be attributed to alkalinity, as it promotes microbial growth, neutralises acids generated during anaerobic digestion, and facilitates biogas production [38].
The final alkalinity of the treatments (inoculum + substrate) fell within the range recommended for anaerobic reactors (>3 gCaCO3 L−1) [39], except for GR in all proportions and the 100:0 ratio of FW and PL. Even in cases where the treatments exhibited alkalinity below the recommended threshold, no significant pH drop was observed (Table 2). The buffering capacity noted in the BMP can be attributed to the inoculum, given the 2:1 ratio employed in this study. Additionally, the inclusion of SW in other residues (co-digestion) contributed to the stability of the reactor, which supports findings by Neshat et al. [40], indicating that substrates with high alkalinity, such as animal manure, aid in neutralising acids produced during the anaerobic process. Furthermore, residues with high protein content (Table 1) are less prone to pH decrease in BMP tests [39].
Among the treatments evaluating co-digestion, removal efficiencies were greater than 55% for COD, 15.6% for TS, and 29.6% for VS. Generally, an increase in the removal efficiency of TS, VS, and COD was observed with the addition of SW to the substrates (GR and FW), consistent with findings by Oladejo et al. [12], with the most favourable results observed for the ratio of 25:75 (residue).
In terms of N-NH3, an increase was observed for all treatments following the anaerobic digestion process, indicating the degradation of nitrogenous matter in the waste, consistent with results reported by Wang et al. [41]. Compared to other proportions, the 25:75 ratio of all types of residues exhibited higher N-NH3 levels (both initial and final). Mono-digestion of SW (0:100) resulted in final N-NH3 concentrations equal to 323.4 mg L−1, surpassing the values of the other treatments. However, the N-NH3 values obtained in this study did not reach inhibitory levels (>3000 mg L−1) for the anaerobic process under mesophilic conditions [42]. According to McCarty [42], ammonia concentrations between 50 and 200 mg L−1 have a beneficial effect on anaerobic digestion, as ammonia nitrogen is essential for microbial growth. Similarly, Sillero et al. [43] evaluated the co-digestion of sewage sludge with vinasse and poultry manure and observed an increase in N-NH3 at the end of the BMP test.

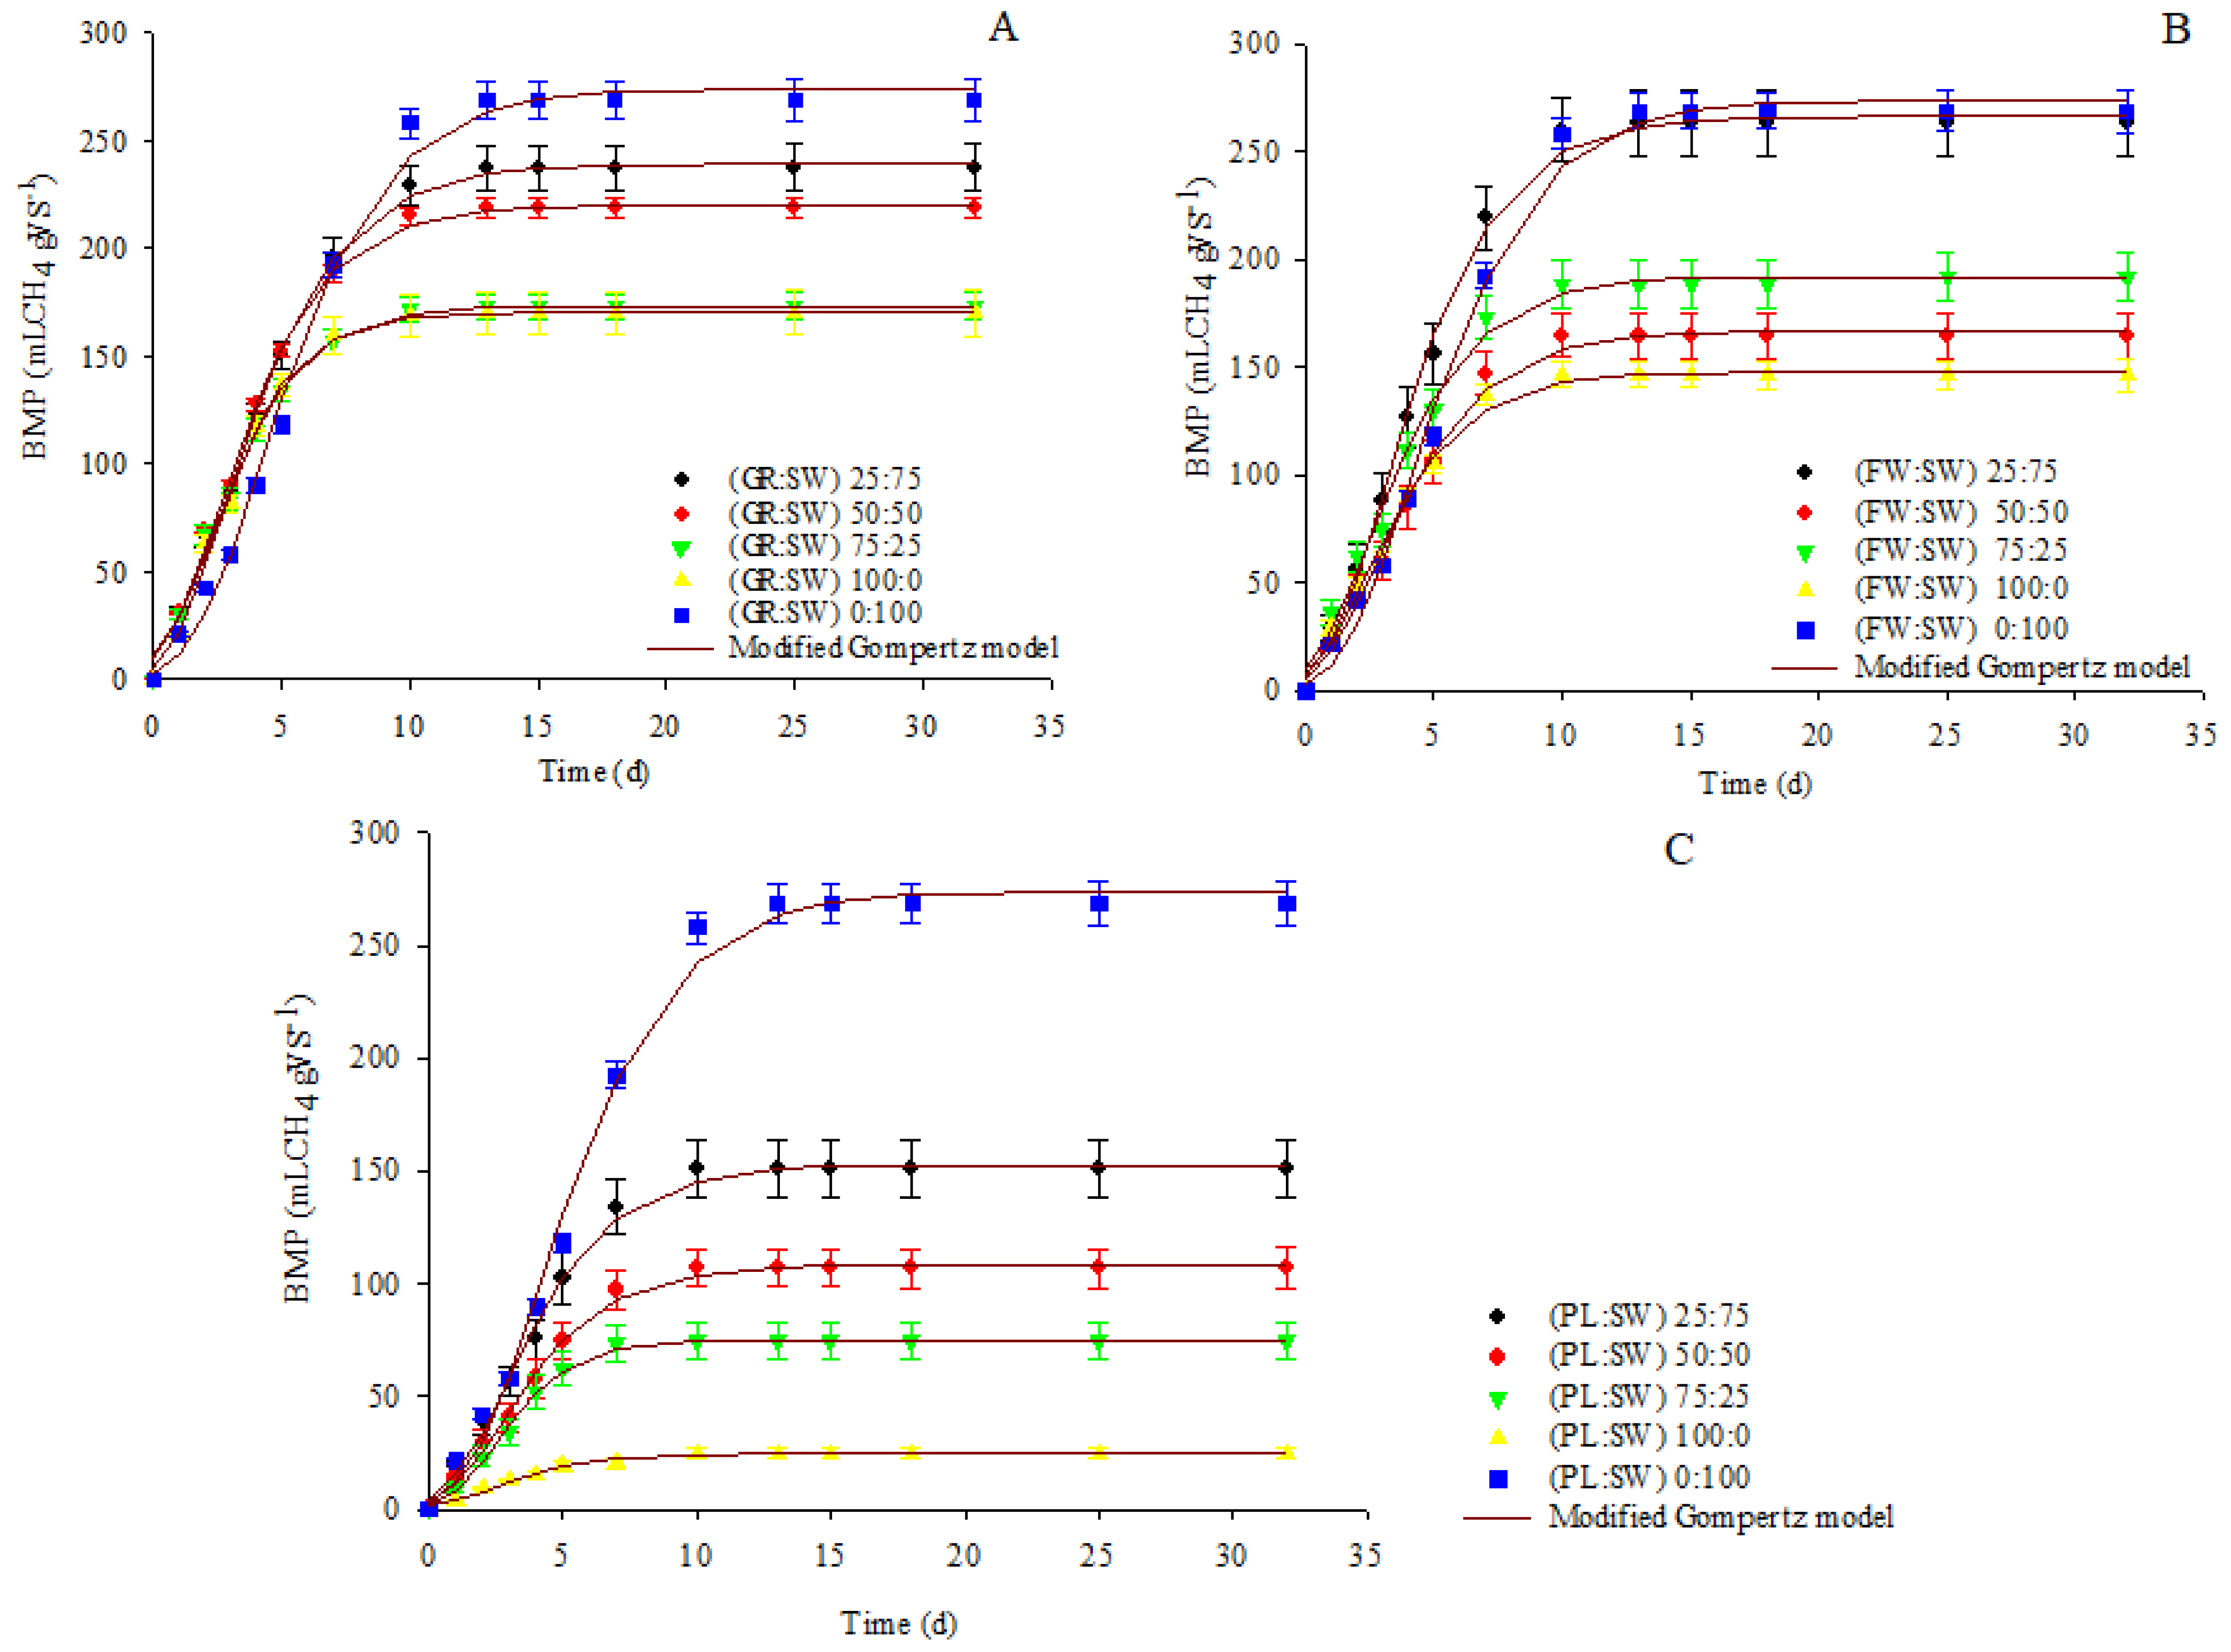
3.2. Cumulative Methane Production and Synergistic Effect

Figure 2 shows the cumulative methane production during mono-digestion of SW, GR, FW, and PL and co-digestion of GR:SW, FW:SW, and PL:SW in the ratios of 75:25, 50:50, and 25:75 as well as the modified Gompertz model adjustment.
The ultimate methane yield was observed on the seventh day for most treatments: (i) GR:SW—25:75 (45.4 ± 6.6 mL gVS−1) and 0:100 (74.1 ± 4.2 mL gVS−1); (ii) FW:SW—75:25 (43.15 ± 4.7 mL gVS−1), 50:50 (41.1 ± 0.9 mL gVS−1), 25:75 (63.1 ± 2.9 mL gVS−1), and 100:0 (31.9 ± 1.0 mL gVS−1); and (iii) PL:SW—25:75 (31.9 ± 3.71 mL gVS−1) and 50:50 (22.6 ± 0.24 mL gVS−1).
For the PL:SW of 75:25 (17.8 ± 4.8 mL gVS−1) and GR:SW of 50:50 (38.8 ± 1.5 mL gVS−1), 75:25 (36.7 ± 4.3 mL gVS−1), and 100:0 (42.7 ± 3.6 mL gVS−1), the ultimate methane yield occurred by the fourth day. On the other hand, the maximum yield was observed on the second day for the PL:SW of 100:0 (5.6 ± 0.8 mL gVS−1), indicating a possible inhibition of microbial activity, although there was no interruption in methane production until the tenth day. Regarding cumulative methane production, all treatments showed a similar trend, indicating a high rate of substrate degradation in the first 10 days and no abrupt inhibition was observed during the anaerobic process (Figure 2).
Methane and biogas production increased with the addition of SW compared to the mono-digestion of each type of residue (100:0). This trend was also observed by Abudi et al. [14], who investigated the co-digestion of mango leaves with pig manure in various proportions. The authors noted a gradual increase in accumulated methane yield with a higher fraction of pig manure in the mixture. This rise in methane yield was attributed to a more diverse consortium of microorganisms, increased availability of nutrients, and a better balance in the C/N ratio.
Methane production for the 25:75 ratio (GR:SW and FW:SW) was notably higher among the treatments (Figure 1), closely resembling mono-digestion with SW. Moreover, the highest removal efficiencies of TS, VS, and COD were observed for the 25:75 ratio (Table 1) in the context of co-digestion treatments. This observation underscores that the degradation of organic matter facilitated methane production.
Among the residues, FW exhibited the highest carbohydrate content (55.1%), protein content (30.1%), a high VS/TS ratio (0.94), and biodegradability of 74.42% (Table 1), suggesting that the majority of the organic content is readily biodegradable, thus favouring the conversion of organic matter to biogas [44]. In contrast, the treatment containing PL presented a lower carbohydrate content (8.7) and VS/TS ratio (0.79), as well as a biodegradability of 68.44% (Table 1). However, the organic fraction of these residues differs (FW and PL), with PL containing high levels of lignocellulosic material in its composition [45]. Table 3 presents the statistical analysis of the mono-digestion and co-digestion of the studied residues.
The mono-digestion of GR exhibited lower CH4 production compared to SW mono-digestion (p < 0.05) (Table 3). The CH4 production values obtained for GR mono-digestion were higher than those reported by Elsayed et al. [46] (148 mL gVS−1) and fell within the range reported in the literature for grass (188 to 311 mL gVS−1) [47]. Variations in these CH4 production values could be attributed to differences in residue concentrations and the characteristics of the inoculum used.
According to Yu et al. [48], this reduced CH4 production may be attributed to the composition of grass, which contains a high content of recalcitrant lignocellulose. Co-digestion of this residue with SW contributed to enhancing CH4 production yield, demonstrating a significant increase in CH4 production between mono-digestion (100:0) and the proportions 50:50 and 25:75 (GR) (p < 0.05). Similarly, Xie et al. [13] evaluated co-digestion between SW and grass and observed higher cumulative methane production in SW/grass ratios of 1:3 and 1:1. They further noted a decrease in methane production with an increase in the proportion of grass.
Considering the FW residue, the addition of SW also contributed to CH4 yield, increasing CH4 production by 80% compared to mono-digestion (100:0) with the 25:75 ratio (FW) (p < 0.05). The lower CH4 yields observed for mono-digestion (100:0) (FW) could be attributed to the poor balance of nutrients and the potential formation of reaction inhibitors; however, this effect could be mitigated by co-digestion [49]. It is noteworthy that there was no statistical difference (p > 0.05) between the 25:75 ratio and SW mono-digestion (0:100) (Table 3). From a practical standpoint, this underscores the potential of integrating FW and SW management, especially considering that FW is typically sent to landfills or used as compost.
The rise in the proportion of SW significantly contributed to an increase in cumulative methane production compared to the mono-digestion of PL (p < 0.05). According to Miah et al. [50], the mono-digestion of PL produced a C/N ratio close to 7.5, which is considered low for the anaerobic process, and corroborates the results obtained in the present study.
One way to evaluate the impact of co-digestion on methane production is by studying the synergistic effect of the substrates, as presented in Table 4, which considers the substrates used in this study.
The positive synergistic effect resulting in higher biogas production was observed for the ratios of FW:SW at 25:75 and 75:25. Similarly, Cárdenas-Cleves et al. [34] also reported this synergistic effect in their study on the co-digestion of FW and SW. This synergistic effect may arise from the additional contribution of alkalinity to the medium, and the balance of nutrients and trace elements, resulting in an increase in the biodegradability of the substrate and, consequently, the yield of methane [33].
Additionally, the co-digestion of PL, GR, and SW exhibited an antagonistic effect, further supporting the observed statistical difference between mono-digestion and co-digestion using these co-substrates. According to the results of Tukey’s (α = 0.05) and Dunnett’s (α = 0.05) tests (Table 3), the 25:75 ratio of FW:SW did not exhibit a statistical difference compared to the mono-digestion of SW. Moreover, it was one of the proportions that exhibited a synergistic effect, making it the most recommended among the evaluated substrates and proportions.

3.3. Kinetic Models

The cumulative methane production potential was adjusted using the first-order, modified Gompertz, and Cone models, and the results are shown in Table 5.
In the evaluation of the models, values of R2 > 0.95 and a maximum RRMSE of 14% were obtained for SW; for all other treatments, the RRMSE was less than 10%. In general, the models showed a good fit to the experimental data and were able to explain at least 95% of the variations in the results
Among the evaluated models, the modified Gompertz model presented the best fit (R2: 0.992–0.998 and RRMSE: 2.8–4.6%) (Figure 2). It was also the model that most closely approximated the observed production in the experiment, with a difference of 0.0–2.0% between the predicted and measured production, followed by the Cone model and the first-order model.
The maximum methane production yield (Ym) followed the same trend observed in the experiment for the accumulated methane production values. The maximum Ym value was obtained for SW, followed by FW, GR, and PL. In co-digestion, Ym decreased with the reduction in SW in the mixture. Additionally, the Ym results were consistently higher than the experimental values.
The maximum methane production rate (Rm) represents the slope of the line during the exponential phase of biogas production (tangent to the inflection point) [51]. The smallest value of Rm was obtained for PL (4.35 mL gVS−1 d−1), indicating the low biodegradability of this substrate. Zahan et al. [51] reported Rm values of 2.29 mL gVS−1 d−1 and a cumulative methane production of 108 mL gVS−1 for PL, while other lignocellulosic materials studied presented better coefficients. The authors attributed this result to the high levels of lignin and crystallinity in the litter materials.
The lag phase (λ) indicated in the modified Gompertz model had the highest value for SW (1.4 d), which may be associated with the complexity of the substrate (organic matter rich in protein and lipids) and the fact that lipid degradation favours the accumulation of long-chain fatty acids [52]. GR presented the second-highest lag phase (0.46 d), which may be related to the typical lignocellulosic composition of this material and could be associated with the origin of the inoculum that was not previously adapted to this type of substrate.
The first-order coefficient (k) depicts the biodegradability of the substrate [53]. The values of k in the first-order and Cone models were lower for SW and increased with the addition of the co-substrates. This indicates that, in general, the substrates improved the initial biodegradability of the SW. Additionally, the FW:SW ratio of 25:75 showed no significant reduction in methane production (Table 3), and its kinetic parameters improved (especially the lag phase), which reinforces the benefits of this treatment.

3.4. Benefits of Integrated Waste Management

Food waste constitutes a significant portion of urban solid waste (50%) [34]. Another source of its generation is related to losses in agricultural food production [54]. This waste is primarily destined for landfills or for incineration, composting, or use as food for animal nutrition [55]. According to Hegde and Trabold [56], anaerobic digestion of food waste has been demonstrated as a more sustainable alternative compared to its disposal in landfills and incinerators. However, mono-digestion of food waste can lead to reactor instability [57].
In this context, anaerobic co-digestion of food waste with animal manure can contribute to maintaining process stability, either by balancing the C/N ratio or by providing conditions for greater stability in pH and microorganism growth [56].
The proportion recommended by this study (FW:SW—25:75) did not compromise biogas production compared to mono-digestion, while also offering additional advantages, such as (i) improved process stability; (ii) increased removal efficiencies of physicochemical parameters in co-digestion compared to FW mono-digestion (FW:SW—100:0); and (iii) the potential for integrated management of organic waste and swine wastewater, particularly in agricultural and rural areas.
Mu et al. [58] also report that anaerobic co-digestion is a more sustainable waste management alternative due to the economic advantages of a combined treatment unit for these substrates, which can help avoid sending food waste to landfills. However, other aspects such as logistics, waste variability, and biofertiliser production, among others, need to be considered in the conception and design of treatment plants.

4. Conclusions

The co-digestion of swine wastewater with other organic residues (grass residue, food waste, and poultry litter) contributed to an increase in methane production compared to the mono-digestion of grass residue, food waste, and poultry litter.
Considering the proportions studied, the ratio of 25% food waste (based on volatile solids) and 75% swine wastewater is suggested as the most suitable for co-digestion with SW, since this ratio for co-digestion indicated the best synergistic effect and maintained the methane production of mono-digestion.
In general, all models presented a good agreement with the experimental data and were able to explain at least 95% of the variations in the results. The modified Gompertz model had the best fit, with R2 between 0.992 and 0.998 and RRMSE between 2.8 and 4.6%. Furthermore, it was the model that best fit the experiment results, with a difference of 0.0–2.0% between the predicted and measured methane production, followed by the Cone model and the first-order model.
From the integrated statistical/synergistic study, food waste was the substrate that showed the best synergy with swine wastewater, presenting potential for integrated waste management. In addition, other aspects such as logistics, waste variability, and biofertiliser production, among others, need to be considered.

Author Contributions

Conceptualisation, I.d.P.S. and A.P.R.; methodology, I.d.P.S., A.P.R., G.K.A., and D.N.R.; investigation, I.d.P.S. and G.K.A.; writing—original draft preparation, I.d.P.S. and A.P.R.; writing—review and editing I.d.P.S., A.P.R., D.N.R., A.C.B., and T.d.A.N. All authors have read and agreed to the published version of the manuscript.

Funding

This study was financed in part by the Coordination for the Improvement of Higher Education Personnel—Brazil (CAPES)—Finance Code 001; National Council for Scientific and Technological Development—Brazil (CNPq)—process number 140417/2020-6; and Minas Gerais Research Foundation (FAPEMIG), grant number APQ-01576-22.

Institutional Review Board Statement

Not applicable.

Informed Consent Statement

Not applicable.

Data Availability Statement

Data are contained within the article.

Conflicts of Interest

The authors declare no conflicts of interest.

References

  1. Bortoli, M.; Hollas, C.E.; Cunha, A., Jr.; Steinmetz, R.L.R.; Coldebella, A.; de Prá, M.C.; Soares, H.M.; Kunz, A. Water reuse as a strategy for mitigating atmospheric emissions and protecting water resources for the circularity of the swine production chain. J. Clean. Prod. 2022, 345, 131127. [Google Scholar] [CrossRef]
  2. Lovarelli, D.; Falcone, G.; Orsi, L.; Bacenetti, J. Agricultural small anaerobic digestion plants: Combining economic and environmental assessment. Biomass Bioenergy 2019, 128, 105302. [Google Scholar] [CrossRef]
  3. Lourinho, G.; Rodrigues, L.F.T.G.; Brito, P.S.D. Recent advances on anaerobic digestion of swine wastewater. Int. J. Environ. Sci. Technol. 2020, 17, 4917–4938. [Google Scholar] [CrossRef]
  4. Nagarajan, D.; Kusmayadi, A.; Yen, H.W.; Dong, C.D.; Lee, D.J.; Chang, J.S. Current advances in biological swine wastewater treatment using microalgae-based processes. Bioresour. Technol. 2019, 289, 121718. [Google Scholar] [CrossRef] [PubMed]
  5. Tavera-Ruiz, C.; Martí-Herrero, J.; Mendieta, O.; Jaimes-Estévez, J.; Gauthier-Maradei, P.; Azimov, U.; Escalante, H.; Castro, L. Current understanding and perspectives on anaerobic digestion in developing countries: Colombia case study. Renew. Sustain. Energy Rev. 2023, 173, 113097. [Google Scholar] [CrossRef]
  6. Holm-Nielsen, J.B.; Al Seadi, T.; Oleskowicz-Popiel, P. The future of anaerobic digestion and biogas utilization. Bioresour. Technol. 2009, 100, 5478–5484. [Google Scholar] [CrossRef] [PubMed]
  7. Paranjpe, A.; Saxena, S.; Jain, P. Biogas yield using single and two stage anaerobic digestion: An experimental approach. Energy Sustain. Dev. 2023, 74, 6–19. [Google Scholar] [CrossRef]
  8. Uddin, M.; Wright, M. Anaerobic digestion fundamentals, challenges, and technological advances. Phys. Sci. Rev. 2023, 8, 2819–2837. [Google Scholar] [CrossRef]
  9. Karki, R.; Chuenchart, W.; Surendra, K.C.; Shrestha, S.; Raskin, L.; Sung, S.; Hashimoto, A.; Khanal, S.K. Anaerobic co-digestion: Current status and perspectives. Bioresour. Technol. 2021, 330, 125001. [Google Scholar] [CrossRef]
  10. Tian, P.; Gong, B.; Bi, K.; Liu, Y.; Ma, J.; Wang, X.; Ouyang, Z.; Cui, X. Anaerobic Co-digestion of pig manure and rice straw: Optimization of process parameters for enhancing biogas production and system stability. Int. J. Environ. Res. Public Health 2023, 20, 804. [Google Scholar] [CrossRef]
  11. Pereira, F.E.D.A. Co-Digestão Anaeróbia de Dejetos de Suínos e de Galinhas Poedeiras para Geração de Biogás e Biofertilizante. 2022. Available online: https://www.locus.ufv.br/bitstream/123456789/29936/1/texto%20completo.pdf (accessed on 16 April 2024). (In Portuguese).
  12. Oladejo, O.S.; Dahunsi, S.O.; Adesulu-Dahunsi, A.T.; Ojo, S.O.; Lawal, A.I.; Idowu, E.O.; Olanipekun, A.A.; Ibikunle, R.A.; Osueke, C.O.; Ajayi, O.E.; et al. Energy generation from anaerobic co-digestion of food waste, cow dung and piggery dung. Bioresour. Technol. 2020, 313, 123694. [Google Scholar] [CrossRef]
  13. Xie, S.; Lawlor, P.G.; Frost, J.P.; Hu, Z.; Zhan, X. Effect of pig manure to grass silage ratio on methane production in batch anaerobic co-digestion of concentrated pig manure and grass silage. Bioresour. Technol. 2011, 102, 5728–5733. [Google Scholar] [CrossRef]
  14. Abudi, Z.N.; Hu, Z.; Abood, A.R. Anaerobic co-digestion of mango leaves and pig manure: Performance assessment and kinetic analysis. Biomass Convers. Biorefinery 2022, 12, 275–285. [Google Scholar] [CrossRef]
  15. Hu, Y.; Kumar, M.; Wang, Z.; Zhan, X.; Stengel, D.B. Filamentous microalgae as an advantageous co-substrate for enhanced methane production and digestate dewaterability in anaerobic co-digestion of pig manure. Waste Manag. 2021, 119, 399–407. [Google Scholar] [CrossRef]
  16. Dennehy, C.; Lawlor, P.G.; Croize, T.; Jiang, Y.; Morrison, L.; Gardiner, G.E.; Zhan, X. Synergism and effect of high initial volatile fatty acid concentrations during food waste and pig manure anaerobic co-digestion. Waste Manag. 2016, 56, 173–180. [Google Scholar] [CrossRef]
  17. Shen, J.; Zhao, C.; Liu, Y.; Zhang, R.; Liu, G.; Chen, C. Biogas production from anaerobic co-digestion of durian shell with chicken, dairy, and pig manures. Energy Convers. Manag. 2019, 198, 110535. [Google Scholar] [CrossRef]
  18. Himanshu, H.; Murphy, J.D.; Grant, J.; O’Kiely, P. Antagonistic effects on biogas and methane output when co-digesting cattle and pig slurries with grass silage in in vitro batch anaerobic digestion. Biomass Bioenergy 2018, 109, 190–198. [Google Scholar] [CrossRef]
  19. Xie, T.; Xie, S.; Sivakumar, M.; Nghiem, L.D. Relationship between the synergistic/antagonistic effect of anaerobic co-digestion and organic loading. Int. Biodeterior. Biodegrad. 2017, 124, 155–161. [Google Scholar] [CrossRef]
  20. Cruz, G.O.R.D. Rotas de Conversão de Matéria Orgânica em Biodigestores Lagoa Coberta (BLC) no Tratamento de Águas Residuárias de Suinocultura. 2023. Available online: https://locus.ufv.br//handle/123456789/31725 (accessed on 16 April 2024). (In Portuguese).
  21. Deliberador, L.R.; Batalha, M.O.; Chung, M.; Cesar, A.D.S. Food waste: Evidence from a university dining hall in Brazil. Rev. De Adm. De Empresas 2021, 61, e2020-0271. [Google Scholar] [CrossRef]
  22. Ferreira, L.O.; Astals, S.; Passos, F. Anaerobic co-digestion of food waste and microalgae in an integrated treatment plant. J. Chem. Technol. Biotechnol. 2022, 97, 1545–1554. [Google Scholar] [CrossRef]
  23. Galvani, F.; Gaertner, E. Adequação da Metodologia Kjeldahl para Determinação de Nitrogênio total e Proteína Bruta. 2006. Available online: https://www.infoteca.cnptia.embrapa.br/bitstream/doc/812198/1/CT63.pdf (accessed on 16 April 2024). (In Portuguese).
  24. Dubious, M. Colorimetric method for determination of sugars and related substances. Anal. Chem. 1956, 28, 350–366. [Google Scholar] [CrossRef]
  25. Holliger, C.; Alves, M.; Andrade, D.; Angelidaki, I.; Astals, S.; Baier, U.; Bougrier, C.; Buffière, P.; Carballa, M.; De Wilde, V.; et al. Towards a standardization of biomethane potential tests. Water Sci. Technol. 2016, 74, 2515–2522. [Google Scholar] [CrossRef] [PubMed]
  26. Ojediran, O.J.; Dahunsi, S.O.; Aderibigbe, V.; Abolusoro, S.; Adesulu-Dahunsi, A.T.; Odekanle, E.L.; Odejobi, O.J.; Ibikunle, R.A.; Ogunwole, J.O. Valorization of Pennisetum purpureum (Elephant grass) and piggery manure for energy generation. Fuel 2021, 302, 121209. [Google Scholar] [CrossRef]
  27. Ohemeng-Ntiamoah, J.; Datta, T. Perspectives on variabilities in biomethane potential test parameters and outcomes: A review of studies published between 2007 and 2018. Sci. Total Environ. 2019, 664, 1052–1062. [Google Scholar] [CrossRef]
  28. Shin, J.D.; Han, S.S.; Eom, K.C.; Sung, S.H.; Park, S.W.; Kim, H.O. Predicting methane production potential of anaerobic co-digestion of swine manure and food waste. Environ. Eng. Res. 2008, 13, 93–97. [Google Scholar] [CrossRef]
  29. Holliger, C.; Fruteau de Laclos, H.; Hafner, S.D.; Koch, K.; Weinrich, S.; Astals, S.; Alves, M.; Andrade, D.; Angelidaki, I.; Appels, L.; et al. Requirements for Measurement and Validation of Biochemical Methane Potential (BMP). 2020. Available online: https://orbit.dtu.dk/en/publications/requirements-for-measurement-and-validation-of-biochemical-methan (accessed on 16 April 2024).
  30. APHA; AWWA; WEF. Standard Methods for Examination of Water and Wastewater. In Proceedings of the 23nd Edition American Public Health Association, Washington, DC, USA, 15 June 2017. [Google Scholar]
  31. Hafner, S.D.; Astals, S.; Buffiere, P.; Løjborg, N.; Holliger, C.; Koch, K.; Weinrich, S. Calculation of Methane Production from Manometric Measurements. Stand. BMP Methods Doc. 2020, 202, 1–5. [Google Scholar]
  32. R Core Team. R: A Language and Environment for Statistical Computing; R Foundation for Statistical Computing: Vienna, Austria, 2013. [Google Scholar]
  33. Labatut, R.A.; Angenent, L.T.; Scott, N.R. Biochemical methane potential and biodegradability of complex organic substrates. Bioresour. Technol. 2011, 102, 2255–2264. [Google Scholar] [CrossRef]
  34. Cárdenas-Cleves, L.M.; Marmolejo-Rebellón, L.F.; Torres-Lozada, P. Improvement of the biochemical methane potential of food waste by means of anaerobic co-digestion with swine manure. Braz. J. Chem. Eng. 2018, 35, 1219–1229. [Google Scholar] [CrossRef]
  35. Santos, L.A.; Valenca, R.B.; da Silva, L.C.S.; de Barros Holanda, S.H.; da Silva, A.F.V.; Jucá, J.F.T.; Santos, A.F.M.S. Methane generation potential through anaerobic digestion of fruit waste. J. Clean. Prod. 2020, 256, 120389. [Google Scholar] [CrossRef]
  36. Chernicharo, C.D.L. Reatores Anaeróbios; Departamento de Engenharia Sanitária e Ambiental–UFMG: Belo Horizonte, Brazil, 2019; Volume 5, 379p. (In Portuguese) [Google Scholar]
  37. Schmidt, T.; McCabe, B.K.; Harris, P.W.; Lee, S. Effect of trace element addition and increasing organic loading rates on the anaerobic digestion of cattle slaughterhouse wastewater. Bioresour. Technol. 2018, 264, 51–57. [Google Scholar] [CrossRef]
  38. Rocha-Meneses, L.; Zannerni, R.; Inayat, A.; Abdallah, M.; Shanableh, A.; Ghenai, C.; Kamil, M.; Kikas, T. Current progress in anaerobic digestion reactors and parameters optimization. Biomass Convers. Biorefinery 2022, 1–24. [Google Scholar] [CrossRef]
  39. Filer, J.; Ding, H.H.; Chang, S. Biochemical methane potential (BMP) assay method for anaerobic digestion research. Water 2019, 11, 921. [Google Scholar] [CrossRef]
  40. Neshat, S.A.; Mohammadi, M.; Najafpour, G.D.; Lahijani, P. Anaerobic co-digestion of animal manures and lignocellulosic residues as a potent approach for sustainable biogas production. Renew. Sustain. Energy Rev. 2017, 79, 308–322. [Google Scholar] [CrossRef]
  41. Wang, B.; Ma, J.; Zhang, L.; Su, Y.; Xie, Y.; Ahmad, Z.; Xie, B. The synergistic strategy and microbial ecology of the anaerobic co-digestion of food waste under the regulation of domestic garbage classification in China. Sci. Total Environ. 2021, 765, 144632. [Google Scholar] [CrossRef]
  42. McCarty, P.L. Anaerobic waste treatment fundamentals. Public Work. 1964, 95, 107–112. [Google Scholar]
  43. Sillero, L.; Solera, R.; Perez, M. Biochemical assays of potential methane to test biogas production from dark fermentation of sewage sludge and agricultural residues. Int. J. Hydrogen Energy 2022, 47, 27–13289. [Google Scholar] [CrossRef]
  44. Borth, P.L.B.; Perin, J.K.H.; Torrecilhas, A.R.; Pan, N.C.; Kuroda, E.K.; Fernandes, F. Biochemical methane potential of food and garden waste co-digestion with variation in solid content and inoculum: Substrate ratio. J. Mater. Cycles Waste Manag. 2021, 23, 1974–1983. [Google Scholar] [CrossRef]
  45. Sharma, D.; Espinosa-Solares, T.; Huber, D.H. Thermophilic anaerobic co-digestion of poultry litter and thin stillage. Bioresour. Technol. 2013, 136, 251–256. [Google Scholar] [CrossRef]
  46. Elsayed, M.; Blel, W.; Soliman, M.; Andres, Y.; Hassan, R. Semi-continuous co-digestion of sludge, fallen leaves, and grass performance. Energy 2021, 221, 119888. [Google Scholar] [CrossRef]
  47. Song, Y.; Pei, L.; Chen, G.; Mu, L.; Yan, B.; Li, H.; Zhou, T. Recent advancements in strategies to improve anaerobic digestion of perennial energy grasses for enhanced methane production. Sci. Total Environ. 2023, 861, 160552. [Google Scholar] [CrossRef] [PubMed]
  48. Yu, Q.; Chen, L.; Wang, W.; Wang, Q.; Bai, R.; Zhuang, X.; Guo, Y.; Qi, W.; Yuan, Z. Impact of blending on hydrolysis and ethanol fermentation of garden wastes. J. Clean. Prod. 2018, 190, 36–43. [Google Scholar] [CrossRef]
  49. Ibro, M.K.; Ancha, V.R.; Lemma, D.B.; Lenhart, M. Enhancing biogas production from food waste and water hyacinth: Effect of co-substrates and inoculum ratios. Biomass Convers. Biorefinery 2023, 1–18. [Google Scholar] [CrossRef]
  50. Miah, M.R.; Rahman, A.K.M.L.; Akanda, M.R.; Pulak, A.; Rouf, M.A. Production of biogas from poultry litter mixed with the co-substrate cow dung. J. Taibah Univ. Sci. 2016, 10, 497–504. [Google Scholar] [CrossRef]
  51. Zahan, Z.; Othman, M.Z.; Muster, T.H. Anaerobic digestion/co-digestion kinetic potentials of different agro-industrial wastes: A comparative batch study for C/N optimisation. Waste Manag. 2018, 71, 663–674. [Google Scholar] [CrossRef] [PubMed]
  52. Morais, N.W.S.; Coelho, M.M.H.; e Silva, A.D.S.; Silva, F.S.S.; Ferreira, T.J.T.; Pereira, E.L.; Dos Santos, A.B. Biochemical potential evaluation and kinetic modeling of methane production from six agro-industrial wastewaters in mixed culture. Environ. Pollut. 2021, 280, 116876. [Google Scholar] [CrossRef]
  53. Zhen, G.; Lu, X.; Kobayashi, T.; Kumar, G.; Xu, K. Anaerobic co-digestion on improving methane production from mixed microalgae (Scenedesmus sp., Chlorella sp.) and food waste: Kinetic modeling and synergistic impact evaluation. Chem. Eng. J. 2016, 299, 332–341. [Google Scholar] [CrossRef]
  54. Pour, F.H.; Makkawi, Y.T. A review of post-consumption food waste management and its potentials for biofuel production. Energy Rep. 2021, 7, 7759–7784. [Google Scholar] [CrossRef]
  55. Zhang, C.; Su, H.; Baeyens, J.; Tan, T. Reviewing the anaerobic digestion of food waste for biogas production. Renew. Sustain. Energy Rev. 2014, 38, 383–392. [Google Scholar] [CrossRef]
  56. Hegde, S.; Trabold, T.A. Anaerobic digestion of food waste with unconventional co-substrates for stable biogas production at high organic loading rates. Sustainability 2019, 11, 3875. [Google Scholar] [CrossRef]
  57. Xu, F.; Li, Y.; Ge, X.; Yang, L.; Li, Y. Anaerobic digestion of food waste–Challenges and opportunities. Bioresour. Technol. 2018, 247, 1047–1058. [Google Scholar] [CrossRef]
  58. Mu, L.; Zhang, L.; Zhu, K.; Ma, J.; Ifran, M.; Li, A. Anaerobic co-digestion of sewage sludge, food waste and yard waste: Synergistic enhancement on process stability and biogas production. Sci. Total Environ. 2020, 704, 135429. [Google Scholar] [CrossRef] [PubMed]
Figure 1. Schematic of the swine wastewater treatment system where swine wastewater and inoculum were collected. (1) Settling tank, (2) covered lagoon digester (CLD), (3) aerated lagoon, (4) settler, (5) sludge drying bed. Adapted by Cruz [20].
Sustainability 16 05938 g001
Figure 2. Methane production from the mono-digestion of (SW, GR, FW, and PL) and the co-digestion of GR:SW (A), FW:SW (B), and PL:SW (C) with ratios of 75:25, 50:50, and 25:75 and the modified Gompertz model adjustment.
Sustainability 16 05938 g002
Table 1. Characteristics of the organic residues.
ResidueElemental CompositionC/NCarb.
(%TS)
Prot.
(%TS)
TS
(%)
VS
(%)
VS/
TS *
COD/
TKN
TA
(gCaCO3L−1)
U
(%)
C
(%)
H
(%)
N
(%)
O
(%)
GR42.96.62.947.614.838.2 ± 2.319.1 ± 1.089.7 ± 0.179.2 ± 0.70.88--10.0 ± 0.1
FW45.87.25.241.88.855.1 ± 3.830.1 ± 0.221.7 ± 0.120.4 ± 0.00.94--78.2 ± 0.1
PL34.45.34.655.77.58.2 ± 0.427.3 ± 0.566.7 ± 0.352.7 ± 0.40.79--33.1 ± 0.1
SW-----3.7 ± 0.240.8 ± 0.00.8 ± 0.00.6 ± 0.00.708.11.3 ± 0.099.1 ± 0.1
I-------5.1 ± 0.13.1 ± 0.30.82-2.7 ± 0.0-
Legend: GR: grass residue, FW: food waste, PL: poultry litter, SW: swine wastewater, I: inoculum; Carb.: carbohydrate; Prot.: protein; TS total solids, VS: volatile solids; TA: total alkalinity; U: moisture content % mass/mass; * wet base; ± standard deviation (n = 2).
Table 2. Initial and final characterisation of the mono-digestion (inoculum + substrate) (SW, GR, FW, and PL) and co-digestion (inoculum + substrate) (GR:SW, FW:SW, PL:SW—75:25, 50:50, 25:75).
Parameter Treatments
SWGR:SWFW:SWPL:SWI
0:100100:075:2550:5025:75100:075:2550:5025:75100:075:2550:5025:75-
pH i7.78.07.57.37.28.38.18.07.78.18.08.18.38.1
pH f8.07.17.47.37.57.37.597.57.77.87.77.37.88.7
TA f (g L−1)3.82.62.22.02.52.93.243.43.62.93.24.14.02.4
COD i (g L−1)11.8 ± 7.09.8 ± 0.17.2 ± 0.511.9 ± 3.311.1 ± 2.113.6 ± 2.411.8 ± 2.39.9 ± 7.014.9 ± 2.314.0 ± 4.98.7 ± 2.218.6 ± 0.510.4 ± 1.29.3 ± 0.1
COD f (g L−1)4.2 ± 0.32.3 ± 0.23.2 ± 0.14.2 ± 0.93.6 ± 0.23.3 ± 0.13.0 ± 0.13.4 ± 0.63.0 ± 0.33.8 ± 0.03.5 ± 0.43.6 ± 0.34.6 ± 0.23.3 ± 0.2
COD effi (%)56.0 ± 28.276.1 ± 2.456.2 ± 3.962.7 ± 17.567.0 ± 4.275.4 ± 5.574.0 ± 4.656.1 ± 25.479.5 ± 1.371.0 ± 10.358.5 ± 6.180.8 ± 2.355.0 ± 6.5364.3 ± 1.4
TS i (g L−1)18.25 ± 2.612.5 ± 0.514.3 ± 2.011.8 ± 1.012.8 ± 2.718.4 ± 0.716.8 ± 1.417.0 ± 3.223.8 ± 0.224.9 ± 3.516.4 ± 2.120.2 ± 1.218.20 ± 2.632.14 ± 0.0
TS f (g L−1)10.82 ± 3.110.5 ± 1.910.4 ± 1.68.2 ± 3.47.7 ± 1.79.1 ± 1.212.7 ± 7.111.3 ± 2.07.74 ± 0.911.1 ± 3.09.8 ± 1.57.6 ± 0.011.79 ± 1.310.51 ± 5.7
TS effi (%)41.36 ± 8.9215.6 ± 8.427.2 ± 0.629.3 ± 14.136.9 ± 26.350.6 ± 4.826.1 ± 16.331.3 ± 24.867.5 ± 3.954.3 ± 18.639.1 ± 17.562.2 ± 2.334.0 ± 16.359.6 ± 7.0
VS i (g L−1)9.64 ± 1.88.0 ± 0.218.6 ± 2.06.9 ± 0.77.3 ± 1.111.2 ± 1.010.5 ± 0.811.1 ± 2.77.8 ± 6.015.4 ± 3.09.9 ± 1.611.4 ± 0.210.3 ± 2.415.5 ± 0.1
VS f (g L−1)6.68 ± 3.45.6 ± 1.16.0 ± 0.84.2 ± 1.94.3 ± 0.64.6 ± 0.25.8 ± 4.15.8 ± 0.24.1 ± 0.76.1 ± 3.05.4 ± 2.53.6 ± 0.66.4 ± 2.17.26 ± 5.1
VS effi (%)32.87 ± 22.929.6 ± 16.129.1 ± 6.336.5 ± 33.840.5 ± 17.358.2 ± 5.3945.1 ± 42.947.7 ± 15.547.6 ± 33.057.3 ± 27.742.5 ± 35.368.8 ± 4.537.7 ± 36.453.2 ± 32.8
N-NH3 i (mg L−1)236.5473.41133.22165.85209.3584.28111.47149.53193.03111.47127.70171.28165.85-
N-NH3 f (mg L−1)323.42122.91182.80211.44264.83154.16201.03227.07292.17120.30177.59240,09260.92-
Legend: i: initial; f: final; TA: total alkalinity; COD: chemical oxygen demand; TS: total solids, VS: volatile solids; N-NH3: ammonia nitrogen; SW: swine wastewater; GR: grass residue, FW: food waste, PL: poultry litter; I: inoculum; ± standard deviation (n = 2).
Table 3. Methane production from the mono-digestion (SW, GR, FW, and PL) and the co-digestion of GR:SW, FW:SW, and PL:SW—75:25, 50:50, and 25:75.
Ratio (Residue: SW)GR:SW (mL gVS−1)FW:SW (mL gVS−1)PL:SW (mL gVS−1)
100:00169.84 ± 16.7 cA *146.37 ± 10.3 cB *24.69 ± 2.3 eC *
75:25173.15 ± 7.2 cA *192.08 ± 18.8 bA *74.72 ± 12.1 dB*
50:50218.76 ± 7.0 bA *164.64 ± 22.0 cB *107.14 ± 17.2 cC *
25:75237.47 ± 4.4 bB *263.21 ± 8.5 aA150.90 ± 17.1 bC *
SW (0:100) (Control)268.91 ± 5.2 aA268.91 ± 5.2 aA268.91 ± 5.2 aA
Legend: SW: swine wastewater; GR: grass residue; FW: food waste; PL: poultry litter (PL); ± standard deviation (n = 4). The same lowercase letter in the same column, as well as the same uppercase letter in the same row, indicates that there was no difference at the α = 0.05 significance level by Tukey’s test. Values with an asterisk presented in the same column differ from the control sample based on Dunnett’s test at a significance level of α = 0.05.
Table 4. Synergistic effect of anaerobic co-digestion (GR:SW, FW:SW, and PL:SW) in the ratios of 75:25, 50:50, and 25:75.
Grass residue (mL gVS−1)
GR:SW RatioBMPSDBMPwSEEffect
75:25173.366.33194.75−21.39A
50:50218.765.10219.47−0.71A
25:75237.4711.02244.19−6.72A
Food waste (mL gVS−1)
FW:SW RatioBMPSDBMPwSEEffect
75:25192.0811.55177.0015.07S
50:50164.6410.44207.64−43.00A
25:75263.2115.71238.2724.94S
Poultry litter (mL gVS−1)
PL:SW RatioBMPSDBMPwSEEffect
75:2574.728.39177.00−102.28A
50:50107.148.76207.64−100.50A
25:75150.9012.96207.85−56.95A
Legend: SW: swine wastewater; GR: grass residue; FW: food waste; PL: poultry litter; BMP: specific experimental biomethane potential; SD: standard deviation; BMPw: weighted average of substrate mono-digestion; SE: synergistic effect; A: antagonistic effect; S: synergistic.
Table 5. Kinetic parameters of the first-order, modified Gompertz, and Cone models.
ModelParametersTreatments
SWGR:SWFW:SWPL:SW
0:100100:075:2550:5025:75100:075:2550:5025:75100:075:2550:5025:75
BMP (mL gVS−1)268.91170.03173.36218.76237.47146.37192.08164.64263.2124.6974.72107.14150.90
First-orderYm (mL gVS−1)297.78175.09177.78227.30249.41151.76197.84173.08280.0125.3677.48112.38158.85
K (d−1)0.130.260.260.210.180.230.220.190.170.240.250.200.19
Diff. (%)10.742.982.553.905.033.683.005.126.382.743.694.895.27
R20.9560.9810.9910.9880.9850.9800.9820.9760.9740.9900.9680.9750.975
RRMSE %14.77.24.76.07.07.06.98.69.85.09.48.99.1
Modified GompertzYm (mL gVS−1)274.40170.09173.39219.77239.40147.87192.03166.84266.4424.6575.27108.28152.70
Rm (mL gVS−1 d−1)36.4034.9331.4035.0334.4124.4930.0125.5839.714.3516.5518.1324.40
λ (d) 1.410.460.140.280.370.200.190.460.750.160.690.590.60
Diff. (%)2.040.040.010.460.811.03−0.021.331.23−0.150.741.061.19
R20.9950.9970.9960.9970.9980.9920.9920.9940.9980.9930.9970.9960.998
RRMSE (%)4.62.93.22.82.94.44.44.12.94.2.93.33.5
Cone modelYm (mL gVS−1)280.97174.65180.82229.74251.12154.18201.65173.23275.2325.7576.54111.56157.64
K (d−1)0.190.350.350.300.260.320.300.270.240.340.340.280.27
N2.682.161.811.891.921.871.812.062.261.812.522.212.19
Diff. (%)4.492.724.305.025.755.344.985.224.574.322.434.134.46
R20.9900.9940.9930.9920.9910.9820.9830.9850.9910.9930.9910.9890.988
RRMSE %7.03.84.14.55.26.76.66.85.63.94.85.86.1
Legend: Diff. (%) = ((Ymi − BMPi)/BMPi) × 100; SW: swine wastewater; GR: grass residue, FW: food waste, PL: poultry litter; Ym = maximum methane yield; K = first-order coefficient; Rm = maximum methane production rate; λ = lag phase; N= form factor.
Disclaimer/Publisher’s Note: The statements, opinions and data contained in all publications are solely those of the individual author(s) and contributor(s) and not of MDPI and/or the editor(s). MDPI and/or the editor(s) disclaim responsibility for any injury to people or property resulting from any ideas, methods, instructions or products referred to in the content.

