Abstract
The primary purpose of this research is to determine the most economical approach to installing a solar dish Stirling engine (SDSE) system on a building for residential purposes in Mafraq while taking into account the local weather, usual monthly consumption of energy and the prices charged by the local powered utility. The house uses an average of 622.25 kWh of energy every month, with the highest consumption in February and the lowest in May. A range of optical efficiencies between 50% and 98% are used to mount the SDSE system. This study evaluated the relationship between the price of electrical energy and the amount of power consumed to identify the times of day when energy consumption is highest. Another approach relevant to consider is solar power, which likewise varies across the whole year. When the available intensity of the sun and power rates are at their peak, an SDSE system is regarded as a feasible solution for fulfilling the energy requirements. This is because SDSE systems can still make electricity even during cloudy days. This work also includes a comprehensive analysis of the solar power that an SDSE receives and the generated electrical power.
1. Introduction
The increasing issues regarding carbon emissions from fossil fuels and their impact on climate change have motivated a shift towards renewable energy alternatives. Moreover, as fossil fuel reserves diminish and concerns about scarcity grow, the demand for alternative energy solutions has intensified. This shifting state of affairs is bringing new technological innovations to industry, in an energy revolution that is set to remake the world’s energy supply [1,2]. Over the next few decades, the way the world produces energy will have changed; by 2050, renewable energy sources are expected to overtake fossil fuels. By that time, more than half of the world’s energy will be produced by renewable sources [3,4]. An advisable way to meet these demands in Jordan is with solar power, where the daily solar radiation is 5–7 kWh/m2, far more than what many countries need for their conventional energy power supply—by many accounts [5,6,7]. Solar energy technologies (SETs) also have more advantages in green energy, with fewer energy storage and transportation barriers to setting them up, and the same energy output as traditional solutions. With their strong solar resource, Jordan can benefit from solar power to expand their use of SET and further meet local demands [8].
Solar energy is a form of energy that comes from sunlight. It has multiple uses, including the use of photovoltaics (PVs), concentrated solar (CS) power plants, CS for heating water, and concentrated sun photosynthetic modules [9,10]. Building-integrated photovoltaic systems (BIPV) range in capacity from a few to several kilowatts to hundreds of megawatts for large-scale power facilities. Off-grid PV systems now make up a very tiny percentage of the market, with on-grid systems dominating [11,12]. As a result, the incorporation of home PV and battery storage into the electrical system has reduced the maximum demand point and overall power cost by utilizing frameworks for dynamic electricity trading. The authors calculated the right energy storage capacity based on the results, a decrease in power prices of 89.8%, and the time frame at which the initial money invested in PV and batteries breaks even [13,14].
Installing PV battery systems in homes could significantly affect energy consumption as well as peak demand. As a result of installing 16 kW/hour batteries and 5.5 kW photovoltaic panels, the study found that peak demand may be reduced by as much as 50%. Households with retail energy and network capacity costs at necessary peak pricing had the largest bill reductions with PV battery systems. Reducing peak power usage and promoting cost-effectiveness were the main goals of these works—not maximizing self-consumption [15,16]. Furthermore, many studies examined the systems that were affected by the availability of electrical energy, weather, and rates of electrical energy usage [17,18]. The main challenge was supplying our utility with the seasonal demand for power while maximizing system efficiency and lowering expenses. The results of these studies could not be predicted due to the wide range of measures investigated and the requirement to determine the ideal installation angle to lessen some of these consequences [19,20].
SDSE technology is one of the best solar power generation systems designed for use in these developing nations. Systems that employ concentrated solar energy power an engine or generator and produce electricity using the heat produced by concentrating and absorbing solar radiation [21,22]. Since existing Stirling engines (SEs) are large and heavy, and because wind loads affect the dish reflector, this technology is often used at small-scale capacities (tens of kW) [23]. Power generation, cooking, irrigation, and water heating are some of these uses [24,25]. This technique is appropriate for such small-scale applications because of the tiny size and light weight of SEs [26]. With its limited capacity of 10–25 kW, solar SEs are more appropriate for commercial and industrial uses than utility-scale power generation. The temperature range for operation is 550–750 °C [27]. The system can achieve a maximum efficiency of up to 30% and an average yearly electricity efficiency of 12–25% [28,29]. The system’s actual power generated throughout a calendar year divided by the maximum amount of electricity that could have been produced if the system had run continuously at full capacity is known as the annual capacity factor, and it is typically between 25 and 28% [30]. In addition, the concentration ratio of 1300 suns is used in the collector’s concentration ratios [31].
Few research endeavors in Jordan have aimed to assess the operational performance and financial competitiveness of the SDSE, considering factors such as system configuration, geographical placement, and climatic conditions. Table 1 provides a summary of various research works conducted to evaluate the potential of SDSE for reliable performance and economic feasibility in Jordan.

Table 1.
The SDSE in Jordan.
The first step in this article’s methodology is to forecast the likelihood of weather that would allow solar radiation to reach Mafraq, Jordan. Calculating the electrical power needs of the residence, which changes depending on the type of housing, and its purpose, in addition to the regional electrical grid, will be the second process. The total energy generated by a tilting SDSE installed in Mafraq will then be calculated weekly, making it easy to ascertain when the engine is producing its greatest energy. The intervals of the day when electricity is most in demand, when sun radiation is at its optimum level, and when the cost of electricity is at its peak will then be determined by combining these data with the rates of electric energy utilities.
Determining the potential financial gain from installing SDSE systems in Jordan’s construction industry presents both possibilities and challenges. Among the most important challenges to be addressed is the dearth of reliable information on the patterns of energy usage and solar radiation levels in the area. To this end, it would be a challenge to estimate with any degree of accuracy how much energy a solar system will generate and how much the building owner will save in the process. Moreover, numerous building proprietors may consider the initial costs of implementing an SDSE system to be prohibitively costly. This is particularly challenging considering the restricted sources of financing and current regulations. However, there are plenty of possibilities for energy conservation and negative environmental impacts with an SDSE system. Jordan is an excellent region for generating solar energy as it receives sufficient sunshine. Homeowners can cut down significantly on how much oil and coal they use to make electricity and also lower their release of harmful air gases by using this green power source. Moreover, the money spent on installation might be made back through the savings on electricity bills. There are a few reasons why determining how much power an SDSE system can generate in a Mafraq home can be challenging. However, because of its benefits, people who want to save money on electricity while also helping the environment may find this configuration worthwhile [42,43].
The electrical profit evaluation of a solar system installed in a specific location in Jordan marks a significant step forward in the fields of renewable energy sources and environmentally conscious construction. The impending need to minimize greenhouse gas emissions and migrate away from fossil-fuel-powered energy sources motivated this study. This research focuses on the possible electrical benefits of adding solar power to a Jordanian home, and it provides thorough information on the costs and viability of renewable energy solutions in this specific setting. This study is important since it investigates a particular building in Jordan and takes into account several environmental and economic factors that are needed for correctly determining whether solar power can provide energy economically. Both factors must be addressed when evaluating a solar system’s economics. This examination lays the groundwork for future studies on deploying environmentally conscious electrical infrastructure in regions with similar temperatures and energy requirements, especially the Middle East. The study’s greatest contribution comes from improving energy policies and sustainable building designs, which will contribute to a powerful future that is both more reliable and secure. This represents the primary research effort.
This article provides a thorough analysis of a hypothetical SDSE power station situated both onshore and utilized to produce electricity at the utility scale (accounting for elements related to equality, engineering, electricity, economy, and the environment). In addition, the study investigates several aspects of the facility, including the engineering design, equality of access, environmental effect, energy cost, and system efficiency [44,45]. The goal of this study is to examine the energy efficiency of a utility and a 5.5 MW SDSE power source operating in a tropical rainstorm environment with a predominance of rain. The research uses the MATLAB/Simulink-2019 simulation models to look at the system output energy, productivity and viability from a financial standpoint. In addition, the analysis considers the local environmental conditions and weather patterns. With an SDSE system, this 150-square-meter building in Mafraq, Jordan, can make the most profit possible. The study considers solar radiation, weather, and the energy of the building consumption in addition to Jordan’s electric energy demand and pricing for energy.
2. Methodology
2.1. Geographical Location
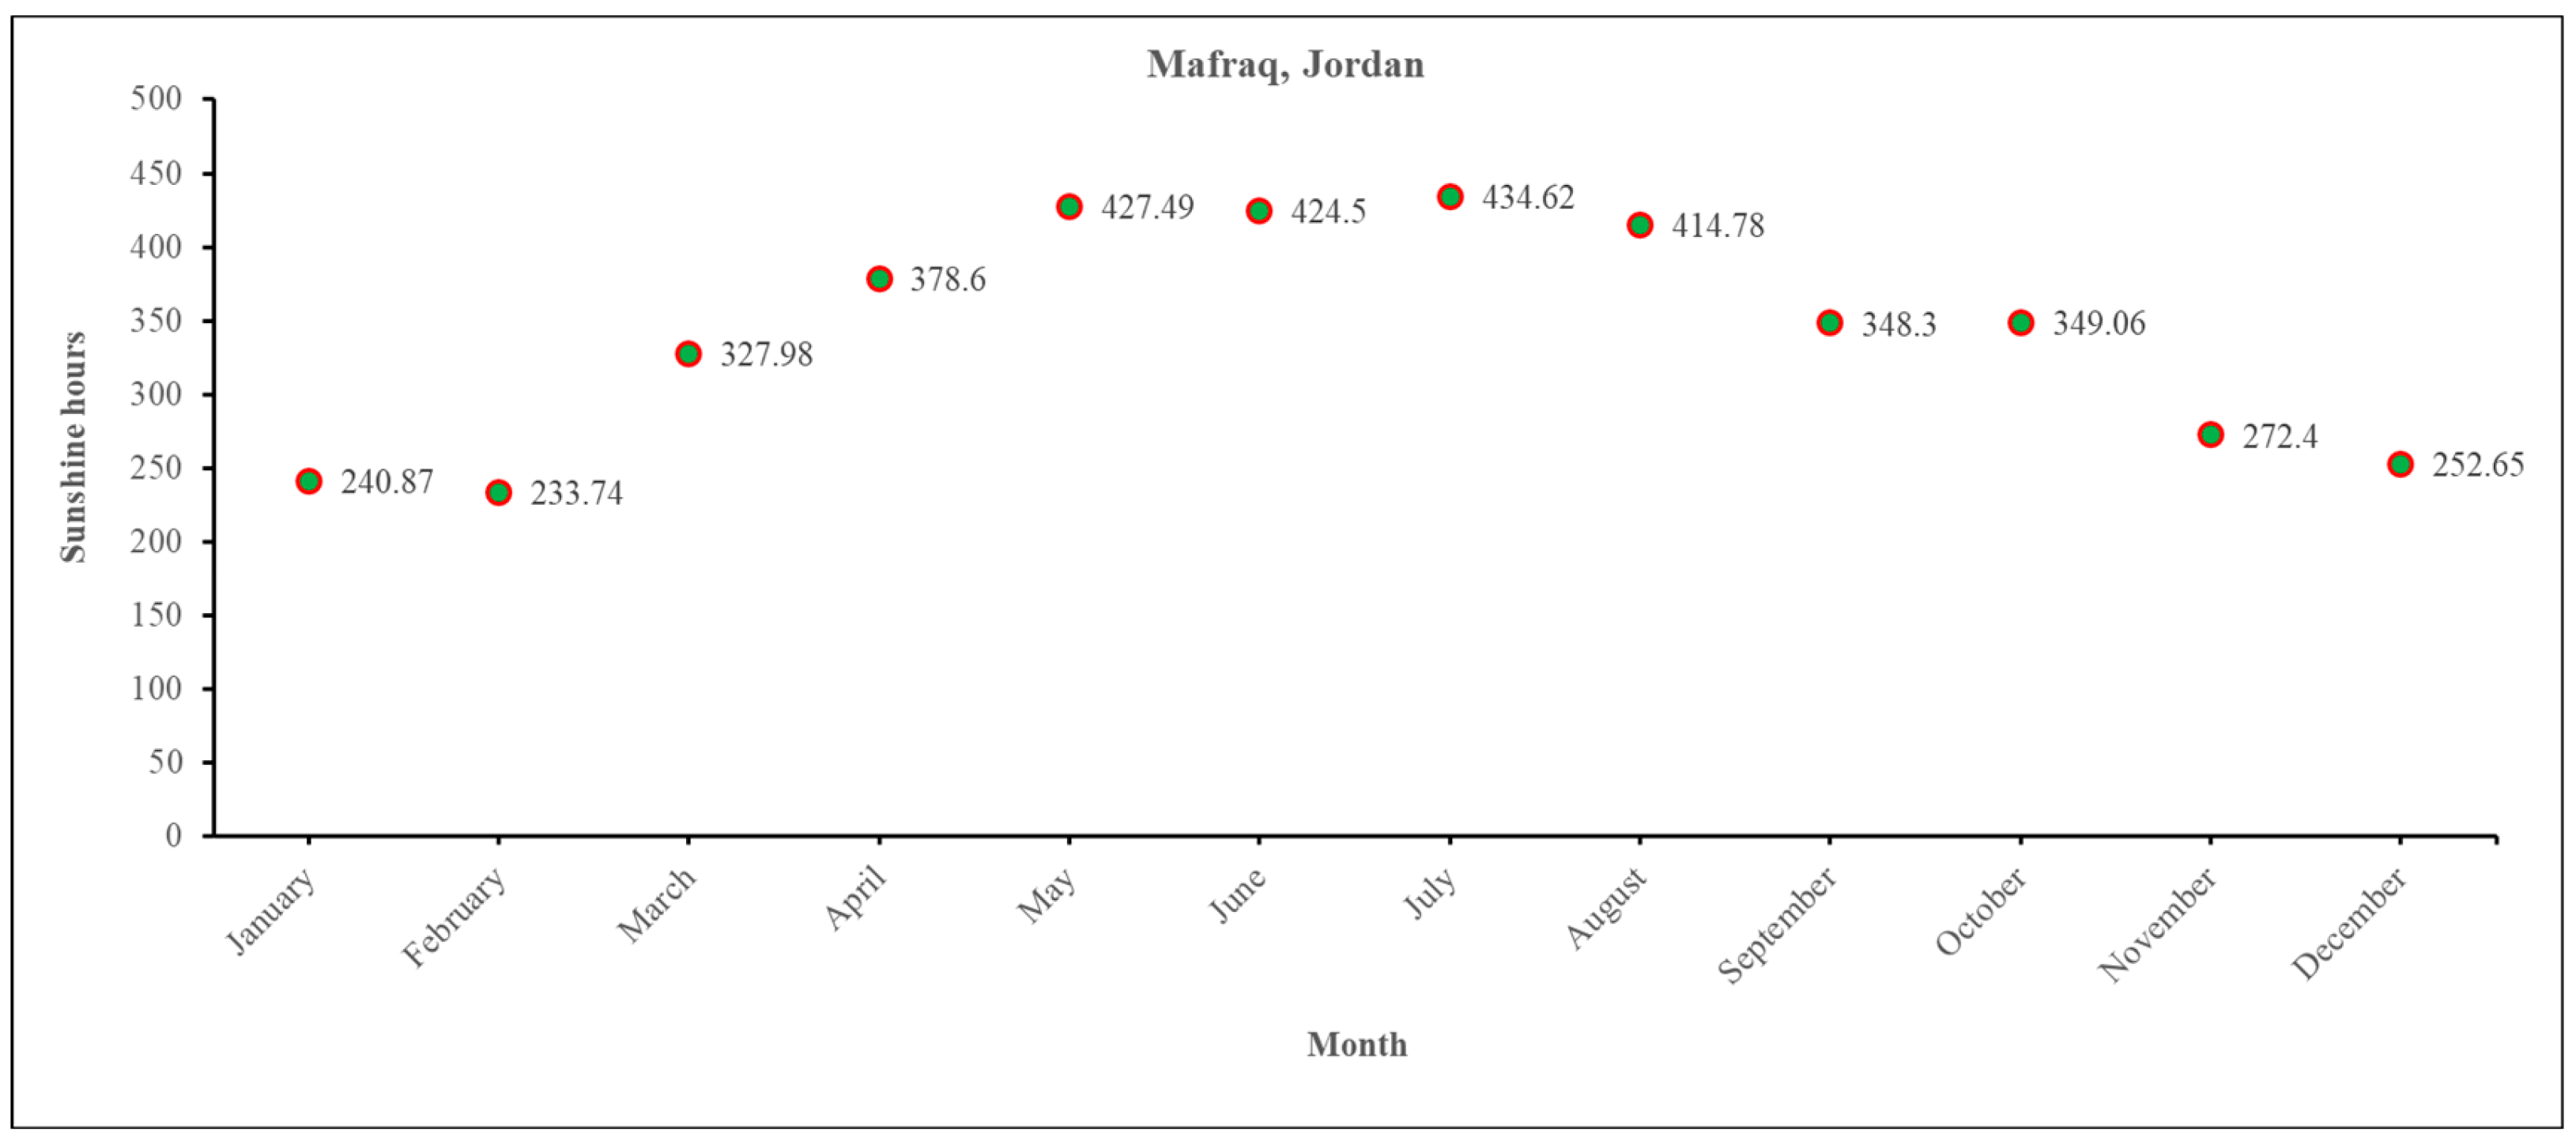
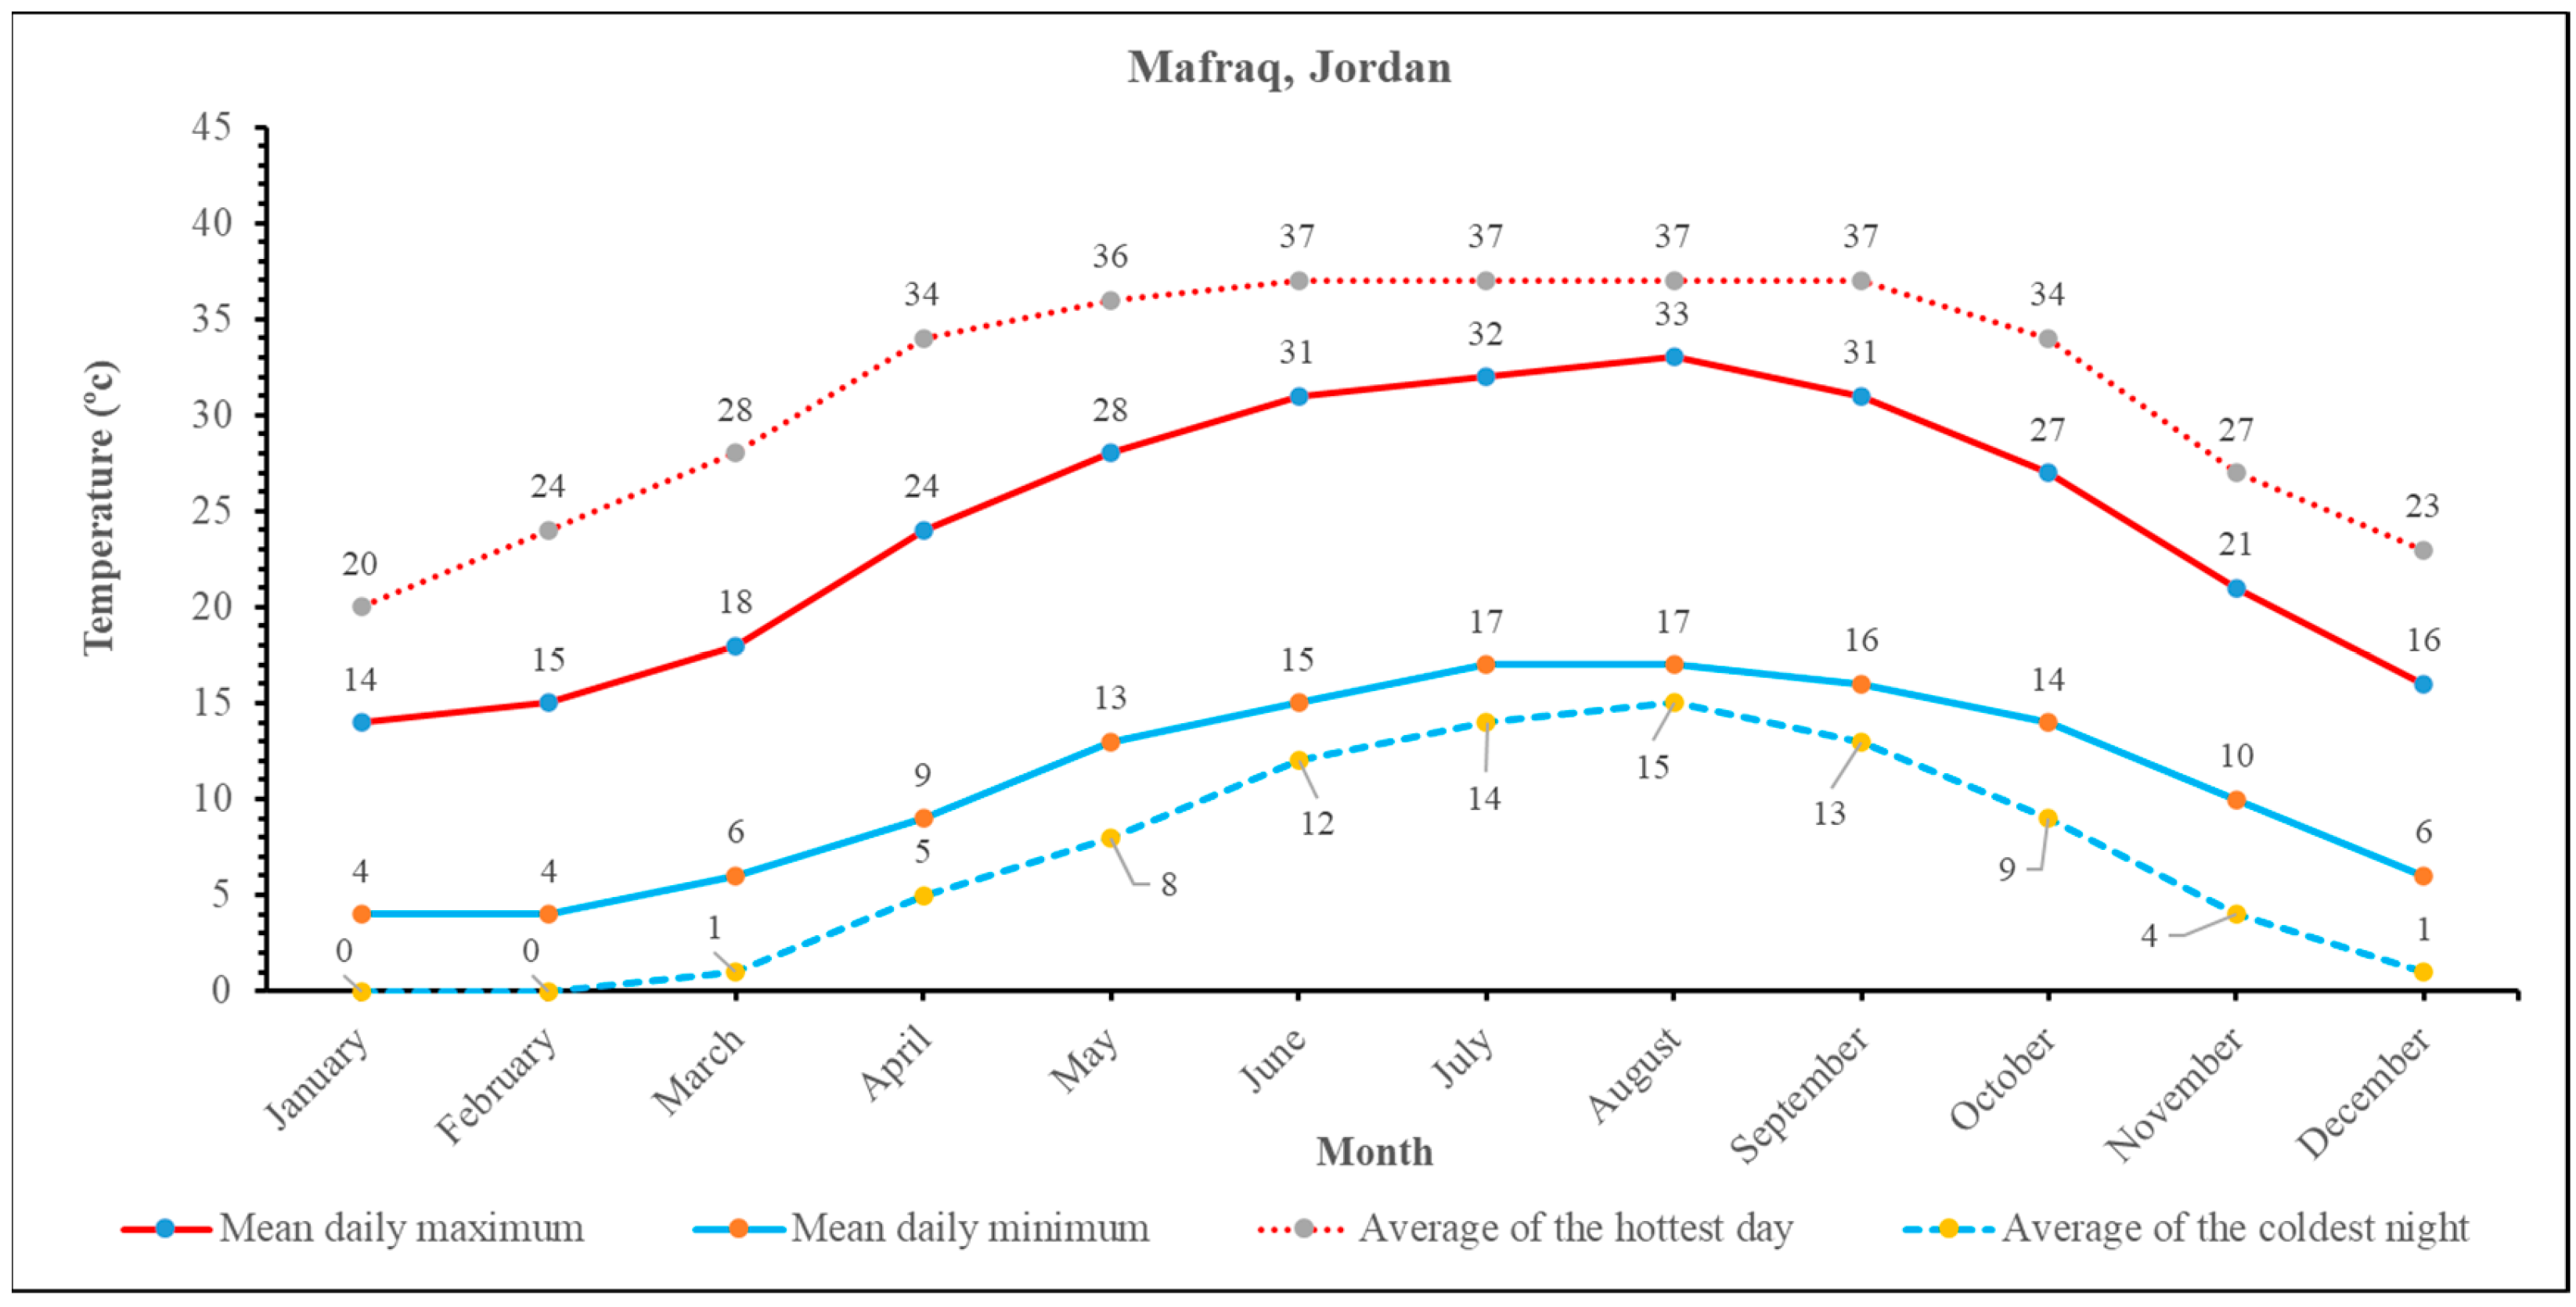
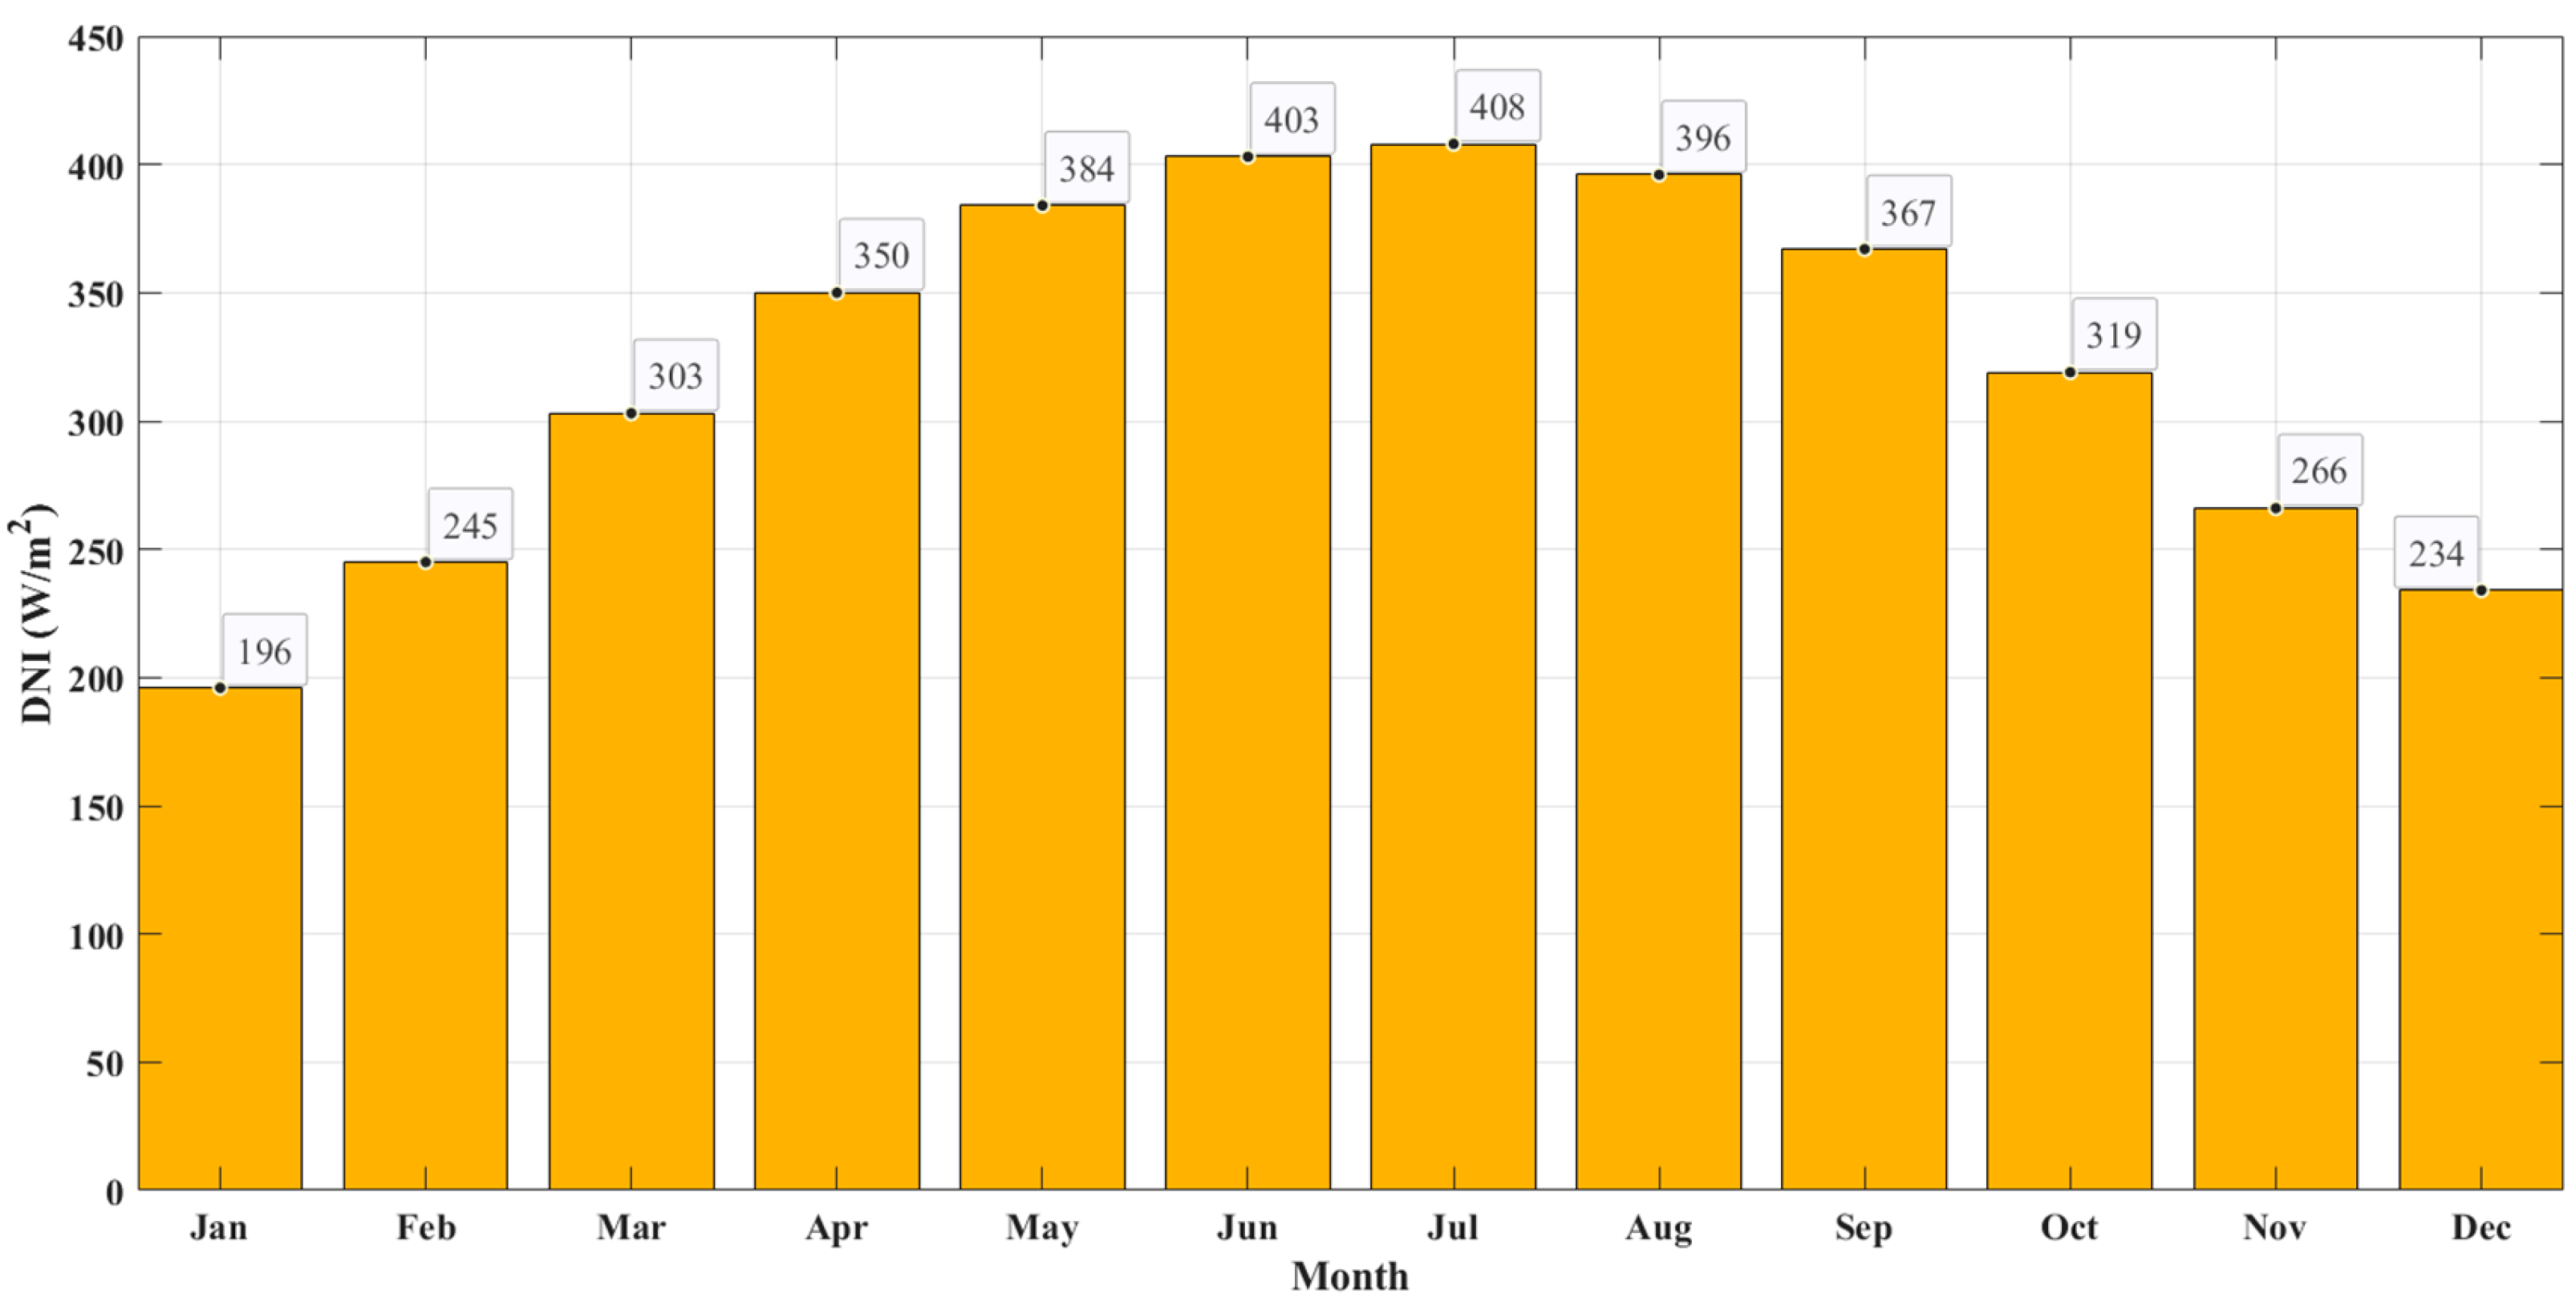
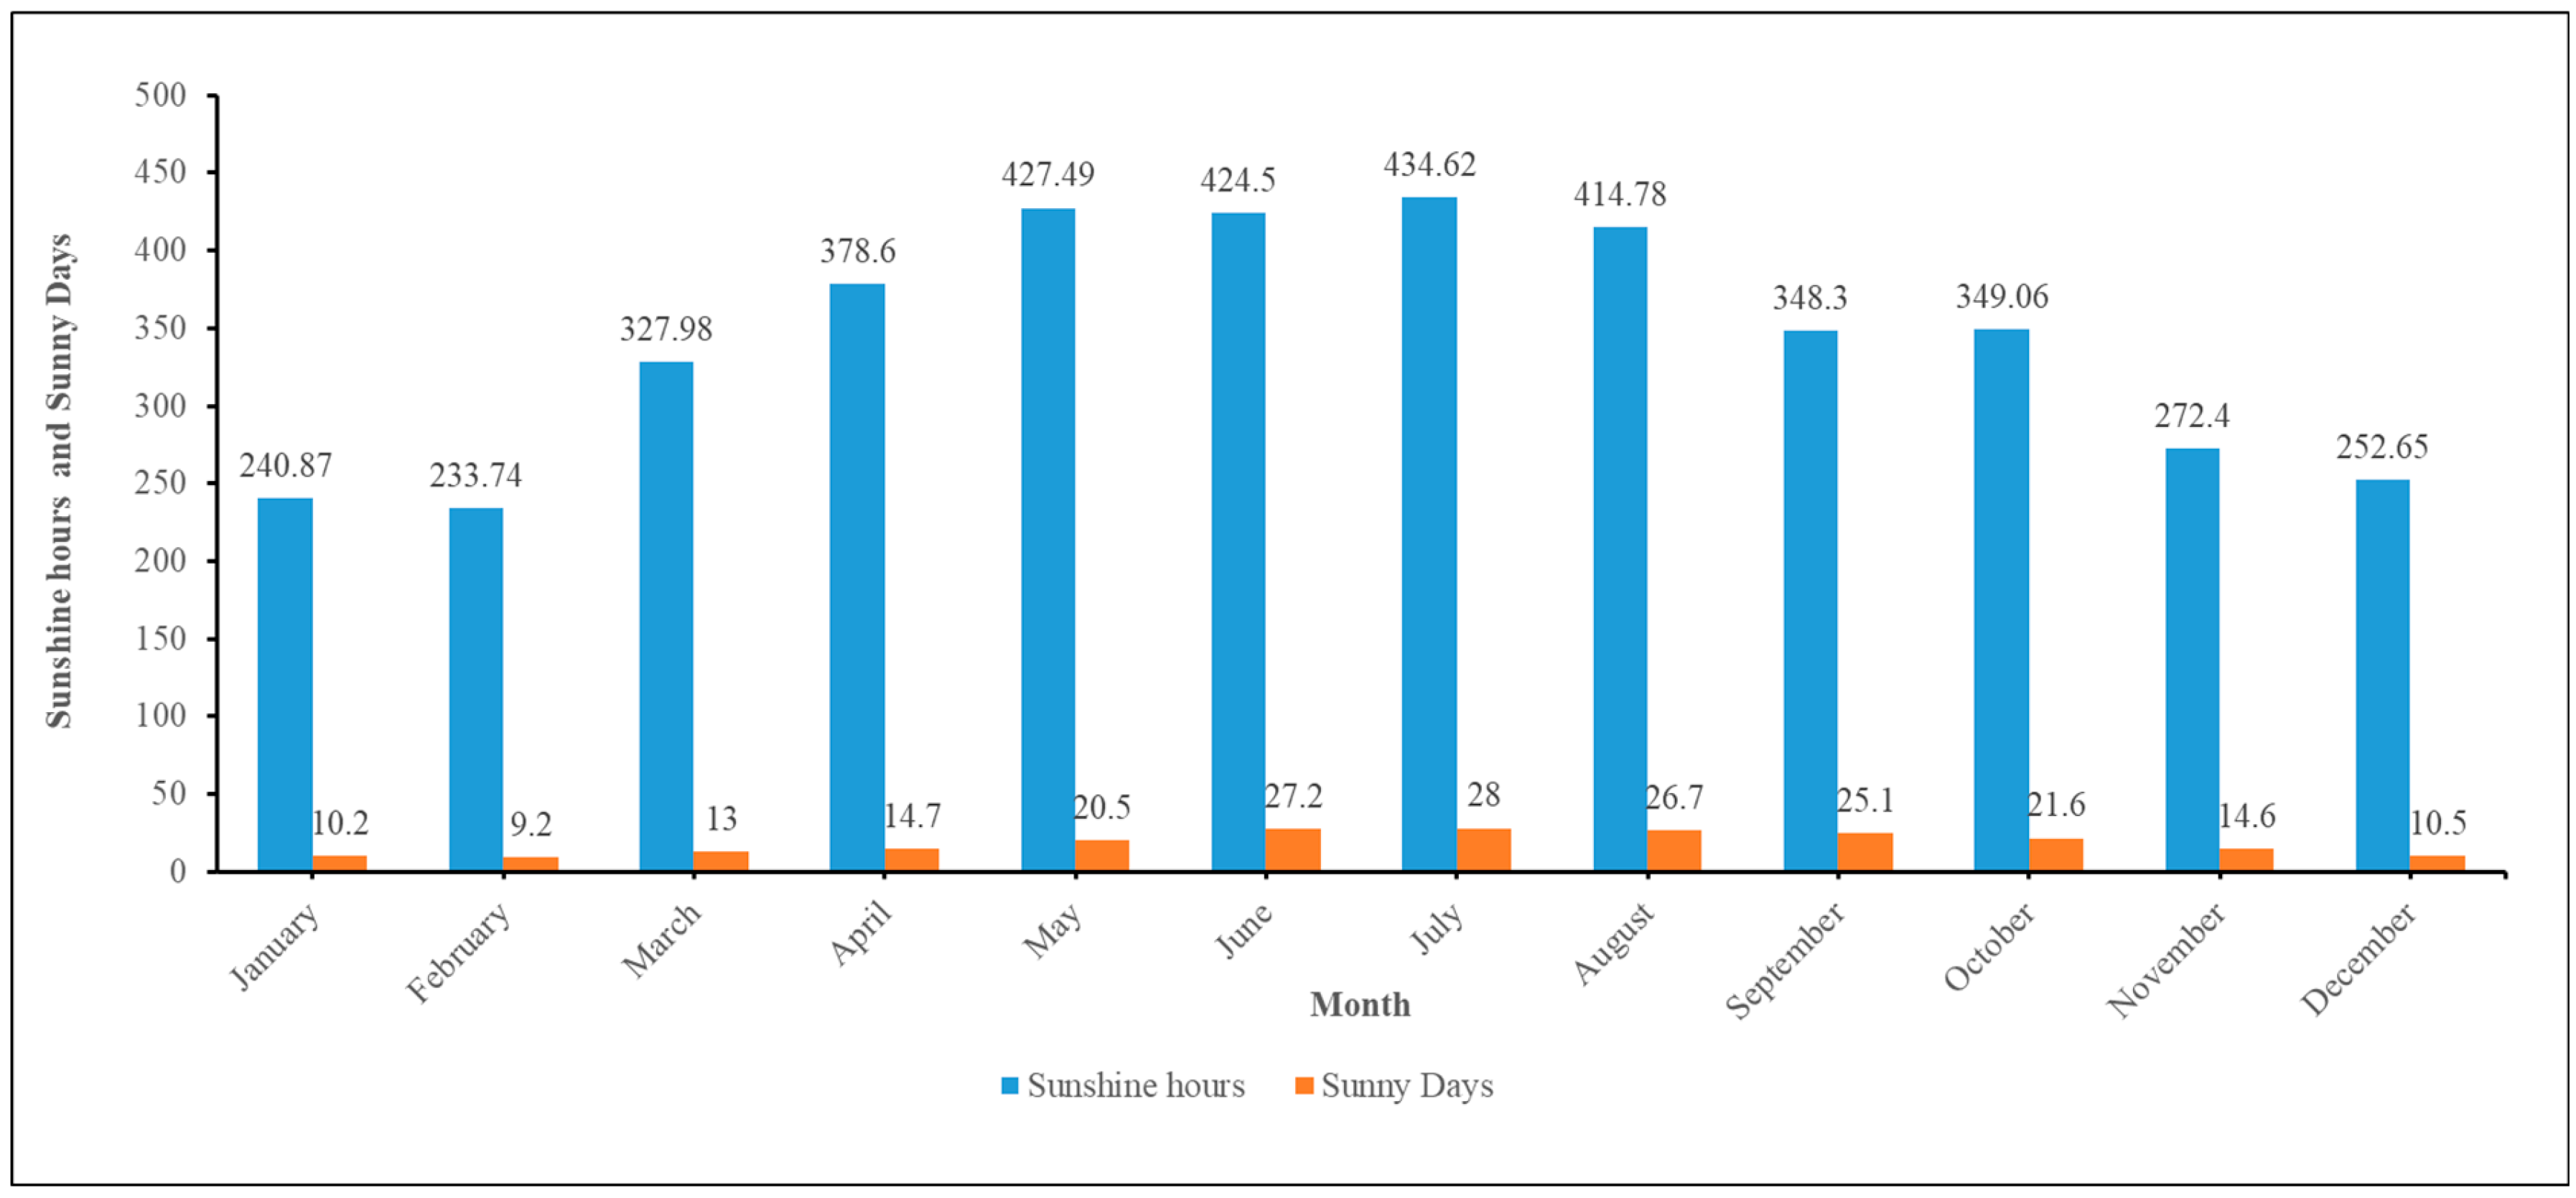
Mafraq, Jordan’s northernmost city, is located at 37.917983° E longitude and 32.449521° N latitude. Mafraq is becoming recognized as one of the sunniest regions in terms of the number of hours of sunlight, which exceeds 4105 each year, one of the greatest numbers worldwide, as seen in Figure 1 [46]. Figure 2 shows the maximum and lowest temperatures, as well as their respective values, for every month in Mafraq. The average highest temperatures are shown by the mean daily maximum (solid red line). Additionally, the mean daily minimum (solid blue line) shows the average lowest temperatures. The dashed red and blue lines show the average maximum temperature and minimum temperature at night for each month during the preceding 30 years [47]. The maximum average of June, July, August, and September showed captured temperatures. January, February, and December were the coldest months. Furthermore, the average monthly DNI values in the selected location are shown in Figure 3.
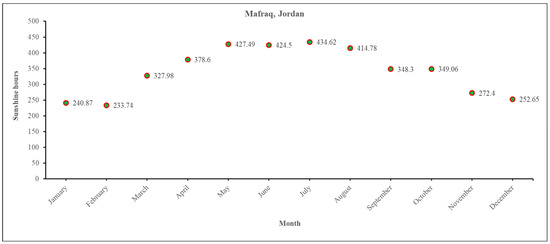
Figure 1.
Sunshine hours in Mafraq, Jordan.
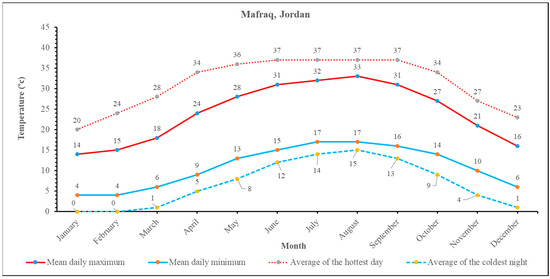
Figure 2.
The average daily highest and average daily lowest, and average of the hottest day and coldest night temperature in Mafraq, Jordan.
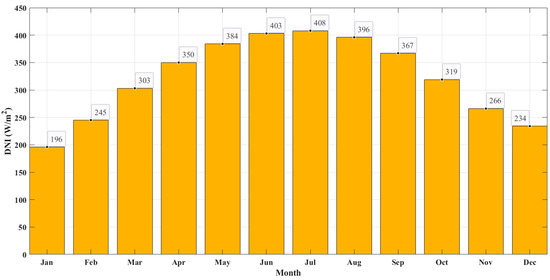
Figure 3.
Average monthly DNI values in Mafraq.
An SDSE system is needed for a residential structure in Mafraq, Jordan, to meet the expected 622.25 kWh of energy use per month. The single-story building has one family unit and is situated in a rural part of the city. Along with plenty of natural light and contemporary design elements, it boasts huge windows that offer spectacular views of the surroundings. To reduce energy consumption, the facility is outfitted with some energy-efficient equipment, such as LED lighting and effective heating and cooling systems. The locals are dedicated to lowering their carbon impact and living sustainably. Utilizing the year-round abundance of sunshine that Mafraq receives, an SDSE system will be built on the building’s rooftop. The system will consist of an efficient SDSE, inverter systems, and a system of batteries to store additional energy for usage at nighttime or on cloudy days. In addition to lowering electricity costs, the SDSE system will assist tenants in lessening their dependency on fossil fuels by supplying clean, renewable electricity for the shared areas of the residence, lights, equipment and charging facilities for electric vehicles. Mafraq’s occupants will live in a greener future thanks to the solar dish system, and this will demonstrate the building’s commitment to environmental sustainability in a visible way.
2.2. Methodology Data
To enhance the productivity of the SDSE system, it needs to be determined how much electricity a Mafraq, Jordan, apartment complex may generate. The prediction technique involves estimating the energy production from the SDSE system by analyzing solar radiation data, historical conditions, and other relevant information. Users may develop strategies about how to store and utilize electricity with the support of property owners and managers, who can more effectively organize and handle the consumption of electricity by turning this forecast into reality. The forecasting accounts for fluctuations in sun irradiation throughout the year, meteorological conditions, and the performance of the solar dish system to generate accurate predictions for electricity production. Furthermore, it evaluates the energy usage patterns of the property to enhance demand-side scheduling and load shifting. Generating electricity forecasts helps the SDSE system fulfill the residence’s demand for energy by preventing an excess or shortage and increasing solar energy utilization. Through proactive energy management, Mafraq’s home development may maximize energy efficiency, decrease reliance on the grid, and enhance the degree of energy’s long-term sustainability. The electricity rates in Jordan are tier-based, which are based on the monthly kWh consumption of the client, as shown in Table 2 [48,49].
Table 2.
The monthly electricity pricing structure in Jordan for residential users includes both official and subsidized rates.
The monthly power usage in a year, the average consumption, and the total yearly consumption at the chosen location (150 m2 home) are shown in Table 3. In addition to being high in the winter, summer consumption is shown to increase, peaking at 759 kWh in March. Additionally, it is noted that 951 kWh was consumed in February. Consequently, summer and winter indicate higher energy consumption due to the home’s increased usage of electrical equipment throughout these two seasons. Fall and springtime consumption is likewise reduced. This residence uses a total of 7467 kWh yearly, or 622.25 kWh on average every month.
Table 3.
Energy consumed per month of the year 2023.
2.3. Simulation Model
This section provides an explanation of the methodology used to model the selected SDSE system’s architecture. In order to evaluate the SDSE scheme’s energy and financial efficacy under all operational situations in Mafraq, this model was created. The primary goal herein is to provide a thorough understanding of the functioning of the suggested SDSE unit to support the conclusions drawn from the research’s findings.
2.3.1. Modelling Toolbox
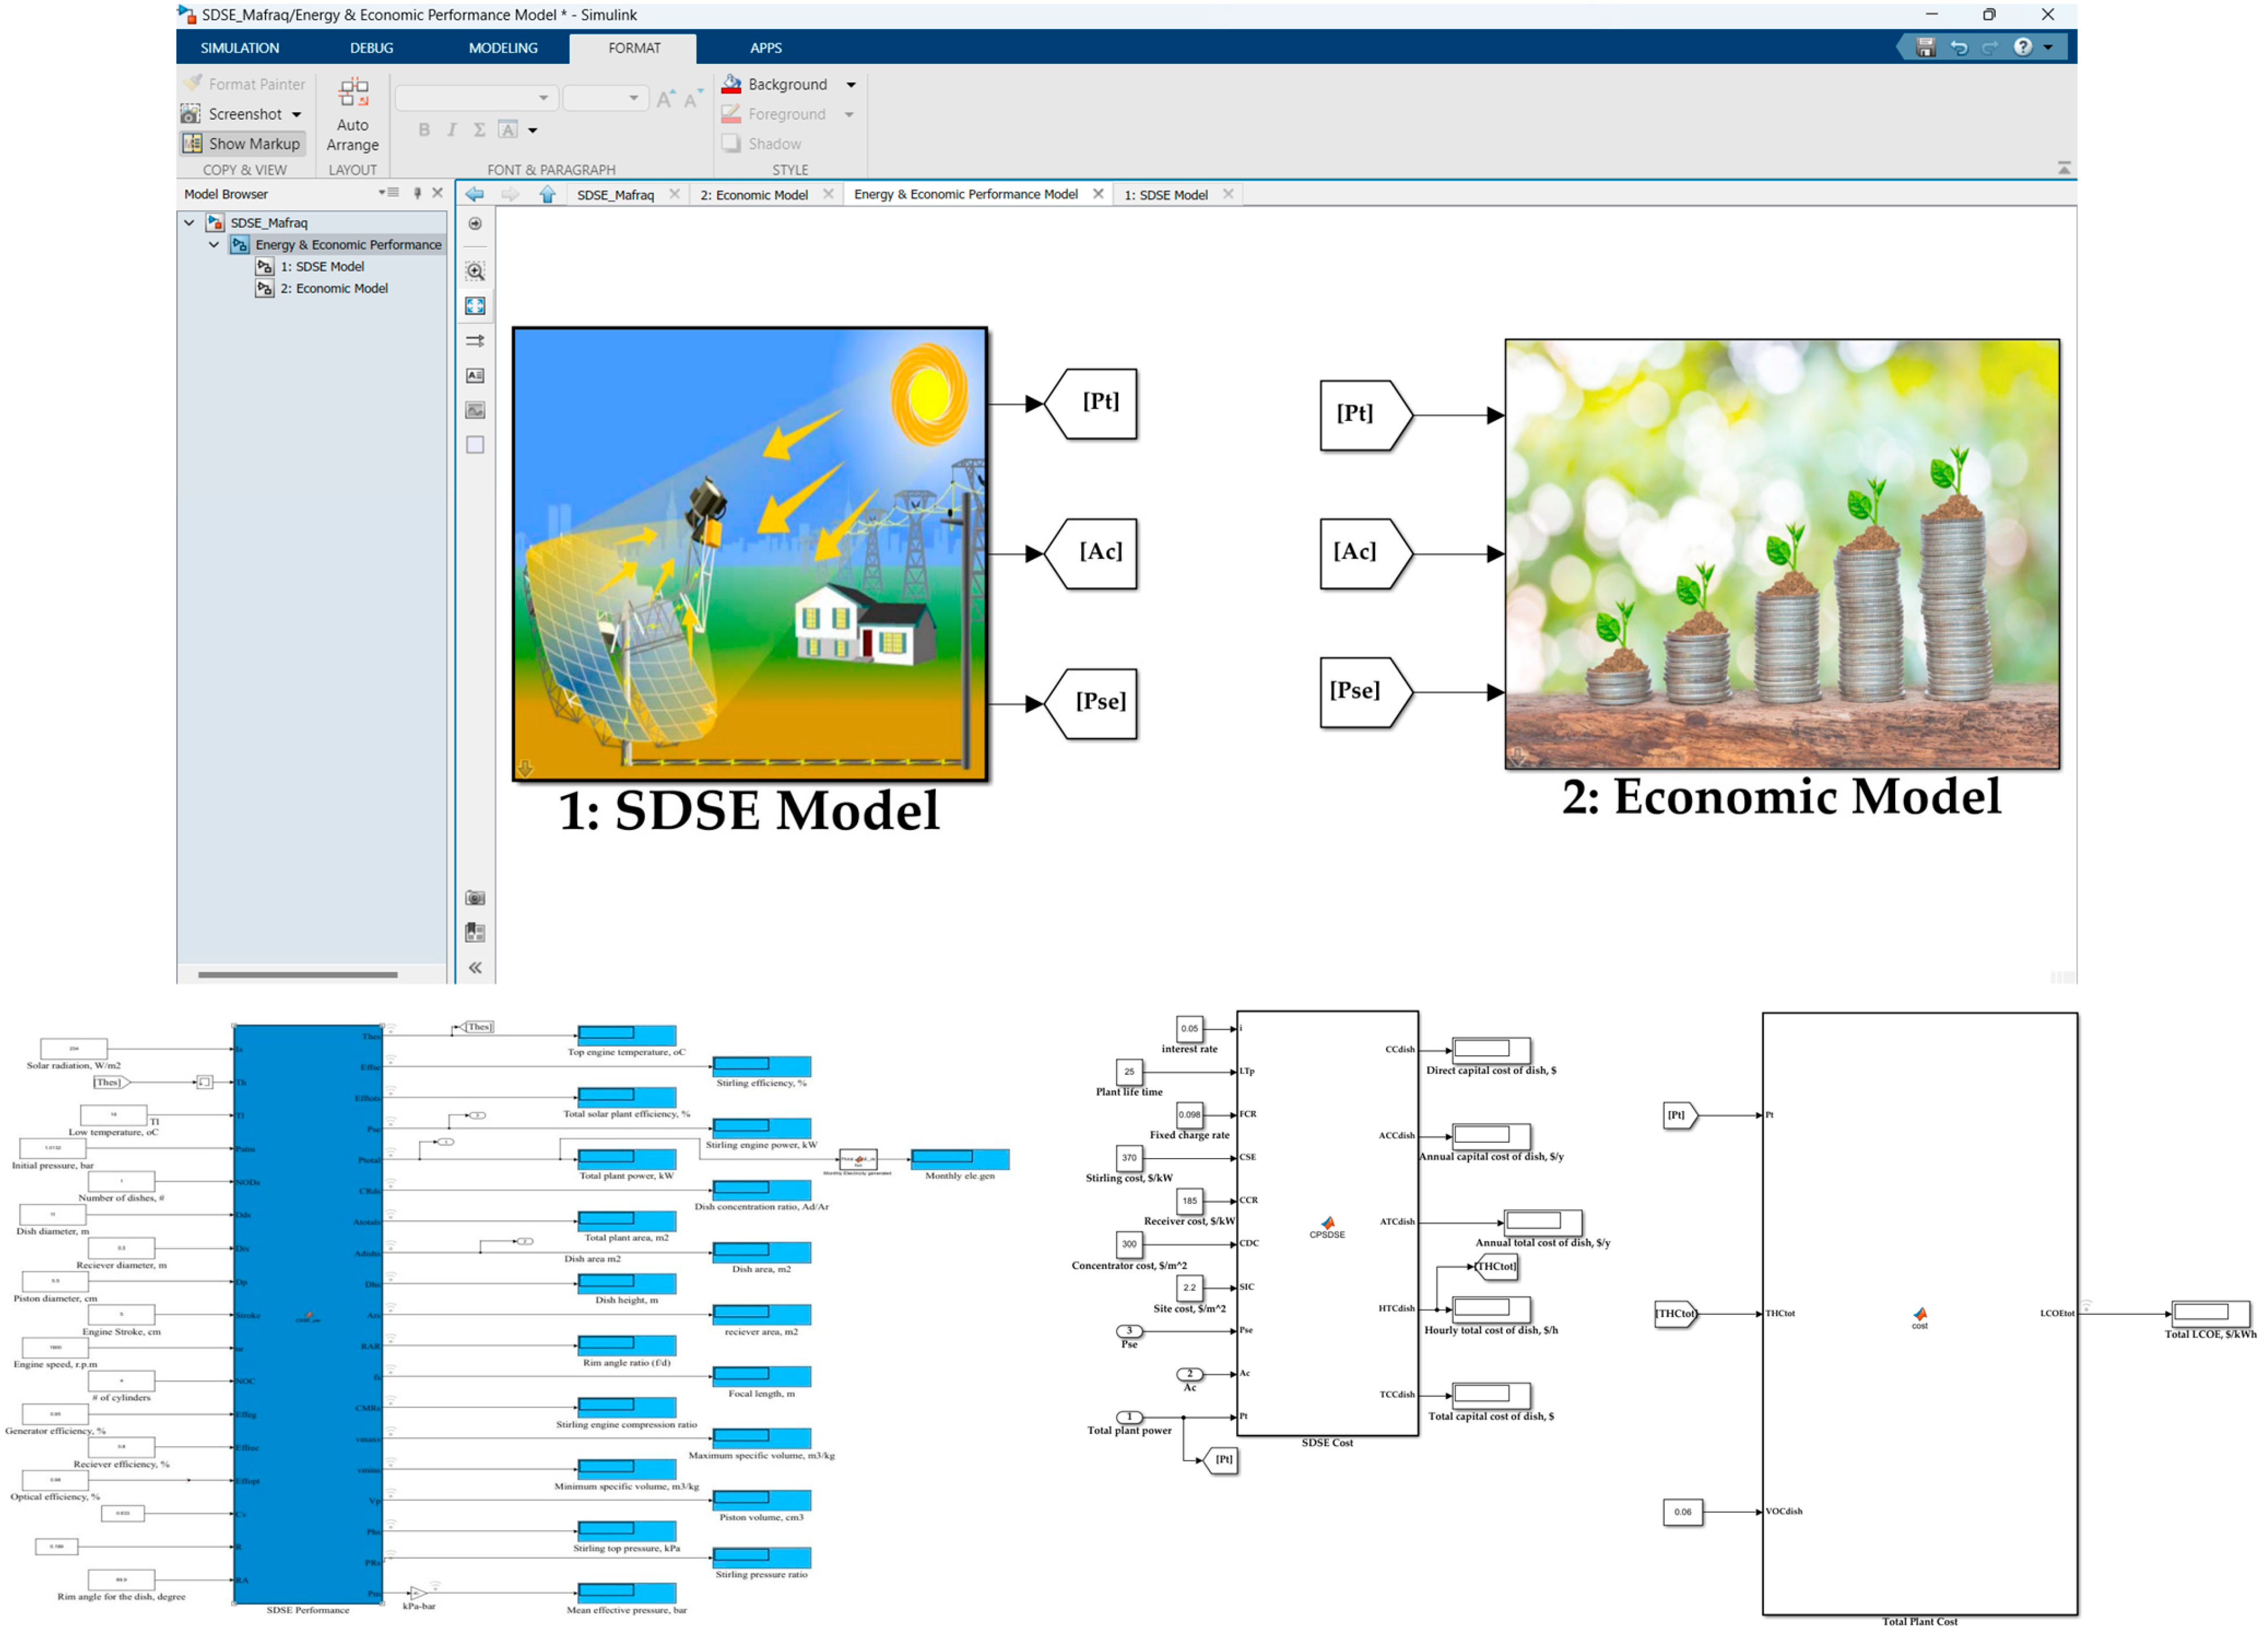
The performance assessments were analyzed using a variety of instruments and techniques. This section emphasizes the importance of using MATLAB/Simulink-2019. This inclination stems from its user-friendly characteristics and capacity to produce good results. The revolutionary MATLAB/Simulink-2019 programming tool, developed by MathWorks in the USA, allows for advanced modeling processes to be designed for both on-grid and off-grid hybrid energy systems [50,51]. It is important to identify the pertinent technical and financial factors, including power loads, rated power, operational circumstances, equipment and energy prices. This tool can compute total expenses and produce energy balances. Therefore, the design and performance analysis for SDSE has been carried out using the MATLAB/Simulink-2019 software package. Figure 4 illustrates the author-developed user-friendly model browser of the proposed system.

Figure 4.
Screenshot of the developed model browser in the MATLAB/Simulink-2019 toolbox environment.
2.3.2. SDSE Analytical Model
This section presents the SDSE’s mathematical formulas. These mathematical equations usually incorporate evaluations of the SDSE variables, which are SE, the dish concentrating device, the cavity recipient, and the alternator, as described in Formulas (1)–(7) [35,36]. The thermal energy balancing model generates electricity based on the rate of solar incidence on the dish reflectors; however, the produced thermal power is not taken into account in this inquiry. As a result, the energy balance of the constructed thermodynamic model was accomplished by taking into account the following presumptions:
- Due to their smallness, conduction heat exchanges at the point of reception are disregarded.
- There is no consideration for optical heat loss.
- The heat that the SE emits is disregarded.
- There are details on the receiver, concentrating device, and generation efficiency.
The dish area, m2, can be calculated using the following relation:
where is dish diameter (m), and is the dish area (m2).
The SDSE efficiency of the thermal evaluation framework is derived from the following formula [51]:
where is the SDSE efficiency of the thermal evaluation framework (%), is the lower cycle temperature (°C), and is the high cycle temperature (°C).
An optical efficiency is calculated by providing the device’s reception efficiency [52]:
where is the optical efficiency (%), is the concentrator efficiency (%), and is the receiver efficiency (%).
The overall efficiency of this module is capable of being expressed as [26]:
where is the overall efficiency (%), and is the generator efficiency (%).
The Stirling engine power, kW, is given by:
where is the Stirling engine power (kW) and the DNI is the direct normal irradiation (kWh/m2).
The total plant power of SDSE (kW), where one dish is considered in this analysis, can be estimated as:
where is the total plant power of SDSE (kW), and is the number of solar dishes.
The annual electricity generation, kWh, can be found using the subsequent relation:
where is the annual electricity generation (kWh), and is the operating hours (h).
2.4. Economic Model
A cost-efficient model was formulated in this work to evaluate the financial performance of the SDSE system using the levelized cost of energy (LCOE) technique. The LCOE technique delivers a rigorous evaluation of the system’s total costs over its lifespan, covering capital, operational, and maintenance expenditures. The economic performance of the SDSE system is assessed by calculating the LCOE using mathematical models in MATLAB/Simulink®. Common inputs for the analysis are the part’s lifespan, rate of return, and variable operational costs. Table 4 summarizes the key indices and parameters relevant to the economic model [35].
Table 4.
The input specifications for the SDSE system.
Table 4 displays the design variable inputs for the suggested SDSE as well as the simulation outcomes, including the monthly electricity generated, the Stirling engine efficiency, the total efficiency, and the LCOE.
The total LCOE is determined by dividing the total operating cost of an SDSE system throughout its entire life cycle by the energy it produces during that period. The representation of LCOE can be expressed as JOD/kWh [35,39]:
where is annual costs.
3. Results and Discussion
Positioned in the sunbelt, Jordan enjoys lengthy stretches of sunny weather. A yearly value of 1600–2300 kWh/m2 is associated with Jordan’s average daily solar irradiation, which typically falls between 5 and 7 kWh/m2/day [52,53]. An average of 300 bright days [54]. As a result of its climate and geographic location, Jordan, in general, benefits substantially from powerful solar resources. As a viable alternative, solar energy technologies are available in places like Mafraq where there is year-round access to abundant sunshine.
Figure 5 illustrates Mafraq’s potential for large-scale solar power development due to its extended sunny seasons. Table 5 shows the parameters considered in the economic model analysis. Table 6 presents meteorological statistics for Mafraq, including air temperature, solar radiation, and the ideal tilt angle. In addition, Table 7 displays the average amount of time that peak sunlight occurs each month and year, which is used to calculate the solar dish system’s size and capacity.
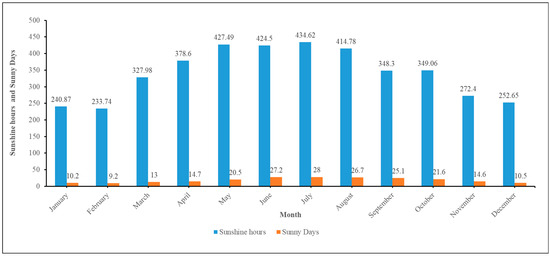
Figure 5.
The monthly duration of sunshine in Mafraq, Jordan, including days and hours.
Table 5.
The parameters considered in the economic model analysis.
Table 6.
Meteorological information of the selected site.
Table 7.
Average peak sun hours per month and year at the adopted site.
Two dependable sources, the Jordan Meteorological Department [46] and the Global Sun Atlas [47], have provided meticulously compiled monthly average sun radiation statistics for the selected station. The mean monthly sun irradiation data for the assigned station are presented clearly in Figure 6. The data shown in Figure 6 clearly shows that the incidence of solar energy is significantly higher in the designated region, especially during the summer months. Solar energy levels at this time reach 7 to 8 kWh/m2/day for GHI on horizontal surfaces and 8 to 9 kWh/m2/day for DNI on parabolic surfaces. To provide an example, consider the data in Figure 5, which shows that the daily GHI and DNI values fluctuate between 2.94 and 4.68 kWh/m2 in December to 8.32 and 9.65 kWh/m2 in June, correspondingly.
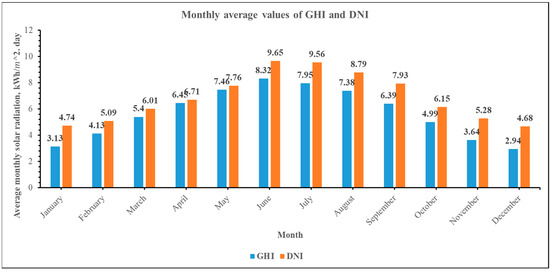
Figure 6.
The sun irradiation received by the station’s horizontal and concave surfaces measured monthly and averaged by GHI and DNI.
Figure 7 shows the relationship between the SDSE system’s monthly energy generation (kWh) at various optical efficiencies. The chart shows that energy generation rose in tandem with increases in optical efficiency; in July, the greatest energy generated was 2286.83 kWh. Furthermore, a decrease in optical efficiency corresponded to a decrease in the generated energy output; in January, the lowest generated energy was 302.37 kWh. Additionally, the chart illustrates that in the maximum demand case in February, with an optical efficiency of about 85%, the energy output based on various optical efficiencies is more than sufficient to meet the demands.
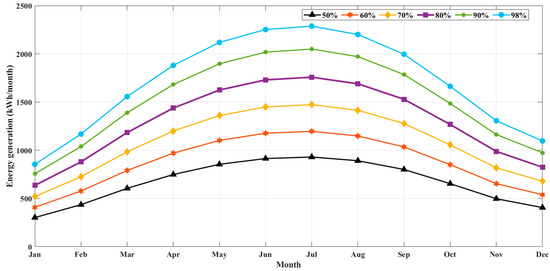
Figure 7.
Average monthly electric energy production of an SDSE system at different optical efficiencies.
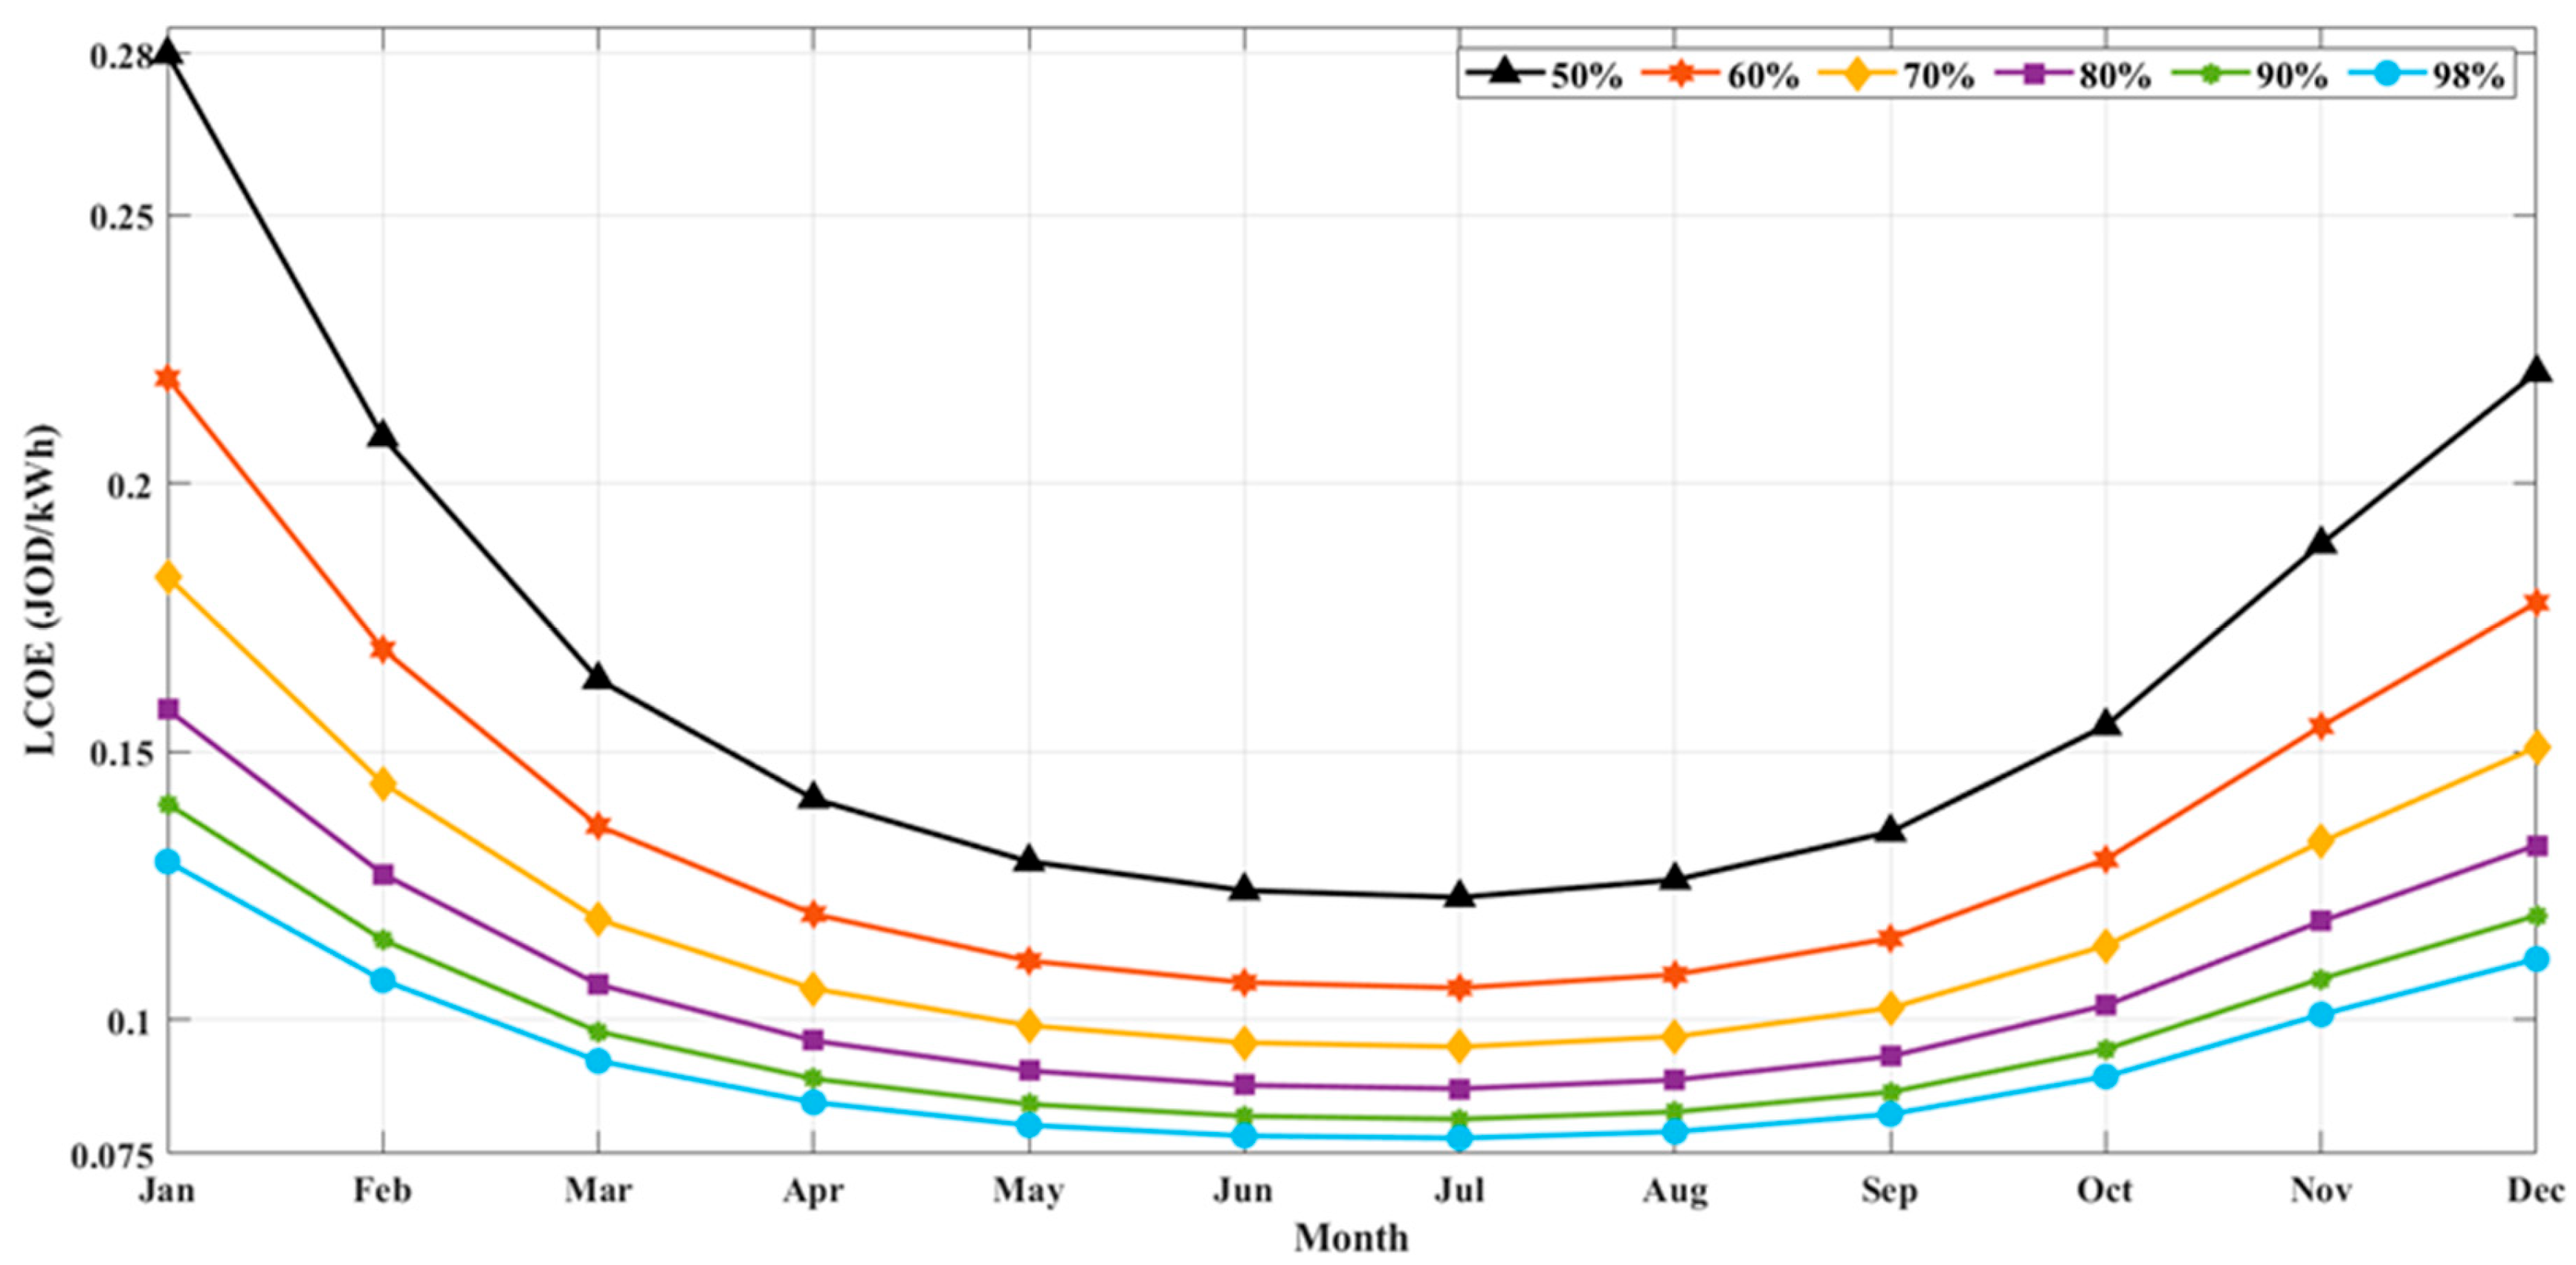
Figure 8 shows the monthly profit (JOD/kWh) of the SDSE system at different optical efficiencies. The chart shows that LOCE (JOD/kWh) rose in tandem with a decrease in optical efficiency; in January, the greatest LOCE was 0.280 JOD/kWh, when the optical efficiency was equal to 50%. Furthermore, when the optical efficiency increases to 98%, the lowest cost price occurs in July, in which the LOCE is 0.078 JOD/kWh.
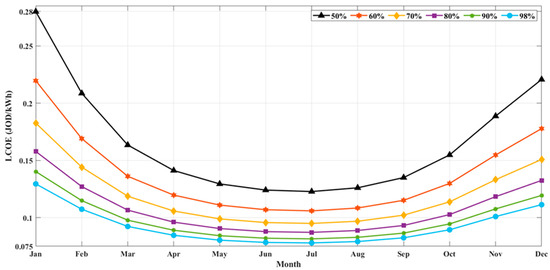
Figure 8.
Benefits of the SDSE platform at different optical efficiencies for each month.
Figure 9 illustrates the monthly electricity cost (JOD) of the selected demand based on three different scenarios, namely subsidized electricity tariff (JOD), official electricity tariff (JOD) and the SDSE platform at 98% optical efficiency. It is clear from the figure that the electricity cost calculation based on the official electricity tariff (JOD) is more expensive compared with the cost based on the subsidized electricity tariff, especially at low demand value. Based on the monthly electricity pricing structure in Jordan for residential users, including both the official and subsidized rates shown in Table 2, the electricity price is equal for both official and subsidized rates at around 930 kWh. After that, the electricity price of the official tariff demand is less than the electricity price of the subsidized demand. This gives a scientific explanation for the electricity price in February. On the other hand, the cost of using the proposed SDSE platform at 98% optical efficiency shows a reduction in electricity costs especially at high demand value. As a result, the chart illustrates that the LOCE prices of the SDSE system at different optical efficiencies are comparable and less than the price of the power utility at high power demand.
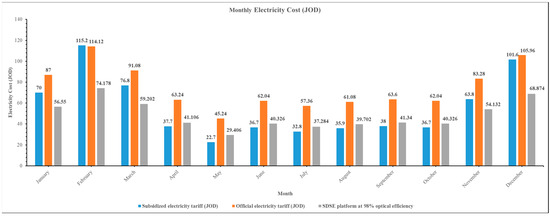
Figure 9.
The monthly electricity cost (JOD) comparison based on the subsidized electricity tariff (JOD), the official electricity tariff (JOD) and the SDSE platform at 98% optical efficiency.
4. Conclusions
This research looked at the feasibility of building an economically and logistically optimal solar dish system. To optimize the effectiveness of a solar dish system placed in a house for residential purposes in Mafraq, Jordan, a framework for making decisions was established. This study used a cutting-edge technique to predict how much power solar dish installations will produce. The conclusions of the case study showed that it is advantageous to consider the rates that electric energy utilities charge when planning to develop a solar dish system. An inclination angle of 37° was considered to be the best option for the solar dish system based on the projected qualities derived from the system for making choices.
Meanwhile, its outcome was the average energy per month, which was calculated as 622.25 kWh, the months of February and December had the highest degree of demand, and the months of May, June, and July marked the lowest demand. It was clear from the data that future projects should be working around construction methods that enable storage of the extra energy generated during peak months and utilize the low demand. This can save more money and lead to more efficient use of the solar dish system. The greatest LOCE in January was 0.280 JOD/kWh when the optical efficiency was equal to 50%. In addition, when the optical efficiency increases to reach 98%, the lowest cost price will occur in July, in which the LOCE was 0.078 JOD/kWh. In conclusion, future research needs to evaluate the price at which the corporation sells the public its electricity. The next research endeavors ought to focus on determining how to store excess energy during periods of low demand and utilize it during periods of high demand.
Author Contributions
Methodology, H.A.K.; Software, B.S.; Validation, H.A.K., B.S., M.A.-S. (Mohammad Al-Smairan) and M.A.-S. (Mohammad Al-Soeidat); Formal analysis, H.A.K.; Investigation, H.A.K.; Resources, H.A.K.; Writing—original draft, H.A.K.; Writing—review & editing, H.A.K. and B.S.; Supervision, D.L. and F.A.; Project administration, H.A.K.; Funding acquisition, D.L. All authors have read and agreed to the published version of the manuscript.
Funding
This research received no external funding.
Institutional Review Board Statement
Not applicable.
Informed Consent Statement
Not applicable.
Data Availability Statement
Data are contained within the article.
Conflicts of Interest
The authors declare no conflict of interest.
References
- IRENA. Geopolitics of the Energy Transformation: The Hydrogen Factor; IRENA: Abu Dhabi, United Arab Emirates, 2022. [Google Scholar]
- Khawaldeh, H.A.; Al-Soeidat, M.; Farhangi, M.; Lu, D.D.C.; Li, L. Efficiency Improvement Scheme for PV Emulator Based on a Physical Equivalent PV-Cell Model. IEEE Access 2021, 9, 83929–83939. [Google Scholar] [CrossRef]
- Khawaldeh, H.A.; Al-Soeidat, M.; Lu, D.D.-C.; Li, L. Fast Photovoltaic Emulator Based on PV-cell Equivalent Circuit Model. In Proceedings of the Energy Conversion Congress and Exposition—Asia, ECCE Asia 2021, Singapore, 24–27 May 2021. [Google Scholar] [CrossRef]
- Holechek, J.L.; Geli, H.M.E.; Sawalhah, M.N.; Valdez, R. A Global Assessment: Can Renewable Energy Replace Fossil Fuels by 2050? Sustainability 2022, 14, 4792. [Google Scholar] [CrossRef]
- Skea, J.; van Diemen, R.; Portugal-Pereira, J.; Al Khourdajie, A. Outlooks, explorations and normative scenarios: Approaches to global energy futures compared. Technol. Forecast. Soc. Chang. 2021, 168, 120736. [Google Scholar] [CrossRef]
- Al Naimat, A.; Liang, D. Substantial gains of renewable energy adoption and implementation in Maan, Jordan: A critical review. Results Eng. 2023, 19, 101367. [Google Scholar] [CrossRef]
- Monna, S.; Abdallah, R.; Juaidi, A.; Albatayneh, A.; Zapata-Sierra, A.J.; Manzano-Agugliaro, F. Potential Electricity Production by Installing Photovoltaic Systems on the Rooftops of Residential Buildings in Jordan: An Approach to Climate Change Mitigation. Energies 2022, 15, 496. [Google Scholar] [CrossRef]
- Hilpert, S.; Dettner, F.; Al-Salaymeh, A. Analysis of cost-optimal renewable energy expansion for the near-term jordanian electricity system. Sustainability 2020, 12, 9339. [Google Scholar] [CrossRef]
- Alrwashdeh, S.S. Energy sources assessment in Jordan. Results Eng. 2022, 13, 100329. [Google Scholar] [CrossRef]
- Altarawneh, N.A.; Murtadha, T.K. Managing engineering challenges in the design and implementation of eco-friendly residential structures. Results Eng. 2023, 19, 101363. [Google Scholar] [CrossRef]
- Al-Falahat, A.M.; Qadourah, J.A.; Alrwashdeh, S.S. Economic feasibility of heating source conversion of the swimming pools. J. Appl. Eng. Sci. 2022, 20, 276–284. [Google Scholar] [CrossRef]
- Qadourah, J.A. Energy and economic potential for photovoltaic systems installed on the rooftop of apartment buildings in Jordan. Results Eng. 2022, 16, 100642. [Google Scholar] [CrossRef]
- Altarawneh, O.R.; Alsarayreh, A.A.; Al-Falahat, A.M.; Al-Kheetan, M.J.; Alrwashdeh, S.S. Energy and exergy analyses for a combined cycle power plant in Jordan. Case Stud. Therm. Eng. 2022, 31, 101852. [Google Scholar] [CrossRef]
- Da Silva, R.P.P.; Amini, S. Energy, exergy and economic analysis for a combined cooling heat and power system: A case study for a university campus. Case Stud. Therm. Eng. 2023, 49, 103393. [Google Scholar] [CrossRef]
- Ren, Z.; Grozev, G.; Higgins, A. Modelling impact of PV battery systems on energy consumption and bill savings of Australian houses under alternative tariff structures. Renew. Energy 2016, 89, 317–330. [Google Scholar] [CrossRef]
- Ashtiani, M.N.; Toopshekan, A.; Astaraei, F.R.; Yousefi, H.; Maleki, A. Techno-economic analysis of a grid-connected PV/battery system using the teaching-learning-based optimization algorithm. Sol. Energy 2020, 203, 69–82. [Google Scholar] [CrossRef]
- Dhimish, M.; Ahmad, A.; Tyrrell, A.M. Inequalities in photovoltaics modules reliability: From packaging to PV installation site. Renew. Energy 2022, 192, 805–814. [Google Scholar] [CrossRef]
- Kut, P.; Pietrucha-Urbanik, K. Most Searched Topics in the Scientific Literature on Failures in Photovoltaic Installations. Energies 2022, 15, 8108. [Google Scholar] [CrossRef]
- Bhalkar, A.; Wadekar, A.; Wagh, M.; Dengle, S. Issues, challenges, and current lacunas in design, and installation of ground mounted solar PV module mounting structure (MMS). Mater. Today Proc. 2022, 58, 128–134. [Google Scholar] [CrossRef]
- Dalapati, G.K.; Ghosh, S.; Sherin, T.; Ramasubramanian, B.; Samanta, A.; Rathour, A.; Wong, T.K.S.; Chakrabortty, S.; Ramakrishna, S.; Kumar, A. Maximizing solar energy production in ASEAN region: Opportunity and challenges. Results Eng. 2023, 20, 101525. [Google Scholar] [CrossRef]
- Aboelmaaref, M.M.; Zhao, J.; Li, W.; Ali, E.S.; Askalany, A.A.; Ghazy, M.; Gu, L.; Zayed, M.E. Research on solar dish/Stirling engine driven adsorption-based desalination system for simultaneous co-generation of electricity and freshwater: Numerical investigation. Case Stud. Therm. Eng. 2023, 47, 103044. [Google Scholar] [CrossRef]
- Alhawsawi, A.; Zayed, M.E.; Moustafa, E.; Banoqitah, E.; Elsheikh, A.H. Hybridizing solar dish Stirling power system with single-effect desalination for sustainable electricity and freshwater co-generation: Mathematical modeling and performance evaluation. Case Stud. Therm. Eng. 2023, 45, 102997. [Google Scholar] [CrossRef]
- Khan, M.I.; Asfand, F.; Al-Ghamdi, S.G. Progress in research and technological advancements of commercial concentrated solar thermal power plants. Sol. Energy 2023, 249, 183–226. [Google Scholar] [CrossRef]
- Yan, J.; Peng, Y.D.; Liu, Y.X. Optical performance evaluation of a large solar dish/Stirling power generation system under self-weight load based on optical-mechanical integration method. Energy 2023, 264, 126386. [Google Scholar] [CrossRef]
- Zhang, L.; Han, K.; Wang, Y.; Zhu, Y.; Zhong, S.; Zhong, G. A bibliometric analysis of Stirling engine and in-depth review of its application for energy supply systems. Energy Rev. 2023, 2, 100048. [Google Scholar] [CrossRef]
- Arif, H.; Shah, A.; Ratlamwala, T.A.H.; Kamal, K.; Khan, M.A. Effect of Material Change on Stirnol Engine: A Combination of NiTiNOL (Shape Memory Alloy) and Gamma Stirling Engine. Materials 2023, 16, 3257. [Google Scholar] [CrossRef] [PubMed]
- Vaziri, B.; Azadi, M.; Biglari, M.; Madani, S.N. Simple-mix: Thermodynamics modeling in a Gama-type Stirling engine with a working fluid mixture. Eng. Rep. 2023, 5, e12656. [Google Scholar] [CrossRef]
- Aboelmaaref, M.M.; Zhao, J.; Zayed, M.E.; Li, Y.; Gu, L.; Askalany, A.A.; Ghazy, M.; Alsaman, A.S.; Ali, E.S. Design and dynamic numerical modeling of a hybrid reverse osmosis/adsorption-based distillation system driven by solar dish Stirling engine for enhanced performance and waste heat recovery. Process Saf. Environ. Prot. 2023, 180, 324–328. [Google Scholar] [CrossRef]
- Hammad, F.A.; Shalaby, S.M.; Zayed, M.E. Innovative design of a dome-shaped solar distiller enhanced with a multi-tray conical absorber basin and fountain feeding supply: Experimental study with energy, exergy, and enviro-economic analyses. Sol. Energy 2023, 266, 112183. [Google Scholar] [CrossRef]
- Ciulla, G.; Guarino, S.; Lanchi, M.; D’Auria, M.; De Lucia, M.; Salvestroni, M.; Di Dio, V. Hybridization solutions for solar dish systems installed in the Mediterranean region. Renew. Energy 2023, 217, 119112. [Google Scholar] [CrossRef]
- Gu, L.; Li, Y.; Zhong, S.; Shen, R.; Zheng, R.; Yang, D.; Zhao, J.; Li, H. Theoretical and experimental study on the heat collection of solar dish system based on adjustable receiver. Energy Convers. Manag. 2023, 291, 117250. [Google Scholar] [CrossRef]
- Al-Dafaie, A.M.A.; Dahdolan, M.E.; Al-Nimr, M.A. Utilizing the heat rejected from a solar dish Stirling engine in potable water production. Sol. Energy 2016, 136, 317–326. [Google Scholar] [CrossRef]
- Bataineh, K.; Taamneh, Y. Performance analysis of stand-alone solar dish Stirling system for electricity generation. Int. J. Heat Technol. 2017, 35, 498–508. [Google Scholar] [CrossRef]
- Al-Tahaineh, H.; Amer, K. Design of a solar dish water heater for desalting water. JP J. Heat Mass Transf. 2019, 18, 331–342. [Google Scholar] [CrossRef]
- Al-Amayreh, M.I.; Alahmer, A.; Manasrah, A. A novel parabolic solar dish design for a hybrid solar lighting-thermal applications. Energy Rep. 2020, 6, 1136–1143. [Google Scholar] [CrossRef]
- Shboul, B.; Ismail, A.A.; Michailos, S.; Ingham, D.; AL-Zoubi, O.H.; Ma, L.; Hughes, K.; Pourkashanian, M. Design and Techno-economic assessment of a new hybrid system of a solar dish Stirling engine instegrated with a horizontal axis wind turbine for microgrid power generation. Energy Convers. Manag. 2021, 245, 114587. [Google Scholar] [CrossRef]
- Bataineh, K.M. Optimization analysis of solar-powered average temperature Stirling heat engine. J. Energy South. Africa 2015, 26, 55–66. [Google Scholar] [CrossRef]
- Bataineh, K. Performance evaluation of a stand-alone solar dish Stirling system for off–grid electrification. Energy Sources Part A Recover. Util. Environ. Eff. 2022, 44, 1208–1226. [Google Scholar] [CrossRef]
- Shboul, B.; Al-Arfi, I.; Michailos, S.; Ingham, D.; Udeh, G.T.; Ma, L.; Hughes, K.; Pourkashanian, M. Multi-Objective Optimal Performance of a Hybrid CPSD-SE/HWT System for Microgrid Power Generation. In Applications of Nature-Inspired Computing in Renewable Energy Systems; Mellal, M.A., Ed.; IGI Global Publisher of Timely Knowledge: Hershey, PA, USA, 2021; pp. 166–210. [Google Scholar] [CrossRef]
- Al-Tahaineh, H. Performance Investigation of a Concentrated Solar Dish for Heating Applications. Jordanian J. Eng. Chem. Ind. 2023, 6, 1–6. [Google Scholar] [CrossRef]
- Al Tahaineh, H.; Hassan, W. Simulation-Design and Performance Analysis of a Small-Scale Generation. Jordan J. Mech. Ind. Eng. 2023, 17, 413–419. [Google Scholar]
- Alrwashdeh, S.S.; Ammari, H.; Jweihan, Y.S.; Qadourah, J.A.; Al-Kheetan, M.J.; Al-Falahat, A.M. Refurbishment of Existing Building toward a Surplus Energy Building in Jordan. Open Constr. Build. Technol. J. 2022, 16. [Google Scholar] [CrossRef]
- Forrousso, S.; Kaitouni, S.I.; Mana, A.; Wakil, M.; Jamil, A.; Brigui, J.; Azzouzi, H. Optimal sizing of off-grid microgrid building-integrated-photovoltaic system with battery for a net zero energy residential building in different climates of Morocco. Results Eng. 2024, 22, 102288. [Google Scholar] [CrossRef]
- Sreenath, S.; Sudhakar, K.; Yusop, A.F. 7E analysis of a conceptual utility-scale land-based solar photovoltaic power plant. Energy 2021, 219, 119610. [Google Scholar] [CrossRef]
- Akdeniz, H.Y.; Balli, O.; Caliskan, H. Energy, exergy, economic, environmental, energy based economic, exergoeconomic and enviroeconomic (7E) analyses of a jet fueled turbofan type of aircraft engine. Fuel 2022, 322, 124165. [Google Scholar] [CrossRef]
- Jordan Meteorological Department. Available online: http://jmd.gov.jo/en (accessed on 21 May 2024).
- Global Solar Atlas. December 2023. Available online: https://globalsolaratlas.info/map (accessed on 21 May 2024).
- Albatayneh, A.; Juaidi, A.; Abdallah, R.; Peña-Fernández, A.; Manzano-Agugliaro, F. Effect of the subsidised electrical energy tariff on the residential energy consumption in Jordan. Energy Rep. 2022, 8, 893–903. [Google Scholar] [CrossRef]
- Albatayneh, A.; Juaidi, A.; Manzano-Agugliaro, F. The Negative Impact of Electrical Energy Subsidies on the Energy Consumption—Case Study from Jordan. Energies 2023, 16, 981. [Google Scholar] [CrossRef]
- Lin, S.; Yao, W.; Xiong, Y.; Zhao, Y.; Shi, Z.; Ai, X.; Wen, J. MatPSST: A Matlab/Simulink-based power system simulation toolbox for research and education. IET Gener. Transm. Distrib. 2023, 17, 2272–2288. [Google Scholar] [CrossRef]
- Zhao, L.; Li, Z.; Ma, Y.; Qu, L. A novel cryptocurrency price time series hybrid prediction model via machine learning with MATLAB/Simulink. J. Supercomput. 2023, 79, 15358–15389. [Google Scholar] [CrossRef]
- Abu-Rumman, G.; Khdair, A.I.; Khdair, S.I. Current status and future investment potential in renewable energy in Jordan: An overview. Heliyon 2020, 6, e03346. [Google Scholar] [CrossRef] [PubMed]
- Al-Jaafreh, M.; Mokryani, G.; Asharaa, A.; Zubo, R. Techno-Economic Viability Test of Renewable Energy Supply Options in Developing Countries: Jordan Case Study. In Proceedings of the 1st International Multi-Disciplinary Conference Theme: Sustainable Development and Smart Planning, IMDC-SDSP 2020, Cyperspace, 28–30 June 2020. [Google Scholar] [CrossRef]
- Al-Jaraden, T.; Ayadi, O.; Alahmer, A. Towards sustainable shale oil recovery in Jordan: An evaluation of renewable energy sources for in-situ extraction. Int. J. Thermofluids 2023, 20, 100446. [Google Scholar] [CrossRef]


Disclaimer/Publisher’s Note: The statements, opinions and data contained in all publications are solely those of the individual author(s) and contributor(s) and not of MDPI and/or the editor(s). MDPI and/or the editor(s) disclaim responsibility for any injury to people or property resulting from any ideas, methods, instructions or products referred to in the content. |
© 2024 by the authors. Licensee MDPI, Basel, Switzerland. This article is an open access article distributed under the terms and conditions of the Creative Commons Attribution (CC BY) license (https://creativecommons.org/licenses/by/4.0/).