Article

Can the Digital Economy Empower Low-Carbon Transition Development? New Evidence from Chinese Resource-Based Cities

1
School of Marxism, Henan Normal University, Xinxiang 453007, China
2
School of Political Science and Public Administration, Henan Normal University, Xinxiang 453007, China
3
School of Economics, Zhejiang University of Finance & Economics, Hangzhou 310018, China
4
School of Economics, Jiangxi University of Finance and Economics, Nanchang 330013, China
*
Author to whom correspondence should be addressed.
Sustainability 2024, 16(14), 5966; https://doi.org/10.3390/su16145966
Submission received: 16 June 2024 / Revised: 10 July 2024 / Accepted: 11 July 2024 / Published: 12 July 2024

Abstract

:
Existing research lacks a systematic and comprehensive analysis of the digital economy (DE)’s impact on the low-carbon transformation of resource-based cities. This study utilizes panel data from 114 of these cities in China from 2006 to 2019 to construct a DE measurement system. Based on the global SBM directional distance function and the Malmquist–Luenberger index (SBM-DDF-GML), we calculated the total factor carbon productivity (TFCP), decomposed the carbon inefficiency value (CIV), and examined DE’s impact, mechanism, and heterogeneity on low-carbon transition development (LCTD) during distinct growth phases of resource-based cities. Based on this examination, we found the following: (1) The DE effectively reduced carbon intensity and inefficiency and improved the total factor carbon productivity in resource-based cities. These findings remained robust after a series of robustness tests. (2) The DE empowered LCTD by improving energy efficiency, upgrading industrial structure, and optimizing innovation factor allocation. Finally, (3) this effect varied across the different city stages, being most significant in mature cities and weakest in declining ones. The research findings provide empirical evidence for the LCTD of resource-based cities.

1. Introduction

Resource-based cities, serving as crucial energy pillars in China, play a vital role in ensuring sustainable economic growth. However, they heavily depend on the extraction and initial processing of locally found natural resources [1], so resource depletion, insufficient driving force for subsequent development, a single industrial structure, and difficulties in low-carbon transition development (LCTD) have become increasingly prominent issues for these cities [2], alongside long-term high emissions leading to low comprehensive resource utilization efficiency and severe environmental damage [3]. In the context of China’s “dual carbon” goals, avoiding the “resource curse” development trap and achieving low-carbon development have become urgent issues.
In recent years, the expansion of the digital economy (DE) has provided a significant solution to the conflict between economic progress and environmental protection. Digital technology enables the transition of traditional industry value chains into intangible forms and contains many green elements [4]. Furthermore, the DE can transform the business environment, enhancing productivity and human capital accumulation. It can compensate for the losses caused by resource-based cities’ dependence on resource industries or transform businesses’ paths and preferences for natural resources, activate the innovative elements inherent to natural resources, and promote the transition towards a low-carbon economy.
However, how can we evaluate the LCTD process of resource-based cities and how does the DE empower this transition? Are there any differences in the above issues in different stages of resource exploitation? During comprehensive LCTD, it is highly practical for these cities to clarify the logical and empirical mechanisms behind these issues. Therefore, in this study, we conduct in-depth research to determine whether the DE could empower the LCTD of resource-based cities. Firstly, based on the SBM-DDF-GML method, the study calculated the TFCP of resource-based cities. Secondly, the entropy weight approach was employed to establish a complete index system for the DE. Finally, this study systematically examined the DE’s impact, mechanisms, and variability on total factor carbon productivity (TFCP). The goal was to provide both theoretical guidance and policy recommendations to support the LCTD of Chinese resource-based cities.
The marginal contributions of this study are as follows: Firstly, it expands the research perspective on the relationship between the DE and low-carbon development by exploring whether the former can help resource-based cities reduce their dependence on high-emission industries. Secondly, it provides a theoretical analysis and empirical test of the transmission pathways through which the DE influences the LCTD in these cities. This study refines the understanding of the DE’s role in LCTD by examining aspects such as energy efficiency, industrial structure upgrading, and innovation factor allocation, enriching the theoretical framework of the DE’s contribution to low-carbon development. Thirdly, by considering the different development stages of resource-based cities—mature, regenerating, growing, and declining—this study empirically investigates the varying DE impacts on these stages.
The remainder of this article is structured as follows: Section 2 includes the literature review, while Section 3 covers the policy background and research hypotheses, Section 4 and Section 5 detail the research design and results, and Section 6 provides the conclusion and discussion.

2. Literature Review

The primary focus of research on the correlation between the DE and LCTD is twofold: (1) examining the connection between the DE and carbon emissions and (2) understanding the mechanisms by which the DE influences carbon emissions.
Firstly, regarding the relationship between the DE and carbon emissions, scholars have explored and verified this connection from various perspectives, including digital technology [5], digital investment [6], digital finance [7], digital supply and demand [8], and the “Broadband China” pilot policy [9]. Most scholars concur that the DE significantly contributes to reducing carbon emissions due to the beneficial impact of its growth [6,10,11,12]. Nevertheless, some scholars argue that DE growth leads to carbon emission increases and additional environmental strain [13], while others propose that the relationship between the DE and carbon emission intensity follows an inverted “U”-shaped nonlinear pattern [14,15], whereby, in the initial phases of digital economic development, DE growth might lead to an increase in carbon emission intensity, with the former’s long-term positive impact on the latter becoming more pronounced as it progresses and matures.
Secondly, the extensive use of advanced digital technologies such as big data and AI significantly influences the DE, in turn playing a vital role in driving corporate innovation. As a result, many scholars argue that technological innovation is a crucial channel through which the DE affects carbon emissions [16,17]. Moreover, the DE promotes the rapid long-distance transmission of knowledge, information, and other factors of innovation, facilitating collaborative innovation among firms. Hence, some scholars argue that the DE promotes low-carbon development through the effective flow of innovative elements [18]. In addition to technological innovation, energy efficiency [19] and industrial structure upgrading [20,21] are also important pathways of interest to scholars, while others have examined the mechanisms through which the DE promotes low-carbon development by considering factors such as financial development, political stability, and the positive effects of the rule of law [22].
Numerous studies have explored how the DE promotes LCTD from various perspectives, with two main persistent shortcomings: a lack of targeted analyses on DE’s influence on LCTD in resource-based cities and a scarcity of comprehensive analyses on how the DE impacts carbon performance in these cities. Additionally, there is limited research examining the differences in impact at different development stages of resource-based cities.

3. Theory Background and Hypothesis Development

This research primarily examines the ways in which the DE facilitates the transition to low-carbon practices in resource-based cities. It focuses on three key areas: enhancing energy efficiency, updating industrial structures, and allocating innovative factors. The theoretical framework of this paper is shown in Figure 1.

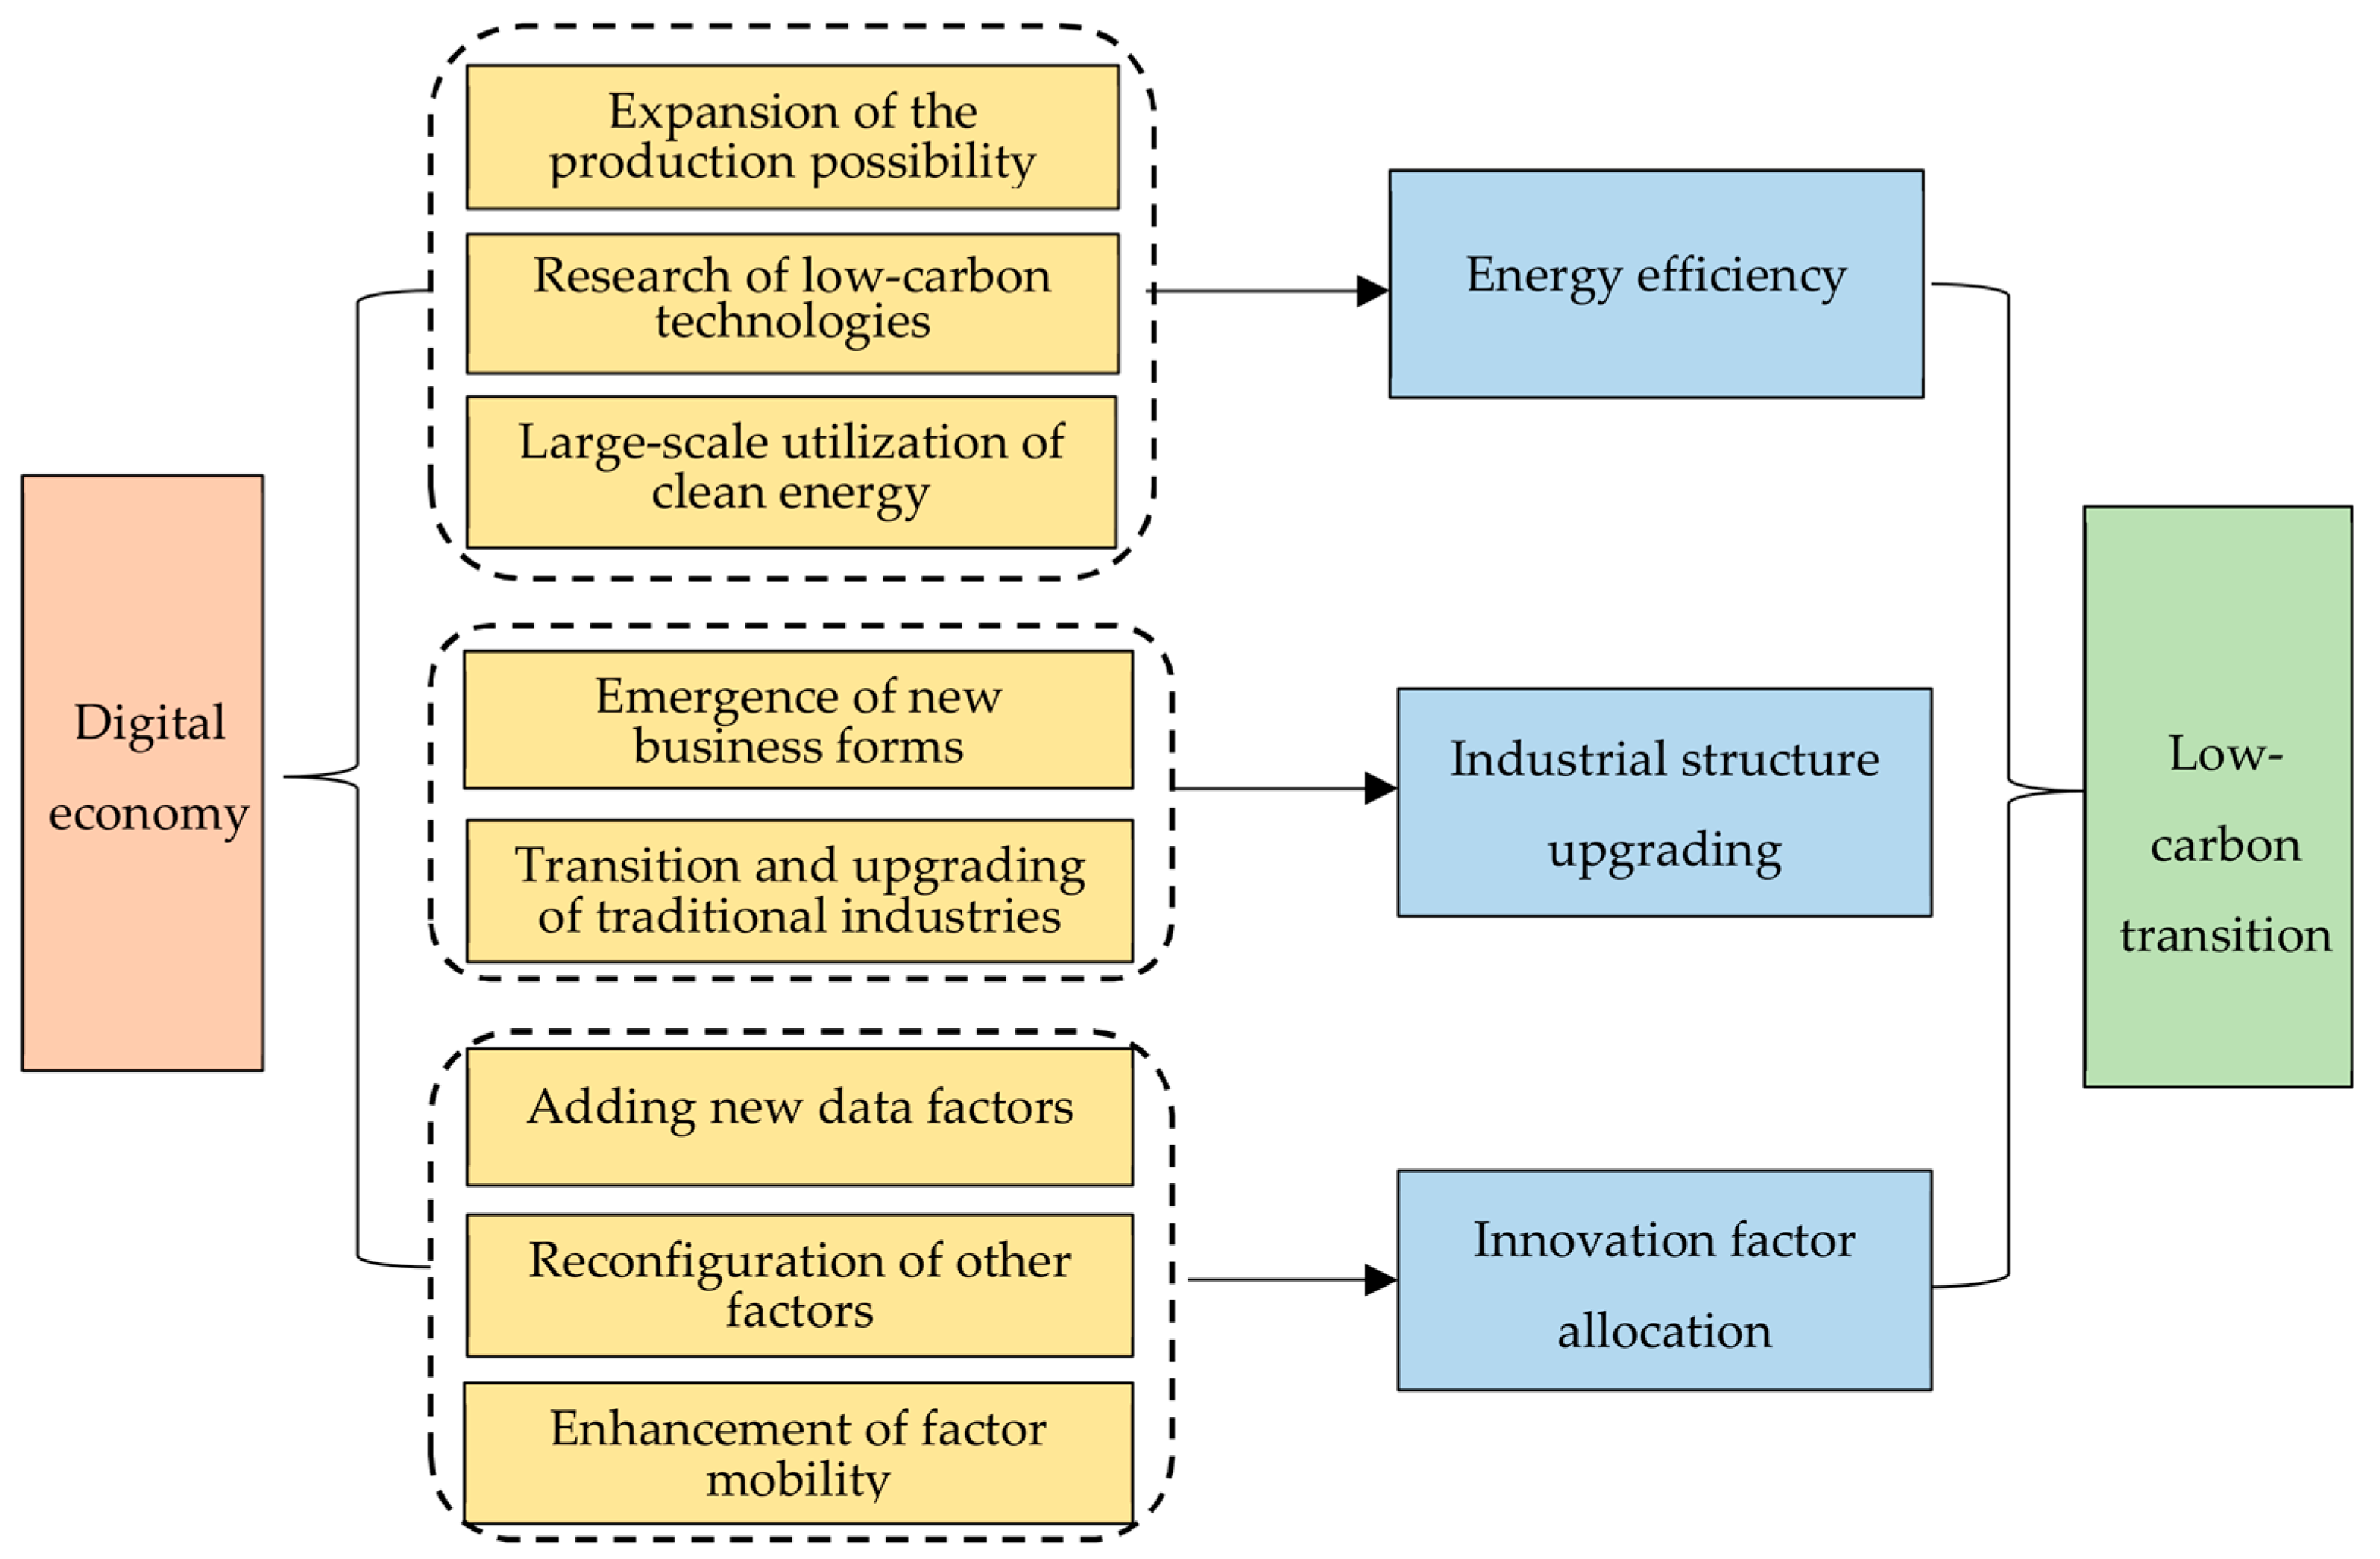
3.1. Digital Economy, Energy Efficiency, and LCTD

The DE can empower LCTD by enhancing energy efficiency. Firstly, by integrating data elements with traditional production factors such as labor, capital, and energy, the DE can reconstruct the production factor system and the input–output relationship. This leads to improved marginal returns of traditional factors, expands the production possibility frontier [23], and generates multiplier effects on production behavior, thereby facilitating enhanced energy efficiency. The enhancement of energy efficiency also aids in the reduction in carbon emissions, the improvement in carbon performance, and the promotion of an LCTD. Additionally, the sharing and transparency features of the DE enhance the accuracy of enterprise forecasting, which is advantageous for realizing the value of products and reducing energy efficiency losses caused by resource mismatches at the microeconomic unit level [24], fostering LCTD.
The extensive implementation of digital technology has positive impacts on the overall planning and coordinated development of energy usage at a macro level. This measure efficiently stimulates the research investment in and development of low-carbon technologies, helps the widespread use of clean energy, and achieves improved energy efficiency. Specifically, within resource-based cities, the utilization of information technology for environmental management and various low-carbon treatment techniques strengthens the coordinated development of different departments, enabling the real-time monitoring and timely regulation of carbon emissions. Among resource-based cities, the DE compresses spatial and temporal distances and enhances economic interconnections between cities, which helps facilitate the joint prevention and control of urban environmental pollution [7]. Enterprises in resource-based cities are compelled to enhance energy efficiency and contribute to the development of LCTD.

3.2. Digital Economy, Industrial Structure Upgrading, and LCTD

The DE has the potential to facilitate the transition to a low-carbon economy by encouraging the improvement in industrial structures. First and foremost, the DE facilitates the rise of novel business models, including digital agriculture, manufacturing, and services [25,26,27]. New industries and business forms emerge, gradually surpassing traditional industries and becoming the dominant industries in the industrial system. This encourages the industrial structure development in cities in high-value-added, high-tech, and high-intensity directions [28], facilitating LCTD. Secondly, the DE has the potential to facilitate the transformation and advancement of conventional sectors. It is evident that the high production costs of traditional extraction industries pose challenges to their survival in resource-based cities. The DE facilitates the promotion of firms’ technology transformation and upgrading in resource-based cities, as the acquisition of technological equipment drives funds towards a more advanced industrial structure. In addition, under China’s ecological civilization policy, ecologically sustainable and clean enterprises will gradually replace conventional resource development industries with significant levels of pollution and emissions, encroaching on their living space. To avoid being eliminated by the market, traditional industries need to undergo digital transition to achieve industrial restructuring, promoting the iteration of the industrial structure, enhancing carbon performance, and driving LCTD.

3.3. Digital Economy, Innovation Factor Allocation, and LCTD

The DE has the potential to facilitate the transition to a low-carbon economy by improving the distribution of innovation resources. The DE improves innovation factor allocation in two main ways: first, by adding data elements as emerging production factors in the existing production factor system due to its substitutability, and, second, by reconfiguring the types and proportions of various factors in the production process through its permeability and synergy [29]. This allows for the allocation of innovation factors, represented by digital technology, data elements, and highly skilled talent, to flow on a larger scale among different industries. On one hand, the digital penetration of innovation factors provides an opportunity for innovation activities to transition from geographic to digital-space clustering, effectively reducing transaction costs in their flow and unleashing driving forces such as an efficient connectivity and spillover diffusion [30]. On the other hand, as innovation factors flow towards enterprises with high marginal output and production efficiency, the role of factor market orientation is strengthened, significantly increasing DE’s influence in promoting the transition to a low-carbon society. Therefore, the DE regulates the amount and quality of conventional production factors in various resource-based cities via the efficient flow and coordinated allocation of innovation components. This enables the efficient allocation of various production factors on a larger scale, promoting cross-regional recombination [31] and largely breaking the constraints of resource misallocation under traditional economic models, effectively mitigating high pollution and emissions and achieving rapid LCTD.
Based on the above, we propose the following hypothesis:
H1. 
The DE can empower LCTD through the enhancement of energy efficiency, industrial structure upgrading, and innovation factor allocation.

4. Research Design

4.1. Model Specification

This research uses the following model to analyze the influence of digital economics on the LCTD of resource-based cities:
C P i t = β 0 + β 1 D E i t + j = 2 6 β j Z i t + u i + u t + ε i t
C P i t represents the level of low-carbon development of resource-based cities i in year t . To comprehensively reflect the low-carbon development status, this study selects three different indicators as proxy variables, namely, the carbon emission intensity (CO2), carbon inefficiency value (CIV), and total factor carbon productivity (TFCP). D E i t represents the DE in resource-based cities, while Z i t reflects control variables such as the GDP, density, road area per capita, government intervention, energy structure, and foreign direct investment in resource-based cities. In addition, u i and u t are the individual- and time-fixed effects, respectively, and ε i t represents the random error term.
To investigate the specific mechanism through which the DE facilitates low-carbon development, building upon Wen and Ye’s approach [32], we constructed the following based on Model (1):
M i t = α 0 + α 1 D E i t + j = 2 6 α j Z i t + u i + u t + ε i t
C P i t = γ 0 + γ 1 D E i t + γ 2 M i t + j = 2 6 γ j Z i t + u i + u t + ε i t
In Models (2)–(3), M i t represents the mediator variable, which includes energy efficiency (EEFF), advanced industrial structure (AIS), and innovation factor allocation (Inno).

4.2. Selection and Measurement of Variables

4.2.1. Selection and Measurement of Dependent Variables

In this study, we selected three dependent variables: carbon emission intensity, carbon inefficiency value, and total factor carbon productivity. Carbon emission intensity, defined as the carbon dioxide emissions per unit of GDP [33], served as a key indicator. To measure the other two variables, we employed the SBM-DDF-GML model.
(1)
Construction of the SBM-DDF-GML measurement model.
Building on Fukuyama and Weber’s research approach [34], this study focused on resource-based cities as decision-making units to construct the technological frontier. Through this approach, we defined the equations known as the Slacks-Based Measure (SBM):
S V t x t , n , y t , n , b t , n , g x , g y , g b = max s x , s y , s b 1 K k = 1 K s n x g n x + 1 M + I m = 1 M s m y g m y + i = 1 I s i b g i b 2
s . t . n = 1 N z n t x n k t + s k x = x n k t , k ;
n = 1 N z n t y n m t s m y = y n m t , m ;
n = 1 N z n t b n i t + s i b = b n i t , i ;
n = 1 N z n t = 1 , z k t 0 , n ; s k x 0 , k ; s m y 0 , m ; s i b 0 , i
In Equations (4)–(8), S V t represents the directional distance function under variable returns to scale (VRS) (if one removes the constraint that the sum of the weight variables equals 1, it represents a directional distance function under constant returns to scale (CRS)). x t , n , y t , n , b t , n is the input and output vector of the n th resource-based city, while g x , g y , g b represents a positive directional vector for input compression and output expansion. s k x , s m y , s i b represents the slack vectors for inputs and outputs. Additionally, drawing inspiration from Cooper et al. [35], this study decomposed the inefficiency of undesirable output as follows:   I E b = 1 2 M + I i = 1 I s i b g i b .
This study utilized the Global Malmquist–Luenberger (GML) method, as proposed by Oh [36], to calculate the changes in total factor carbon productivity based on the aforementioned equations. The specific productivity indicators considered in this analysis are as follows:
G M L n t , t + 1 = 1 + S V G x t , n , y t , n , b t , n 1 + S V G x t + 1 , n , y t + 1 , n , b t + 1 , n    = 1 + S V t x t , n , y t , n , b t , n 1 + S V t + 1 x t + 1 , n , y t + 1 , n , b t + 1 , n    × 1 + S V G x t , n , y t , n , b t , n 1 + S V t x t , n , y t , n , b t , n × 1 + S V t + 1 x t + 1 , n , y t + 1 , n , b t + 1 , n 1 + S V G x t + 1 , n , y t + 1 , n , b t + 1 , n     = T E n t + 1 T E n t × B P G n t + 1 B P G n t = G E C n t , t + 1 × G T C n t , t + 1
In Equation (9), G M L n t , t + 1 represents the change in TFCP from period t to t + 1. This study also draws on the approach by Chen [37] to calculate the total factor carbon productivity using a multiplicative method, via the following specific approach: Take the base year of the sample, 2006, as the starting point and assume that the TFCP in 2006 is equal to 1. Then, the TFCP in 2007 is equal to the TFCP in 2006 multiplied by the GML index in 2007, and so on. Therefore, by cumulative multiplication, the TFCP for the subsequent years from 2008 to 2019 can be calculated. The results of the calculations are shown in Table A1 and Table A2 in Appendix A.1.
(2)
Selection of indicators for the SBM-DDF-GML model.
To calculate the GML index using the directional distance function of the SBM model, this study requires various indicators: input, desirable output, and undesirable output indicators.
The input variables include labor (L), energy consumption (E), and capital (K). For the labor input, we used the number of employed people in each prefectural-level city as a proxy. Energy input was measured by the equivalent energy consumption value, converted using the standard coal method. Capital input was estimated using the perpetual inventory method, following Liu and Xin [38], to determine the productive capital stock of each prefectural-level city. For the desirable output, we measured the regional GDP of each prefectural-level city, converting it to the real GDP based on the constant price index of 2006, as sourced from the “China Price Statistical Yearbook”. For the undesirable output, carbon dioxide emissions were used, calculated based on energy consumption and the IPCC (2006) method. The specific indicators used in this study are summarized in Table 1.

4.2.2. Selection and Measurement of Independent Variables

The DE has a rich connotation and requires a comprehensive approach to establish a multi-indicator system to measure its development. The entropy weight method is an objective weighting approach widely used in multi-criteria comprehensive evaluations. By calculating the information entropy of each indicator, it determines the importance of the indicators, avoiding the interference of subjective human factors. Considering that the entropy weighting method can determine the weights based on the variations in each indicator, to measure the development index, this study adopted the entropy weighting method outlined by Zhang et al. [19].
In terms of indicator system construction, this study referred to the method used by the OECD to construct the DE indicator system, which includes 4 primary and 11 secondary indicators, as shown in Table 2.

4.2.3. Selection and Measurement of Control Variables

To reduce the omitted variable bias, this analysis incorporated control factors that impacted resource-based cities’ LCTD. ➀ Economic Development Level (PGDP): The real GDP per capita was used as a measure in this study. ➁ Government Intervention (GINT): It was expressed by the ratio of government spending to the GDP. ➂ Population Density (PDEN): It was defined as the number of persons per unit of land area. ➃ Foreign Direct Investment (FDI): The total amount of FDI in a city was used as a measure, adjusted for inflation. ➄ Energy Structure (ESTRU): Measured by the fraction of electricity usage in the overall energy consumption.

4.2.4. Selection and Measurement of Mechanism Variables

➀ Energy Efficiency (EEFF): Energy efficiency was calculated, in this study, using the super-efficiency SBM approach. For the selection of undesirable output, Cui and Lin’s approach was taken as a reference [39], where the generation of three waste types (gaseous, liquid, and solid) was chosen as the undesirable output. Specifically, the measurement indicators were SO2 emissions, wastewater discharge, and particulate matter emissions. In addition, the desirable output and input were the same as those mentioned above. Considering the significant differences in data scales, this study standardized all indicators. ➁ Industrial Structure Upgrading (INDUP): This study referred to the research by Liang and Yu [40] and created an industrial structure upgrading index based on the relative changes in industrial size and labor productivity. The specific expression is I N D U P = i = 1 3 S i Y P i L , where S i Y = Y i / Y represents the value-added share in each industry and P i L = Y i / L i represents the ratio of output to employment in each industry. ➂ Innovation Factor Allocation (INNO): This study referred to the research by He and Fu [41], constructing an indicator system from three dimensions: factor supply, coordination, and circulation. Factor supply mainly relied on high-tech industry and university R&D and the number of research projects. Meanwhile, factor circulation was primarily measured by resource-based cities’ convenience in accessing external human, material, and financial resources, and factor coordination was mainly measured by the number of scientists and engineers and the concentration of regional financial talents. After the data were organized, the level of innovation factor allocation was calculated using a composite system synergy model.

4.3. Data Sources and Variable Description

According to the “Sustainable Development Plan of Resource-based Cities Nationwide (2013–2020)” (referred to as the “Plan”), there are currently 262 resource-based cities in China. However, due to missing data in some cities, this study selected a sample of 114 cities with complete data from 2006 to 2019, resulting in a total of 1596 observations. The data are primarily sourced from the “China City Statistical Yearbook”, the “China Statistical Yearbook on Environment”, theChina Energy Statistical Yearbook”, Carbon Emission Accounts and Datasets (CEADs), Wind Database, and EPS Database. The variables used in this study are presented in Table 3.

5. Empirical Results

5.1. Benchmark Regression

We performed a benchmark regression using Equation (1) and a two-way fixed effects model. The results are presented in Table 4. Columns (1) and (2) use carbon emission intensity as the dependent variable, Columns (3) and (4) use total factor carbon productivity, and Columns (5) and (6) use the carbon inefficiency value. The models in Columns (1), (3), and (5) include only the core explanatory variables, while those in Columns (2), (4), and (6) also incorporate control variables. Firstly, as shown in Columns (1) and (2), the estimated coefficient of the independent variable is significantly negative, indicating that the DE can reduce carbon emissions per unit of output, contributing to emission reduction. Secondly, Columns (3) and (4) demonstrate that the DE (Dig) has a significant positive effect on the total factor carbon productivity (TFCP), suggesting that it enhances TFCP in resource-rich regions. Lastly, Columns (5) and (6) show that Dig has a significantly negative impact on the carbon inefficiency value (CIV), implying that digital economic development reduces carbon inefficiency in resource-based cities, improving carbon performance. With DE’s continuous development, the widespread application of digital technology promotes the large-scale utilization of clean energy, effectively reducing carbon emissions, enhancing environmental performance, and supporting the goal of LCTD.

5.2. Robustness Tests

5.2.1. Variable Replacement

This study employed a global reference non-radial directional distance function (non-radial DDF) to calculate the TFCP, avoiding potential differences in the estimation results due to the dependent variable’s measurement method. The impact of digital economic development on TFCP was then re-estimated, with the results presented in Column (1) of Table 5. The findings reveal that, even after altering the TFCP measurement method, digital economic development’s impact remains significantly positive, indicating the robustness of this study’s conclusions.

5.2.2. Estimation Method Replacement

Because the carbon emission intensity, total factor carbon productivity, and carbon inefficiency value in a previous period may have a sustained and dynamic impact on the current period, it is necessary to account for this potential influence. In order to address this concern, we included lagged one-period values of carbon emission intensity, total factor carbon productivity, and carbon inefficiency in each model and employed a dynamic panel model. The findings, as given in Columns (2)–(4) of Table 5, reveal that, after integrating dynamic components, the sign, significance, and magnitude of the estimated coefficients for the key explanatory variables remained virtually unaltered. This confirms the robustness of the benchmark results in our investigation.

5.3. Endogeneity Test

Although the internet economy may facilitate the low-carbon transformation of resource-based cities, the national requirement for LCTD may also drive cities to develop the DE. Therefore, there may be a reciprocal causal relationship between the two. To address the model’s possible reverse causality, this research used a two-stage least squares (2SLS) estimate approach. This research followed Yu and Lu’s strategy [42], using the distance between each resource-based city and the provincial capital (DIS) as the instrumental variable. The selection of this instrumental variable considered the following two points: Firstly, the distance from each resource-based city to the provincial capital has a natural attribute and is a fixed value, which is strictly exogenous to the real-time changes in LCTD indicators such as the carbon emission intensity, the total factor carbon productivity, and the carbon inefficiency value, meeting the exogeneity condition. Secondly, the distance between each resource-based city and the provincial capital may have an impact on the regional DE. Overall, provincial capital cities have the greatest degree of economic development among all provinces and can stimulate the development of surrounding areas and other regions within the province through industrial chains, service systems, and functional division. Therefore, cities closer to the provincial capital are more influenced by this radiation effect and more conducive to DE development.
Table 6 shows the results of the endogeneity test. Even after accounting for endogeneity, the DE dramatically lowers the carbon emission intensity, reduces the carbon inefficiency, and increases the total factor carbon productivity.

5.4. Mechanism Analysis

In the previous section, we conducted a theoretical analysis to explore the transmission mechanisms of DE development on LCTD. In this section, we validate these mechanisms using a mediation effect model. The results, which are presented in Table 7, focus on the estimation results for the TFCP. Due to space constraints, the estimation results for carbon emission intensity and the carbon inefficiency value are provided in Appendix A.2 Table A3 and Table A4.
Firstly, Columns (1) and (2) of Table 7 present the results for the energy efficiency mechanism. In Column (1), it is evident that the DE has a significant positive effect on energy efficiency. Furthermore, Column (2) demonstrates that the improvement in energy efficiency significantly promotes the growth of total factor carbon productivity (TFCP). These findings validate the notion that DE advancements can enhance the TFCP by improving energy efficiency.
Secondly, Columns (3) and (4) of Table 7 display the results for the industrial structure upgrading mechanism. In Column (3), it is shown that the DE significantly promotes industrial structure upgrading. Column (4) further reveals that this industrial structure upgrading enhances the growth of total factor carbon productivity (TFCP). These results validate that DE advancements can boost the TFCP by promoting industrial structure upgrading and, as the DE continues to integrate with the traditional economy, new high-value industries such as digital agriculture, manufacturing, and services are emerging. Through the linkage and spillover effects of this industrial integration, the DE facilitates industrial structure upgrading, enhancing the TFCP.
Finally, Columns (5) and (6) of Table 7 present the results related to the allocation of innovation factors. In Column (5), it is evident that DE development significantly promotes innovation factor allocation, while Column (6) shows that this allocation further enhances the growth of total factor carbon productivity (TFCP), findings which validate innovation factor allocation as another mechanism through which the DE improves the TFCP. As the DE develops, the digital penetration of innovation factors creates opportunities for innovation activities and reduces transaction costs in their flow process. This efficient flow and collaboration of innovation factors, facilitated by high-efficiency communication and spillover diffusion, ultimately enhance the TFCP.
The research findings outlined above validate hypothesis H1.

5.5. Heterogeneity Analysis

This study classified resource-based cities into four types—mature, regenerating, growing, and declining—according to the “Plan.”, after which heterogeneity tests were conducted on cities at different development stages, as shown in Table 8 for total factor carbon productivity (TFCP), due to space limitations. The estimation results for carbon emission intensity and carbon inefficiency value are provided in Table A5 and Table A6, respectively.
From the significance of the estimated coefficients at different stages, it is evident that the DE contributes to the enhancement of the TFCP at various stages. However, when comparing the size of the estimated coefficients, the largest was for mature cities, while it was the smallest for declining cities, possibly due to mature cities having resource availability and being in an upward stage of development, with greater potential for resource security and strong socioeconomic development momentum. These cities are capable of efficient resource exploitation, in turn driving improvements in industrial technological levels. Therefore, in this stage, the effect of DE is greatest. Instead, declining cities face resource depletion, significant ecological pressure, and lagging development of low-carbon technologies, meaning that DE growth has a very minimal influence on the TFCP in these cities.

6. Conclusions and Discussion

6.1. Discussion

The LCTD of resource-based cities is crucial for achieving “dual carbon” goals. This study uses panel data from 114 resource-based cities in China, from 2006 to 2019, to examine the impact of the DE on this transition. The main research findings are as follows: (1) The DE can effectively reduce carbon emissions and improve carbon performance. Specifically, it decreases carbon emission intensity, enhances total factor carbon productivity, and lowers the carbon inefficiency values, thereby facilitating the LCTD of resource-based cities. This conclusion remains robust even after addressing endogeneity and performing other robustness tests. (2) The DE supports the LCTD of resource-based cities by improving energy efficiency, upgrading the industrial structure, and allocating innovation factors. (3) The impact of DE growth on the LCTD varies across different city development stages, being most significant in mature cities and weakest in declining ones.
Promoting a comprehensive LCTD across economic and social sectors and pursuing green development have become essential measures for achieving “dual carbon” goals on time. This study analyzes specific challenges and offers policy recommendations for facilitating LCTD. It enhances the understanding of the DE’s intrinsic and operational mechanisms in the context of LCTD in resource-based cities, broadens the theoretical scope of existing low-carbon research, and serves as a reference for future scholars.
Our findings align with the broader literature on the impact of the digital economy (DE) on carbon emissions and low-carbon transition development (LCTD), but they also offer unique insights specific to resource-based cities. Previous studies have shown that the DE significantly reduces carbon emissions and enhances carbon performance through various mechanisms such as technological innovation, energy efficiency, and industrial structure upgrading [5,16,19]. Our results corroborate these findings, indicating that the DE reduces carbon intensity, improves total factor carbon productivity, and decreases carbon inefficiency in resource-based cities.
However, our study also highlights some differences. For example, while some scholars argue that the DE’s impact on carbon emissions follows an inverted “U”-shaped pattern [14,15], our findings suggest a more straightforward positive relationship, particularly in mature resource-based cities. This discrepancy might be due to the specific characteristics of these cities, such as their heavy reliance on traditional industries and the significant room for improvement in their industrial structures and energy efficiency.

6.2. Theoretical Implications

Our research makes several theoretical contributions. Firstly, it expands the understanding of the DE’s role in low-carbon development by focusing on resource-based cities, which have been underrepresented in existing studies. Secondly, it provides a nuanced analysis of the mechanisms through which the DE influences LCTD, highlighting the roles of energy efficiency, industrial structure upgrading, and innovation factor allocation. These insights enrich the theoretical framework surrounding the DE’s contribution to low-carbon development.
Furthermore, our study’s stage-specific analysis reveals that the DE’s impact varies across different stages of city development, underscoring the importance of considering cities’ heterogeneity when designing and implementing digital economy policies. It also suggests that mature cities might be better positioned to leverage the DE for low-carbon transition, providing a new dimension to existing theoretical discussions.

6.3. Practical Implications

From a practical perspective, our findings offer valuable policy implications. For policymakers in resource-based cities, our research suggests that DE investment can be an effective strategy for achieving low-carbon development. By enhancing energy efficiency, upgrading industrial structures, and optimizing the allocation of innovation factors, the DE can help these cities overcome their dependence on high-emission industries and transition towards a more sustainable economic model.
Based on the research findings, the DE significantly drives the LCTD of resource-based cities. To leverage this potential, these cities should focus on enhancing the empowering role of the DE in achieving low-carbon goals. The following policy suggestions are proposed.
Firstly, it is important to focus on the development of the DE in resource-based areas. Enhancing digital infrastructure and improving digital technology capabilities are crucial steps. By promoting R&D investment in green and low-carbon technologies and strengthening the use of clean production technologies, we can increase the proportion of renewable and clean energy in the energy input for resource-based cities. This, in turn, will improve energy efficiency and minimize carbon emissions.
Second, the use of data input could improve the efficiency of innovation factor allocation and increase the overall factor carbon productivity. This can be achieved by strengthening the integration of data factors with traditional resource factors, continuously stimulating the vitality of innovation factors in production process restructuring, improving the quality of input factors in existing production activities, optimizing innovation factor allocation, and comprehensively improving the TFCP of resource-based cities.
Thirdly, it is important to rely on digital industrialization and industrial digitalization to promote industrial structure upgrading and facilitate low-carbon development. The use of digital technology can help in the comprehensive transition of industrial chains and systems, accelerate the cultivation of new high-added-value business forms such as digital agriculture, industry, and services, accomplish the upgrading and coordinated growth of industrial structure, and enable LCTD.
Fourthly, we should steer cities’ low-carbon development in phases depending on their features. According to the concepts of categorized direction and distinctive development, we should increase policy support, accelerate the construction of digital infrastructure, and gradually enhance the carbon performance of declining cities with slower LCTD progress. For mature cities with higher LCTD levels, we should accelerate the development of digital government, improve public services, optimize urban functions, and maintain their high productivity and carbon reduction capacity.
Our findings have broader implications for readers in other countries, especially those with resource-based economies. The positive impact of the DE on LCTD observed in Chinese cities suggests that similar strategies might be effective elsewhere. However, the varying effects across different stages of city development highlight the need for context-specific policies. Countries with mature resource-based cities might see more immediate benefits from DE investments, while those with declining cities might need to address additional challenges.

6.4. Limitations and Future Research

There are some limitations in this study. Firstly, the construction of the DE indicator system requires further refinement: the DE is a complex system encompassing multiple aspects, and, due to data limitations, this study only included 11 second-level indicators, so further improvements will be made as more data become available. Secondly, this study examined the impact of DE development on the LCTD of resource-based cities at the city level. Including micro-level empirical evidence from enterprises, which are significant carbon emitters, would provide more persuasive results and should be considered for future research.

6.5. Conclusions

Our research provides a comprehensive analysis of the DE’s impact on Chinese resource-based cities’ LCTD, confirming its positive role in reducing carbon emissions and improving carbon performance, highlighting the significance of energy efficiency, industrial structure upgrading, and innovation factor allocation as the key mechanisms, and underscoring the need for stage-specific policy interventions. These findings contribute to both theoretical and practical discussions on the DE and low-carbon development, offering valuable insights for policymakers and researchers worldwide.

Author Contributions

Conceptualization, H.X. and H.L.; methodology, X.-W.Y.; software, X.C.; validation, H.X. and H.L.; formal analysis, X.-W.Y.; investigation, X.C.; resources, H.X.; data curation, X.L.; writing—original draft preparation, H.X. and X.C.; visualization, X.-W.Y.; supervision, N.X.; and project administration, N.X. All authors have read and agreed to the published version of the manuscript.

Funding

This research received no external funding.

Data Availability Statement

Data will be available upon request.

Acknowledgments

The authors are grateful for the support from Henan Normal University.

Conflicts of Interest

The authors declare no conflicts of interest.

Appendix A

Appendix A.1. Results of Total Factor Carbon Productivity Calculation for Resource-Based Cities

The calculated yearly average GML index of Chinese resource-based cities is shown in Table A1.
Table A1. GML index and its decomposition, from 2006 to 2019.
YearGECGTCGML
2006–20071.0220.93750.9581
2007–20080.9711.05281.0224
2008–20090.9850.88610.8729
2009–20101.0480.9591.0048
2010–20110.9641.12291.0826
2011–20120.9531.01040.9633
2012–20131.0010.90390.9049
2013–20140.9691.02550.9932
2014–20150.9211.10141.0147
2015–20161.0141.0091.0235
2016–20171.0040.99711.0009
2017–20181.0390.98961.0282
2018–20191.0180.96970.9871
According to the “Plan”, resource-based cities were classified into four development stages: mature, regenerating, growing, and declining. The geometric mean GML index in the different stages was calculated, as shown in Table A2. There was a significant heterogeneity in the TFCP changes across different city stages. Taking the period from 2016 to 2017 as an example, the TFCP of mature, growing, and regenerating cities increased by 6.5%, 3.3%, and 1.3%, respectively, while declining cities experienced a decrease of 0.4%. Overall, years with an improvement in total factor carbon productivity were more frequent in mature cities compared to the other three stages, followed by growing, regenerating, and declining cities.
Table A2. GML index.
YearRegenerating StageDeclining StageMature StageGrowing Stage
2006–20070.943 0.998 0.979 0.957
2007–20081.032 1.000 1.020 1.007
2008–20090.837 0.953 0.915 0.893
2009–20101.015 0.969 1.007 0.993
2010–20111.066 1.051 1.120 1.131
2011–20120.958 0.986 0.956 0.976
2012–20130.917 0.832 0.906 0.924
2013–20140.996 0.956 1.044 0.947
2014–20150.988 1.042 1.014 1.111
2015–20161.013 0.996 1.065 1.033
2016–20170.991 0.957 1.027 1.046
2017–20180.998 1.007 1.082 1.103
2018–20191.002 0.929 0.980 0.992

Appendix A.2. Mechanism Test Results for Other Dependent Variables

As shown in Table A3, DE development can reduce carbon emission intensity through three pathways: energy efficiency, industrial structure upgrading, and innovation factor allocation.
Table A3. Mechanism test (CO2).
VariablesEnergy EfficiencyIndustrial Structure UpgradingInnovation Factor Allocation
EEFFCO2INDUPCO2EEFFCO2
(1)(2)(3)(4)(1)(2)
Digit0.593 **−1.339 *2.900 ***−1.254 *0.256 **−2.051 *
(2.37)(−1.66)(4.42)(−1.67)(2.07)(−1.68)
EEFF −0.366 *
(−1.71)
INDUP −0.297 *
(−1.69)
INNO −0.476 *
(−1.69)
Constant0.756 ***20.484 **0.543 **13.259 **0.895 ***16.484 **
(3.15)(1.95)(2.32)(2.01)(2.75)(2.24)
N159615961596159615961596
Adjusted R20.1730.7310.3090.6890.2530.865
Note: We include control variables and year- and city-fixed effects. Robust standard errors clustered at the firm level are shown in parentheses. ***, **, and * indicate significance at the 0.01, 0.05, and 0.1 levels, respectively.
As shown in Table A4, the DE can reduce the carbon inefficiency value through three pathways: energy efficiency, industrial structure upgrading, and innovation factor allocation.
Table A4. Mechanism test (CIV).
VariablesEnergy EfficiencyIndustrial Structure UpgradingInnovation Factor Allocation
EEFFCIVINDUPCIVINNOCIV
(1)(2)(3)(4)(5)(6)
Digit0.593 **−0.892 ***2.900 ***−0.416 **0.311 *−1.501 *
(2.37)(−3.60)(4.42)(−1.98)(1.79)(−1.80)
EEFF −0.749 ***
(−8.61)
INDUP −0.011 **
(−0.26)
INNO −0.125 *
(−1.82)
Constant0.756 ***0.892 ***−1.543 **20.748 ***0.922 **2.923 ***
(3.15)(3.11)(−2.32)(14.69)(2.01)(14.78)
N159615961596159615961596
Adjusted R20.1730.3370.3090.7300.4070.730
Note: We include control variables and year- and city-fixed effects. Robust standard errors clustered at the firm level are shown in parentheses. ***, **, and * indicate significance at the 0.01, 0.05, and 0.1 levels, respectively.

Appendix A.3. Heterogeneity Test Results for the Remaining Dependent Variables According to Resource-Based Cities’ Development Stages

As shown in Table A5, the DE reduces the carbon emission intensity during different stages. However, in terms of the magnitude of the estimation coefficients, the reduction effect is highest for declining cities and lowest for mature cities.
Table A5. Heterogeneity test in different development stages of resource-based cities (CO2).
VariablesMature StageRegenerating StageGrowing StageDeclining Stage
(1)(2)(3)(4)
Digit−0.140 **−1.688 ***−1.108 **−3.776 **
(−2.17)(−2.80)(1.98)(2.52)
Constant−3.776 **23.040 ***19.136 ***21.026 ***
(2.52)(11.63)(3.96)(3.60)
N882210196308
Adjusted R20.7560.9380.6710.696
Note: We include control variables and year- and city-fixed effects. Robust standard errors clustered at the firm level are shown in parentheses. *** and ** indicate significance at the 0.01 and 0.05 levels, respectively.
As shown in Table A6, the DE reduces the carbon inefficiency value in different stages. However, in terms of the magnitude of the estimation coefficients, the reduction effect is most significant for growing resource-based cities, while it is least pronounced for declining ones.
Table A6. Heterogeneity test in different development stages of resource-based cities (CIV).
VariablesMature StageRegenerating StageGrowing StageDeclining Stage
(1)(2)(3)(4)
Digit−0.329 *−0.412 *−1.535 ***−0.121 *
(−1.84)(−1.74)(−3.53)(1.86)
Constant2.426 ***1.93 **0.8800.766
(5.93)(2.32)(1.25)(0.69)
N882210196308
Adjusted R20.6310.5190.5150.543
Note: We include control variables and year- and city-fixed effects. Robust standard errors clustered at the firm level are shown in parentheses. ***, **, and * indicate significance at the 0.01, 0.05, and 0.1 levels, respectively.

References

  1. Xiao, X.; Liu, Y.; Li, R. The Identification of High-Quality Economic Development Level of Coal Resource-Based Cities and Its Transformation in China: A Case Study of 30 Coal Cities. J. Nat. Resour. 2023, 38, 563–575. [Google Scholar] [CrossRef]
  2. Zhang, M.; Xi, S. Evaluation of Carbon Emission Efficiency of Resource-Based Cities and Its Policy Enlightenment. J. Nat. Resour. 2023, 38, 220–237. [Google Scholar] [CrossRef]
  3. Qin, B.; Yu, R.; Ge, L. The Impact of Environmental Regulations on the Industrial Structure Transition of Resource-Based Cities. China Environ. Sci. 2021, 41, 3427–3440. [Google Scholar]
  4. Ran, Q.; Yang, X.; Yan, H.; Xu, Y.; Cao, J. Natural Resource Consumption and Industrial Green Transformation: Does the Digital Economy Matter? Resour. Pol. 2023, 81, 103396. [Google Scholar] [CrossRef]
  5. Liu, J.; Yu, Q.; Chen, Y.; Liu, J. The Impact of Digital Technology Development on Carbon Emissions: A Spatial Effect Analysis for China. Resour. Conserv. Recycl. 2022, 185, 106445. [Google Scholar] [CrossRef]
  6. Xu, Q.; Zhong, M.; Cao, M. Does Digital Investment Affect Carbon Efficiency? Spatial Effect and Mechanism Discussion. Sci. Total Environ. 2022, 827, 154321. [Google Scholar] [CrossRef] [PubMed]
  7. Deng, R.; Zhang, A. The Impact of Urban Digital Finance Development on Carbon Emission Performance in China and Mechanism. Resour. Sci. 2021, 43, 2316–2330. [Google Scholar] [CrossRef]
  8. Zhou, X.; Zhou, D.; Zhao, Z.; Wang, Q. A Framework to Analyze Carbon Impacts of Digital Economy: The Case of China. Sustain. Prod. Consum. 2022, 31, 357–369. [Google Scholar] [CrossRef]
  9. Wu, H.; Xue, Y.; Hao, Y.; Ren, S. How Does Internet Development Affect Energy-Saving and Emission Reduction? Evidence from China. Energy Econ. 2021, 103, 105577. [Google Scholar] [CrossRef]
  10. Yi, M.; Liu, Y.; Sheng, M.S.; Wen, L. Effects of Digital Economy on Carbon Emission Reduction: New Evidence from China. Energy Policy 2022, 171, 113271. [Google Scholar] [CrossRef]
  11. Shang, Y.; Raza, S.A.; Huo, Z.; Shahzad, U.; Zhao, X. Does Enterprise Digital Transformation Contribute to the Carbon Emission Reduction? Micro-Level Evidence from China. Int. Rev. Econ. Financ. 2023, 86, 1–13. [Google Scholar] [CrossRef]
  12. Chen, L.; Lu, Y.; Meng, Y.; Zhao, W. Research on the Nexus between the Digital Economy and Carbon Emissions-Evidence at China’s Province Level. J. Clean. Prod. 2023, 413, 137484. [Google Scholar] [CrossRef]
  13. Shvakov, E.E.; Petrova, E.A. Newest Trends and Future Scenarios for a Sustainable Digital Economy Development. Sci. Tech. Revolut. Yesterday Today Tomorrow 2020, 129, 1378–1385. [Google Scholar]
  14. Li, Z.; Wang, J. The Dynamic Impact of Digital Economy on Carbon Emission Reduction: Evidence City-Level Empirical Data in China. J. Clean. Prod. 2022, 351, 131570. [Google Scholar] [CrossRef]
  15. Wang, Q.; Sun, J.; Pata, U.K.; Li, R.; Kartal, M.T. Digital Economy and Carbon Dioxide Emissions: Examining the Role of Threshold Variables. Geosci. Front. 2024, 15, 101644. [Google Scholar] [CrossRef]
  16. Moyer, J.D.; Hughes, B.B. ICTs: Do They Contribute to Increased Carbon Emissions? Technol. Forecast. Soc. Chang. 2012, 79, 919–931. [Google Scholar] [CrossRef]
  17. Ma, Q.; Tariq, M.; Mahmood, H.; Khan, Z. The Nexus between Digital Economy and Carbon Dioxide Emissions in China: The Moderating Role of Investments in Research and Development. Technol. Soc. 2022, 68, 101910. [Google Scholar] [CrossRef]
  18. Wang, L.; Chen, L.; Li, Y. Digital Economy and Urban Low-Carbon Sustainable Development: The Role of Innovation Factor Mobility in China. Environ. Sci. Pollut. Res. 2022, 29, 48539–48557. [Google Scholar] [CrossRef] [PubMed]
  19. Zhang, W.; Liu, X.; Wang, D.; Zhou, J. Digital Economy and Carbon Emission Performance: Evidence at China’s City Level. Energy Policy 2022, 165, 112927. [Google Scholar] [CrossRef]
  20. Chen, S.; Ding, D.; Shi, G.; Chen, G. Digital Economy, Industrial Structure, and Carbon Emissions: An Empirical Study Based on a Provincial Panel Data Set from China. Chin. J. Popul. Resour. Environ. 2022, 20, 316–323. [Google Scholar] [CrossRef]
  21. Cheng, Y.; Zhang, Y.; Wang, J.; Jiang, J. The Impact of the Urban Digital Economy on China’s Carbon Intensity: Spatial Spillover and Mediating Effect. Resour. Conserv. Recycl. 2023, 189, 106762. [Google Scholar] [CrossRef]
  22. Wang, B.; Wang, J.; Dong, K.; Dong, X. Is the Digital Economy Conducive to the Development of Renewable Energy in Asia? Energy Policy 2023, 173, 113381. [Google Scholar] [CrossRef]
  23. Chen, X.; Li, Y.; Song, L.; Wang, Y. Theoretical Framework and Research Prospect of Digital Economy. J. Manag. World 2022, 38, 208−224+213−216. [Google Scholar]
  24. Fang, D. Impact of Digital Economy on Energy Utilization Efficiency of Chinese Cities from the Perspective of Technology Empowerment and Spillover. Resour. Sci. 2023, 45, 296–307. [Google Scholar] [CrossRef]
  25. Ingram, J.; Maye, D. “How Can We?” The Need to Direct Research in Digital Agriculture towards Capacities. J. Rural. Stud. 2023, 100, 103003. [Google Scholar] [CrossRef]
  26. Benitez, G.B.; Ghezzi, A.; Frank, A.G. When Technologies Become Industry 4.0 Platforms: Defining the Role of Digital Technologies through a Boundary-Spanning Perspective. Int. J. Prod. Econ. 2023, 260, 108858. [Google Scholar] [CrossRef]
  27. Jiang, M.; Jia, P. Does the Level of Digitalized Service Drive the Global Export of Digital Service Trade? Evidence from Global Perspective. Telemat. Inform. 2022, 72, 101853. [Google Scholar] [CrossRef]
  28. Chen, Y.; Zhang, X. Research on the Influence Mechanism of Digital Economy Development on Regional Industrial Structure Optimization: Empirical Analysis Based on China’s Provincial Panel Data from 2011 to 2019. Collect. Essays Financ. Econ. 2023, 39, 14–23. [Google Scholar]
  29. Yu, B. Digital Economy, Market-Oriented Allocation of Factors, and Regional Innovation Capability. Econ. Manag. 2022, 36, 36–42. [Google Scholar]
  30. Zhang, M. Digital Industrialization, Allocation of Innovation Factors and Transformation of Real Economy. J. Tech. Econ. Manag. 2023, 3, 45–49. [Google Scholar]
  31. Peng, Y. Comprehensive Allocation of Innovation Factors and Adjustment of Industrial Structure under Digital Economy. Contemp. Econ. Manag. 2022, 44, 48–58. [Google Scholar]
  32. Wen, Z.; Ye, B. Analyses of Mediating Effects: The Development of Methods and Models. Adv. Psychol. Sci. 2014, 22, 731–745. [Google Scholar] [CrossRef]
  33. Cai, S.; Mou, G.; Fang, M. A Study on Driving Forces of China’s Industrial Structure Optimization under the Carbon-Intensity Abatement Objective. Chin. J. Manag. Sci. 2011, 19, 167–173. [Google Scholar]
  34. Fukuyama, H.; Weber, W.L. Estimating Output Allocative Efficiency and Productivity Change: Application to Japanese Banks. Eur. J. Oper. Res. 2002, 137, 177–190. [Google Scholar] [CrossRef]
  35. Cooper, W.W.; Seiford, L.M.; Tone, K.; Zhu, J. Some models and measures for evaluating performances with DEA: Past accomplishments and future prospects. J. Product. Anal. 2007, 28, 151–163. [Google Scholar] [CrossRef]
  36. Oh, D.H. A Global Malmquist-Luenberger Productivity Index. J. Product. Anal. 2010, 34, 183–197. [Google Scholar] [CrossRef]
  37. Chen, C. China’s Industrial Green Total Factor Productivity and Its Determinants: An Empirical Study Based on ML Index and Dynamic Panel Data Model. Stat. Res. 2016, 33, 53–62. [Google Scholar]
  38. Liu, Z.; Xin, L. The Impact of the “Belt and Road” Construction on Green Total Factor Productivity in China’s Key Provinces along the Route. China Popul. Resour. Environ. 2018, 28, 87–97. [Google Scholar]
  39. Cui, X.; Lin, M. How Does Foreign Direct Investment Affect the Green Total Factor Productivity of Enterprises? Empirical Analysis Based on Malmquist-Luenberger Index and PSM-DID Model. Bus. Manag. J. 2019, 41, 38–55. [Google Scholar]
  40. Liang, L.; Yu, B. Economic Growth: The Synergistic Effect of Technological Innovation and Industrial Structure Upgrade. Stud. Sci. Sci. 2021, 39, 1574–1583. [Google Scholar]
  41. He, L.; Fu, L. Innovation Factors Synergy, Marketization Reform and Manufacturing High-Quality Development. Theory Pract. Financ. Econ. 2021, 42, 126–131. [Google Scholar]
  42. Yu, Y.; Lu, Y. Studies on Centrelity of Provincial Capitials. Econ. Geogr. 2005, 44, 352–357. [Google Scholar]
Figure 1. Mechanism analysis.
Sustainability 16 05966 g001
Table 1. Selection of indicators for the SBM-DDF-GML model.
CategoryVariablesIndicatorData SourceUnit
InputLabor (L)Number of employed people in each cityChina City Statistical YearbookTen thousand people
Capital (K)Productive capital stock (perpetual inventory method)China City Statistical YearbookCNY ten thousand
Energy (E)Total energy consumptionChina Energy Statistical YearbookTen thousand tons (of standard coal)
Desirable outputGDPAdjusted GDPChina City Statistical YearbookCNY ten thousand
Undesirable outputCCarbon emissionCEADsTen thousand tons
Table 2. DE indicator system and results using the entropy method.
Primary IndicatorsSecondary IndicatorsTypeUnitInformation EntropyWeight
Investment in intelligent infrastructureInternet penetration rate+%0.9580.057
Year-end number of mobile telephone users+Ten thousand families0.9640.049
Internet+%0.9580.057
Year-end number of post offices+Piece0.9720.038
Innovation capabilitiesThe number of patents+Ten thousand people0.9040.131
Patent invention+Ten thousand people0.8360.223
The number of green invention patent applications+Ten thousand people0.8760.168
Empowered societyInternational internet users+Family0.9440.076
Total telecom business volume+CNY ten thousand 0.9530.064
Total postal business volume+CNY ten thousand 0.9290.096
ICT-driven economic growthNumber of ICT professionals+Ten thousand people0.9700.041
Table 3. Descriptive statistics.
VariablesUnitNMeanS. D.MinMax
TFCP%15961.0010.1730.3432.822
CO2Hundred grams per CNY15962.5581.5420.40211.490
CIV%15960.4420.2070.1471.000
Dig%15960.0730.0550.0090.595
PGDPCNY ten thousand15963.8423.5200.34131.390
GINT%15960.8090.0430.6130.952
PDENHundred people per square kilometer15963.2412.5350.10010.72
ESTRU%15961.2051.5820.09522.460
FDIBillion USD 15962.7394.1660.00229.41
Table 4. Baseline regression result.
VariablesCO2CO2TFCPTFCPCIVCIV
(1)(2)(3)(4)(5)(6)
Dig−12.065 ***−1.532 *0.260 ***0.319 **−0.700 ***−0.448 **
(−6.55)(−1.84)(2.79)(2.47)(−4.25)(−2.46)
Constant3.380 ***20.809 ***0.982 ***0.2600.493 ***1.459 ***
(26.96)(14.60)(143.83)(1.22)(40.92)(4.27)
N159615961596159615961596
Adjusted R20.2890.7300.1650.5290.2520.630
Note: We include control variables and year- and city-fixed effects. Robust standard errors clustered at the firm level are shown in parentheses. ***, **, and * indicate significance at the 0.01, 0.05, and 0.1 levels, respectively.
Table 5. Robustness test.
VariablesFE ModelGMM
DDF-TFCPCO2TFCPCIV
(1)(2)(3)(4)
Digit0.142 **−1.048 ***0.377 ***−0.382 ***
(2.55)(−3.17)(2.64)(−2.96)
L.CO2 0.658 ***
(22.71)
L.TFCP 0.120 ***
(4.26)
L.IE 0.652 ***
(21.01)
Constant0.523 ***4.562 ***0.391 *1.181 **
(5.90)(6.78)(1.70)(2.04)
ControlsYESYESYESYES
Year-FEYES
City-FEYES
N1596148214821482
Adjusted R20.5310.9200.6120.475
Note: Robust standard errors clustered at the firm level are shown in parentheses. ***, **, and * indicate significance at the 0.01, 0.05, and 0.1 levels, respectively.
Table 6. Endogeneity test.
VariablesCO2TFCPCIV
First StageSecond StageFirst StageSecond StageFirst StageSecond Stage
Digit −1.484 ** 0.277 *** −1.520 **
(−2.12) (3.14) (−2.24)
DIS(IV)−0.017 ** −0.017 *** −0.017 ***
(−2.03) (−2.73) (−2.73)
Constant−0.165 **23.859 ***−0.165 ***3.437 ***−0.165 ***3.539 ***
(−2.44)(3.23)(−5.94)(4.22)(−5.94)(4.85)
N159615961596159615961596
Adjusted R20.8370.7160.793
Note: We include control variables and year- and city-fixed effects. Robust standard errors clustered at the firm level are shown in parentheses. *** and ** indicate significance at the 0.01 and 0.05 levels, respectively.
Table 7. Mechanism test (TFCP).
VariablesEnergy Efficiency Industrial Structure UpgradingInnovation Factor Allocation
EEFFTFCPINDUPTFCPINNOTFCP
(1)(2)(3)(4)(5)(6)
Digit0.593 **0.524 ***2.900 ***0.318 **0.311 *0.330 **
(2.37)(2.92)(4.42)(2.23)(1.79)(2.56)
EEFF 0.345 ***
(5.45)
INDUP 0.110 *
(1.72)
INNO 0.035 **
(2.04)
Constant0.756 ***0.521 **−1.543 **0.2600.922 **0.228
(3.15)(2.28)(−2.32)(1.20)(2.01)(1.08)
N159615961596159615961596
Adjusted R20.1730.4720.3090.5140.4070.616
Note: We include control variables and year- and city-fixed effects. Robust standard errors clustered at the firm level are shown in parentheses. ***, **, and * indicate significance at the 0.01, 0.05, and 0.1 levels, respectively.
Table 8. Heterogeneity tests of the TFCP of various development stages of resource-based cities.
VariablesMatureRegeneratingGrowing Declining
(1)(2)(3)(4)
Digit0.429 **0.112 **0.121 ***0.034 **
(2.02)(2.39)(3.24)(2.06)
Constant1.049 ***2.544 ***0.905 *0.590 **
(3.15)(4.58)(1.83)(2.27)
N882210196308
Adjusted R20.3220.4360.2030.322
Note: We include control variables and year- and city-fixed effects. Robust standard errors clustered at the firm level are shown in parentheses. ***, **, and * indicate significance at the 0.01, 0.05, and 0.1 levels, respectively.
Disclaimer/Publisher’s Note: The statements, opinions and data contained in all publications are solely those of the individual author(s) and contributor(s) and not of MDPI and/or the editor(s). MDPI and/or the editor(s) disclaim responsibility for any injury to people or property resulting from any ideas, methods, instructions or products referred to in the content.

