Article

Understanding the Dairy Sector in Slovenia: A Modeling Approach for Policy Evaluation and Decision Support

Department of Animal Science, Biotechnical Faculty, University of Ljubljana, Groblje 3, 1230 Domžale, Slovenia
*
Author to whom correspondence should be addressed.
Sustainability 2024, 16(14), 6009; https://doi.org/10.3390/su16146009
Submission received: 30 April 2024 / Revised: 28 June 2024 / Accepted: 10 July 2024 / Published: 14 July 2024
(This article belongs to the Section Sustainable Agriculture)

Abstract

:
This study investigates the dairy sector in Slovenia, focusing on farm heterogeneity, efficiency in resource utilization, and policy implementations. Through a modeling approach, we explore the differences among dairy farms, considering factors such as herd size, farm management, natural conditions, and production potential. Based on 32 typical dairy farms, representing the entire dairy sector, composed of 6400 dairy farms, the analysis was performed using the farm model (SiTFarm). We emphasize the importance of accurate assessments, given the variability of policy impacts across farm types. While medium-to-large, specialized farms dominate milk production, smaller farms, particularly in less favored areas, hold social and environmental importance despite facing competitive challenges. Addressing environmental sustainability could involve promoting practices that improve milk yield and include grazing, as this tends to lower greenhouse gas emissions per kilogram of milk (−5%). Dairy farms contribute about one-third of the generated revenue in Slovene agriculture, of which a good half goes to farms located in less favored areas. They manage a good quarter of permanent grassland in Slovenia, and it is certainly the sector that can achieve the highest return on these areas. In 75% of the farms, the gross margin is higher than 1756 EUR/ha and using best practices they exceed 3400 EUR/ha. The model results indicate that the average hourly rate on dairy farms during the observed period falls within the range of EUR 7.3 to 17.4 of gross margin for most farms, with the top-performing ones exceeding 24 EUR/h. However, due to the significant reliance on budgetary payments (on average, 58% of the gross margin), the implementation of the common agricultural policy strategic plan generally leads to a deterioration in the economic indicators of dairy farms. This impact is particularly pronounced on medium-sized and larger farms, increasing the effect on income due to the substantial fixed costs involved. Our findings underscore the interplay between policy interventions, farm characteristics, and sectoral outcomes, offering valuable insights for policy-makers and stakeholders.

1. Introduction

The milk sector is one of the key sectors of agriculture in the EU. Dairy farms are a fundamental component in this sector, and their development directly impacts milk production [1]. Sustainability in dairy production is a multifaceted issue, encompassing environmental, economic, and social dimensions. However, both the potential and the structure of dairy herds within the sector exhibit significant variation across and within each member state. In the EU, medium-sized and large, highly specialized dairy farms play a key role in milk production [2]. However, small- and medium-sized farms are important from a social and environmental perspective since they are usually located in marginal areas. As summarized by Kellermann and Salhofer [3], many regions in the heart of the EU, including Slovenia, rely exclusively on permanent grassland for agricultural production. These areas, often found in high and mountainous regions, such as those around the Alps, pose natural handicaps for dairy farms. Specifically, the production of energy fodder crops like corn silage is challenging due to high precipitation, lower average annual temperatures, shorter vegetation periods, and steep slopes.
As highlighted by Borawski et al. [4], an important characteristic of milk production is the existence of economies of scale. The study by Parzonko et al. [1] also confirmed that one of the main factors determining the competitiveness of dairy farms is the scale of production. Due to the law of economies of scale, smaller farms incur higher fixed costs per unit of production. Additionally, they are less efficient in purchasing inputs, which are typically more expensive because they receive smaller discounts. An additional challenge is on the sales side, as they have significantly less bargaining power. On the other hand, for larger farms, it is typical to have a high level of labor productivity mainly due to favorable production potential [2], namely that increasing the scale of production enables technical progress [1]. However, the opposite holds true for small semi-subsistence and small farms, usually located in a less favored area (LFA) region, that achieve much lower labor productivity. They have higher unit production costs in comparison to larger farms and are, from an economic perspective, less efficient. On the other hand, smaller farms have advantages such as more time for individual animals, less competition, fewer different personnel, etc. [4]. It is precisely these farms that often abandon farming due to poor economic sustainability. MacDonald et al. [5] discussed some of the undesirable effects agricultural abandonment in mountainous regions can have on environmental parameters, such as reductions in biodiversity and landscape quality. Certainly, the resilience of agricultural holdings is a critical aspect. Scientific research indicates that only resilient farms can effectively achieve their goals, mitigate the impact of disruptions, and adapt to changes in the environment. Koloszycz et al. [6] discovered that farmers perceive ensuring resilience primarily through achieving high income and high production flexibility, which, of course, is easier to reach on a larger dairy farm.
The structure of the dairy herds significantly impacts countries’ efficiency in milk production as well apparent annual milk yields per dairy cow [7]. The average milk yield per cow in the EU reached 7653 kg milk in 2022 and continued to rise. As a national average, annual yields were the highest in Denmark (10,187 kg per cow) and Estonia (10,128 kg per cow) and lowest in Romania (3367 kg per cow), while in Slovenia falls within the second quartile, with an average yield of 6706 kg per cow. So, 75% of members states have higher milk yield per cow, which, given the natural conditions and the proportion of permanent grassland in Slovenia, is not surprising.
Slovenia is, of course, not on the list of key milk producers in the EU, but at the national level, the dairy sector is the most important from the point of view of the added value created in agriculture as well as from a social and environmental perspective. Dairy farms are the main employers within agriculture, and in most cases, these are family farms. Dairy farming could be characterized as a capital-intensive sector. Farmers have to invest to keep their farms in good condition, maintain competitiveness in the market, increase the rate of technology adoption, and improve labor productivity. However, small and medium dairy farms usually, due to insufficient production potential, fail to provide a satisfactory level of income that could increase their investment potential and growth [8]. Hence, Common Agricultural Policy (CAP) measures play a vital role in supporting dairy production and indirectly guide structural changes, where less productive land remains in production. The CAP aims to support the EU agricultural sector in addressing local and global challenges and to drive the development towards a smart, sustainable, competitive, resilient, and diversified agricultural sector to ensure long-term food security [9]. The share of budgetary payments in dairy farms economic indicators varies between member states. Očić et al. [10] are reporting that, for example, Croatian dairy farms have a higher share of direct payments than the EU average, ranging on average between 47% and 55% of net value added. The importance of budgetary payments is also different on Slovenian dairy farms, where we do not have very large producers, but there is a larger share of medium-sized farms. Poczta et al. [2] classified Slovenia in the same group as Croatia based on an EU-level Farm Accountancy Data Network (FADN) analysis. But there are big differences within dairy herds. A challenge arises as we lack comprehensive economic data on these farms in Slovenia. Only the largest farms maintain sufficient bookkeeping records, such as those included in the FADN, enabling business analysis, but not at the sector level. Considering the great importance of budgetary payments, it is also important to analyze what CAP strategic plan (CSP) brings for the period 2023–2027 to these different types of farms.
In doing so, it is possible to rely on modeling. The use of various methods to support political decision-makers on the one hand and to monitor implementation on the other has a long history. Reviewing the literature, one could find various examples of their use, especially for ex-ante analyses, ranging from macro-sectoral analysis (models based mainly on the partial and general equilibrium approach), which were particularly widespread in the first phase of analysis by agricultural economists, to the microsimulation models that emerged in the last phase [11]. The need for farm-level models became more apparent after the 2013 CAP reform, which introduced greening as an additional conditional level of farm-specific obligations for receiving direct payments [12]. These are a type of microsimulation model commonly referred to as bioeconomic farm models (BEFM). BEFMs are often used to assess the economic situation of farms and to model the impact of various policy and market changes [13]. In most cases, these are models based on the optimization potential of mathematical programming [13]. Van der Linden et al. [14] emphasize that mathematical programming models, once operational, allow relatively quick and cost-effective analyses to be carried out, although their development is often laborious and costly. Such models enable a better understanding of decision-making and management at the farm level and, on the other hand, give policy-makers a better insight into what is happening on individual farms, enabling them to make better evidence-based decisions and thus achieve greater targeting. Van der Linden et al. [14] mention some reviews of existing farm models that have been used for policy analyses and support. In addition, Britz et al. [15] also mention life cycle assessments and agri-environmental simulations as examples of policy impact assessment models. These models naturally differ both in terms of the input data and the modeling assumptions.
The paper has two main objectives. The primary objective of the analysis is to enhance the understanding of the dairy sector, including the contribution and utilization of key resources. We aim to explore differences among dairy farms, such as herd size, cultivated area ratio between arable land and permanent grassland, herd management, breed, housing system, influence of LFAs, and the significance of budgetary payments. Special attention is devoted to analyzing the CAP measures (baseline) and the changes introduced by the CSP for the period during 2023–2027. In addition, we analyzed the carbon footprint as one of the key environmental indicators. The second main objective is to provide an example of how such an analysis could be conducted using a modeling approach and how, in such a manner, policy decision-making could be evaluated and supported. Indeed, as emphasized by Reidsma et al. [13], the impacts of policies are likely to vary across different farm types. For example, Poczta et al. [2] show this in their research, where they seek to determine the economic situation of dairy farms in EU countries grouped into different types according to their production potential. Therefore, employing models that differentiate impacts for various farm types is essential for delivering accurate assessments.

2. Materials and Methods

2.1. SiTFarm Tool

Below, we briefly present the modeling approach used and the principle of typical agricultural holdings (TAHs) that has been applied to analyze the dairy sector in Slovenia from the point of view of different criteria (herd size, management, housing system, utilized area, LFA regions, and possibilities of fodder production) and thus present the contribution of each TAH as well as the utilization of main resources.
For the purpose of analyzing the dairy sector in Slovenia, we used the SiTFarm tool (Slovenian Typical Farm Model Tool). This unique tool enables analysis of typical farms, representing 6400 dairy farms in Slovenia. It is an example of BEFM, based on mathematical programming, which combines three modeling approaches (Figure 1). First are the static models of TAHs, which are different farming systems (production models) that could be found in practice. The second are budget calculation models (model calculations—MC) as the main source of economic and technological data at the level of production activities. And the third is the farm model (FM), which merges both previous modeling approaches and enables autonomous calibration of farm production plans according to technological axioms and each farm’s production constraints and endowments.
SiTFarm could be described as a bottom-up modeling approach that enables (i) an analysis at the level an individual production activity within a farm production plan, (ii) an analysis at the farm level, and (iii) an aggregate analysis at the level of the sector. However, the main focus of analysis is the production plan at the farm level.
SiTFarm is based on the principles of mathematical programming with constrained optimization. This allows the use of different techniques in solving the production plan, depending on the purpose of the analysis. In the given version, deterministic linear programming (LP) is used; however, it is also possible to upgrade it with other optimization techniques, such as goal programming, quadratic programming, etc. The matrix of production possibilities as the core level of the analysis is a classic example of production planning in which we focus on finding the optimum allocation of production resources, considering production, environmental, and legislative constraints per analyzed farm.
In our analysis, the main focus was to analyze the dairy sector. So, we were interested in how the sector performs, what are the main characteristics of dairy farms, and how they contribute to the dairy sector. Our aim was therefore not to optimize the production plan of each farm, but we tried to simulate the situation per farm as it is in the given time period. Calibrating and validating a model are crucial steps in ensuring its accuracy and reliability. Therefore, we reconstructed the production plans according to the data that we presumed per farm type (intensity and size of production, share of available agricultural land, tillage and conservation technology, allocation of main production inputs, etc.). This is usually not the optimal allocation of production resources, but there are situations that could be found in practice and could deviate from optimal allocation due to numerous reasons. This process of calibration could be characterized as “partial optimization”, which is an upgrade of classical LP. It is a relatively complex system of additional equations, which helps us to calibrate the solution. In the literature [13] it is mentioned that such a procedure can be used when we apply a normative method to solve positive challenges. It is an approach that enables the regulation and control of material flows within a farm. That makes it possible to calculate the values of those variables that are not known or some specific details which we want to calculate in such a way that the production plan is complete and also technologically consistent (fodder requirements are covered, share of different fodder produced is consistent with farm’s needs, conditions, arable and grassland availability, technology applied, crop rotation, etc.). So, the key purpose of the SiTFarm is not to optimize production, but to reconstruct the situation on the farm with the support of the optimization potential of mathematical programming. The validation process included comparing model outputs to real-world data by assessing the results against available statistical data and data from other sources.
The problem of reconstructing the production plan is based on the fact that we define the values of all key production activities, or at least the lower and upper limits. The values of unknown variables (xj) are calculated based on the optimization potential of LP in such a way that the solution is technologically appropriate (balances of nutrients and purchased fodder, balances of different categories of animals, balances of mineral fertilizers, etc.) and feasible. Partial optimization refers to the fact that a certain portion of the activities (xf) are fixed and require that the solver also include them in the optimal solution to a given extent (bf).
m a x E G M = j = 1 n c j x j + f = 1 n c f x f
So that
j = 1 ; f = 1 n ; r a i j x j + a i f x f b i   for   all   i = 1   to   m
x f = b f   for   all   f = 1   to   r
x j 0   for   all   j
where: n—number of activities included in the production plan of the analyzed farm; m—number of constraints taken into account when drawing up the farm’s production plan; r—total number of binding constraints on the inclusion of production activities in the production plan, those defining the type of farm—e.g., number of dairy cows, heifers, beef cattle, etc.; j—sequential production activity, marketing activity, technological activity; i—sequential constraint in the model; bi—limitation of a single resource (e.g., ha of arable land); aij—technological coefficients per production activity; cj—objective function coefficients (e.g., gross margin per unit of activity); bf—e.g., the number of dairy cows, heifers, and cattle in the herd.
All activities (xf), the scope of which is known (e.g., number of livestock), are fixed with additional constraints (bf). In most cases, these activities are those that also define the farm type and were set up in the phase of defining TAHs. These constraints also do not change during further scenario analyses. In the analyzed case of dairy TAHs, the key constraints were related to animal production, such as the number of dairy cows, heifers, and, where appropriate, also beef cattle, as we encounter in practice on particular farm types.

2.2. Sources of Data

As the main source of economic (cj and cf) and technological data (technological coefficients—aij) for the individual production activities, the model uses the budget calculations (model calculation—MC). These are static production models of production activities, which are otherwise part of an independent system prepared by the Agricultural Institute of Slovenia [16]. They include different models of all main agricultural production activities ranging from fodder production, market crops, and vegetable production down to livestock models. MC enables the real-time adjustment of individual budget calculations in terms of production technology, intensity (yield), and price–cost relations to the conditions on the analyzed farm (TAHx). Therefore, MC could be characterized as an independent simulation tool, which, through built-in functional dependencies and dynamic connections, enables the simulation of agricultural production in different production conditions. Thus, on the basis of certain input technological parameters, they make it possible to estimate the consumption of inputs and thus the production costs for individual agricultural activities. The consumption of inputs depends on the intensity (yield), the size of the plot or herd, the distance, the slope, and, in some cases, some other technological parameters. These simulation models allow us to prepare a set of technological coefficients for each analyzed farm, which enters the matrix of production possibilities.
This part is also linked to the price list and thus enables the calculation of economic parameters for different time periods. The average price–cost ratios included in the MC presented in this paper relate to the three-year period: 2020, 2021, and 2022.

2.3. Typical Agricultural Holdings Specialized in Dairy Farming

The second set of models included in SiTFarm are models of typical agricultural holdings (TAHs). They can be defined as static models that enable the simulation and analysis of various factors at the level of the farm’s production plan. Here, the production plan reflects the expected situation of a certain type of agricultural holding, which is thus representative of a larger number of real agricultural holdings. Therefore, it is not a specific farm, but an average representative for a certain group of farms.
The analysis of the dairy sector was performed on 32 typical dairy farms (Table 1), whose main economic activity is milk production. In addition, they can also be engaged in the breeding of heifers and beef cattle. At the starting point, our idea was that the sector would be represented by the number of representative farms equaling a contribution (%) to the total standard output (SO) in agriculture. Furthermore, it turned out that a slightly larger number will be necessary for better representativeness of the sector.
TAHs were defined in two main steps. At the beginning, we undertook a detailed analysis of available statistical data and SO analysis. Based on the results of this step, we prepared drafts of production plans of typical farms representing the dairy sector. In this step, we monitored the representativeness of individual typical farms according to the analyzed data. In the next step, they were upgraded and further developed at two workshops. For this purpose, a slightly adapted Delphi method was applied that relies on a panel of experts and enables us to reach a group consensus regarding the production plan and main production constraints of each farm type, dependent on the region, technology of breeding, breed, utilized arable area (UAA), production endowments, etc. In this process, we took into consideration both technological and economic indicators and, through repeated iterations, arrived at the final production plans with production limits within which each type of farm operates. The Delphi method is effective in cases where expert judgment from a diverse panel is required, direct evidence and detailed data are limited, and achieving consensus among diverse experts is important. On the other hand, we also monitored coverage from the point of view of the total sector, region, utilization of land, and other indicators. Furthermore, FM was used in the final calibration and setting of production plans. In such a manner, we achieved the representativeness of each TAH at the aggregate level. Table 1 shows the baseline production factors of individual TAH. We present only the key production factors for each type.
There is a total of 6400 dairy farms, but they differ significantly in terms of production resources (e.g., permanent grassland, arable land, and labor), as well as in management, production potential, and forage conservation techniques. For each TAH, we present how many real farms it is representative of, as well as the key production factors. Despite being above-average in terms of the size of UAA based on the Slovenian average, 75% of these farms have fewer than 25 dairy cows. More than 42% of all cattle are raised on dairy farms (<25 dairy cows), utilizing 53% of the utilized arable area in the dairy sector. From this perspective, the dairy sector holds significant importance in Slovenian agriculture. However, we can still find farms that breed only one dairy cow; however, the most numerous are herds with up to 16 dairy cows. Larger farms (>35 dairy cows), which are numerically less represented, are, of course, key to the sector and a driving force. The largest farms raise 180 or even more dairy cows. However, in our approach to TAHs, this is the largest farm, and for those rearing more than 180 dairy cows, a multiplier could be applied.
Besides the number of cows in a herd, TAHs also differ by breed structure. As apparent from Table 1, breeds vary from Simmental, with lactation production between 4000 and 7000 L of milk, to Brown breeds, with milk production between 6000 and 7500 L, to mixed herds of different breeds and to the herds with Holstein breed, milking up to 9000 L, and some even more. Weighted average in our model is 6489 L per lactation, which is almost the same as the annual milk yield per dairy cow for the same period [7].
All farms have their own breeding of heifers. If they breed a larger number than necessary for replacement, they could sell them on the market, otherwise they purchase the difference to the necessary number as pregnant heifers. The replacement period differs significantly between farms. In herds with less than 15 cows, it is most often between four and five years; in larger herds, it is usually below four years and in some even below three years.
In the TAH models, we assumed various housing systems for dairy cattle. The tied-in housing systems (T) technology occurs in herds of up to 25 milking cows. Free-stall technology (F) is typically found on farms with more than 35 dairy cows (Table 1). There are also different milking systems in place that most significantly influence the amount of labor requirements.
Bull fattening also takes place on certain dairy farms. The total number of bulls in the milk production sector is over 22,000 animals. In most cases where fattening occurs, it is on a smaller scale (<25). Except for a few types of farms with a larger number of milking cows and free-stalls, this is mainly present on smaller farms with a few dairy cows. The intensity of fattening varies between 0.8 and 1.2 kg of average daily weight gain. In all cases, fattening is supposed to start at 120 kg. The final body weight depends on the breed and varies between 650 and 720 kg.
In addition to breed structure and genetic potential, milk production is highly dependent on available arable land and grassland. From this perspective, however, farms differ both in the ratio between arable land and permanent grassland as well as in the quality and quantity of forage produced. The production technologies are very diverse (Table 1). Thus, we come across examples ranging from two-cut permanent grassland, with a low yield and poor quality (a), all the way to multi-cut systems, where the quality of the forage produced is top-notch (q, r, s). In general, farms that produce grass silage both on permanent grasslands and fields with a legume–grass mixture, achieve, on the latter, one class higher for quality and nutritional value. However, the average cutting on dairy farms is slightly more than three times a year on permanent grassland and four on arable land. On the latter, the quantity of dry matter produced is 25% higher than on permanent grassland, where it ranges between 5000 kg and 9000 kg/ha.
From an economic point of view, the structure and size of cultivation land is also important. If we leave out larger agricultural holdings that raise more than 80 dairy cows, we could generally say that dairy farms in Slovenia cultivate plots between 0.4 and 0.8 ha, with an average size of 0.6 ha. A significant challenge for most of these farms is also the fragmentation of the land. These areas are at different distances from the farm, on average 1.6 km. The profitability of land management and, above all, feed preparation for the animals is also influenced by the farm’s equipment and investment in machinery. Here, “1” means poor equipment, “2” indicates semi powerful equipment, and “3” represents modern, and powerful equipment (Table 1). This relates to the power of tractors (measured in kilowatts) and the capacity of machinery (measured in hours per hectare, cubic meters per hour, cubic meters per transport, meters per cut, etc.) typically used on dairy-type farms. In general, we could say that, beside farms with smaller herds (less than 15 dairy cows), dairy farms are well equipped.
For easier following of the TAHs main characteristics we defined the universal code of an individual farm. From the code (e.g., TAH1-0001_SI_4000_Ga), it is possible to draw conclusions on number of dairy cows (0001), the average milk yield in the herd (4000 L) per lactation, predominant breed, which in this case is a Simmental breed (SI), and also the type of agricultural land prevailing on the farm. The latter is strongly conditioned, especially by the natural conditions of the farm, and thus improve the possibilities of producing their own fodder in terms of quality and volume. The size of the letters (G and g for permanent grassland and A and a for arable land) reflects the situation on the typical farm. In this case, grassland (G) predominates and only a minor share falls on arable land (a).

2.4. Sector Level Analysis

In the next step, we carried out an analysis at the sector level, where the solutions derived from individual TAHs are further extrapolated to the sector level. This is achieved through weighting regarding the number of real farms (Table 1). In this aggregating step, it is no longer about finding an optimal solution. The assigned weights for each farm are taken into consideration, and the sum of products is calculated at the sector level. This applies to economic as well as technological indicators and, where it makes sense, also to the calculation of environmental indicators.
The approach enables the calculation of results both at the level of the dairy sector as well as at the level of different groups of farms characterized by certain common factors (e.g., LFAs or no LFAs).

2.5. Scenario Analysis

As a starting point, we analyzed the baseline situation in the dairy sector. Thus, we were primarily interested in the results achieved by an individual TAH as well as its contribution to the total aggregate values at the sector level. We are interested in both economic and selected physical and environmental indicators. Since we are in the period when the CAP reform took place, in addition to the baseline, we are also interested in what the CSP for the period 2023–2027 brings to the dairy sector. Where relevant changes are shown as a relative change to the baseline (BL). Here, it should be pointed out that the production plan of each TAH remains the same in the scenario analysis, except where minor changes are the result of CAP measure conditions.
In Table 2, we present the key changes in the measures that take place in the reformed period and are relevant for the analyzed typical agricultural holdings; therefore, they were considered in the analysis. It should be noted that all results refer to the three-year price average for 2020, 2021, and 2022.
Since the main purpose of the analysis is to better understand the dairy sector, we also analyzed the results according to different criteria (LFA, housing system, utilized area and possibilities of fodder production) and thus saw the contribution as well as utilization of main resources.

3. Results

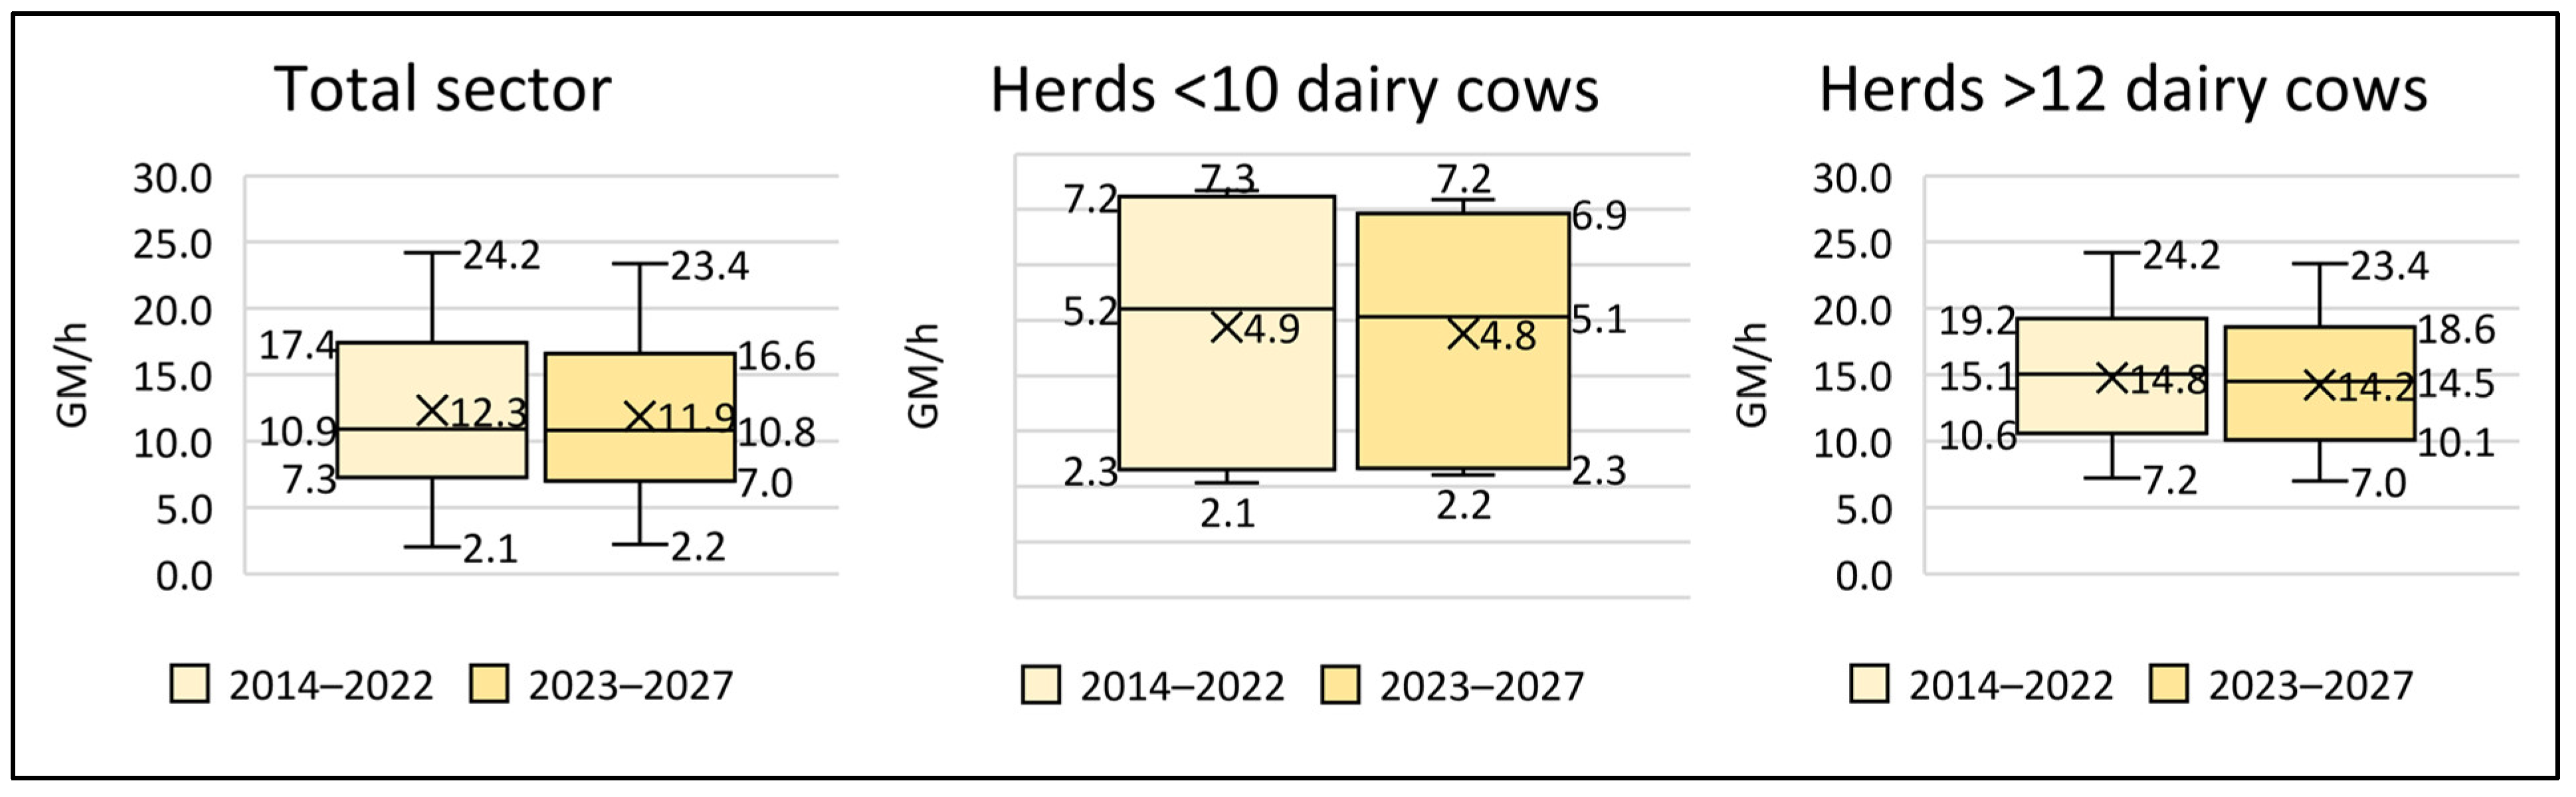
3.1. Selected Economic Indicators for Typical Agricultural Holdings

As can be seen from Table 3, the farms’ results differ significantly. The average size of TAH is 27 ha of UAA, while the median size is 18.3 ha. This indicates that most of these are small family farms primarily operating on permanent grassland, with some fodder also grown in fields. The median number of dairy cows is 22, which is less than the average of 34.8 dairy cows in the herd. Additionally, 25% of TAH have fewer than 11 milking cows, and 75% have fewer than 35. The need for labor is also closely related to this, with the median being 1.7 FTE per TAH. The smallest farms employ less than 0.5 FTE, while the largest farms employ more than 7 FTE. The median milk yield is 7000 L, with 75% of the farms producing less than 7500 L of milk per cow. The highest milk yield is found both in medium-sized small herds (with 19 dairy cows) and in medium-sized large herds, but generally not in the large herds. On dairy farms, bull fattening is also carried out on a smaller scale. In 75% of cases, it involves less than 10 beef cattle per year, with a median of 6 beef cattle.
In the case of smaller subsistence farms, the economic result is expected to be poor. Typically, due to the slightly higher prices of both milk and beef, the revenue calculated per cow remains competitive, despite the smaller herd size. However, the costs are significantly higher, and thus the gross margin per dairy cow is significantly lower than on larger farms. At the same time, it is necessary to mention a category of farm that additionally produces hops (TAH 14). It is a special type of farm that is present in only one region and stands out in all economic indicators precisely because of hop production. As noted by MacKinnon and Pavlovič [17], the hops price has been very favorable in the recent period, which is reflected in the significantly favorable economic indicators of this farm type. It is interesting, however, that according to the circumstances of the individual farm, the highest gross margin result per dairy cow is achieved by TAH19 with 25 milking cows (breeding Simental cows with an average of 5800 L of milk per lactation, with almost the same share of arable and permanent grassland). Interestingly, the GM/ha trend is more consistent with herd size. So, with the exception of farms that produce hops in addition to dairy, GM/ha is the highest among larger farms. However, the latter also strongly depends on the ratio of arable land to permanent grassland. If the farm cultivates more arable land, the value is higher. Thus, the median is 1756 EUR/ha, and at as much as 75% of TAHs, it is higher than 1307 EUR/ha.
Budgetary payments (BP) are an important part of revenues for dairy farms. They represent a particularly high share of the gross margin, especially for farms with smaller herds that are usually located in hillier areas (LFA). As apparent from Table 3, on farms with smaller herds (<10 dairy cows), the share of BP in GM could range up to almost 90%, but on average they account for 58% of GM, which is 5% above the median. However, at the first quartile, it is 42%. So, the share is very high. From a social point of view, this group is certainly an important part of the dairy sector; namely, in these TAH groups, there are 50% of all farms engaged in milk production and about 20% of all dairy cows that produce a bit less than 18% of total milk. On larger TAHs with more than 12 dairy cows, this share of BP is, on average, around 26% of the gross margin. The third quartile thus amounts to 31.7%, the median is 25.6%, and the first quartile amounts to just a bit over 21% of BP in GM. The latter indicates that the share of budgetary payments in GM on these farms is much lower but still high.
Dairy is a labor-intensive sector. The range of necessary efficient working hours in dairy farming depends to a large extent on the housing system, as well as the method of fodder preparation and harvesting. The most, of course, comes from the stock of animals in the barn. On average, farms focused on milk production achieve a gross margin of just over 12 EUR/h. The median is slightly below the average. At the same time, only at 25% TAHs, the gross margin is lower than 7.3 EUR/h. These are small farms with less than 10 dairy cows. At 75% of farms, the gross margin is lower than 17.4 EUR/h. However, if we look at herds with more than 12 milking cows, the average hourly GM rate is close to 15 EUR/h and 75% higher than 10.6 EUR/h (Figure 2).
With the CSP (2023–2027), which changes the range as well as the amount of interventions, the situation generally worsens (Figure 2). However, this deterioration is not very pronounced. Especially on smaller farms, the situation can even slightly improve (this can be seen in Table 4 within maximum improvements). A more pronounced deterioration in terms of received budgetary payments occurs mainly on larger farms that raise between 35 and 65 animals. However, this is not very evident in terms of the achieved gross margin. It has a stronger impact on income.

3.2. Greenhouse Gas Emissions and Variations among Different TAHs

Figure 3 presents the emissions of GHGs, measured in CO2 equivalent per kg of milk produced. Model results show that dairy farms, on average, achieve emissions of 0.65 kg CO2 eq. per kg of milk. The most efficient farming practices achieve much lower emissions, at 0.47 kg CO2 eq. per kg of milk. In dairy farming with tied-in housing systems (mostly barns with manure), estimated GHG emissions range from 0.47 to 0.85 kg CO2 eq. per kg of milk, with an average of 0.63 kg CO2 eq. per kg of milk. In free-stalls, the range is between 0.60 and 0.81 kg CO2 eq. per kg of milk (these are mostly barns with slurry stored in an outdoor pit). Generally, the lowest GHG emissions per unit of milk produced are estimated in dairy farms with high milk yields (9.000 L), while the highest emissions occur in farms with low milk yields (0.84 kg CO2 eq. per kg of milk), where animals are kept indoors year-round. Such conclusions are also confirmed by Zehetmeier et al. [18], as far as GHG emissions are measured per kg of milk yield and the reduction in associated beef production is not accounted for, which is also the case in our study. From this point of view, SiTFarm is a static model where we monitored the range of emissions for each type of farm without considering restructuring in the sector and potential impacts on beef production.
GHG emissions from barns with manure storage, with similar average milk yields (7500 L) and other parameters (cow body weight, calving interval, calf weight at sale, no pasture), are about 20% lower (i.e., 0.19 kg CO2 eq. per kg of milk) than emissions from outdoor slurry storage practices mostly applied in free-stalls. The impact of grazing on reducing GHG emissions in tied-in housing systems, with a milk yield of 5800 L, is approximately 5%. Similarly, in larger farms with free-range systems (e.g., with a milk yield of 7000 L). In such a case, emissions are 0.71 kg CO2 eq. per kg of milk for systems without grazing and 0.68 kg CO2 eq. per kg of milk for systems with summer grazing. As apparent in Figure 3, proper management, including grazing and achieving higher milk yield, can have a more positive impact on reducing emissions than merely increasing the herd size, which primarily ensures better economic efficiency.

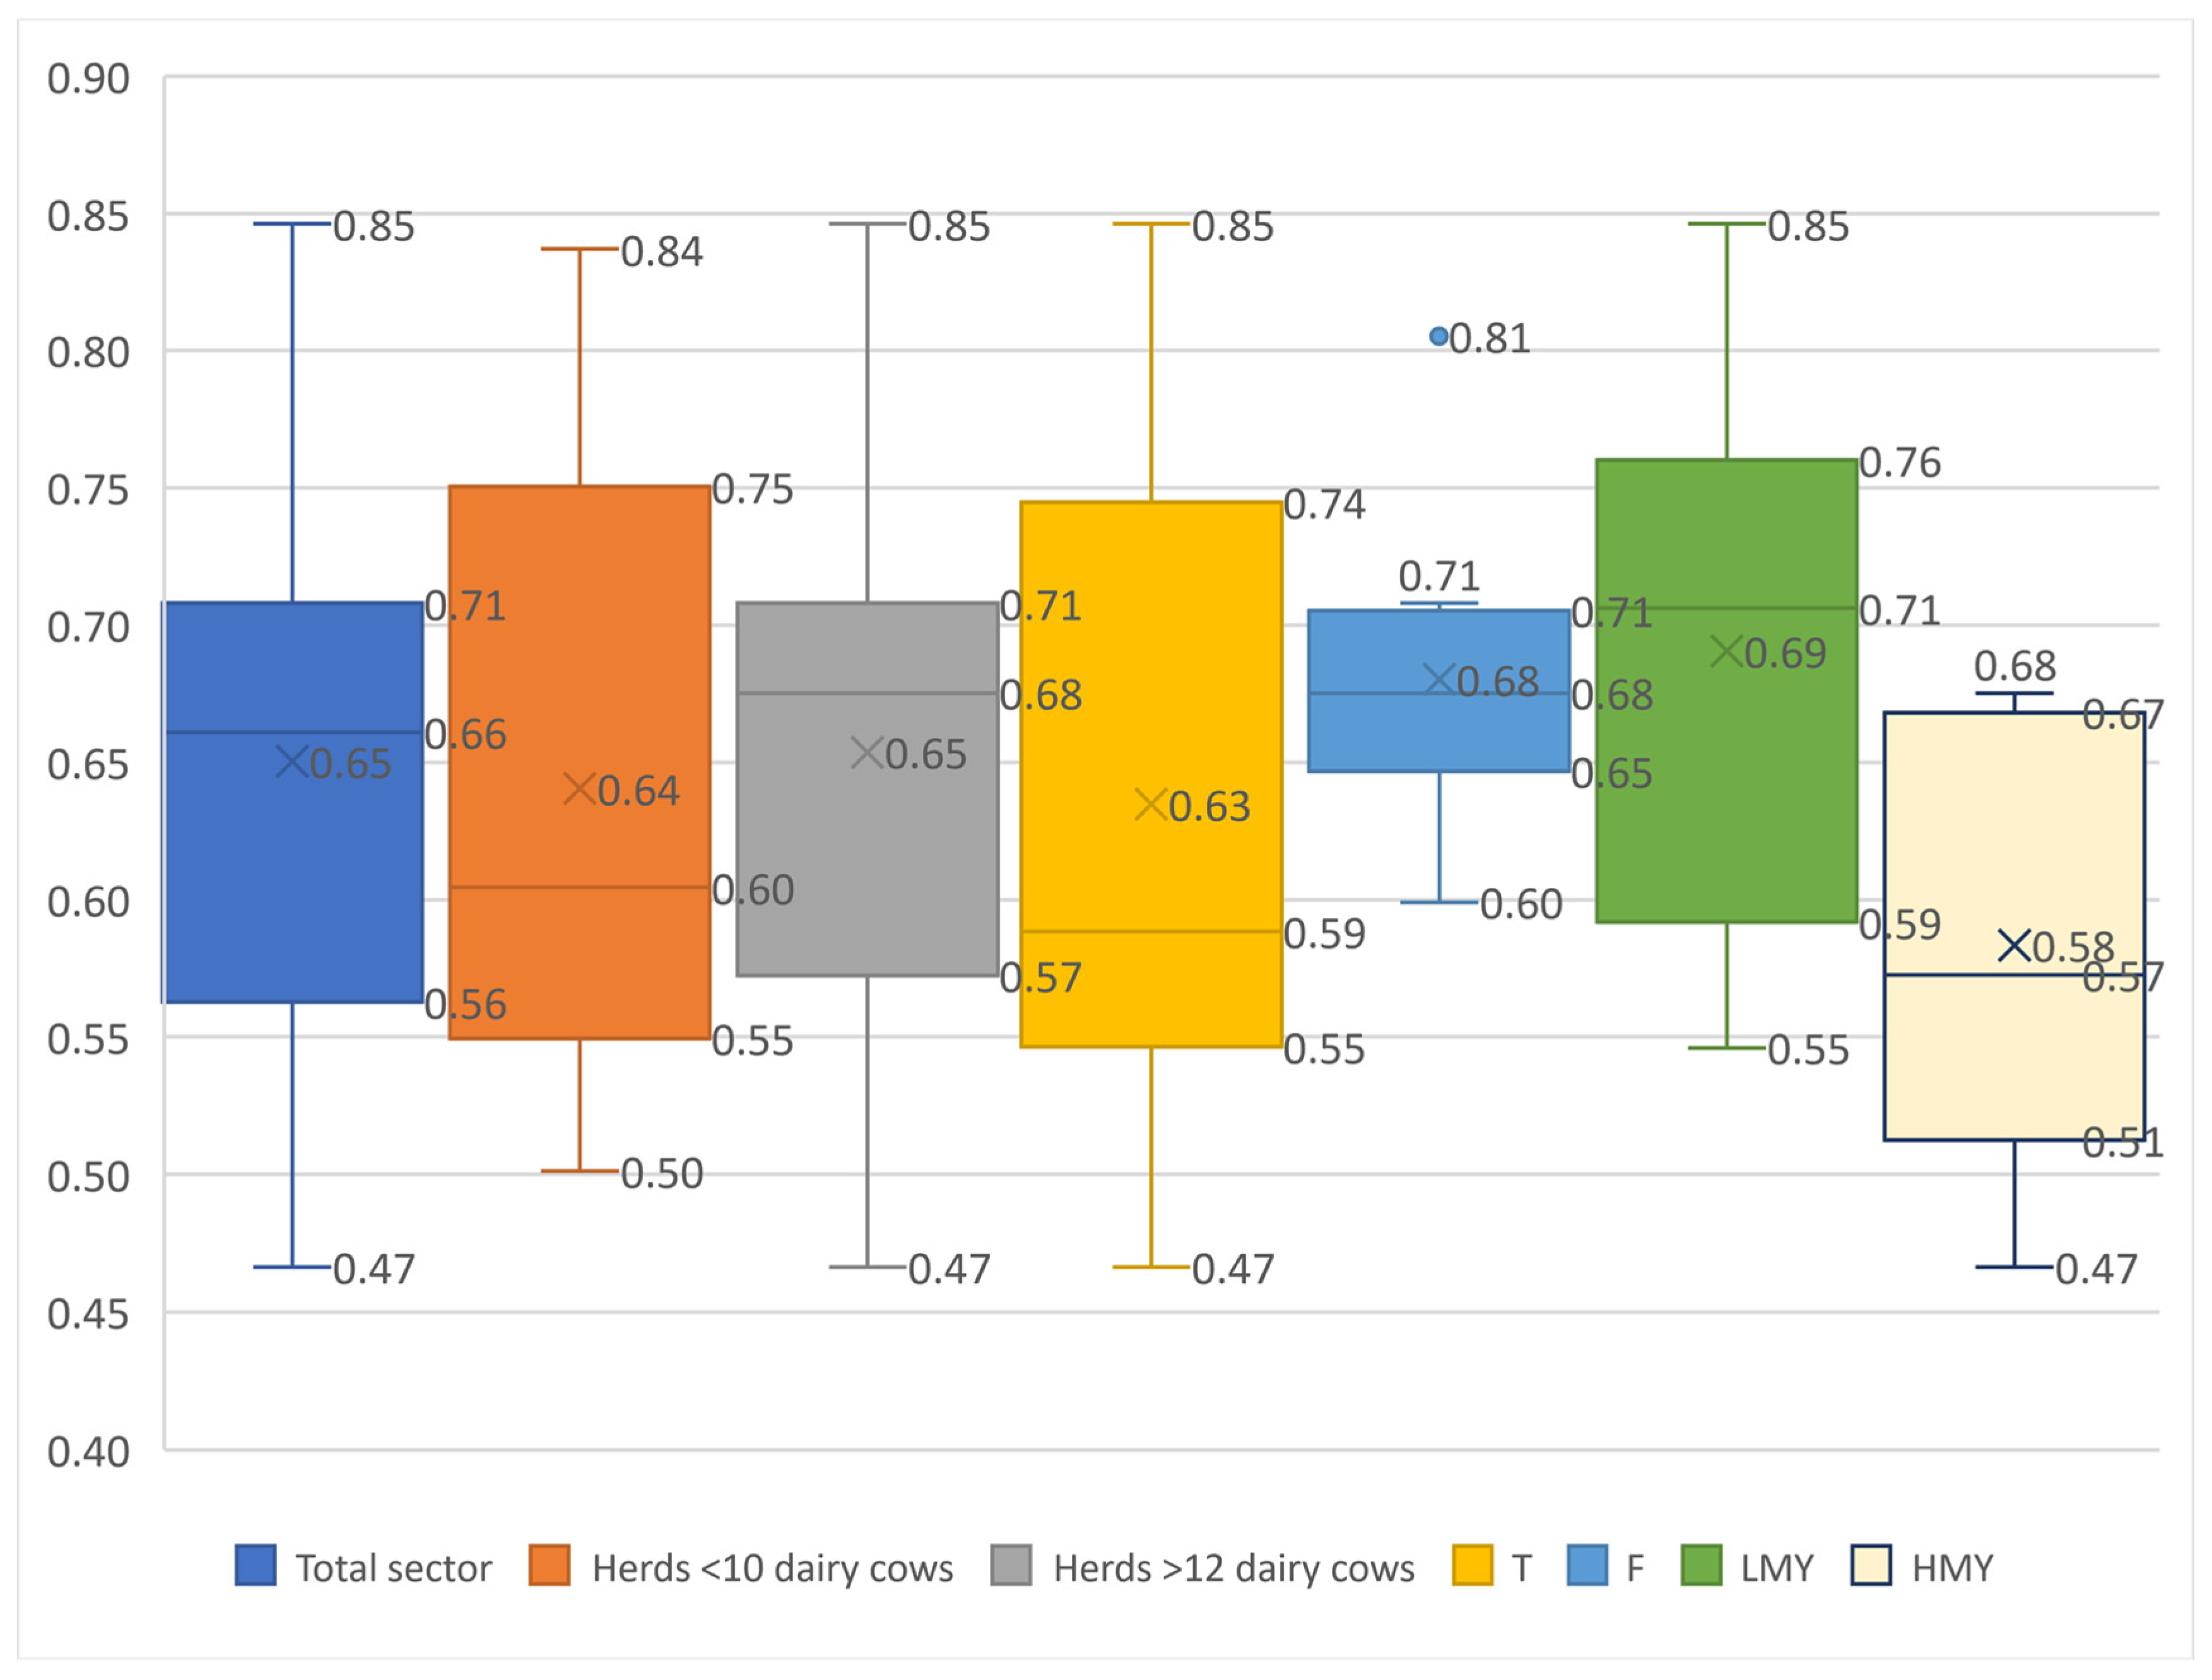
3.3. The Competitive Position of Different Farm Groups in Terms of Production Conditions

In the following, we present the results for different farm groups. We have divided them according to whether they are in a LFA region or not, the housing system, and the ratio of cultivated areas. So, either grasslands and forage from grasslands predominate, or there is about an equal amount of grasslands and arable land, or there is an excess of arable land. As can be seen from Table 4, for each group of farms, we show the minimum, average, and maximum values for the selected economic indicators, as well as the changes brought by the CSP for the period during 2023–2027. It should be noted that the minimum, average, and maximum values are shown separately for each indicator. Thus, positive changes are usually not found on maximum gross margins and vice versa. However, it is clear from Table 4 that the farms in LFAs, on average, achieve lower GM/h than farms on the plain. This is an expected result, especially since these farms cultivate more permanent grassland and costs of production are higher. It is interesting, however, that there are no significant deviations on the side of minimum and maximum values. However, LFA farms are also those that will gain the most from CSP interventions.
The results (Table 4) are also interesting from the point of view of the housing system. Farms that have a tied-in housing system (T) achieve a significantly lower gross margin per invested hour of labor than farms that have free-stall housing (F). This clearly shows the effect of labor efficiency, as well as the impact of the herd size; this system is typically present on farms with more than 35 dairy cows. It is somewhat surprising that the minimum hourly rates for this system are 14.9 EUR/h (Table 4), which is the same as the average value for herds larger than 12 dairy cows. So, these are farms that have a developmental perspective and are important from the point of view of both social and economic sustainability. However, these farms will be the ones that, in absolute terms, lose the most with the new measures.
From the point of view of natural conditions, i.e., the ratio of permanent grassland and fields at the farm’s disposal, there are also significant differences. It should be noted, however, that the farms within each group are not necessarily of equal class size. The results show that, on average, farms based on grass fodder achieve a 50% lower gross margin per working hour than farms whose fodder is grown on arable land. There are even significantly greater differences in the case of farms that reach the lowest GM/h. Even if we look beyond the point of view of the mentioned groups, there is a slight deleterious effect on all of them with the new measures of CSP.
Table 4. Selected economic indicators for different groups of dairy farms in baseline and after implementing CSP.
CAP MeasuresBaseline (2014–2022)2023–2027
Gross
Margin
Gross Margin per FTEGross
Margin per Working Hour
Gross Margin per Working HourGross MarginRevenuesBudgetary PaymentsLFA
(EUR)(EUR)(EUR/h)(EUR/h)Change after CSP (Baseline = 1.000)
MinimumAll136537132.12.20.9360.9680.7390.941
LFAs136537132.12.20.9360.9680.7670.941
NO LFAs379745702.52.50.9430.9770.739/
Tied in136537132.12.20.9370.9760.7391.013
Free-stalls50,42726,81214.914.50.9360.9680.7530.941
Ga, G0136537132.12.20.9420.9690.7730.941
GA, AG663364433.63.50.9360.9680.7390.986
Ag32,44919,28210.710.80.9600.9780.753/
AverageAll24,92718,92010.510.10.9630.9830.8631.089
LFAs22,25618,13510.19.60.9560.9810.8741.089
NO LFAs29,06019,94511.110.80.9710.9850.841/
Tied in16,98914,6058.17.90.9680.9860.8941.111
Free-stalls82,54233,87118.818.00.9560.9790.7981.013
Ga, G012,73613,2337.47.10.9630.9840.9001.069
GA, AG28,43419,96611.110.70.9590.9820.8501.099
Ag57,11725,78314.314.10.9800.9860.859/
MaximumAll312,81043,53824.223.41.0721.0211.0851.213
LFAs297,52541,67423.222.11.0721.0211.0851.213
NO LFAs312,81043,53824.223.41.0101.0000.998/
Tied in53,98628,35515.815.41.0721.0211.0851.213
Free-stalls312,81043,53824.223.40.9730.9850.8871.078
Ga, G060,20132,37518.017.01.0721.0211.0851.213
GA, AG297,52541,67423.222.10.9800.9920.9631.180
Ag312,81043,53824.223.41.0100.9960.969/
Legend: LFAs—less favored areas, FTE—full-time equivalent, G0—There is only permanent grassland at the farm; Ga—The share of permanent grassland is much higher than arable land (>75%); GA and AG—more than 25% of each category of land; Ag—The share of arable land is much higher (>75%) than the share of permanent grassland; CSP—CAP strategic plan.

3.4. Contribution of Dairy Sector and Farm Groups at the Aggregate Level

Table 5 presents the importance of the dairy sector at the level of the entire aggregate, as well as what is reflected within the sector of each group of agricultural holdings. It is obvious that the dairy sector contributes slightly less than 30% of the generated revenues in the entire agriculture. Nearly half of that (51%) falls to the LFAs and half outside the LFAs. However, dairy farms are numerically more represented in the LFAs (61%), and a greater part of permanent grassland is within them (73%), compared to farms outside the LFAs. This is, of course, expected and follows a similar trend on a global scale. As stated by Leiber et al. [19], ruminant production on permanent grassland reduces the production pressure on the globally limited arable land, which is also the case in Slovenia. The model results show that only 12% of agricultural holdings that have a free-stall housing system generate 40% of the total revenue from milk production, or 11.52% of the total revenue generated in Slovene agriculture.
Farms with predominantly arable land are much less represented, which is to be expected given the natural conditions in Slovenia. There is significant competition with food crops in such areas [19], which generally achieve higher income per labor engaged. However, their contribution from the point of view of aggregate revenues in the dairy sector is significant (4.36% out of 29.41%). Considerably lower returns on fodder grown mainly on permanent grassland, as expected, have less impact on the total revenue of the sector, but despite the number of these farms (35%), this is only a few percent higher than in the case of farms with mainly arable land (Table 5).
As can be seen, phytopharmaceuticals for plant protection (PPP) are not a significant issue on dairy farms. However, it can be a challenge for a group of farms with intensive farming that manage primarily arable land. In these cases, a relatively small number of farms (0.8%) account for 5.26% of the total value of the indicator. Mineral nitrogen fertilizers are also mainly associated with more intensive farming practices, such as corn silage and other energy feed production on arable land.

4. Discussion

4.1. Dairy Sector in Slovenia

The research presented in this article shed light on enhancing our understanding of the dairy sector. Firstly, the study seeks to delve into the intricacies of dairy farming by examining various factors. Particular emphasis is placed on evaluating the CAP measures and the modifications introduced by the CSP for the period 2023–2027. The second objective of the study is to exemplify how such an analysis can be conducted using a modeling approach, thereby demonstrating how policy decision-making can be evaluated and supported through farm models. This dual focus not only enhances the comprehension of the dairy sector’s resource utilization and environmental impact but also provides a practical framework for policy evaluation.
The presented results confirm the finding of Parzonko et al. [1] that Slovenia is characterized by a significant number of dairy farms with a relatively small production scale, similar to countries, such as Bulgaria, Poland, Lithuania, and Latvia. An additional challenge is the fragmentation of land, which negatively affects farm profitability. Corral et al. [20] demonstrate that dairy farms could increase their profits by 9.4% to 14% by reducing the degree of land fragmentation. This issue is particularly significant for Slovenian farms and could serve as a strong motivation for policy intervention in the future.
Budgetary payments are crucial for dairy farm revenues, particularly for smaller herds in LFAs. Farms with fewer than 10 dairy cows see BP contributing up to 90% of their GM, averaging 58%, which is higher than the median. In contrast, medium-sized farms with over 12 dairy cows have an average BP share of 26% of GM. This disparity highlights the significant dependence of smaller farms on BP for their economic sustainability. As reported by Očić et al. [10], the significance of direct payments varies by member state. In addition, considering fixed costs, it is highest in Lithuania (70%) and lowest in the Netherlands (9%). On average, for the EU-27, direct payments account for 28% of net value added, with their importance being higher for farms with lower incomes, which is also confirmed by our results. The results show that the new era of agricultural policy (2023–2027) is trying to preserve the situation. With the CSP altering the range and quantity of interventions, the situation generally worsens, though not dramatically. Smaller farms may see slight improvements, as larger farms with 35 to 65 animals experience more pronounced reductions in budgetary payments, though this does not significantly affect their gross margins. A stronger impact is observed on their overall income.
Despite the fact that dairy is a demanding sector from a capital perspective (animals, stables, special equipment, etc.), as well as from a management point of view, economic indicators do not necessarily follow this. The dairy sector is labor-intensive, with efficient working hours influenced by housing systems and fodder methods. On average, dairy farms achieve a gross margin of just over 12 EUR per hour, with the median slightly below this average, which is less than, for example, what farms engaged in pig or poultry farming can earn, but it is more than what we can achieve with other ruminants on grassland such as beef, suckler cows, sheep, and goats [8]. For 25% of farms, mainly smaller ones with fewer than 10 cows, the gross margin is under 7.3 EUR/h, while for 75% of farms, it is below 17.4 EUR/h. Larger farms with more than 12 cows have a higher average GM of nearly 15 EUR/h, with 75% exceeding 10.6 EUR/h. Here, it is important to note that we are only considering primary production without processing or the potential effects of complementary activities on such farms. According to Parzonko et al. [1], an important indicator demonstrating the economic attractiveness of running a dairy farm is the ratio of income from farm work compared to potential wages outside of agriculture. In the analyzed case of Slovenia, this ratio is much lower and lower than in other sectors, particularly crop production [8]. As noted by Parzonko et al. [1], Italy is the only EU country where income from work on a dairy farm exceeds the average wage in the economy.
The dairy sector is certainly a sector that can achieve the highest economic outcome on utilized areas. On average, dairy farms generate 1871 EUR/ha, with the best-performing farms exceeding 3000 EUR/ha. Gross margin per hectare is more consistent with herd size, being highest among larger farms, especially those cultivating more arable land, with a median GM of 1756 EUR/ha and 75% of TAHs exceeding 1307 EUR/ha. It is worth highlighting the study by Kellermann and Salhofer [3], which showed that farms with permanent grassland can generally keep up with fodder crop farms on arable land, even in an environment of intensive production. Better feed quality reduces the need for purchased feed, which in turn lowers variable costs and boosts the gross margin [21]. However, extensively operating farms, especially those on permanent grassland, lag in productivity and productivity change and are at risk of loss. Thus, in our analysis, small extensive dairy farms with low milk yields present the main challenge. Smaller farms can enhance their profitability more effectively by keeping dairy cows on pasture [21]. This dual approach of improving feed quality and utilizing pasture feeding aligns with both economic and environmental sustainability goals in the dairy sector.
However, it is clear that the farms in the LFAs, on average, achieve lower GM/h than the farms on the plain. This is an expected result, especially since these farms cultivate more permanent grassland and the costs of production in LFAs are higher. This is also emphasized by Coppa et al. [22], who focus on mountain milk production as part of the LFA region. They note that farming costs are higher in these areas due to significant limitations and land use possibilities, which is reflected in lower GM. In these regions, grassland is the dominant and often the only possible agricultural land use, aligning with our findings that indicate lower GM in permanent grassland. However, LFA farms are also those that will gain the most from CSP interventions, which is the correct and right direction. Namely, as Kellermann and Salhofer [3] stress, if dairy farming in permanent grassland areas becomes less productive compared with areas with arable land, agricultural production in these regions will either be abandoned or payments directed toward these areas (e.g., LFA payments) will need to increase over time. Namely, only resilient farms can achieve their goals, reduce the impact of disruptions, and effectively respond to changes in the environment [6].
Based on the research findings, addressing environmental sustainability in the dairy sector can be achieved by promoting technologies and practices that enhance milk yield and incorporate grazing, as these measures tend to reduce GHG emissions per kilogram of milk [18]. Additionally, optimizing manure handling systems plays a crucial role in emissions reduction. As illustrated in the obtained results, effective management practices, including grazing and achieving higher milk yields, have a more significant impact on reducing emissions compared to merely increasing herd size, which primarily enhances economic efficiency. Free-stall housing, commonly used to improve cow health, welfare, and milk production [23], might not achieve the same favorable results as smaller herds with targeted management. Proper management ensures longer productive lives for cows and reduces the number of replacements needed annually. This approach highlights the importance of tailored management practices over simply scaling up herd size for better environmental and economic outcomes in dairy farming.
Our findings underscore the need for targeted interventions and management practices to address the environmental impacts associated with the use of PPPs and mineral nitrogen fertilizers in intensive farming practices, such as corn silage and other energy feed production on arable land. These intensive practices, while not widespread, have a concentrated impact, with a small percentage of dairy farms contributing significantly to the overall use of these inputs. However, this issue is not a major challenge on dairy farms that primarily manage permanent grassland, where the use of PPPs and mineral nitrogen fertilizers is considerably lower. This highlights the importance of tailored strategies to mitigate environmental impacts based on the specific practices and land management systems of different types of farms.

4.2. Modeling Approach and SiTFarm Tool

The approach applied enables a detailed analysis both at the level of individual TAHs and at the sector level. In the paper, we focused on the dairy sector. Despite the fact that it is a rather rough approach from the point of view of the number of TAHs (only 32 TAHs for 6400 farms), we obtain a fairly good insight into the sector. We can analyze various aspects, as well as groups of farms. The obtained results explain to a considerable extent why relatively intensive changes are taking place in Slovenian agriculture and in which direction we can expect further development.
This approach thus enables additional analyses, especially in countries where another monitoring system (e.g., FADN) is not adequately developed and representative. The advantage of the approach applied is that individual production factors can be defined fairly precisely at the level of individual production activities, which is otherwise not a characteristic of such models (BEFM). The approach can be applied also in other countries, with appropriate upgrading, and the key here is to have relevant information, considering price–cost ratios, intensity of production, types of farms with respect of production factors and product mix etc.
However, SiTFarm also has certain limitations. Namely, it can be used to analyze only TAHs that are included in the tool. Given the natural conditions of Slovenia, it will be necessary to cover dairy farms in mountain areas in more detail. Namely, as mentioned by Coppa et al. [22], these farms face special challenges that we could only partially account for in this analysis.
Due to the complexity in the calculations of environmental indicators, the currently developed system is still quite cumbersome and does not allow comparison between different production technologies, and especially not for the optimization or the search for more sustainable solutions for a given TAH nor for the sector. The fact is that simulating technological changes could have a significant impact on finding solutions to strengthen sustainability and decarbonization while maintaining or increasing the total value of agricultural production. This would enable support for promoting sustainable development and more efficient management of natural resources.
The current version of the SiTFarm model enables the calculation of various economic indicators up to the level of GM. An in-depth insight at this point would certainly allow for an easier comparison of alternatives with different capital intensities, as well as a more thorough comparison of TAH. Thus, the thoughtful inclusion of fixed costs, especially the depreciation of fixed assets, would significantly contribute to a better insight and understanding of the situation across different types of farms.

5. Conclusions

From the point of view of the dairy sector, the results obtained are very informative and interesting. Dairy farms contribute about one-third of the generated revenue in agriculture, of which a good half goes to farms located in LFAs. Dairy farms manage a good quarter of permanent grassland in Slovenia. The results show that farms with larger herds can achieve significantly higher hourly rates. These larger farms are also promising for development, although, from the point of view of social and environmental sustainability, the herds in the LFA region should not be neglected either.
Based on the results, addressing environmental sustainability could involve promoting technologies and practices that improve milk yield and include grazing, as this tends to lower greenhouse gas emissions per kilogram of milk. Additionally, encouraging higher levels of milk yield can lead to lower emissions per kg of milk [18].
The results show that the new era of agricultural policy (2023–2027) is trying to preserve the situation with a set of planned interventions. The results indicate a significant reliance on budgetary payments (on average, 58% of GM); thus, any reduction in funding significantly impacts economic indicators. There is a slight decline, with a few exceptions for smaller farms located in LFAs. Supporting farms in hilly areas with coupled payments has proven effective in mitigating these disparities. Moving forward, it will be essential to back new investments with appropriate measures and financial assistance, allowing breeders to achieve better outcomes (economic and environmental) in dairy production. Additionally, policies should focus on increasing efficiency and sustainability to reduce long-term dependence on budgetary payments.
The farm model approach used has proven to be an effective tool for this type of analysis. It enables detailed assessments at both the individual TAH and sector levels, allowing for precise definition of factors specific to various production activities. This approach is adaptable for use in other countries, provided there is relevant information on price–cost ratios, production intensity, farm types and product mix. It is particularly valuable in contexts lacking a well-developed and representative monitoring system, such as the FADN.
In the future, it will be necessary to incorporate fixed costs, which the current model does not account for. Integrating fixed costs into the analysis will provide a more comprehensive understanding of the economic sustainability of farms, allowing for more accurate assessments and better-informed decision-making.
In Slovenia, however, there is a need for more detailed coverage of dairy farms in mountain areas, as these face unique challenges not fully addressed in the current analysis.
The complexity of calculating environmental indicators currently impedes the comparison of different production technologies and the optimization of sustainability. Simulating technological changes could improve sustainability and decarbonization efforts while maintaining or enhancing the agricultural production value, thereby supporting sustainable development and resource management.
It is not possible to assess structural changes with the model, but it is to be expected that the trend of decreasing number of farms with small herds of dairy cows will continue. Main reason are poor economic results on such farms. Based on the economic results, it can be concluded that most medium-sized farms will continue to grow and thus try to improve their operations. Here, we also see the usefulness of the results for stakeholders, particularly the agricultural advisory service, who will monitor this process and advise farms on further development and investments. As the results show, it will be necessary to support certain types of farms with appropriate investments to improve efficiency and enhance both economic and environmental sustainability. In the long term, this approach will help reduce dependence on budgetary payments.

Author Contributions

Conceptualization, J.Ž. and S.K.; methodology, J.Ž. and S.K.; software, J.Ž.; validation, J.Ž. and S.K.; formal analysis, J.Ž. and S.K.; investigation, J.Ž. and S.K.; writing—original draft preparation, J.Ž. and S.K. All authors have read and agreed to the published version of the manuscript.

Funding

This research was funded by The Slovenian Research and Innovation Agency (ARIS), Research Programme (P4-0022): Agro-food and natural resources economics and the Ministry of Agriculture, Forestry, and Food, grant number 2330-18-000231 and ARIS (CRP V4-1809).

Data Availability Statement

The raw data supporting the conclusions of this article will be made available by the authors on request.

Conflicts of Interest

The authors declare no conflicts of interest.

References

  1. Parzonko, A.; Parzonko, A.J.; Bórawski, P. Economic Competitiveness of Dairy Farms from the Top Milk-Producing Countries in the EU: Assessment in 2014–2021. Agriculture 2024, 14, 123. [Google Scholar] [CrossRef]
  2. Poczta, W.; Średzińska, J.; Chenczke, M. Economic Situation of Dairy Farms in Identified Clusters of European Union Countries. Agriculture 2020, 10, 92. [Google Scholar] [CrossRef]
  3. Kellermann, M.; Salhofer, K. Dairy farming on permanent grassland: Can it keep up? J. Dairy Sci. 2014, 97, 6196–6210. [Google Scholar] [CrossRef] [PubMed]
  4. Bórawski, P.; Pawlewicz, A.; Parzonko, A.; Harper, J.K.; Holden, L. Factors Shaping Cow’s Milk Production in the EU. Sustainability 2020, 12, 420. [Google Scholar] [CrossRef]
  5. MacDonald, D.; Crabtree, J.R.; Wiesinger, G.; Dax, T.; Stamou, N.; Fleury, P.; Gutierrez Lazpita, J.; Gibon, A. Agricultural abandonment in mountain areas of Europe: Environmental consequences and policy response. J. Environ. Manag. 2000, 59, 47–69. [Google Scholar] [CrossRef]
  6. Kołoszycz, E.; Wilczyński, A.; Menghi, A.; Soffiantini, C.S.; Klopčič, M. Searching for Dairy Farm Resilience with the R4D Project: Innovation Needs to Be Sustainable. Sustainability 2024, 16, 3520. [Google Scholar] [CrossRef]
  7. European Commission. Milk and Milk Product Statistics. Brussels. 2024. Available online: https://ec.europa.eu/eurostat/statistics-explained/index.php?title=Milk_and_milk_product_statistics#Milk_production (accessed on 20 January 2024).
  8. Žgajnar, J.; Kavčič, S.; Tomšič, M.; Zagorc, B.; Brečko, J.; Hiti Dvoršak, A.; Moljk, B.; Verbič, J.; Bedrač, M.; Kožar, M.; et al. Development of a Model for Systematic Monitoring of the Economic Situation and Analysis of the Impact of Agricultural Policy at the Level of Typical Agricultural Holdings: Final Report; Biotechnical Faculty: Ljubljana, Slovenia, 2022; 437p. (In Slovene) [Google Scholar]
  9. European Commission. Approved 28 CAP Strategic Plans (2023–2027). Summary Overview for 27 Member States. Facts and Figures. 2023. Available online: https://agriculture.ec.europa.eu/system/files/2023-06/approved-28-cap-strategic-plans-2023-27.pdf (accessed on 19 September 2023).
  10. Očić, V.; Šakić Bobić, B.; Grgić, Z. Economic analysis of specialized dairy farms in Croatia according to FADN. Mljekarstvo: Čas. Unaprjeđenje Proizv. I Prerade Mlijeka 2023, 73, 50–58. [Google Scholar] [CrossRef]
  11. Langrell, S.; Ciaian, P.; Espinosa, M.; Gomez Paloma, S.; Heckelei, T.; Louhichi, K.; Sckokai, P.; Thomas, A.; Vard, T. Farm Level Modelling of CAP: A Methodological Overview; Joint Research Centre: Scientific and Policy Reports; European Union: Luxembourg, 2013. [Google Scholar]
  12. Kremmydas, D.; Petsakos, A.; Ciaian, P.; Baldoni, E.; Tillie, P. The EU-Wide Individual Farm Model for Common Agricultural Policy Analysis (IFM-CAP v.2): Manual of the Model, EUR 30949 EN; Publications Office of the European Commission: Luxembourg, 2021; ISBN 978-92-76-46336-8. Available online: https://data.europa.eu/doi/10.2760/248136 (accessed on 19 September 2023).
  13. Reidsma, P.; Janssen, S.; Jansen, J.; van Ittersum, M.K. On the development and use of farm models for policy impact assessment in the European Union—A review. Agric. Syst. 2018, 159, 111–125. [Google Scholar] [CrossRef]
  14. van der Linden, A.; de Olde, E.M.; Mostert, P.F.; de Boer, I.J.M. A review of European models to assess the sustainability performance of livestock production systems. Agric. Syst. 2020, 182, 102842. [Google Scholar] [CrossRef]
  15. Britz, W.; Ciaian, P.; Gocht, A.; Kanellopoulos, A.; Kremmydas, D.; Müller, M.; Petsakos, A.; Reidsma, P. A design for a generic and modular bio-economic farm model. Agric. Syst. 2021, 191, 103–133. [Google Scholar] [CrossRef]
  16. Agricultural Institute of Slovenia. Model Calculations. Available online: https://www.kis.si/en/Model_Calculations_OEK/ (accessed on 25 April 2024).
  17. MacKinnon, D.; Pavlovič, M. Proprietary Varieties’ Influence on Economics and Competitiveness in Land Use within the Hop Industry. Land 2023, 12, 598. [Google Scholar] [CrossRef]
  18. Zehetmeier, M.; Baudracco, J.; Hoffmann, H.; Heißenhuber, A. Does increasing milk yield per cow reduce greenhouse gas emissions? A system approach. Animal 2012, 6, 154–166. [Google Scholar] [CrossRef] [PubMed]
  19. Leiber, F.; Jouven, M.; Martin, B.; Priolo, A.; Coppa, M.; Prache, S.; Heckendorn, F.; Baumont, R. Potentials and challenges for future sustainable grassland utilisation in animal production. Opt. Méditerr. Sér. A: Sémin. Méditerr. 2014, 109, 33–48. [Google Scholar]
  20. del Corral, J.; Perez, J.A.; Roibas, D. The impact of land fragmentation on milk production. J. Dairy Sci. 2011, 94, 517–525. [Google Scholar] [CrossRef] [PubMed]
  21. Pečnik, Ž.; Žgajnar, J. Resilience of dairy farms measured through production plan adjustments. J. Cent. Eur. Agric. 2022, 23, 207–219. [Google Scholar] [CrossRef]
  22. Coppa, M.; Chassaing, C.; Sibra, C.; Cornu, A.; Verbič, J.; Golecký, J.; Martin, B. Forage system is the key driver of mountain milk specificity. J. Dairy Sci. 2019, 102, 10483–10499. [Google Scholar] [CrossRef] [PubMed]
  23. van Eerdenburg, F.J.C.M.; Ruud, L.E. Design of Free Stalls for Dairy Herds: A Review. Ruminants 2021, 1, 1–22. [Google Scholar] [CrossRef]
Figure 1. Scheme of the SiTFarm tool.
Sustainability 16 06009 g001
Figure 2. Expected gross margin per working hour engaged in baseline (2014–2022) and CAP strategic plan (2023–2027) regarding the herd size. (The whiskers extend to the minimum and maximum values of the dataset, encompassing the lower quartile (Q1) and the upper quartile (Q3), with the interquartile range representing 50% of the scores between the 25th and 75th percentiles. Both the median and the mean (X) are also presented).
Sustainability 16 06009 g002
Figure 3. The intensity of GHG emissions in CO2 eq. per kg of milk produced for different TAH groups (T—tied-in housing, F—free-stall housing system, LMY—low milk yield, between 4000 L and 7499 L, HMY—high milk yield, between 7500 L and 9000 L). (The whiskers extend to the minimum and maximum values of the dataset, encompassing the lower quartile (Q1) and the upper quartile (Q3), with the interquartile range representing 50% of the scores between the 25th and 75th percentiles. Both the median and the mean (X) are also presented).
Sustainability 16 06009 g003
Table 1. Typical agricultural holdings specialized in dairy farming in Slovenia.
TAHs CodeFarmsFTETotal UAAGrasslandTechnology of Grass ConservationLLUDairyBeefHeifers
(No)(1800 h)(ha)(%)a–t(No)(No)(No)(No)
TAH1-0001_SI_4000_Ga3500.373.284a,b1.7 T,1110.2
TAH2-0003_SI_4500_Ga6600.725.683d,f,g/o,p4.8 T,1321
TAH3-0005_SI_5000_Ga4500.838.785d,f,g/o,p7.4 T,2531
TAH4-0006_BR_6000_GA4401.0312.275d,f,g/o,p8.7 T,1631.5
TAH5-0008_SH_7000_AG4300.856.827d,f,g/o,p9.2 T,18 2
TAH6-0009_HF_8000_GA4000.937.462d,f,g/o,p10.8 T,19 3
TAH7-0010_SI_6500_GA3001.2212.460d,f,g/o,p14.8 T,11053
TAH8-0010_BR_7000_Ga3001.2512.576d,f,g/o,p14.2 T,11043
TAH9-0012_HF_8000_AG2401.1310.643d,e,f,g/o14.4 T,112 4
TAH10-0012_BR_7500_GA2401.3814.974d,f,g/o,p16.8 T,11253
TAH11-0014_SI_7000_AG2101.4812.637d,e,f,g/o20 T,11464
TAH12-0015_SI_6500_GA2001.4916.069d,e,f,g/o21.6 T,21565
TAH13-0016_SH_7500_AG1951.4812.729d,e,f,g/o20.2 T,21625
TAH14 *-0016_SH_7500_AG301.9112.729d,e,f,g/o20.2 T,21625
TAH15-0018_BR_7000_G01901.6018.5100d,e,f,g,m24 T,21855
TAH16-0019_HF_9000_Ag1901.6619.418d,e,f,g/o22.6 T,219 6
TAH17-0025_BR_6500_Ga1601.7921.386c,d,g,m/n,o33.4 T,22586
TAH18-0025_HF_7000_GA1601.7318.251c,d,g,m/n,o29.8 T,225 8
TAH19-0025_SI_5800_GA1601.7218.646c,d,g,m/n,o34.6 T,225106
TAH20-0025_SI_5800_Ag1602.0230.515d,g/n,o34.6 T,225106
TAH21-0025_HS_6500_AG1601.8416.816c,d,g/n,o33.4 T,22568
TAH22-0035_SI_6200_AG1001.8522.620h,i,j/q,r47.6 F,335129
TAH23-0035_BR_7000_Ga1001.8629.383c,d,g,m/n,o47 F,2351010
TAH24-0035_HS_7000_GA1001.7424.972h,i,j,m/q,r47 F,335812
TAH25-0035_HF_9000_GA1001.8420.646h,i,j,/q,r42.8 F,335 13
TAH26-0048_HF_7500_AG1102.2635.438h,i,j,/q,r57.6 F,348 16
TAH27-0055_HF_8000_AG602.4830.712h,i,j,/q,r65.8 F,355 18
TAH28-0065_SI_7000_Ag603.0840.611h,i,j,/q,r92 F,3652520
TAH29-0065_HF_7500_GA602.7032.647h,i,j,/q,r77 F,365 20
TAH30-0080_HF_7200_GA503.2139.246h,i,j,/q,r98 F,380 30
TAH31-0180_HF_8500_Ag177.18111.032k,l,m/r216 F,3180 60
TAH32-0180_HF_7500_GA187.37186.073c,g,m/n219 F,3180 65
Legend: SI—Simmental, HF—Holstein Frisian, BR—Brown, SH—Simmental Holstein mix, HS—Holsten Simmental, LLU—large livestock unit, a—two-cut meadow, silage bales, b—two-cut meadow, hay-drying on the ground, c—three-cut meadow, silage silo, d—three-cut meadow, silage bales, e—three-cut meadow, hay-drying, f—three-cut meadow, hay-drying on the ground, g—three-cut meadow, hay bales, h—four-cut meadow, silage silo, i—four-cut meadow, silage bales, j—four-cut meadow, hay bales, k—five-cut meadow, silage silo, l—five-cut meadow, hay bales, m—pasture, n— legume–grass mixture on arable land (LGM) four mowings, hay-drying, o—LGM four mowings silage silo, p—LGM four mowings, silage bales, q—LGM five mowings, silage silo, r—LGM five mowings, silage bales, s—LGM six mowings, silage silo, T—tied-in housing, F—free-stall housing system, machine line and equipment capacity. 1—poor, 2—semi, 3—modern and powerful. * The farm also produces hops.
Table 2. CAP measures in place for the period 2014–2022 and 2023–2027.
Scenario BLCSP
Period 2014–20222023–2027
Coupled income support
CerealsEUR/ha126.40.0
Dairy cowsEUR/LU130.891.0 b
BeefEUR/LU51.464.8 b
Protein cropsEUR/ha0230
Decoupled income support
Entitlements (A + B)
A—Basic payment dEUR/ha161.30.0
B—Greening dEUR/ha91.40.0
Basic income support for sustainability0.0184.2
Redistributive payment (8.2 ha a)EUR/ha0.027.38
Eco-scheme on grassland and arable land c
Extensive grasslandEUR/ha0.046.7
Traditional use of grasslandEUR/ha0.0129.0
Fertilization with organic fertilizers with low air emissionsEUR/ha0.0127.0
Subsequent crops and sub-cropsEUR/ha0.0137.6
Preservative soil treatmentEUR/ha0.018.24
Greening of arable land over the winterEUR/ha0.0148.0
a Farms receive payment only for the first 8.2 ha. b In order for the farm to be eligible, it must raise at least two dairy cows and/or two beef cattle. c Eco-scheme for the climate and the environment; d It is the average amount of payment. There are differences between individual TAHs due to historical payments and internal convergence. It is part of the value of the entitlement that the farm is paid per ha of cultivated area. In the case of the analyzed farms the amounts (sum of A and B) range from 194 EUR/ha up to 465 EUR/ha, with median of 342 EUR/ha. BL—baseline; CSP—CAP strategic plan.
Table 3. Selected indicators for typical agricultural holdings specialized in dairy production.
TAHs Code/No of Dairy/TRGMBP/GMGM/haGM/FTEGM/hGM/h
CAPBaseline 14–2323–27
(EUR)(EUR)(%)(EUR)(EUR)(EUR)(EUR)
TAH1/1/4699136584.642737132.12.2
TAH2/3/11,237287275.951740022.22.3
TAH3/5/17,923379760.643845702.52.5
TAH4/6/26,366663389.754464433.63.5
TAH5/8/28,82511,29323.6165113,2187.37.2
TAH6/9/34,96912,15840.0163713,0397.26.8
TAH7/10/44,26415,78946.5127712,9427.27.0
TAH8/10/42,83515,36446.3122912,2996.86.7
TAH9/12/44,41214,77027.9139313,0387.27.0
TAH10/12/53,74618,31845.8122713,3067.47.0
TAH11/14/57,31122,91622.6181915,4568.68.4
TAH12/15/60,18922,73241.9141715,2688.58.0
TAH13/16/60,71123,84322.8188016,0818.98.6
TAH14 */16/118,36653,98613.2323728,33115.715.4
TAH15/18/72,44531,46336.9170519,72411.010.4
TAH16/19/79,84032,44925.9167319,54410.910.8
TAH17/25/97,31046,61030.4218825,98714.413.7
TAH18/25/85,04332,82522.4180419,01110.610.0
TAH19/25/92,73148,86926.8262228,35515.815.4
TAH20/25/100,72039,00933.0127819,28210.710.9
TAH21/25/93,53043,84329.1261623,87613.312.8
TAH22/35/126,90752,60721.3232828,38715.815.2
TAH23/35/140,15460,20131.9205832,37518.017.0
TAH24/35/135,28258,83331.6235933,88018.817.6
TAH25/35/141,62950,42718.5244227,37015.214.6
TAH26/48/170,69260,56425.3170926,81214.914.5
TAH27/55/204,00086,70917.5282634,89419.419.1
TAH28/65/252,785111,07520.4273636,09620.119.4
TAH29/65/238,33898,03327.0300536,26620.118.9
TAH30/80/284,644133,58023.7340841,67423.222.1
TAH31/180/732,052312,81018.0281843,53824.223.4
TAH32/180/709,543297,52539.1159940,36022.421.6
* The farm also produces hops. TR—total revenues; FTE—full-time equivalent; BP—budgetary payments; Baseline 14–23—baseline interventions 2014–2023; 23–27—CAP strategic plan interventions (2023–2027).
Table 5. Share of different groups of dairy farms in total agriculture in terms of different indicators.
Total Revenue at Aggregate LevelNumber of AH in AgArable LandGrasslandPPPN MineralN OrganicFTELLU
%
Dairy farms29.4112.0324.0526.1233.1828.449.0936.9344.80
LFAs
LFAs15.127.319.0018.9417.4514.023.3520.9024.06
NO LFAs14.294.7215.057.1815.7314.435.7316.0320.74
Housing system
Tied in17.8910.5715.8919.6523.0518.896.1628.6627.78
Free-stalls11.521.468.166.4710.139.552.938.2717.02
The dominant utilized area
Mainly grassland5.164.151.839.856.604.710.699.328.60
Grass and arable land *19.897.0716.2815.0921.3218.486.2523.4729.90
Mainly arable land4.360.805.941.185.265.252.154.146.30
Legend: PPP—phytopharmaceuticals for plant protection, N—nitrogen from mineral fertilizers, N-organic—nitrogen from organic manure (manure, liquid manure, and compost), FTE—full-time equivalent, LLU—large livestock unit, LFAs—less favored areas. * In this case, more than 25% of each category of land is on the farm.
Disclaimer/Publisher’s Note: The statements, opinions and data contained in all publications are solely those of the individual author(s) and contributor(s) and not of MDPI and/or the editor(s). MDPI and/or the editor(s) disclaim responsibility for any injury to people or property resulting from any ideas, methods, instructions or products referred to in the content.

