Abstract
Global efforts to build sustainable e-commerce ecosystems through various prediction tools have suffered due to uncertainty in politics, the economy, and the environment. This paper proposes a new integrative prediction model to track the sustainable development of e-commerce. Using US e-commerce data, this study explores the prediction accuracy of the mixed data sampling (MIDAS) model in combination with the attention mechanism (AM) approach, analyzing the performance differences between the model’s before and after improvements. More so, the paper evaluates the performance of the new prediction approach against other competing models using the prediction accuracy metric, the probability interval test, and the Diebold and Mariann (DM) test methods. The results indicate that the introduction of the MIDAS and the AM approaches allows the prediction model to fully utilize the effective information of the mixed-frequency data while simultaneously capturing the differences in the importance of the variables in terms of their time series and the non-linear relationship of the learning variables, thereby positively influencing the economic prediction of the e-commerce industry. Second, the proposed prediction model combines the ability of long-term and short-term high-precision prediction and performs multi-step probability prediction on the development of the e-commerce industry. It can better track abnormal changes in macroeconomic indicators and fit their fluctuation trends. Third, based on the results of the three evaluation indicators, the MIDAS–AM–Deep autoregressive recurrent neural network (DeepAR) model achieves optimal prediction accuracy, allowing it to provide more timely, accurate, and comprehensive predictions for e-commerce management decisions when macroeconomic conditions are undergoing significant transformations.
1. Introduction
Sustainable development is intricately linked to various forms of uncertainty, which can significantly impact its progress and implementation. Economic uncertainty, for instance, can hinder sustainable development by affecting economic growth and stability. Policy uncertainty, particularly in financial and trade policies, plays a critical role, as it can negatively impact environmental sustainability and innovation activities, a view supported by empirical findings on economic policy uncertainty (EPU) and its effects on greenhouse gas emissions and technology innovation [1]. At the industry level, investors’ preferences for sustainable assets are influenced by market conditions and uncertainties, given that increased market instability triggers a shift towards more sustainable investments [2]. Additionally, the relationship between sustainable investments and various uncertainties, including crude oil volatility and cryptocurrency uncertainty, highlights the complex interplay between market dynamics and sustainability indices [3]. These rapid changes in the international environment have significantly impacted all enterprises, prompting them to adopt green technology innovation (GTI) to enhance their sustainable development capabilities and cope with external uncertainties [4]. Digital innovations, (e.g., digital industry and blockchains) offer numerous potential benefits, yet in effect, they are vulnerable to significant uncertainties. Emerging technologies present risks and benefits, necessitating robust risk management and prediction frameworks to address these uncertainties effectively.
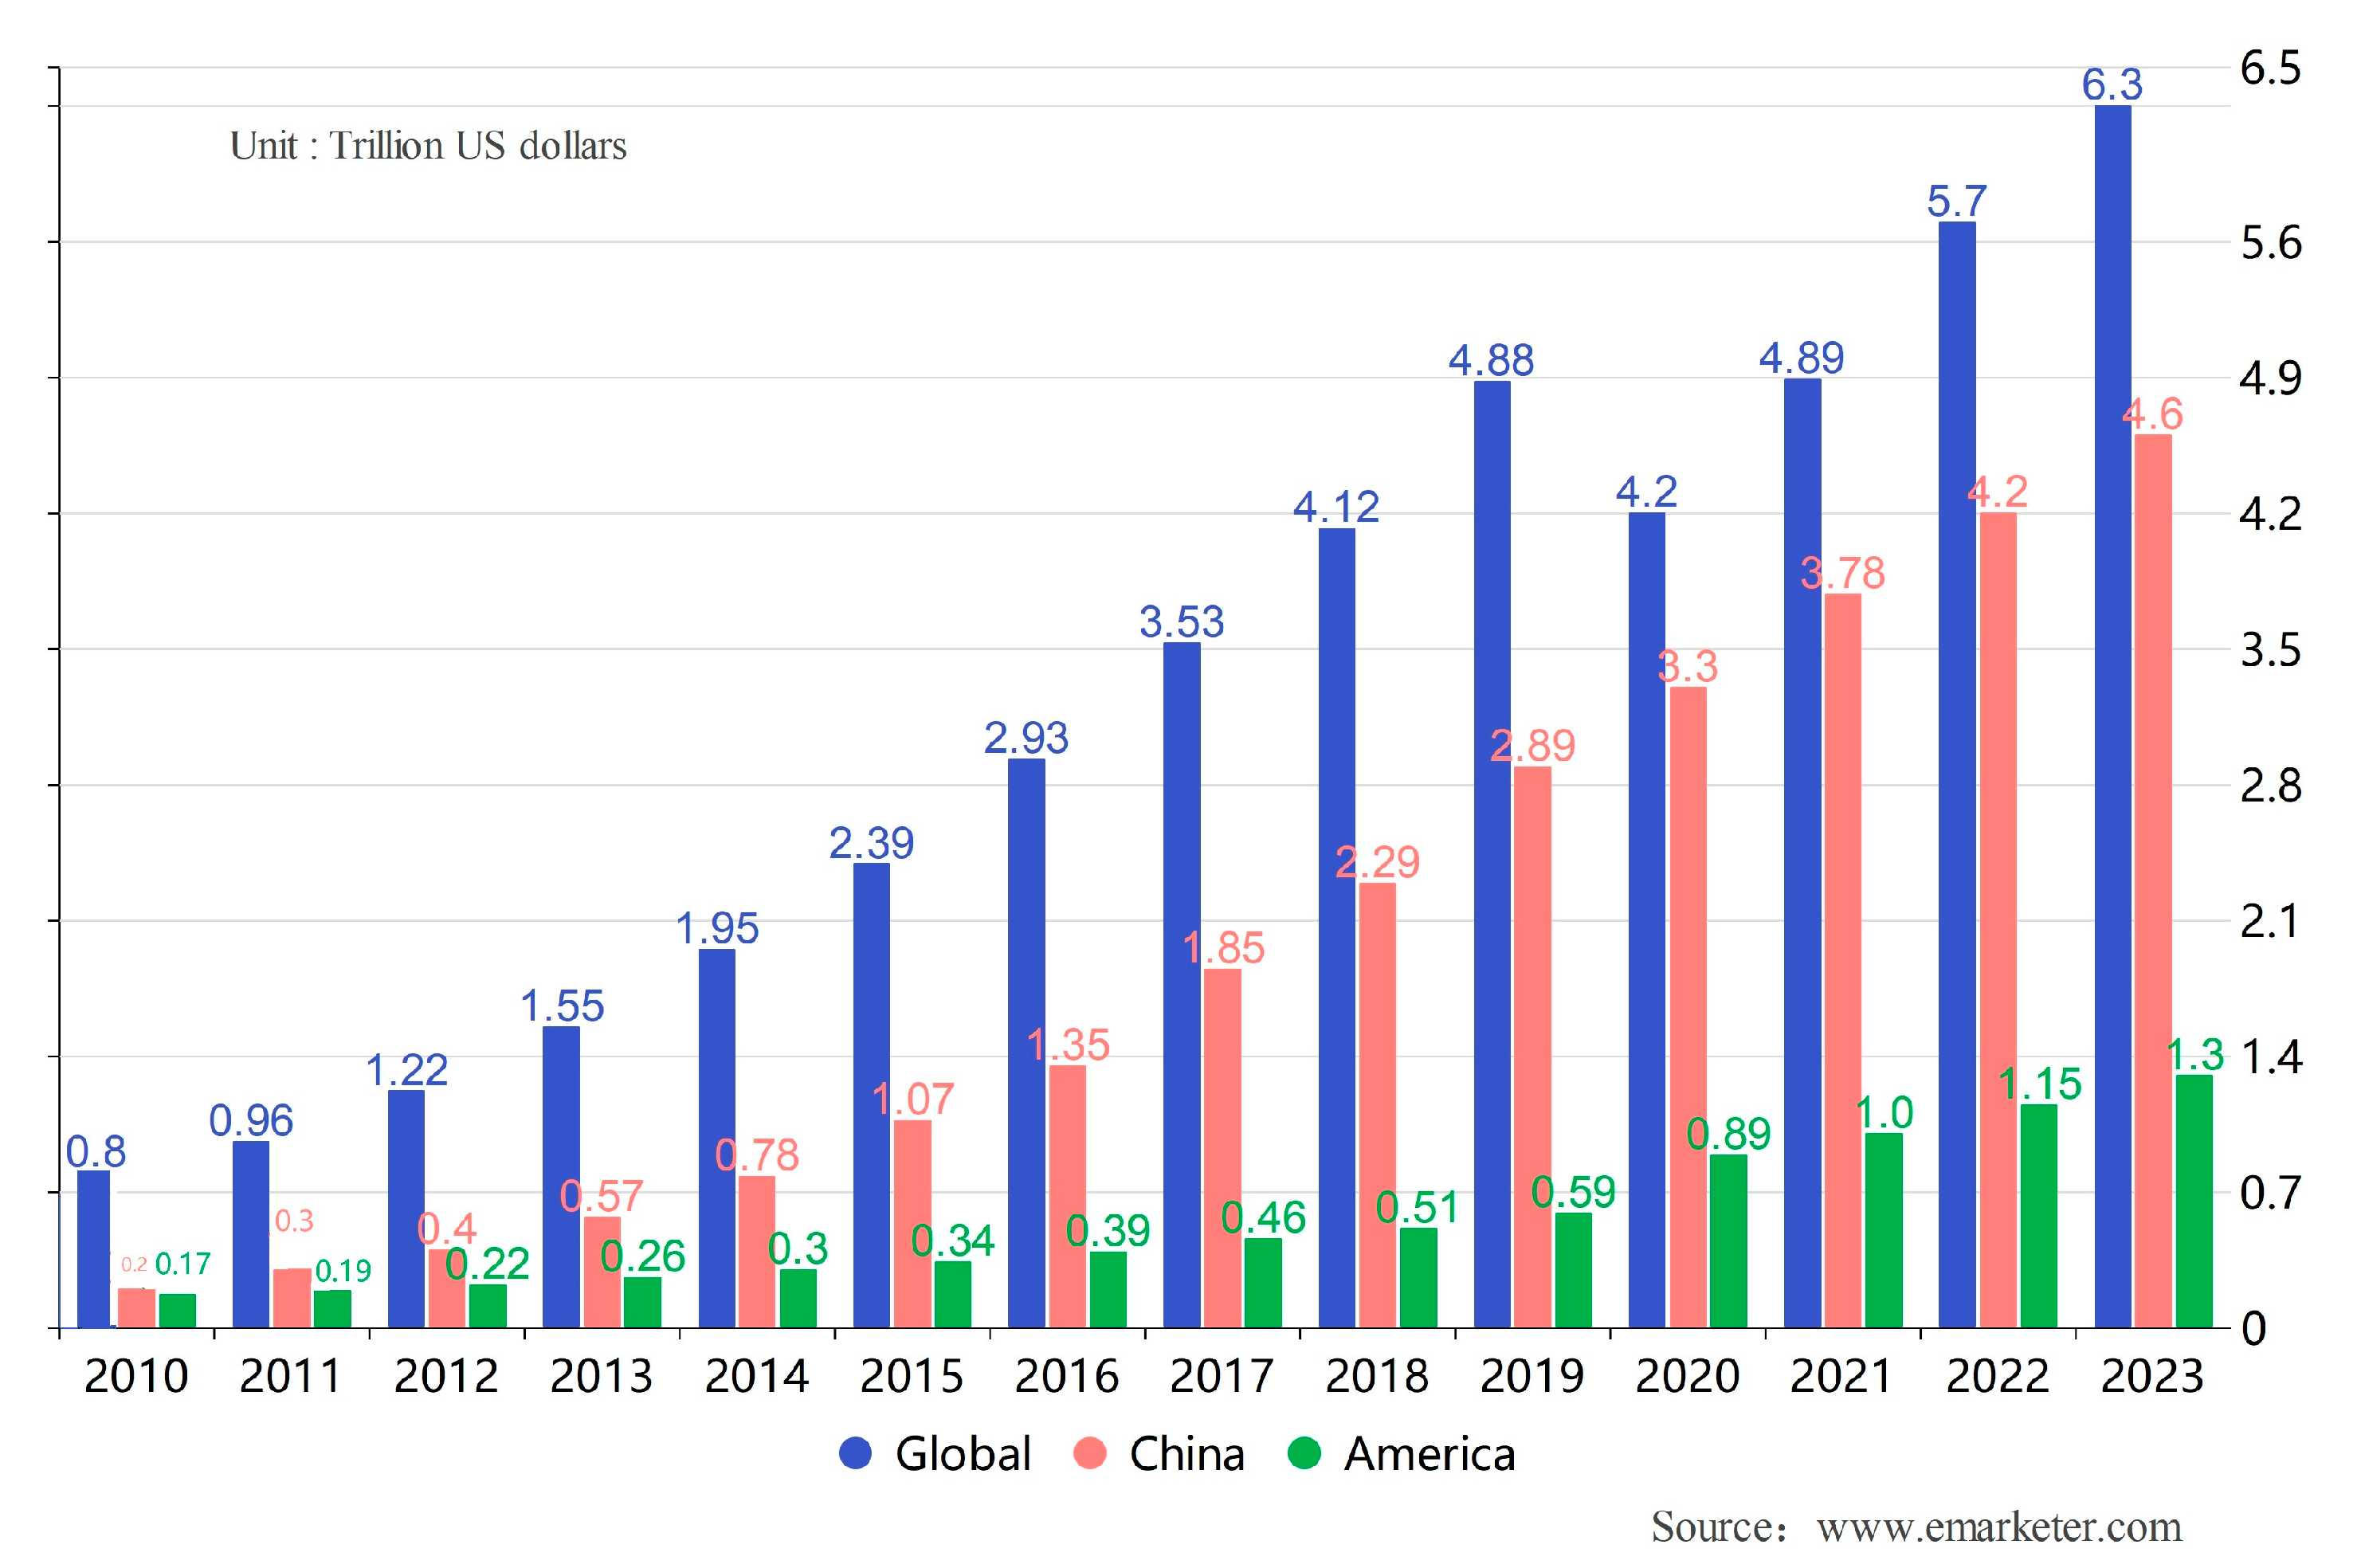
With the global adoption of information technology and the Internet, an international e-commerce model is emerging, gradually becoming a new driver for developing the world economy. With its low transaction costs, fast information circulation, high transaction efficiency, and breaking the time and geography limit, e-commerce has attracted the participation of many enterprises and individuals worldwide. This growing trend has resulted in the massive expansion of the e-commerce economy and improved the competitiveness and innovation capacity of the economic system [5]. The scale of e-commerce transactions has risen annually since the 21st century, driving rapid national economic development and foreign trade growth [6]. Figure 1 shows the growth of transaction volume in e-commerce globally, in China, and in the United States from 2010 to 2023.
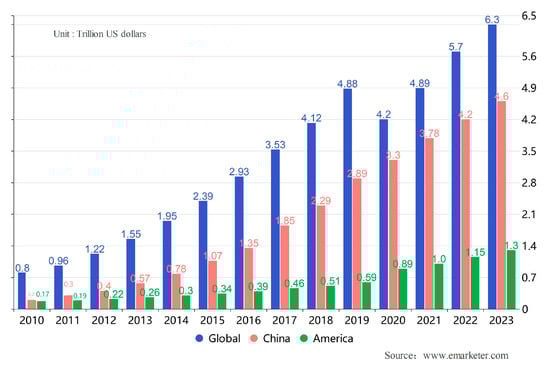
Figure 1.
The growth of transaction volume in the e-commerce industry (Global, China, America).
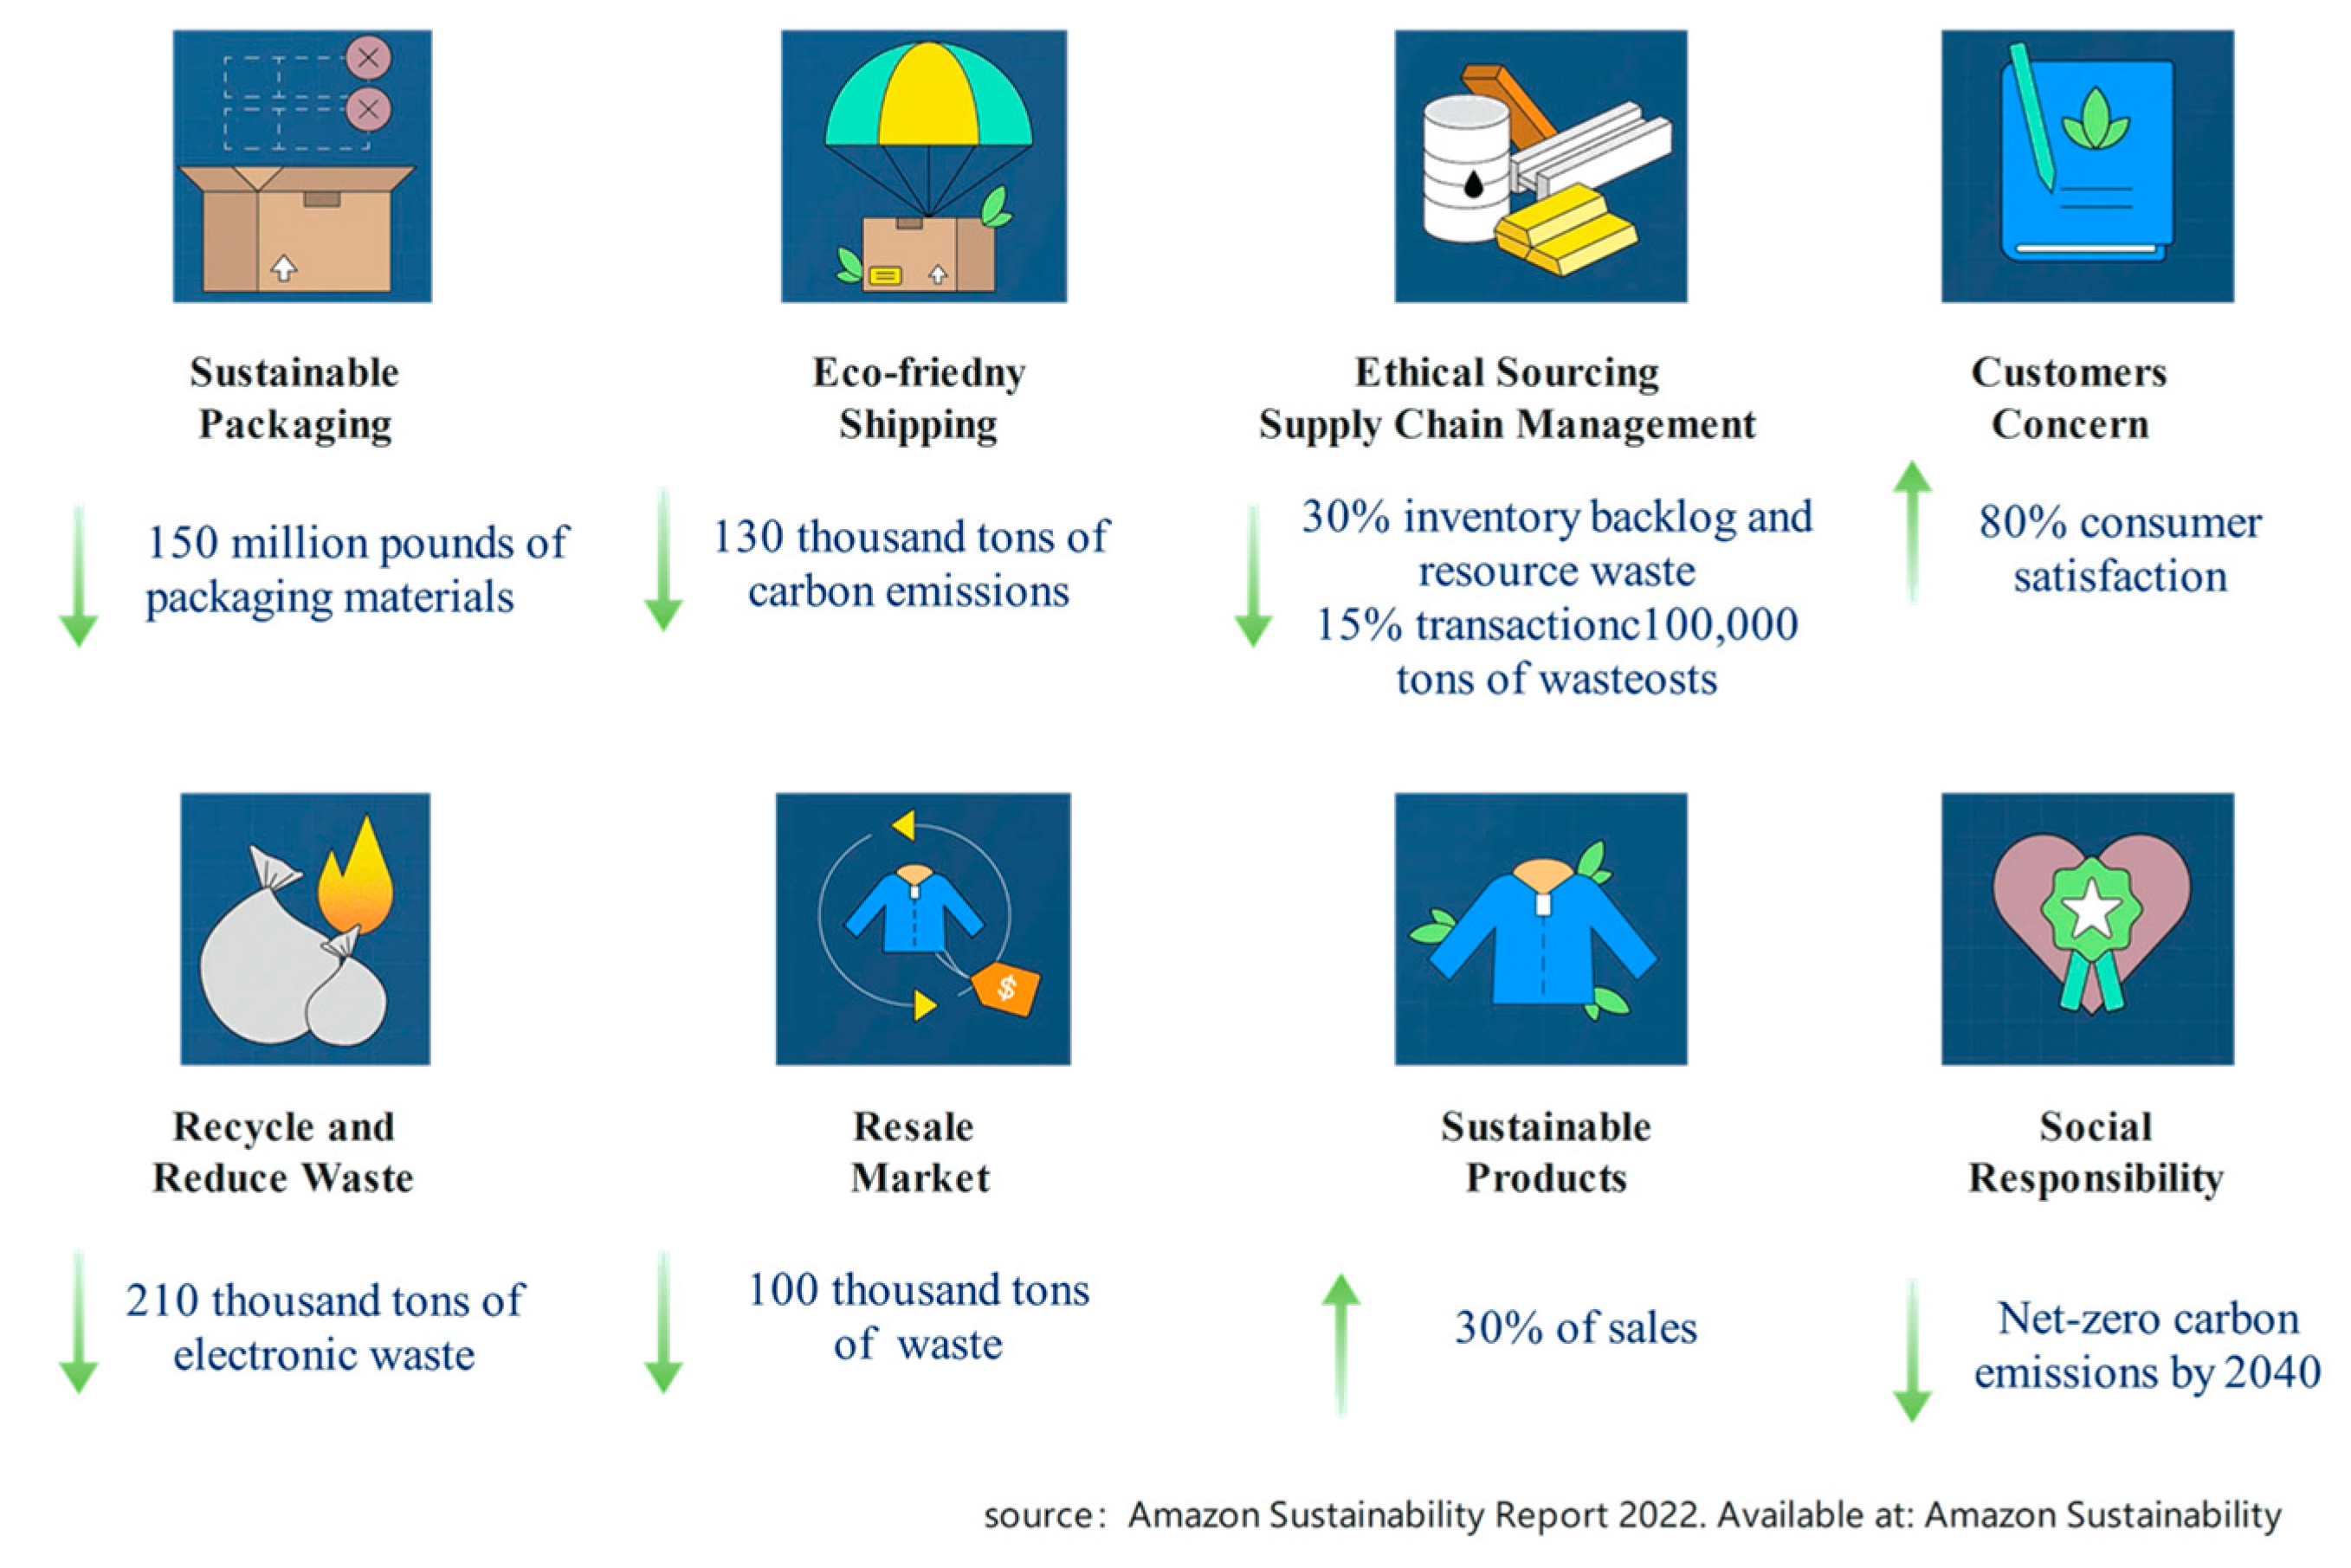
E-commerce is pivotal in global sustainable development because it enhances efficiency, optimizes resource utilization, and fosters innovation. Beyond stimulating economic growth and creating employment opportunities, e-commerce significantly reduces carbon emissions and minimizes resource wastage. The implications of sustainable e-commerce practices extend beyond business operations to encompass social and environmental responsibilities, including promoting renewable energy adoption, optimizing logistics and transportation, and advocating for circular economy practices [7]. As the world’s largest e-commerce enterprise, Amazon’s achievements serve as a microcosm, illustrating the significant contributions of the e-commerce industry to global sustainable development goals, as shown in Figure 2.
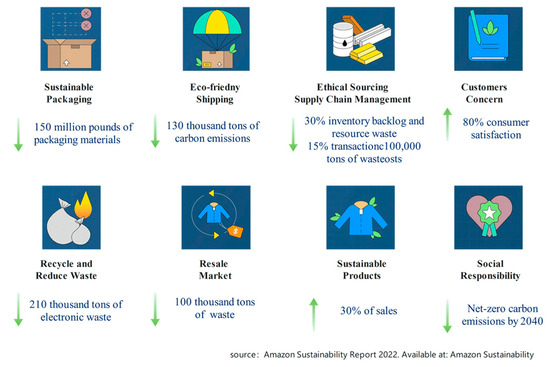
Figure 2.
Amazon’s sustainability performance 2022.
Therefore, forecasting models and innovative prediction tools for sustainable strategies in the e-commerce sector have emerged as a primary interest among researchers and industry professionals worldwide [8,9,10,11,12]. Thus far, scholars have proposed various tools for packaging, supply chain management, customer relations, sustainable product initiatives, recycling, and second-hand transactions. With many e-commerce platforms adopting different machine-learning models to ensure accurate sales predictions and to optimize decisions related to sustainable e-commerce [13], the development of innovative prediction tools for transaction volumes has become a novel research imperative. Undoubtedly, global e-commerce is susceptible to uncertainties in economic policies and changes in the global financial and social environment; at the same time, sales volumes are often subject to interruptions and irregularity [7]. In 2007, the outbreak of the U.S. subprime mortgage crisis triggered the most severe financial crisis since the Great Depression [14], subsequently leading to chaos in the credit, stock, and bond markets, Later, the scenario evolved into a global financial crisis and significantly affected the scale of e-commerce transactions in various countries. Since 2016, growing trade frictions between the Western countries (the US and the European Union-EU) and China have instigated tariffs and trade restrictions, ultimately destabilizing international trade systems, inflows, and outflows. Many countries have responded through a series of economic adjustment measures, such as tax cuts in the US, the winding down of quantitative easing policies by the European Central Bank, and the Chinese government’s policy of stimulating domestic trade. Under the constraints of such economic policy adjustments and uncertainties, the e-commerce industry in various countries has also entered a period of adjustment, with significant fluctuations in sales revenue [15]. Since 2020, the outbreak of COVID-19 has added to the scale of existing uncertainties in import and export policies. For instance, the US dollar has fallen into a liquidity crisis, the global economy is facing the risk of recession [16], and the e-commerce industry shows apparent fluctuations in domestic and foreign trade. Considering the above, it is crucial to develop robust tools that are capable of accurately predicting the impact of macroeconomic intermittency and uncertainty on the e-commerce industry economy, assessing the sustainable development trend of the e-commerce industrial economy on time, identifying its sudden changes and inflection points, and capturing the global economic situation to formulate rational industrial policies [17].
Currently, most forecasting models for e-commerce have primarily relied on methods such as time series analysis, gray prediction models, and artificial neural networks [18,19,20]. While these approaches are straightforward and practical, their efficacy is constrained by human capabilities and limitations in information utilization, necessitating enhanced prediction accuracy. In the context of sustainable global economic development, achieving precise forecasts based solely on historical sales data is challenging [21]. As a result, some scholars have turned to models like recurrent neural networks (RNNs) to identify key influencing factors, predict complex nonlinear relationships, and improve prediction accuracy [22,23,24]. These models often rely on past outputs for more extended time series, which may result in memory loss and difficulties handling extended cycles, seasonal variations, and other complexities. Thus, accurately capturing and balancing temporal correlations in a diverse environment remains a persistent challenge. Following the rapid development of information technology and computer science, extensive and multi-source economic data can be collected and stored. In other words, multiple time series can be sampled or observed, contributing new insights to economic monitoring and forecasting in the e-commerce industry [25]. In the same context, considering the complex and ever-changing uncertainty factors that affect the development of sustainable e-commerce ecosystems worldwide, the significant randomness and irregularity of sustainable development trends, and the different sampling frequencies of macroeconomic data collected, the relationships between different samples have become complex. Moreover, it has become difficult to evaluate the amount of valid information accurately. Given that exploring complex time series and non-linear characteristics of mixed-frequency data, as well as capturing anomalous inflection points on time, has become a challenging task, a question persists: how to accurately and precisely predict the sustainable development trends during uncertain times, particularly in the e-commerce markets with high transaction volumes, e.g., the US.
To solve the above problems, this study innovatively integrates the mixed data sampling model (MIDAS), attention mechanism (AM), and deep autoregressive recurrent neural network (DeepAR) models to propose the MIDAS–AM–DeepAR model for predicting the development of the e-commerce industry. This new tri-dimensional model is novel in maintaining the original data structure to the greatest extent, accurately depicting the hidden non-linear relationships between variables on mixed-frequency data, automatically perceiving the time weights of the series, capturing external disturbance factors on time, and implementing multi-step forward probability prediction to address uncertainty risks and help make management decisions.
This paper proceeds as follows—Section 2 reviews the relevant literature. Section 3 provides a detailed introduction to the research methodology and the specific setup of the MIDAS–AM–DeepAR model. Section 4 further verifies the model’s advantages through an empirical analysis of the US e-commerce industry and proposes suggestions regarding the development strategy of relevant sectors. Lastly, the research’s conclusions and prospects for further studies are presented.
2. Literature Review
In the 1970s, e-commerce activities in the form of electronic data interchange (EDI) emerged. In 1990, Thomas Malone [26] proposed the concept of e-commerce business. As the development of e-commerce has progressed, its role in and contribution to the world economy has become increasingly significant, attracting considerable scholarly attention [27]. Researchers [28] agree that, at the micro level, the sustainable development of e-commerce helps to improve the performance of companies and industries, upgrade industrial structures, and expand the scope of development. At the macro level, it promotes organic interaction between global factor markets, product markets, and policy regimes. The Organisation for Economic Co-operation and Development (OECD) Digital Economy Outlook 2020 [29] noted that countries should value digital resources represented by e-commerce and deploy strategies from top to bottom. Past studies on sustainability development and the evolution of e-commerce have revealed that its process is typically characterized by multi-directional causality, multi-layer nesting, complex non-linearity, positive feedback effects, and path dependence [30]. In recent years, following the rise of trade protectionism, political polarization, COVID-19, the surge of anti-globalization policy, and other factors, global economic uncertainty and policy instability have risen sharply, posing threats to the sustainability development of the e-commerce industry worldwide. Thus, research has begun to explore methods to monitor and forecast the e-commerce industry accurately and effectively.
Of the existing literature on the prediction tools for the sustainable development of the e-commerce sector, some scholars [31,32,33] focused on the influencing factors of e-commerce sustainability development and employed mathematical methods to establish corresponding predictive indicator systems. After observing that the development of e-commerce was non-linear and closely related to macroeconomic factors, the researchers called for future research on the role of the external macroeconomic environment and policy uncertainties. Later, the proponents of the grey systems theory (GST) elucidated those human limitations in understanding and knowledge that have significantly contributed to uncertainties in the sustainable development of e-commerce, complicating decision-making and international collaborations [34]. Qualitative prediction methods, including subjective probability theory, factor analysis, and the Delphi method as well as quantitative prediction methods for single models such as time series analysis [20,32], linear regression [35], the decision tree model [36], the random forest model [37], and the grey prediction model [38] have strong interpretability. Although these methods can achieve high prediction accuracy, they cannot accurately predict the uneven (non-linear) development of the e-commerce industry. Some shortcomings of the above methods/techniques included their inability to make complex predictions for external uncertainties and non-linear problems, such as limitations in handling multi-source heterogeneous complex data, fitting exogenous feature variables and potential relationships with predictive variables, accurately capturing abnormal economic inflection points, and dealing with uncertainty.
To overcome these limitations, some scholars have introduced strong adaptability neural networks to account for non-linear relationships into the application and development prediction of e-commerce. For example, Jia [39] used the Bayes classification to predict customers’ purchase behavior. Using neural networks for e-commerce prediction, many scholars have predicted specific behaviors to promote the sustainable development of e-commerce, such as customer management, product recommendations, and repurchases. That said, these studies provided limited insight into strategies to address external uncertainties, especially when new hybrid technologies have begun to be applied to the e-commerce industry [36,40,41,42,43,44,45,46,47]. Fathalla et al. [48] integrated long short-term memory (LSTM) and convolutional neural network (CNN) architecture to predict the price of second-hand goods in the e-commerce market while searching for platform optimization management strategies. Zhao [49] combined the back-propagation neural network (BPNN) model and the vector autoregressive model to analyze the business conflict of commercial banks within Internet finance. A BPNN-based deep learning algorithm was used to obtain the optimal solution for business integration to facilitate the Internet transformation of traditional financial services in e-commerce. Yu et al. [50] combined long short-term memory (LSTM) with seasonal autoregressive integral moving average (SARIMA) to predict the trend of e-commerce export product competitiveness in the machinery industry. Overall, these studies facilitated the identification and exploration of potential non-linear patterns between variables. Table 1 provides a summary of recent prediction models proposed for sustainable decision-making and development in the e-commerce industry.

Table 1.
Summary of selected prediction models proposed for sustainable e-commerce development and decision-making.
As seen above, the diverse integrative approaches listed above highlight the importance of combining various machine learning techniques and data pre-processing methods to achieve accurate and reliable sales predictions in the e-commerce industry and aid sustainable decision-making for marketing, inventory management, customer relationships, and supply-chain management strategies. Nevertheless, a predominant reliance on historical data and using data with synchronized frequencies have raised serious concerns. For instance, in an uncertain external environment, particularly within a macroeconomic context characterized by temporal inflection points, external multi-source data presents issues such as the inconsistency of observation frequencies and difficulties in effectively using essential information. This methodological issue makes it challenging to integrate the mixed-frequency data into the neural network model. Frequency synchronization processing must be performed on mixed-frequency data. Andreou et al. [52] propose a hypothesis of aggregating the mixed-frequency data with equal weights into the regression model. Based on a weighted approach to low-frequency data processing and employing Monte Carlo simulation, the authors overturned the above hypothesis, verifying the validity of weighting mixed-frequency data series. Guérin and Marcellino [53] linearly interpolated low-frequency variables into some common high-frequency variables as other variables for predicting economic activity in the US. Alternatively, Asimakopoulos et al. [54] considered that substituting quarterly fiscal data for annual frequencies would result in more accurate results. Some scholars have also pointed out that during the aggregation process of mixed-frequency data, there may be issues such as loss of important information in high frequencies, increased impact of measurement errors on high-frequency variables, and significant computational burden. Ghysels et al. [55] proposed the MIDAS model to model and analyze the raw mixed-frequency data directly, asserting that such an approach can enhance the adequacy of high-frequency information utilization, address parameter diffusion, and improve the timeliness of prediction via low-frequency response variables. These properties have resulted in the MIDAS method’s successful application in many fields, especially in predicting macroeconomic development and inflation. The same method has helped researchers to predict development trends in financial markets and consumption [56].
Given that it is challenging for machine learning models to process mixed-frequency input data directly and that the sampling models cannot handle non-linear model fitting, some scholars have attempted to integrate multiple models in a unified framework for prediction. For instance, Xu et al. [57] developed a portfolio investment model containing conditional skewness based on the MIDAS quantile regression model to reduce investment risks. Guo et al. [58] developed the Markov-switching mixed data sampling (MS-MIDAS) model by integrating monthly and quarterly data to analyze economic cycle regime monitoring timeliness in China. Götz et al. [59] proposed a method for testing the non-linear Granger causality of mixed-frequency data to study the potential causal relationship between China’s economic growth and consumer confidence. Xu et al. [60] established an artificial neural network (ANN–MIDAS) model for sampling mixed-frequency data. The authors introduced the MIDAS method into the ANN framework to process non-linear mixed-frequency data using monthly macroeconomic variables and daily financial market variables to predict monthly inflation. The model outputs significantly improve the accuracy of economic forecasting, even though the model ignores the time information (within datasets) and the temporal volatility with factors of uncertainty, such as external political and social factors, technological innovation, and market competition over time. Despite strengths, such a shortcoming makes it difficult to accurately predict inflection points in the economic development trajectory on time.
In view of the above, scholars are now considering dynamic prediction from the perspective of time series. Of some noteworthy advancements, Clements and Galvão’s [61] AR–MIDAS model fully considered the role of autoregressive terms. Jardet and Meunier [62] have integrated the compression characteristics of the Lasso algorithm to construct a Lasso–MIDAS model for predicting international crude oil returns. Although this model has improved prediction capacity, it still has shortcomings: (i) dealing with mixed-frequency time series problems; (ii) providing sufficient information about the interdependence between multiple economic exogenous variables within the same time period; (iii) offering insight into the dependency relationships across time steps and series. The AM approach provided a robust solution to this problem by effectively capturing the dynamic changes in mixed-frequency data [63], assigning different weights to different economic time series, and weighting time nodes to enhance the ability to learn external variable fluctuations and improve the timeliness of capturing abnormal economic inflection points. It has been successfully applied in economic forecasting [64].
Therefore, this study incorporates MIDAS and AM approaches into the DeepAR framework and develops a new deep autoregressive neural network model (referred to as MIDAS–AM–DeepAR) for mixed-frequency data, which could help answer the following question: how to predict the development of sustainable e-commerce under conditions of uncertainty, precisely and accurately?
3. Research Methodology and Modelling
Recently, e-commerce trading volumes are highly susceptible to macroeconomic factors, e.g., politics, the economy, societal trends, and technological advancements. Additionally, public demand for sustainable development introduces further uncertainty and abnormal fluctuations. Deep learning models must incorporate a broader array of macro-environmental data to enhance prediction accuracy, enabling the capture of nuanced information from an external environment characterized by high-frequency variability. Moreover, considering the inherent uncertainty of these external factors, it is crucial to integrate time-based external feature covariates. Therefore, this study constructs a novel MIDAS–AM–DeepAR model to address data and time-related issues. The advantages of the three distinct models are discussed hereafter.
DeepAR is a powerful forecasting approach, particularly suited for scenarios involving time series data [65]. The method employs a recurrent neural network (RNN) architecture that captures temporal dependencies in the data while simultaneously enabling efficient handling of complex and non-linear relationships. DeepAR facilitates the prediction of future values by conditioning on past observations and covariates and can efficiently compute global patterns across alltime series and the local variations specific to each time series. The basic structure of the DeepAR model consists of multiple components: (i) autoregressive recurrent network architecture; (ii) encoder and decoder structure; (iii) gated recurrent units (GRUs); (iv) probabilistic generation methods; (v) embedded categorical features; (vi) long short-term memory mechanisms; (vii) quantile loss training.
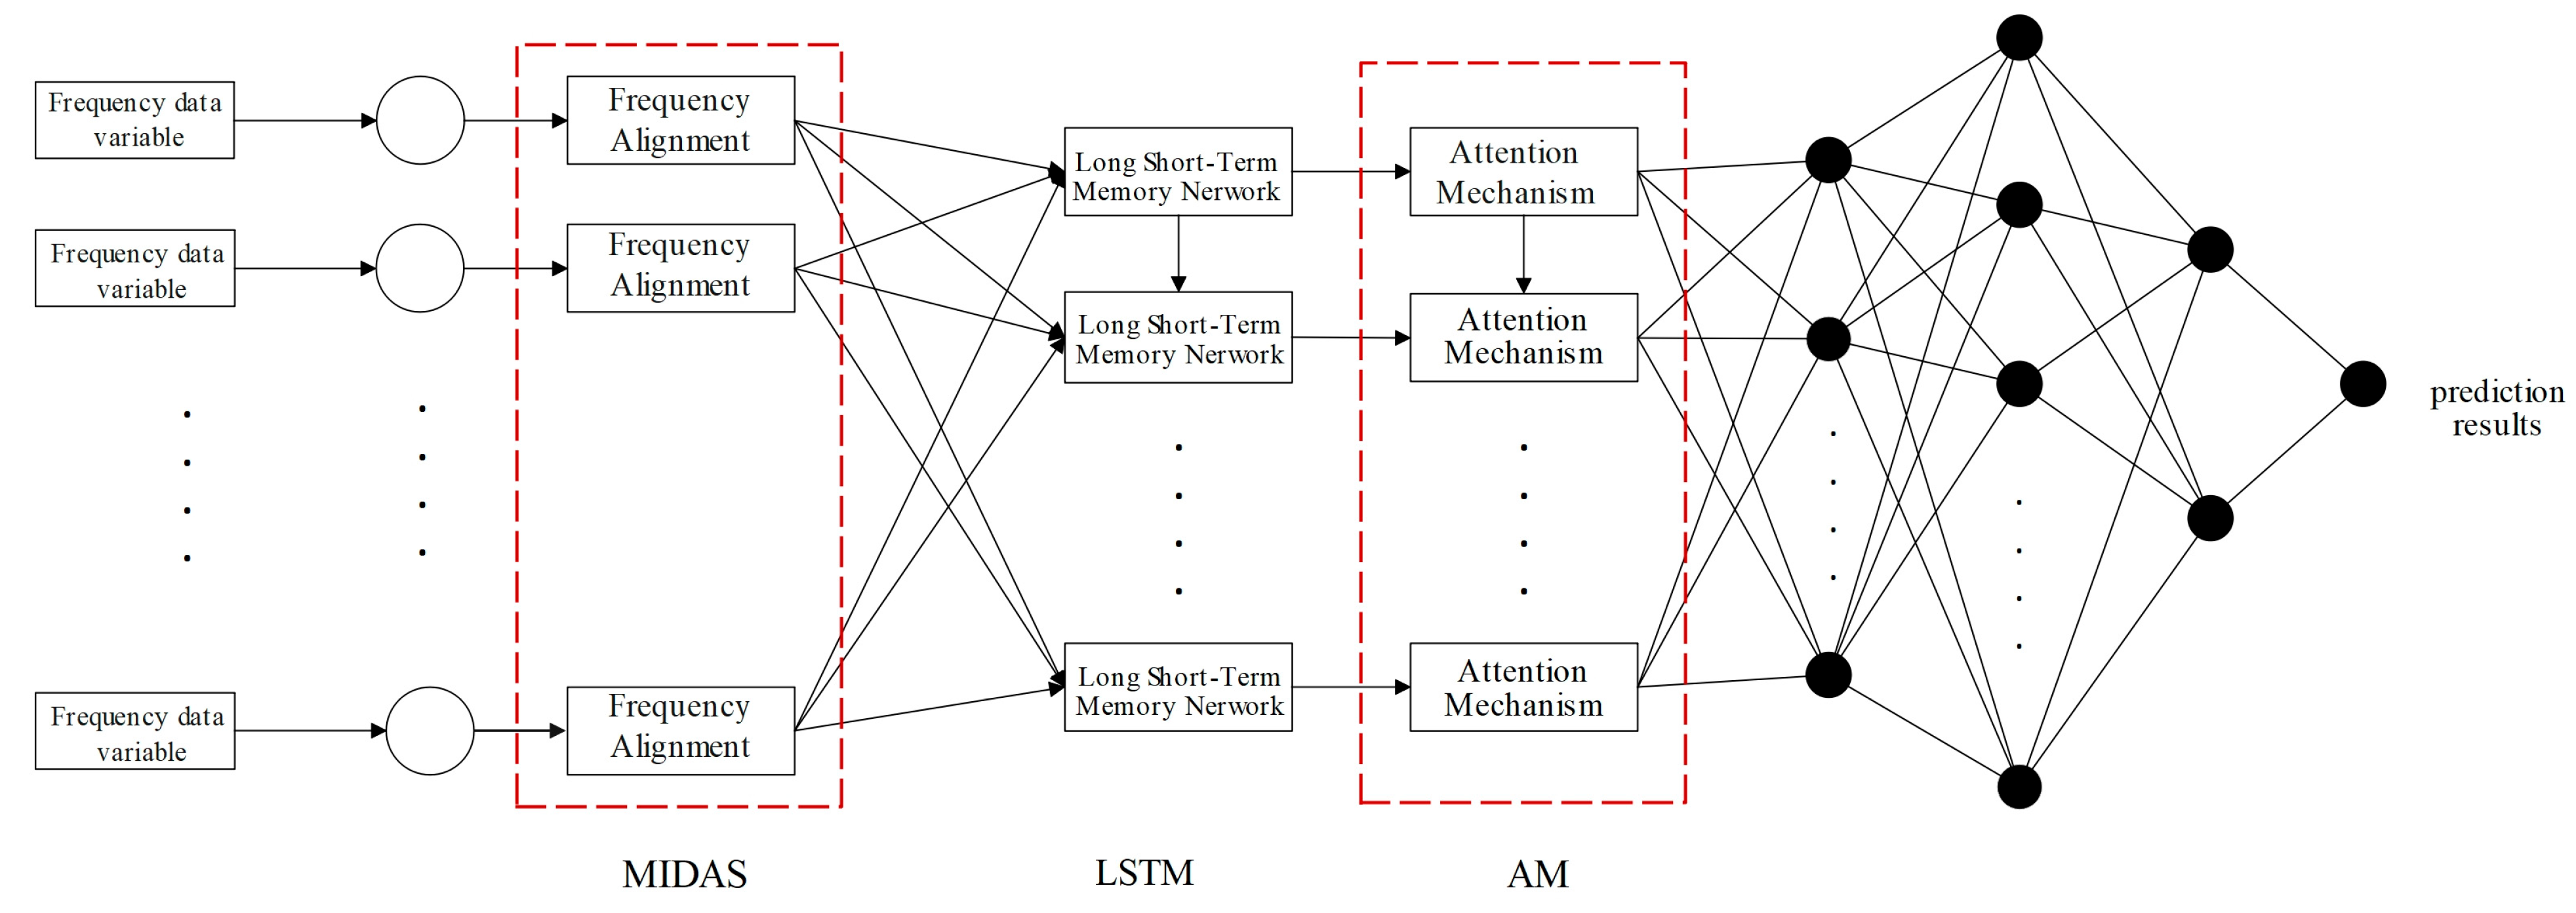
On the other hand, the MIDAS model is a method for processing time-series data sampled at different frequencies [66]. Although MIDAS is frequently used when the explanatory variable is high-frequency data, the response variable is sampled at a lower frequency. The AM approach is a mechanism containing filters and is usually used to solve the dynamic correlation and time sensitivity of time series with different explanatory variables [67]. Combining the two techniques provides new ideas for predicting abnormal inflection points of response variables. The basic framework of the model is shown in Figure 3. To create the MIDAS–AM–DeepAR model, the high-frequency explanatory variables are first converted into data with the same frequency as the low-frequency response vector through the MIDAS model and parameter function constraints, ensuring data frequency consistency and preventing parameter diffusion. The valid information of the data is subsequently perceived through the AM approach. The prediction weights are allocated based on sensitivity to time, which can output multi-step forward prediction results.
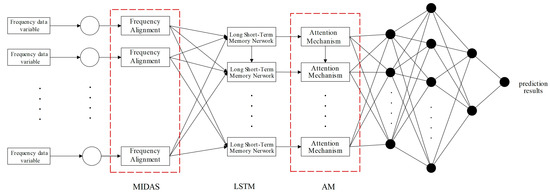
Figure 3.
MIDAS–AM–DeepAR model framework.
3.1. Model Setup
The traditional AM approach only selects information related to the current time step; a design suitable for tasks that contain one piece of information at each time step. If there are multiple variables per time step, variables with noise in predictive utility cannot be ignored. As the conventional AM approach averages information over multiple time steps, it cannot detect functional temporal patterns for prediction. To examine the temporal correlation patterns between mixed-frequency data, this study constructs a MIDAS–AM–DeepAR model by integrating the AM approach proposed by Shih et al. [68], which includes information spanning multiple time steps and a neural network with a sampling of mixed-frequency data. The model consists of the following five parts:
3.1.1. Input Layer
External multi-source data information is sampled at different frequencies, resulting in a mismatch in the collected data. However, the original neural network model could not directly fit the frequency mismatch between high-frequency explanatory variables and low-frequency response variables into the input layer. Therefore, to avoid latent data processes before they are integrated into the model and to make the best use of high-frequency information, the MIDAS method, a technique widely used in econometrics for mixed frequency time series data, is adopted and integrated into the neural network input layer.
3.1.2. Mixed-Frequency Data Sampling Layer
Assuming that the frequency mismatch between the low-frequency response variable and the high-frequency explanatory variable is , frequency alignment is achieved for each input variable based on the corresponding maximum lag order . That is, each high-frequency explanatory variable is converted into a low-frequency response variable . To reduce the number of parameters to be estimated and to ensure concise specification, the frequency-aligned vectors are weighted to obtain a low-frequency variable of the same frequency as the output .
where denotes the weighting scheme; represents the prediction range related to high-frequency explanatory variables ; ; and is the smallest integer, such that .
Following Ghysels et al. [66] and Gagliardini et al. [69], is specified as the exponential Almon lag polynomial of two parameters (), i.e. , where denotes the lag of period . Meanwhile, when calculating the input gates , the information saved from the previous moment (the input at that moment , the hidden state at the previous moment , and the weight matrix and bias term of the input gate) are converted into the control signal of the input gate based on the sigmoid function, which is then inserted into the time correlation layer along with the MIDAS-processed matrix.
3.1.3. Time Correlation Layer
To avoid gradient vanishing and gradient explosion in recurrent neural network (RNN) models, the LSTM model is used for temporal correlation learning. LSTM is a crucial network structure in the DeepAR model, consisting of memory cells, update gates, forget gates, and output gate units, which can capture long-term temporal correlation. By integrating various external sustainable development features, long short-term memory (LSTM) networks can improve the predictive model’s ability to utilize historical data, thereby enhancing the learning of long-term dependencies [70].
First, calculate the control signal of the forget gate , then calculate the unit state at the current time , obtain the correlation layer node at time , and obtain the output of the time correlation layer .
where , and = the activation, sigmoid, and hyperbolic tangent functions, respectively; “○” = the Hadamard product; and = the weight matrix and bias term of the forget gate; and = the weight matrix and bias term of the current input cell state; and = the weight matrix and bias term of the current output.
Based on the above settings, the current memory and long-term memory are combined to form a new unit state . At the same time, a control function is added for the forget gate to enable it to store relatively old information.
3.1.4. Time Extraction Layer
Since the LSTM model does not distinguish the impact of various historical inputs on current data, the AM approach is added to extract valid time information, learn the degree of influence of multiple variables on response variables at different moments, and mine key time information. The weights of each time series pattern are determined through a scoring function. Weight information at different times is then extracted based on the size of the weights. Convolutional neural network (CNN) filters capture necessary signals and extract fixed-length time series from input information. The main steps of derivation are as follows.
First, determine the output of the time correlation layer and the unit state and then calculate the results of the time extraction layer .
Second, we used CNN filters (T is the maximum length of interest, which is the sliding window size ) to extract features; the convolution operation produces the matrix , where denotes the convolution value of the vector in a row and the -th filter.
Next, a scoring function is used to assess the strength of the impact of each time series on the predicted outcome, where the scoring function weight matrix and is the weight of interest, which facilitates the selection of the multivariable.
Lastly, each row is weighted and summed to obtain a context vector ; the context vector and final output of the time extraction layer are further linearly mapped and summed to obtain the final output of the time extraction layer after the operation of the attention mechanism .
3.1.5. Output Layer
As deep mining of mixed-frequency data time is completed after the above steps, the MIDAS–AM–DeepAR model moves to the output layer, where the sample of mixed-frequency data and the prediction of abnormal inflection points are executed. The final output of the model is expressed as the following:
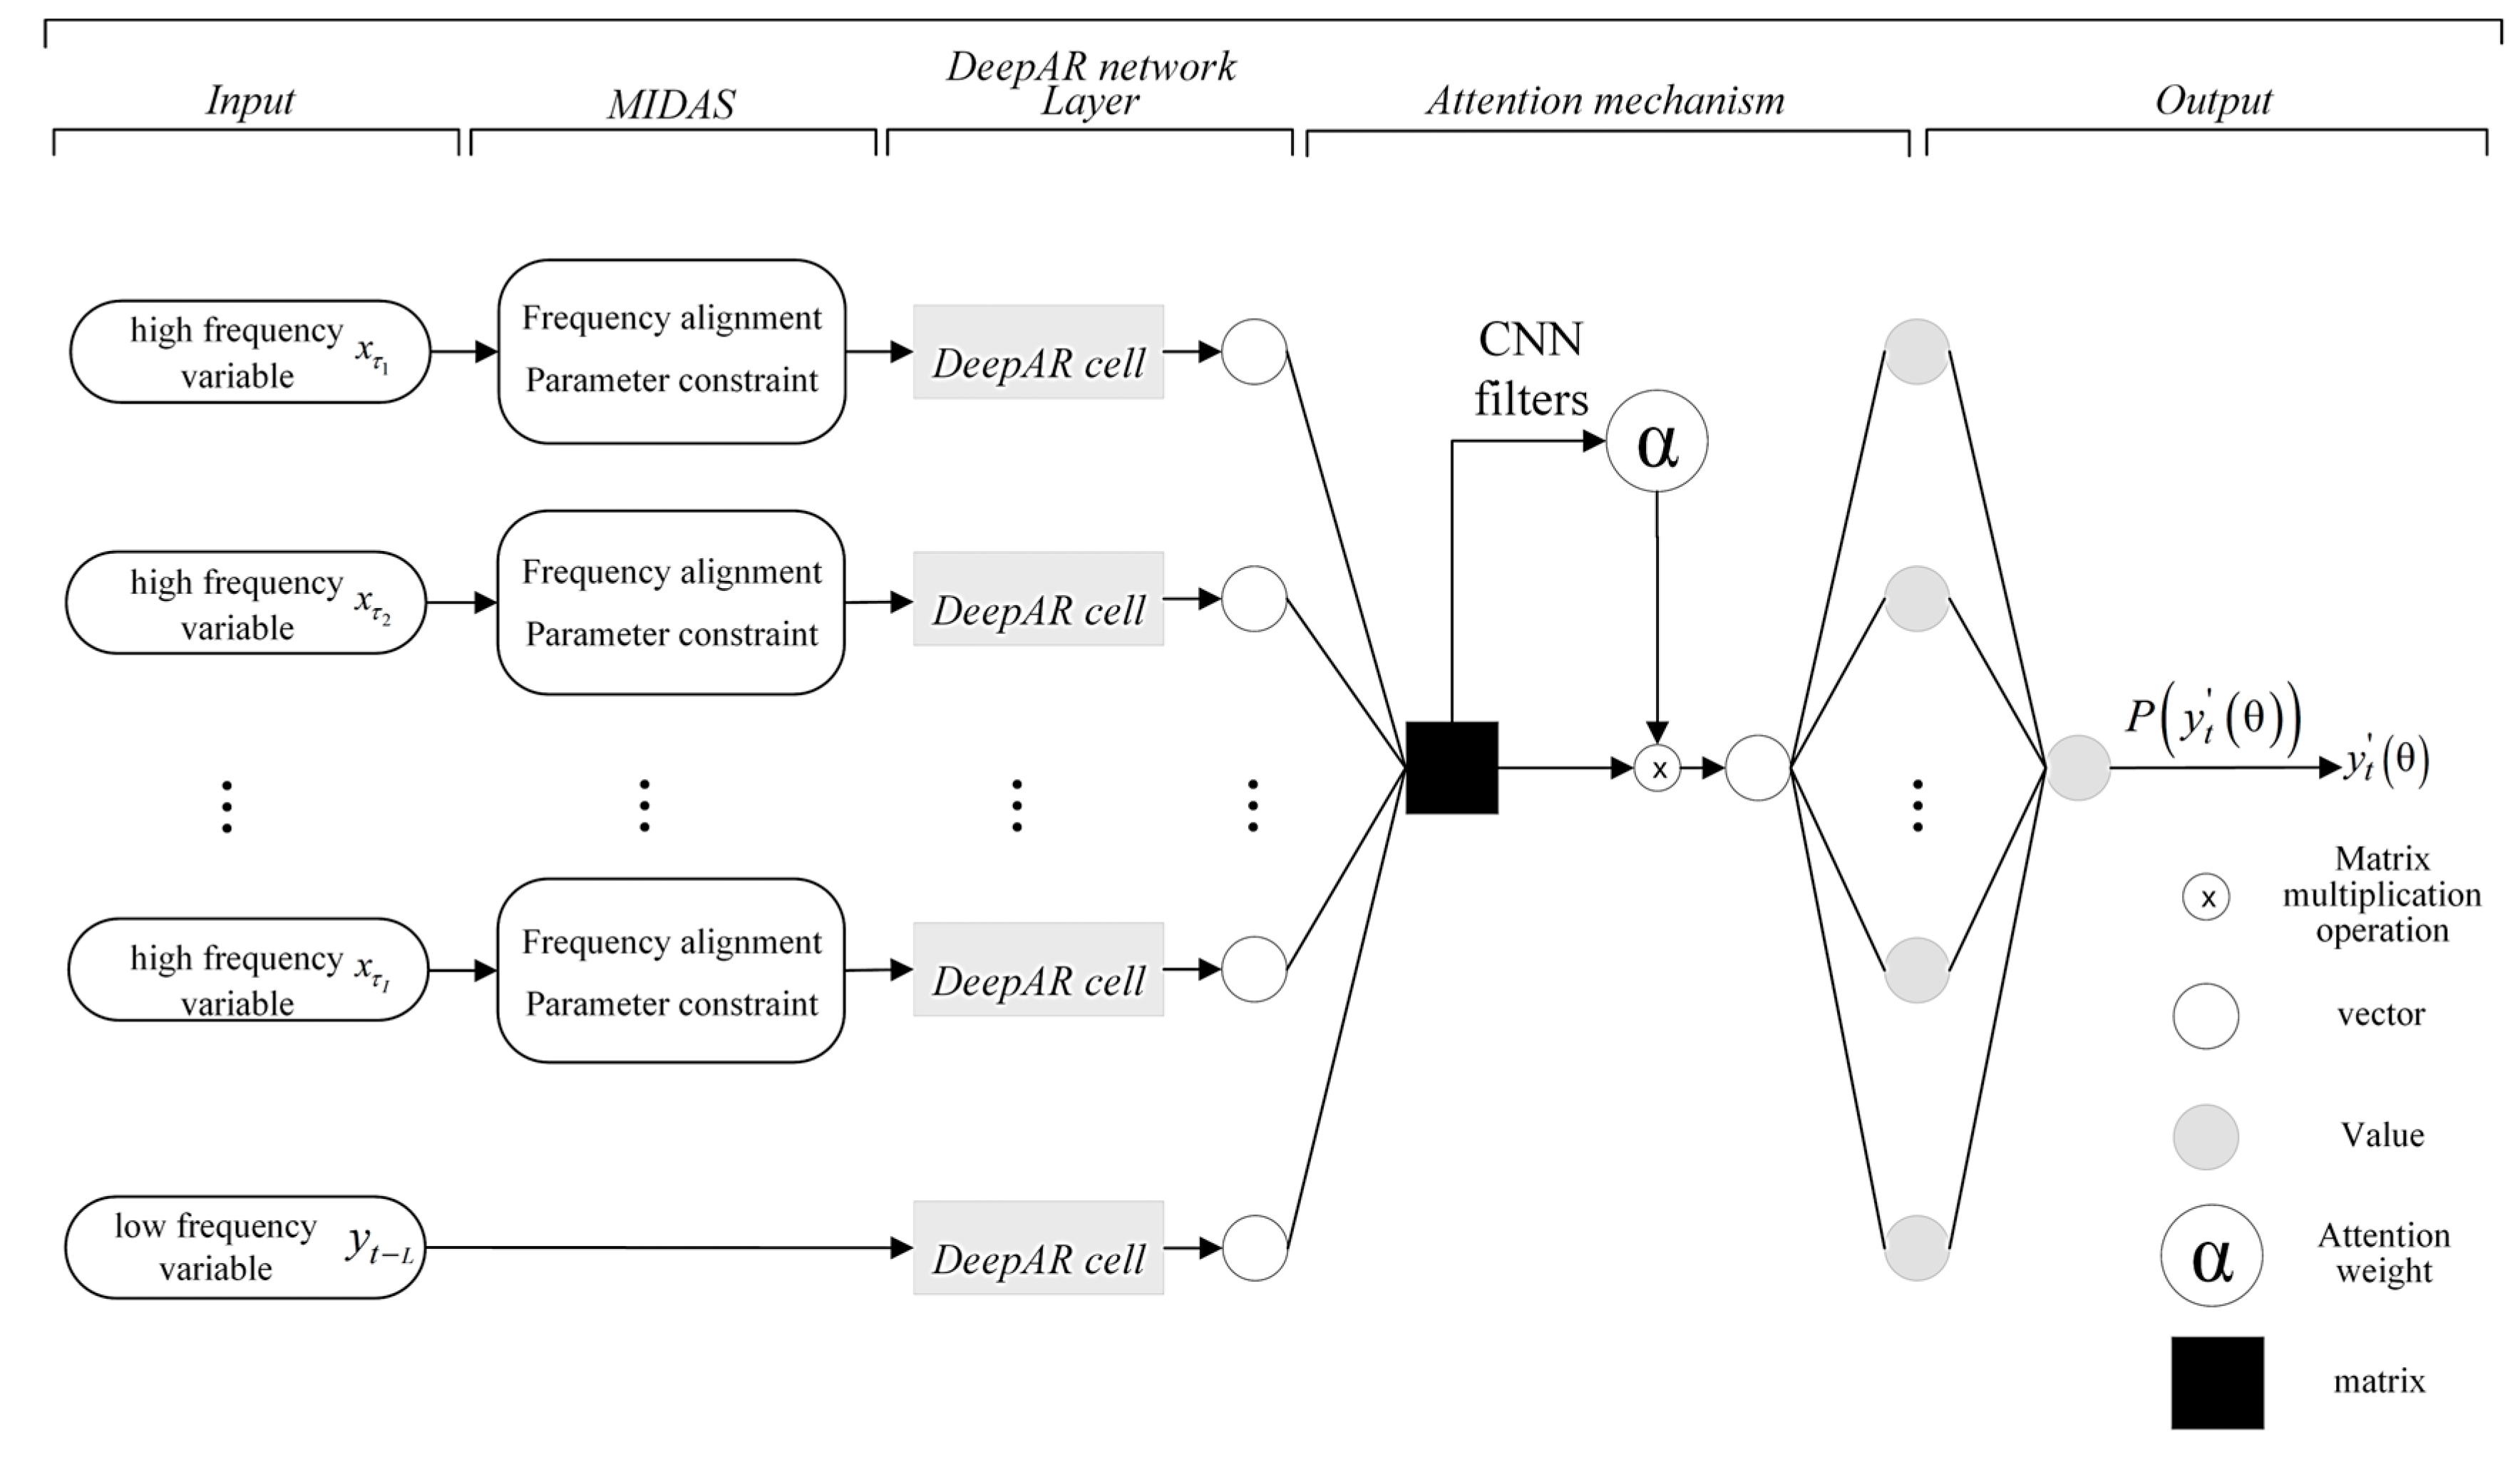
where . Figure 4 presents the structural diagram of the MIDAS–AM–DeepAR model.
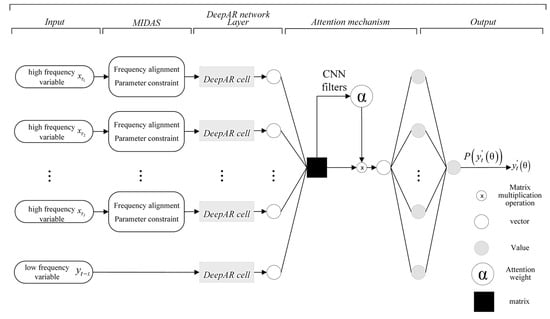
Figure 4.
Structure of the MIDAS–AM–DeepAR model.
In terms of novelty, the MIDAS–AM–DeepAR model differs from previous prediction models proposed by earlier researchers in the following ways: (i) Salinas [65]—the DeepAR model cannot handle the sampling of raw mixed data and perceive the temporal attention of the data directly; (ii) Bangwayo-Skeete et al. [71]—the AM-MIDAS model used a non-linear least squares method to estimate the specification; (iii) Xu et al. [60]—the ANN–MIDAS model cannot output conditional distributions to avoid prediction uncertainty and related risks; (iv) Liu et al. [72]—the QRNN–MIDAS model used quantile regression to process and describe the complete conditional distribution information of corresponding variables. Instead, the proposed MIDAS–AM–DeepAR model has the following unique characteristics: (i) it can directly use raw mixed-frequency data as input without the need to pre-process the data before inputting it into the neural network, preserving high-frequency data as much as possible to utilize high-frequency information fully; (ii) by fully leveraging neural networks’ data-driven and adaptive learning capabilities, the current model can automatically identify and explore potential non-linear patterns between variables while learning complex long-lag tasks without losing short-lag capabilities; (iii) the model has the capacity of generating directly outputs probability distributions to evaluate the uncertainty of predictions and related risks, thereby providing more helpful information for decision-making; (iv) an attention mechanism of the filter is constructed to extract temporal patterns, enabling the model to learn not only the interdependencies between multiple variables within the same time step but also dependencies across all previous times and series, thereby achieving the ability to screen important variables while increasing attention to important time nodes and effectively capturing anomalous fluctuations; (v) the model can generate multi-step forward predictions. The intrinsic temporal correlation between hidden states at different times can be learned through the time attention mechanism to promptly capture short-term fluctuations and improve the accuracy of long-term predictions.
3.2. Model Estimation
Given the low-frequency time series and the associated high-frequency time series , the MIDAS–AM–DeepAR model parameters are learned by maximizing logarithmic likelihood. The model parameters consist of the parameters of the recurrent neural network that incorporates the attention mechanism and the parameters of . The loss function can be expressed as the following:
where the likelihood function acts on the model noise, and the Gaussian function, negative binomial distribution, and others can be chosen.
This study assumes that each low-frequency response variable follows a Gaussian likelihood function that satisfies a certain parameter, and its mean and standard deviation are obtained by fitting the DeepAR network layer. In contrast, the softplus activation function ensures the continuity and non-negativity of the standard deviation.
Unlike scholars such as Silver [73], who assumed a determined demand distribution, this study uses neural networks to train parameters, making optimizing neural networks an indispensable step. Given the differentiability of the loss function, the adaptive moment estimation (ADAM) algorithm proposed by Kingma et al. [74] iteratively updates the neural network weights based on training data to optimize the neural network for model estimation.
The ADAM algorithm is an adaptive learning rate method that dynamically adjusts the learning rate of each parameter using first-order and second-order moment estimation of gradients. Its main advantage is that after bias correction, the learning rate of each iteration has a certain range, and therefore, the parameters remain relatively stable. Its algorithm is as follows; see Algorithm 1. This study applies Python 3.11, an open-source software, for model computation.
| Algorithm 1. ADAM algorithm pseudo-code |
| Require: Steps Require: The exponential decay rate of moment estimation , with default values of and . Require: A constant used for numerical stabilization, with a default value of Require: Objective function with noise Require: Initialization parameters: Initializing first-order moment variables: Initializing second-order moment variables: Initializing time step while do Take a small batch of data containing samples of {} from the training set , with the corresponding target being Calculating the gradient Updating biased first-order moment estimates: Updating biased second-order moment estimates: Correcting for deviations from first-order moments: Correcting for deviations from second-order moments: Calculating the updates: Applying the updates: end while return |
3.3. Model Predictions
The MIDAS–AM–DeepAR model aims to establish a conditional probability distribution, which can be considered a concatenated multiplication of the likelihood function over a series of time steps. Define the low-frequency response variable as at time . To demonstrate the advantage of forward multi-step prediction, take as the time point of division, that is, the prediction range associated with the release of the low-frequency response variables. Given a dataset , based on known low-frequency response variables and multiple high-frequency explanatory variables , low-frequency response variables are modeled for future multi-step prediction ().
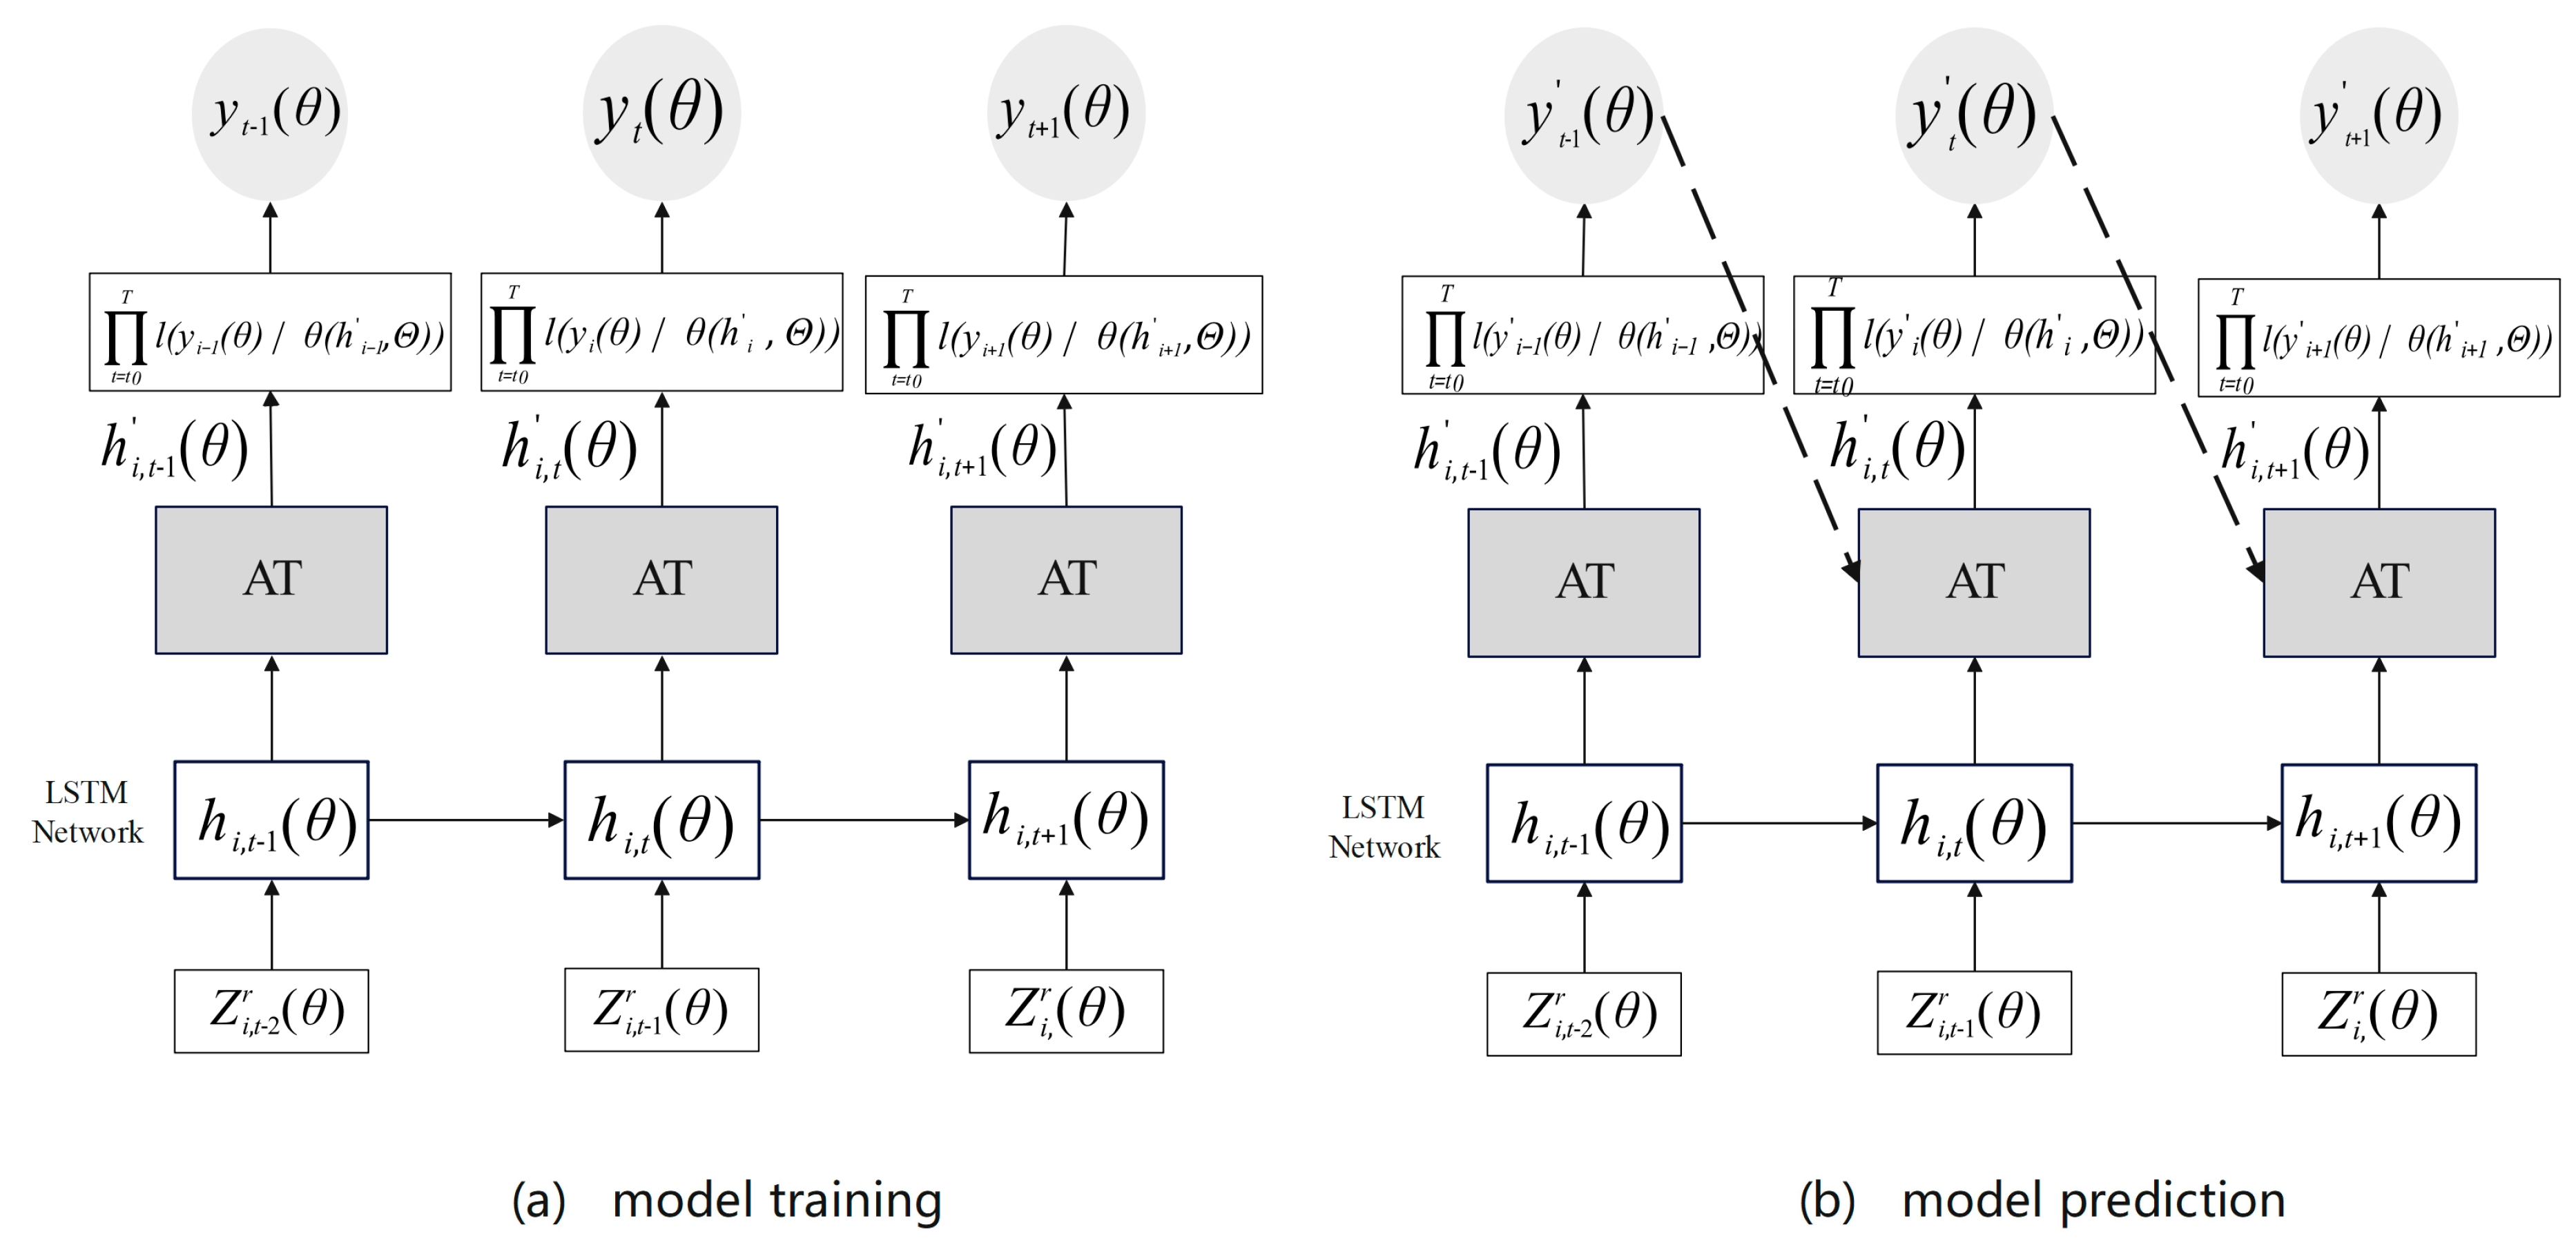
The network structure of the model is divided into two parts, namely model training and model prediction, As shown in Figure 5 below, during the model training process, the input data are known, while the AM approach is used to assign weights to the input data. The likelihood function of the next moment is further calculated, and the model parameters are trained by maximizing the likelihood function. In model prediction, the data are unknown; therefore, the AM approach is used to integrate the weight-learning results of collected samples to obtain an estimated value , and the prediction result is generated through continuous iteration. Specifically
where a certain relationship exists between the low-frequency prediction range and the high-frequency prediction range involved in multi-step advance prediction, i.e., , where ⌈·⌉ is the upper bound function.
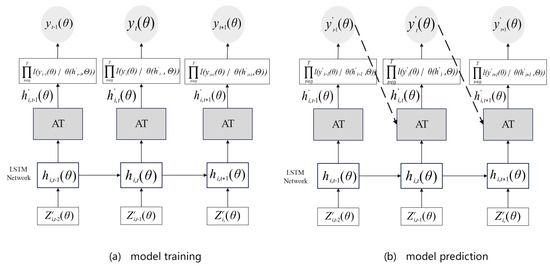
Figure 5.
The network structure design of the prediction model about MIDAS–AM–DeepAR.
4. Empirical Analysis
4.1. Data Description and Descriptive Statistics
Online retail data derived from the US Department of Commerce (UDOC) was used to represent e-commerce development in the US. In line with Jurado et al. [75], monthly producer price index data, monthly consumer price index data, real M2 money supply, and West Texas Intermediate Oil (WTI) prices were used as predictive factors to evaluate macro-level uncertainty and its impact on the development of the e-commerce industry. Data sourced from the Federal Reserve Economic Data (FRED) comprised four key macroeconomic indicators spanning from January 2000 to December 2022. Table 2 and Table 3 provide the relevant information about the data used in this study.
Table 2.
Description of predictive variables for U.S. e-commerce sales data.
Table 3.
Descriptive statistics of predictive variables for U.S. e-commerce sales data.
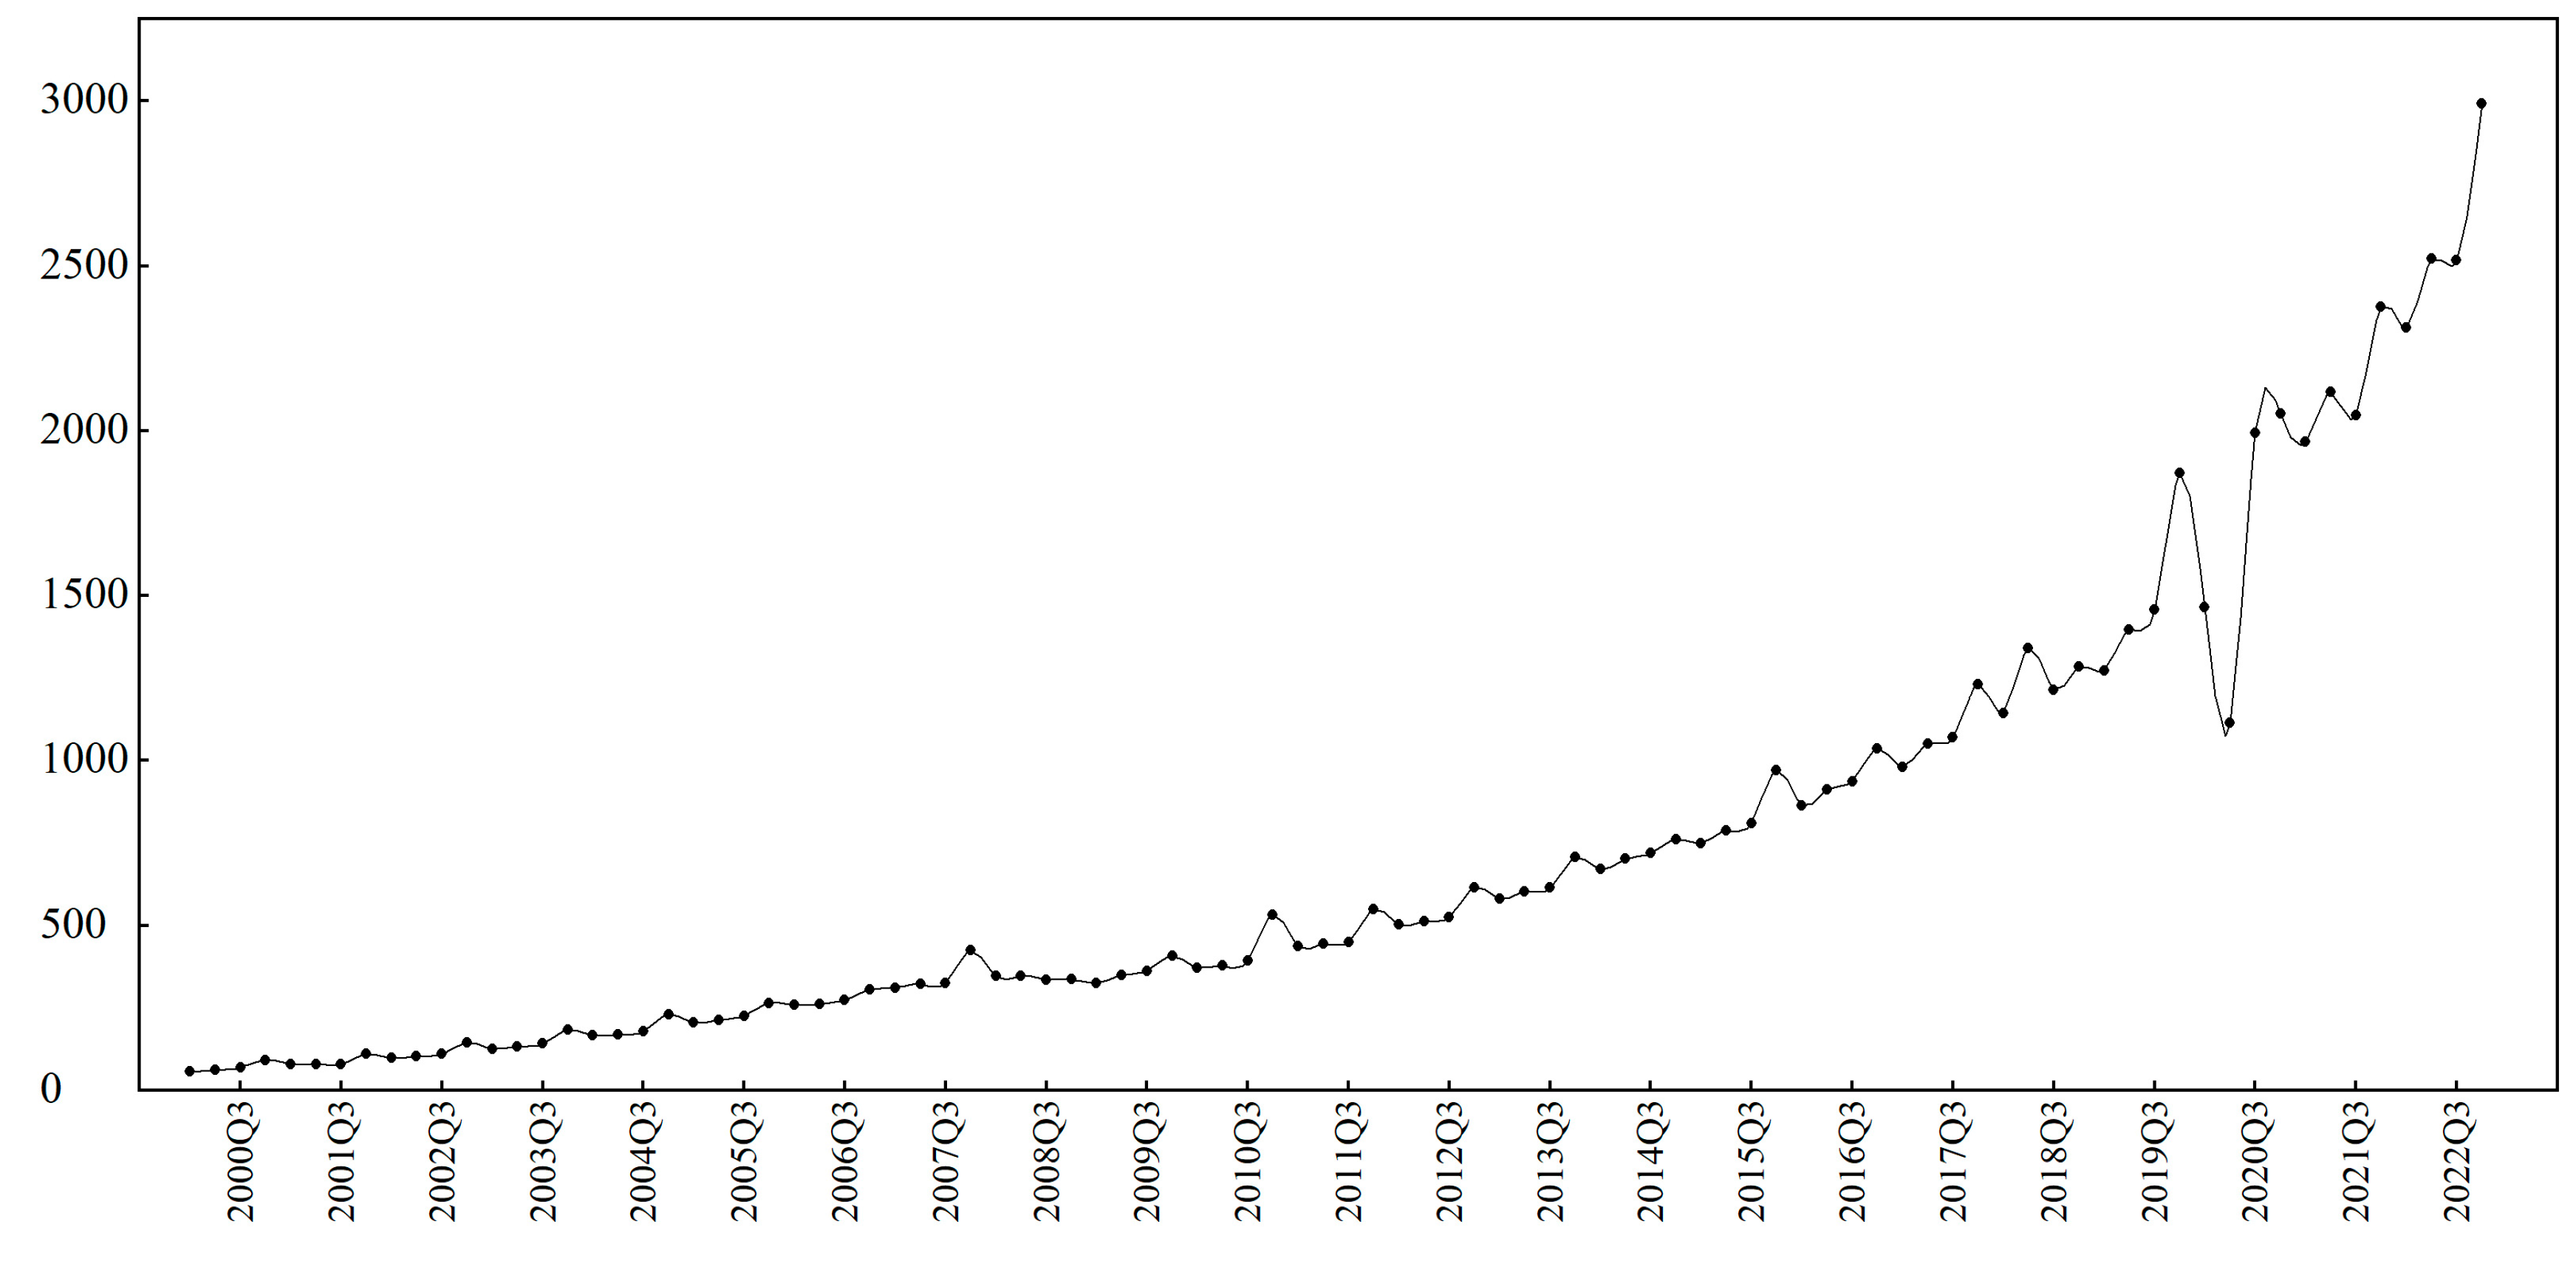
Figure 6 shows the trend of quarterly online retail sales in the US from January 2000 to December 2022. As seen below, due to the global COVID-19 pandemic, there have been significant fluctuations in e-commerce transactions characterized by apparent uncertainty, non-linearity, and abnormal inflection points, which makes traditional prediction methods, including DeepAR–MIDAS, AM–DeepAR, DeepAR, and AR–MIDAS models ineffective. Instead, the MIDAS–AM–DeepAR model has a superior capacity to analyze the prediction accuracy and distribution fitting effect of industrial economic indicators.
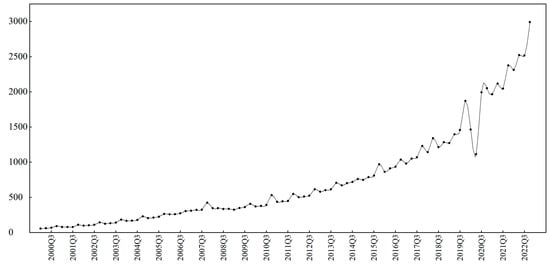
Figure 6.
A.N.S. data with abnormal conditions.
4.2. Selection of Evaluation Indicators
Data from January 2000 to June 2014 was used as in-sample data to evaluate the predictive effect, while data from July 2014 to December 2021 data was taken as out-of-sample data in the MIDAS–AM–DeepAR model. Meanwhile, the rolling sliding window prediction method was used to verify the robustness of the above model. The fixed window comprises 114 quarters, with data from January 2000 to June 2018 as the initial dataset and scrolling along the entire dataset. At each scrolling step, the window continues to move forward, covering new data points and scrolling until the end of December 2022. Regarding the traditional DeepAR and AM–DeepAR models, based on the same observation frequency, this study refers to the work of Xu et al. [76], in which monthly and weekly predicted values were averaged using the sample averaging method to generate quarterly online retail data observations.
To analyze the reliability of the model, this study adopts three types of performance evaluation metrics, including the prediction error evaluation metric, the probability prediction evaluation metric, and the significance test metric for inter-model differences.
1. Prediction error evaluation metric: To test the prediction accuracy of the model, this study uses two criteria, namely the mean absolute error (MAE) [77] and mean absolute percentage error (MAPE) [78], to test the prediction accuracy of the model. The formula is as follows:
where is an estimate of the true quantile ; is taken as an estimate of the quantile type model based on the experimental study of Salinas [65]. Generally, the smaller values of MAE and MAPE reflect the superior performance of a model in terms of prediction accuracy.
2. Probability prediction performance evaluation: To overcome the shortcomings of the model proposed by Xu et al. [72], the prediction interval coverage probability (PICP) and prediction interval normalized average width (PINAW) were used to check the validity and effectiveness of non-parametric probability prediction and to evaluate the interval prediction effectiveness of the quantile type model. As a reliability metric, PICP represents the number of observed values falling into the prediction interval [79], and the formula is as follows:
where = the predicted interval within the predetermined coverage range; = Boolean variable. When the actual value at the moment is within the predicted interval, the value is 1. Otherwise, the value is 0. The larger the PICP, the more predicted values are covered by the predicted interval and the more convincing the predicted results are. In addition to evaluating reliability, PINAW is also required to fully assess the performance of interval prediction using the following formula:
where D denotes the difference between the maximum and minimum target values of online retail data. The smaller the PINAW, the more accurate the prediction results.
3. Significant test metric to measure differences between models. This study adopted Harvey et al.’s [80] version of the DM test, originally introduced by Diebold and Mariano [81], to examine the statistical significance of the differences between the two groups of predictions. Hypothesis 0 (H0) implies that the prediction efficiency of the two models is consistent with the alternative hypothesis, implying that Model 2 is more accurate than Model 1, i.e.
where is the loss error between the predictions of two models, and is the loss function of prediction error (). For step-ahead prediction , the DM test statistic is obtained from the following equation:
where tests by comparing statistical data to critical values of distributions with degrees of freedom.
5. Results
5.1. Results and Analysis of Prediction Accuracy
As seen in Table 4, the differences among the five models, under step-forward prediction, were computed to establish the prediction accuracy of MIDAS–AM–DeepAR against other competing models using the MAE and MAPE approach. These five models were extended using a stepwise addition and substitution approach.
Table 4.
Multi-step forward prediction error of quarterly A.N.S. values in the United States.
Table 4 shows that regardless of the forward prediction steps, the MIDAS–AM–DeepAR model has higher prediction accuracy than the other four models, with a maximum performance improvement of over 70%, demonstrating high prediction accuracy and robustness. First, compared with the same-frequency models (DeepAR model and AM–DeepAR model), the DeepAR–MIDAS and MIDAS–AM–DeepAR models have lower MAE and MAPE values, which proves that adopting the MIDAS method can improve prediction performance. The main reason was that the introduction of MIDAS could effectively retain and utilize the information of prediction factors while avoiding information loss caused by converting high-frequency prediction factors to low-frequency quarterly ANS data. Second, by comparing the prediction accuracy of MIDAS–AM–DeepAR with that of the AR–MIDAS and the DeepAR–MIDAS models, it was found that under the coordination of attention mechanism and neural network, it overcame the complex non-linear relationship of online retail data with abnormal inflection points and considered the attention mechanism and temporal sensitivity of abnormal states. Furthermore, compared with the DeepAR and DeepAR–MIDAS models without an improved attention mechanism, the AM–DeepAR and MIDAS–AM–DeepAR models have lower MAE and MAPE values, indicating that introducing an attention mechanism that balances temporal sensitivity and variable selection can relatively optimize prediction accuracy.
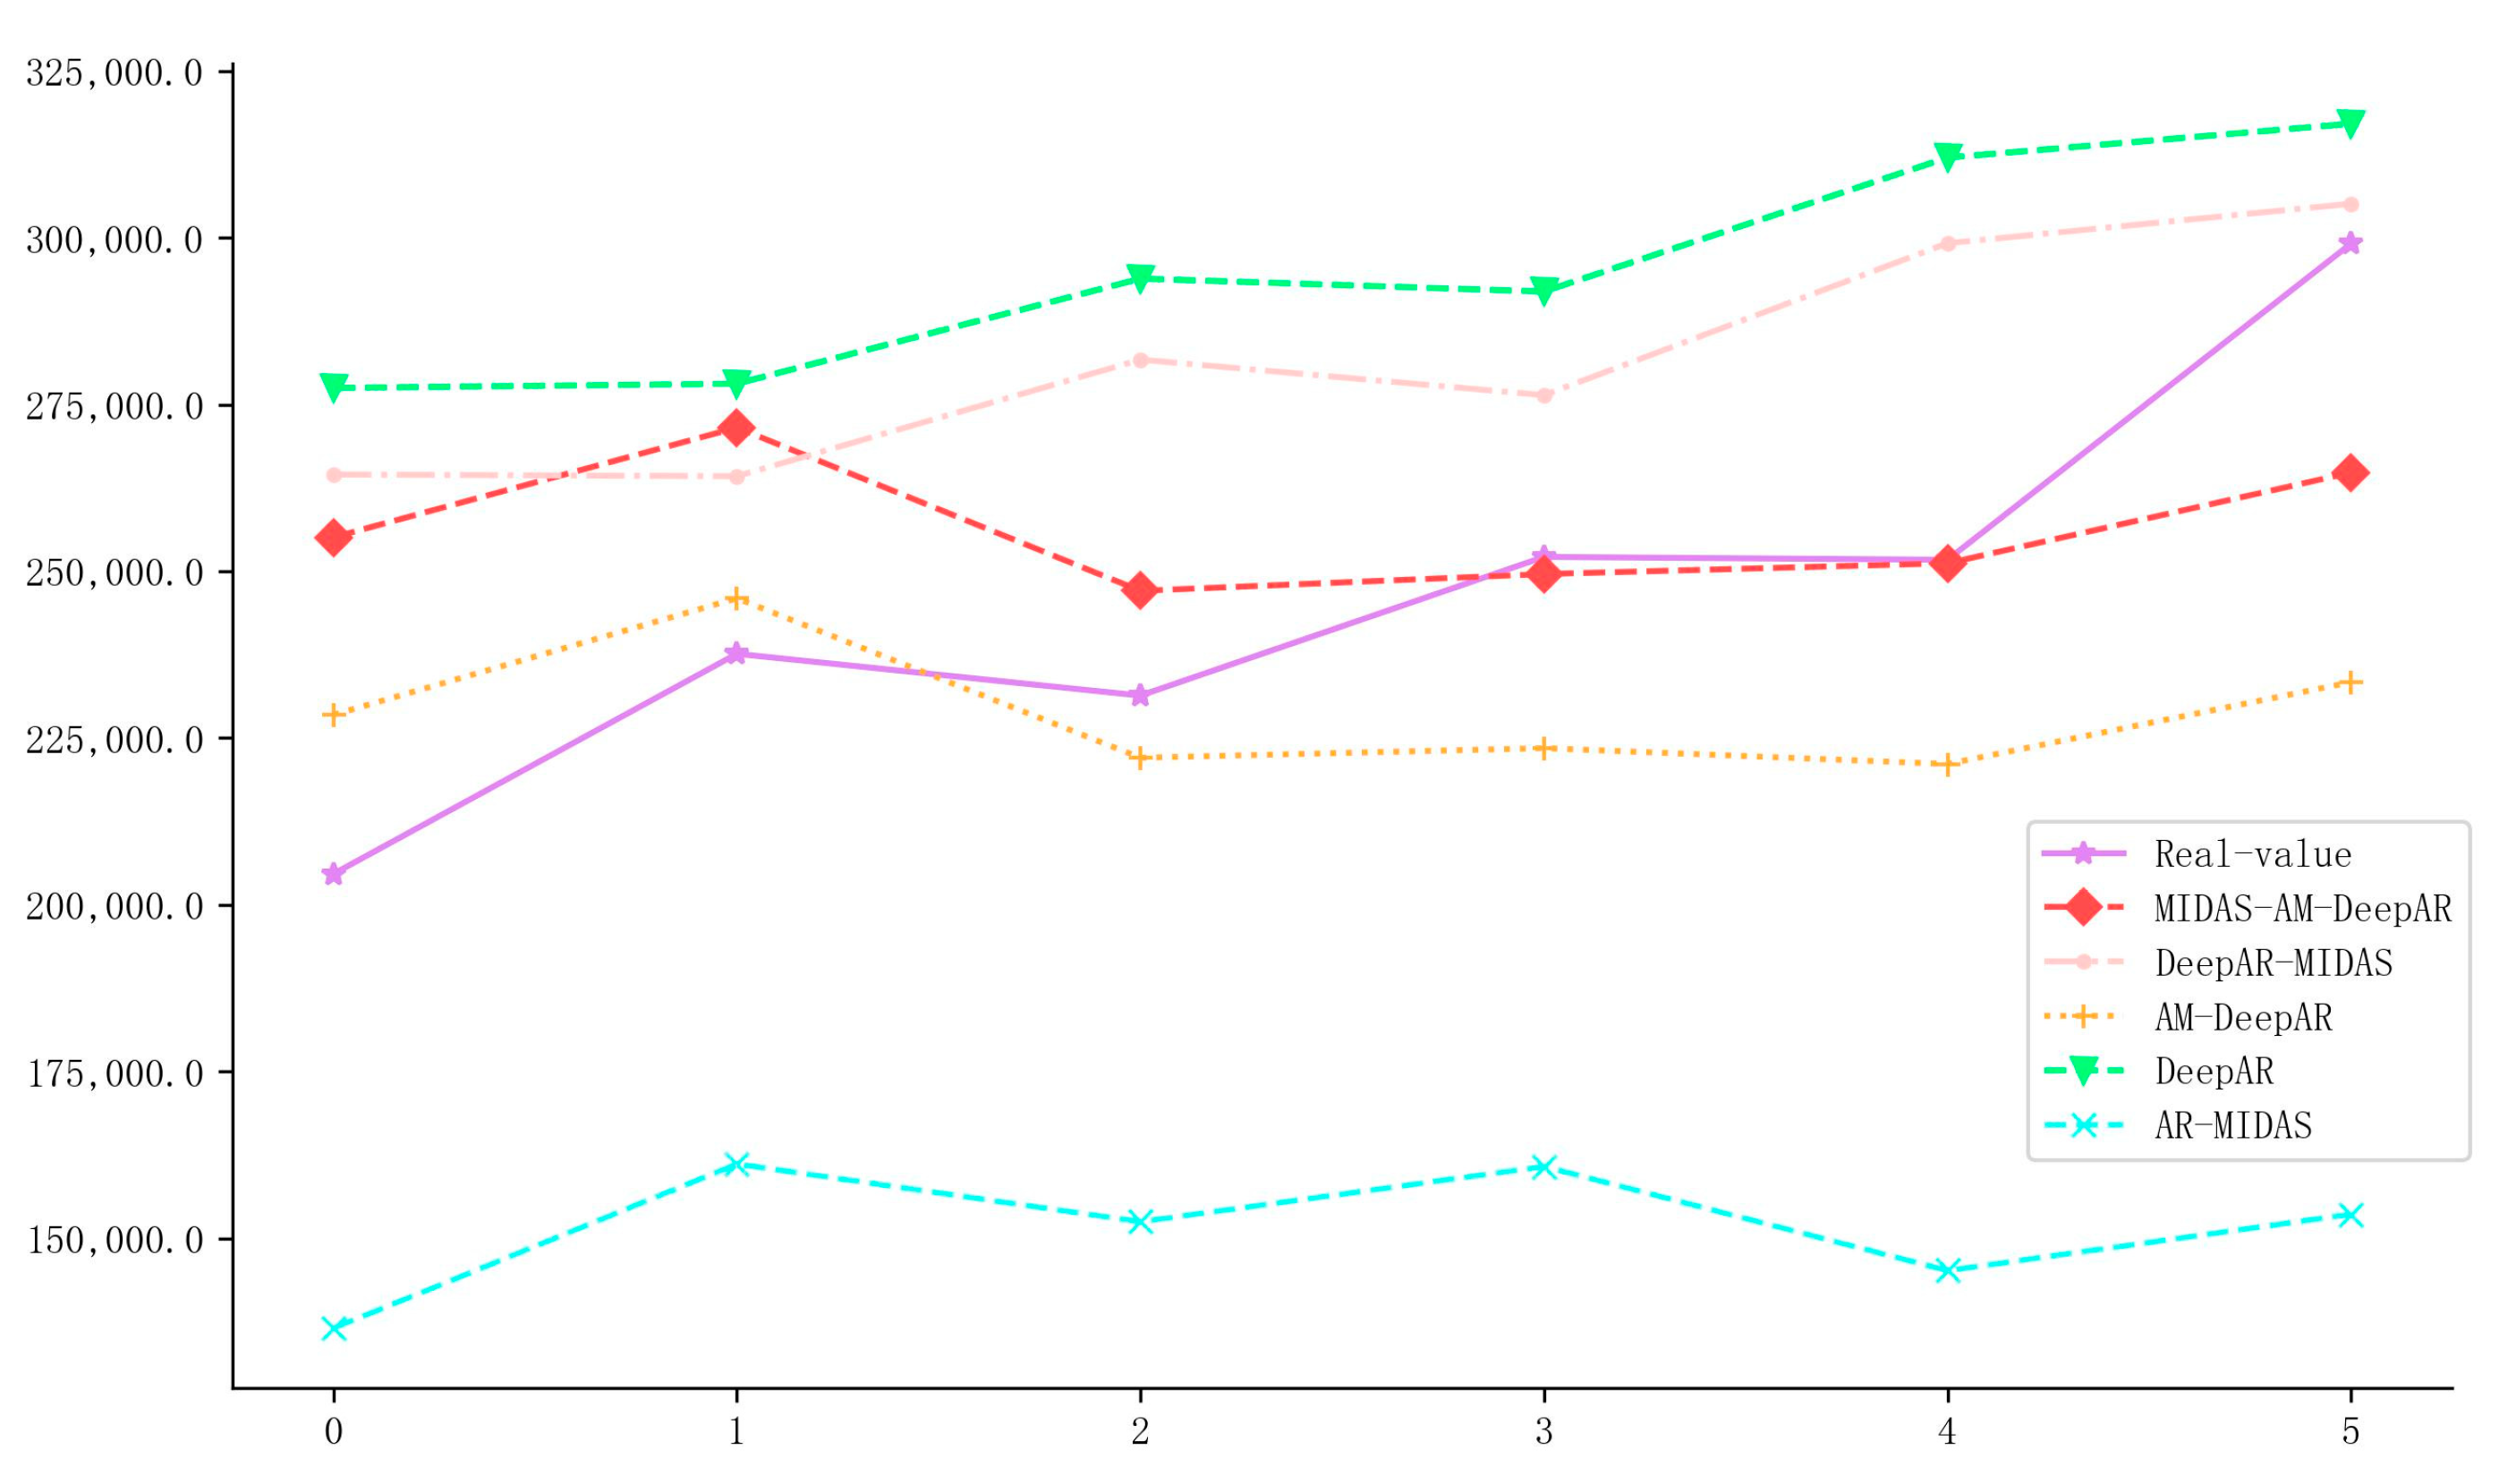
When predicting sustainability development indicators, more attention was paid to the model’s ability to predict turning points. Therefore, Figure 7 presents the differences between the ANS forecast values and actual values of the five models mentioned above from the third quarter of 2021 to the fourth quarter of 2022 to demonstrate the specific differences in the MIDAS–AM–DeepAR model’s ability to predict macroeconomic turning points.
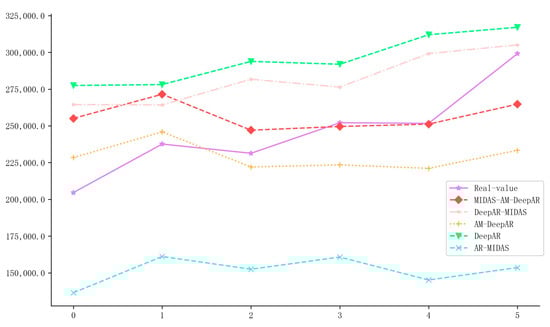
Figure 7.
Comparison chart of the predicted and actual values of ANS for the five models ().
Figure 7 shows that the MIDAS–AM–DeepAR model fits well with ANS fluctuations and tracks trends better than the AM–DeepAR model. The prediction error of the latter model can be amplified due to information loss if external uncertainty increases. In the case of the DeepAR–MIDAS model, an apparent failure was observed in tracking the abnormal fluctuation trends of ANS. The same model exhibited less sensitivity to ANS fluctuations, making it suitable for predicting relatively stable data only. This result demonstrated that the MIDAS–AM–DeepAR model exhibited robustness and generalization capabilities in predicting uncertain environments.
In summary, when facing significant changes in the external environment, such as the outbreak of COVID-19, the MIDAS–AM–DeepAR model outperformed competing models (i.e., DeepAR, AM–DeepAR, AR–MIDAS, and DeepAR–MIDAS) in prediction accuracy. In short, under shocks of external uncertainty, the MIDAS–AM–DeepAR model can prove to be a robust prediction tool as it can learn complex non-linear relationships between variables, maximize information value, and capture abnormal data fluctuations, ensuring effective prediction of e-commerce sales trends in uncertain environments.
5.2. Probability Prediction Results and Analysis
The PICP and PINAW tests were applied to evaluate the performance of different AR models in terms of multi-step forward prediction of the selected quarterly data. With the AR–MIDAS model showing the worst prediction accuracy, it was excluded from the list of models compared with the AR–MIDAS model. The result is shown in Table 5.
Table 5.
Evaluation of probability prediction performance under multi-step forward prediction.
As evident from the results in Table 5, the MIDAS–AM–DeepAR model performed better than other models in multi-step prediction. In long-term () prediction, all PICP metrics were 100% significantly higher than in the DeepAR model. This finding indicates that the MIDAS–AM–DeepAR model could accurately predict the fluctuation of future multi-period ANS, providing an effective means for early monitoring of abnormal states. Second, the AM–DeepAR model is close to the MIDAS–AM–DeepAR model in terms of PICP and PINAW metrics, with PICP in both models being 100%. PINAW only differed by approximately 10%. This result indicated that the AM–DeepAR model could only track the abnormal trend of abnormal changes in the ANS shifts, while its prediction error amplified owing to the loss of information once the external uncertainty increased. Lastly, the error between the DeepAR–MIDAS and the MIDAS–AM–DeepAR models increased significantly, with the difference in their PINAW values more than doubling. This finding showed that their ability to track the trend of abnormal changes in the ANS was significantly insufficient and their sensitivity to ANS fluctuations was low. In summary, the MIDAS–AM–DeepAR model was found to be a more reliable and robust prediction tool in uncertain environments with a generalization capacity for predicting e-commerce sales.
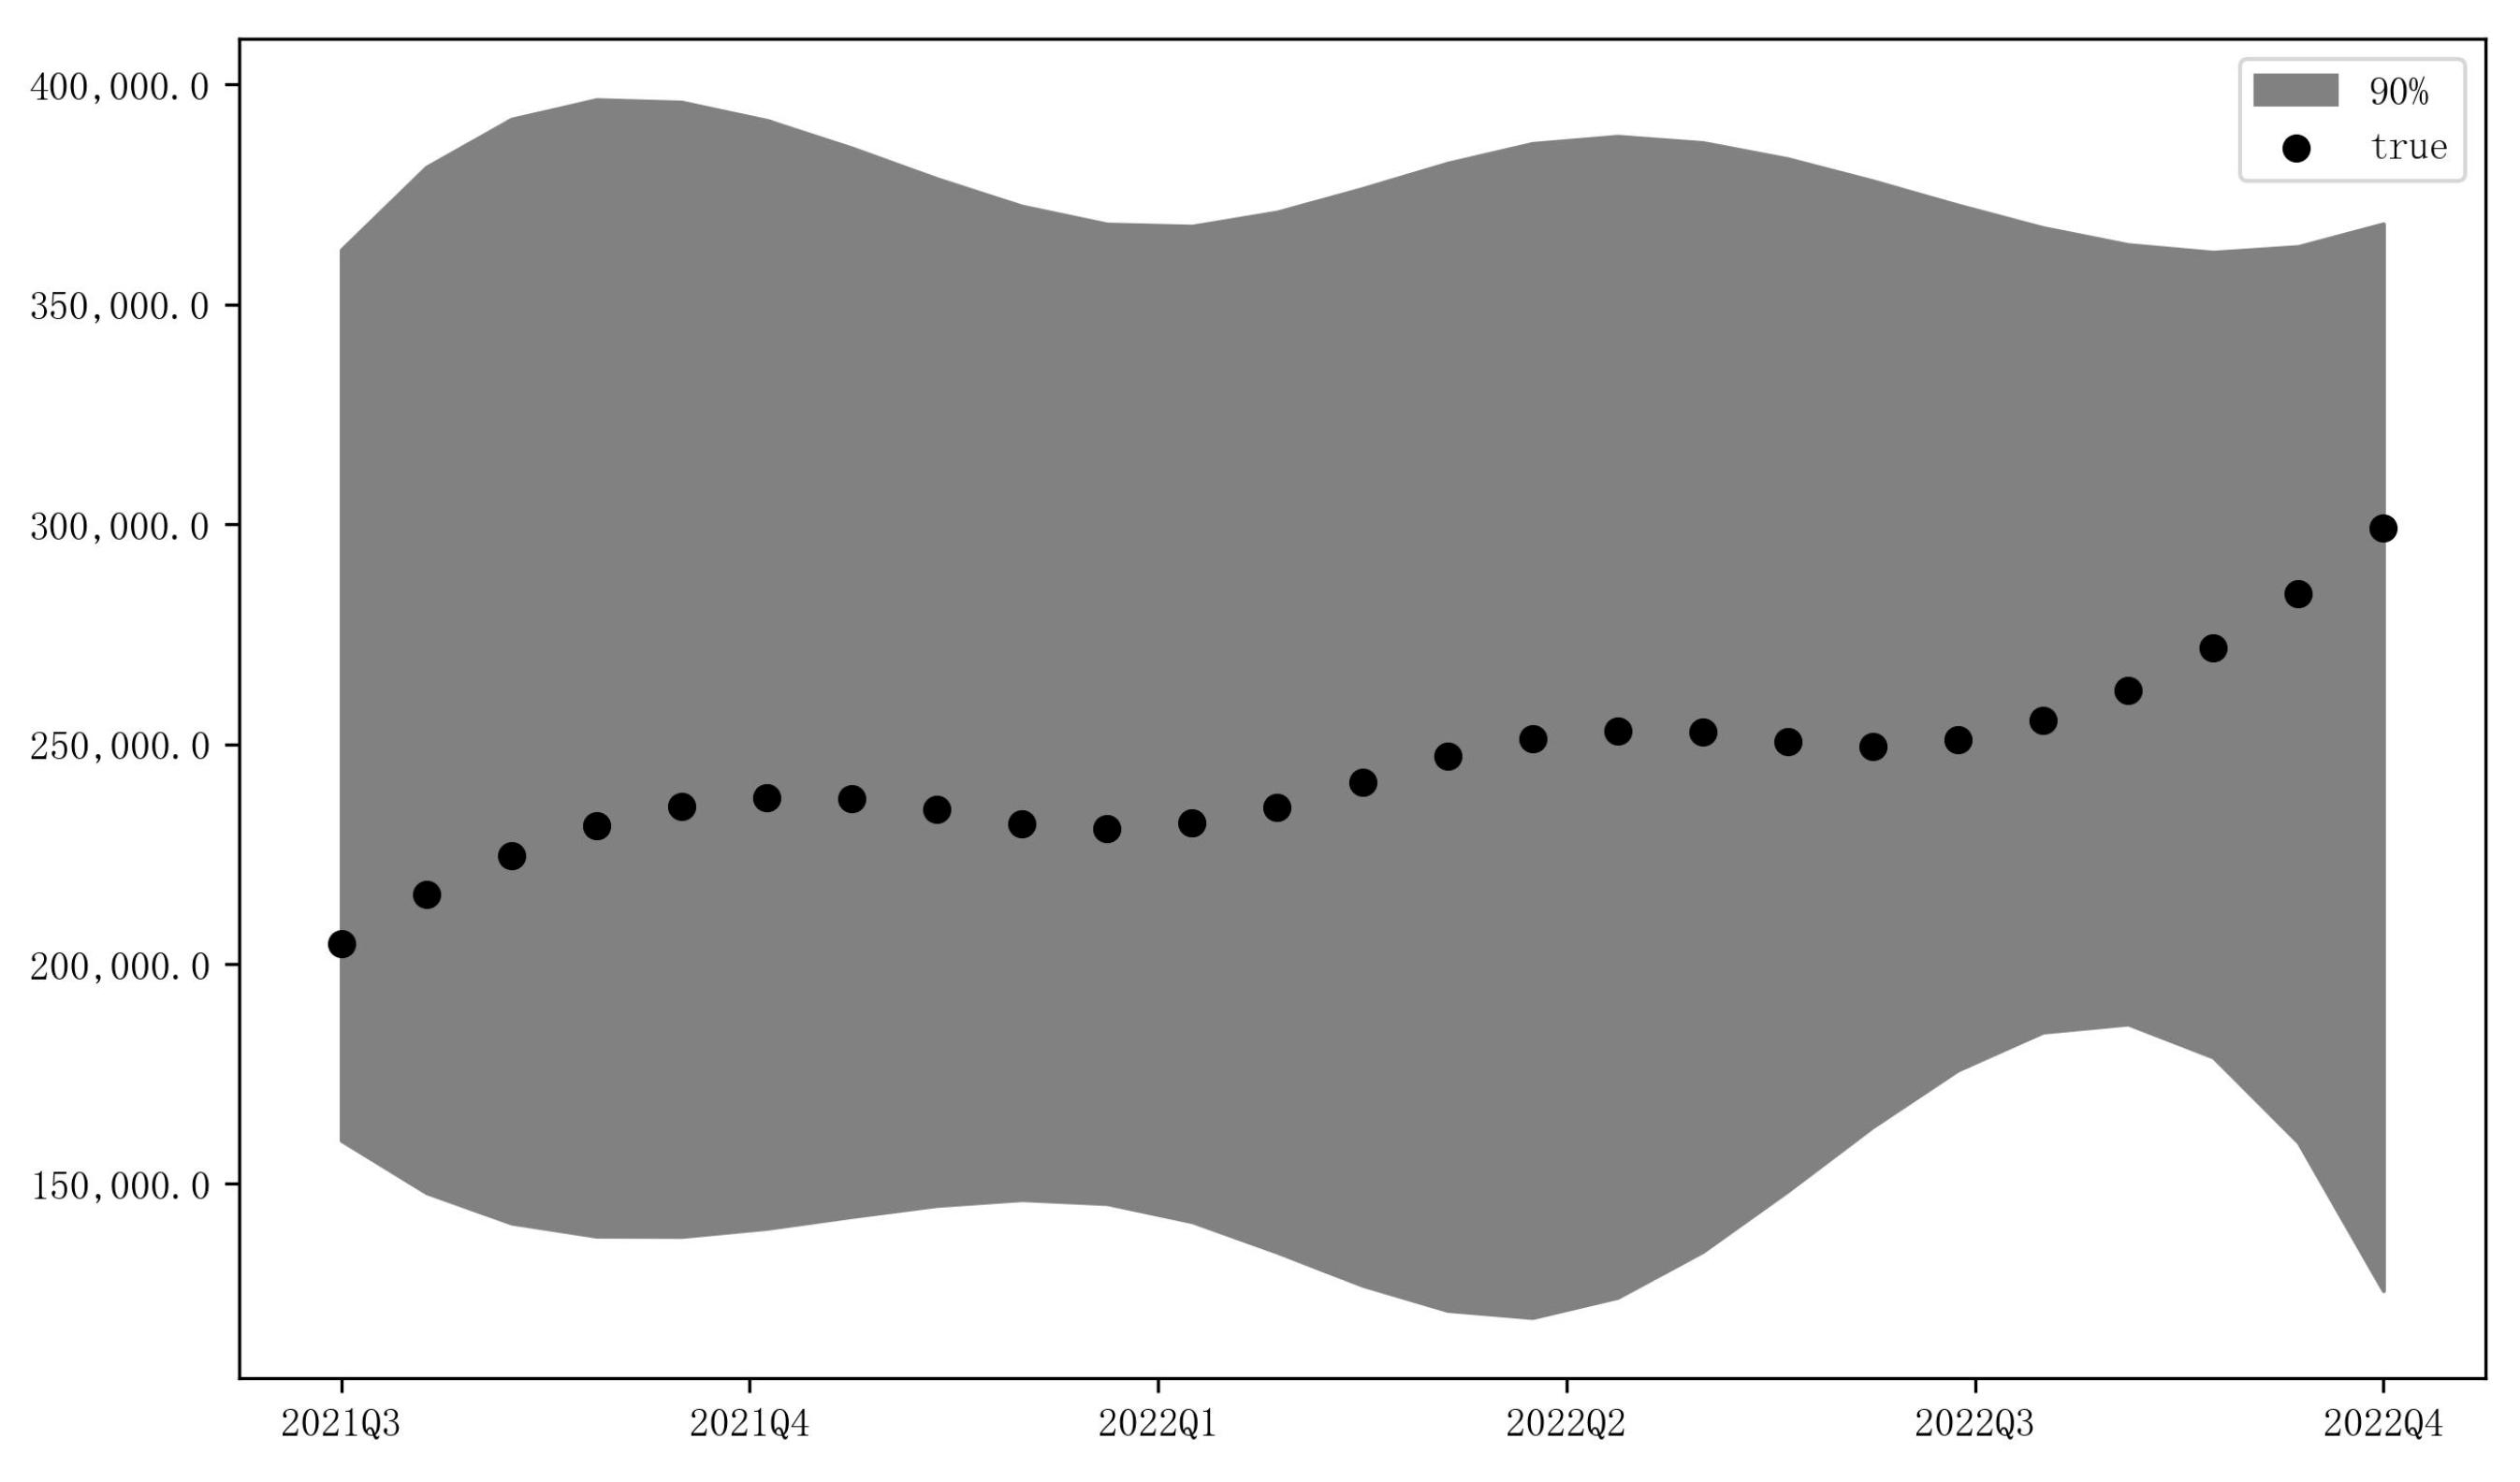
Figure 8 shows the forward prediction results of the US e-commerce sales from Q3 2021 to Q4 2022, presenting a visual depiction of the long-term predictive capacity of the MIDAS–AM–DeepAR model. As seen below, the actual values of the ANS were all within the 90% confidence interval of the MIDAS–AM–DeepAR model, indicating its capacity to capture normal and abnormal dynamics within the predicted range and manage shocks of external uncertainty.

Figure 8.
The U.S. A.N.S prediction based on the MIDAS–AM–DeepAR model from Q3 2021 to Q4 2022 ().
5.3. Prediction Results and Analysis between Models
This study used the Diebold and Mariano (DM) test to determine if there was a significant difference in out-of-sample prediction accuracy between the two models. The outputs in Table 6 corroborated that the MIDAS–AM–DeepAR model significantly outperformed the AM–DeepAR and DeepAR–MIDAS models at the 1% level of significance. Compared to the AM–DeepAR, the MIDAS–AM–DeepAR had better predictive ability. This finding confirmed that the frequency alignment and parameter constraint operations on mixed-frequency data focused on the effective information carried by high-frequency variables and improved model prediction accuracy compared with the DeepAR–MIDAS model. More so, the higher prediction accuracy of the MIDAS–AM–DeepAR model affirmed that using an AM (with a CNN filter) approach for feature selection captured more valuable influencing factors and enhanced the correlation between e-commerce sales data and time features.
Table 6.
DM test results.
6. Discussion and Conclusions
Following continuous infrastructure and technology improvement and strong policy support, e-commerce sectors in many countries have entered a rapid development stage, fully adapted to the current economic market. In congruence with the principles of sustainable development, this progress adds to the long-term sustainability of the e-commerce ecosystem, comprising social, technological, environmental, and economic dimensions. In response to its intermittent, uncertain, and non-linear operating trends in the e-commerce sector, this study proposes the MIDAS–AM–DeepAR model (based on mixed-frequency data) to enable sustainable, reliable, accurate, and generalizable prediction capacity. Such progress is critical to address uncertainty as inherent volatility, the dynamic nature of markets, and external stimulus impact e-commerce significantly. Using quarterly e-commerce sales data from the US as a sample, the MIDAS–AM–DeepAR model, evaluated from three dimensions, demonstrated a superior capacity than other competing models in capturing the operational and volatility trends of the industrial economy. In other words, the study has provided an initial, empirically proven prediction tool for future researchers, policymakers, and industrial decision-makers to estimate the scale, scope, and uncertainty of e-commerce sectors.
The empirical results and related conclusions of this study are as follows. First, the prediction accuracy results reflected that the MIDAS–AM–DeepAR model was more efficient and highly precise than other models in the long- and short-term predictions, as it efficiently captured the long- and short-term memory of industrial economic indicators in the sampled data. This result implied that the application of the proposed model could significantly enhance economic sustainability by offering policymakers and businesses a prediction instrument to gauge market trends promptly and ensure readiness to improve supply chains and resource management. Second, the prediction of inflection points based on industrial economic indicators shows that compared with the AM–DeepAR and DeepAR–MIDAS models, the proposed model had stronger self-adaptability and anti-interference ability in cohesion with MIDAS and AM (containing filters) approaches. Unlike prior models (cf. AM–DeepAR [82] and DeepAR–MIDAS [83]), this study focused on incorporating critical elements in the prediction model, e.g., variable importance and temporal sensitivity. The proposed model demonstrated robust performance in tracking abnormal changes in e-commerce sales and their fluctuation trends enable the smooth attainment of sustainable development. The empirical outputs of the current model confirmed that market and institution systems can align with the shifts and continue operating efficiently during uncertain times and economic, social, and environmental shocks. Third, the probability prediction results established that the MIDAS–AM–DeepAR model had higher probability density than other models as it computed industrial economic indicators more accurately and displayed a superior time correlation self-learning capacity. In this way, the proposed model added to the existing knowledge pool on market dynamics and could play a crucial role in designing policies and strategies that strengthen sustainable development by simultaneously balancing short- and long-term stability and benefits. Fourth, the DM test validated that the MIDAS–AM–DeepAR model was statistically better than the AM–DeepAR and DeepAR–MIDAS models at predicting industrial economic indicators. The inclusion of the MIDAS and AM approaches optimized the capacity of the proposed model in the following aspects: (i) maintaining the integrity of the original data structure, (ii) ensuring authenticity and integrity of information, (iii) mining hidden non-linear relationships between variables on mixed-frequency data, (iv) automatically perceiving the temporal weights of series, (v) capturing external disturbance factors in time, and (vi) performing multi-step forward probability predictions. The presence of all the above competencies directly supports sustainable decision-makers in the e-commerce industry by strengthening their ability to manage green supply chains from procurement to distribution. Fifth, the prediction of the transaction scale of the e-commerce industry confirmed the trajectory of sustainable development trends, providing decision-making support for the authorities to formulate industrial sustainability strategies and develop frameworks that encourage sustainable practices, legal compliance, and long-term vitality of markets in the e-commerce sector. In short, the dynamic capabilities of the MIDAS–AM–DeepAR model offer stakeholders and decision-makers a robust, data-driven tool to predict and address potential interruptions to foster an adaptive and resilient e-commerce ecosystem.
In summary, this study’s main contribution is to further enrich the DeepAR model by introducing the time AM with filters to enhance the original model’s sensitivity to abnormal macroeconomic fluctuations. Moreover, the incorporation of MIDAS maximizes the utilization and retention of effective information contained in high-frequency data. It has been confirmed that the MIDAS–AM–DeepAR model can predict the intermittent and uncertain operating trends of industrial economic indicators more accurately, thereby providing a reference for regulators to formulate sound economic policies. However, several limitations should be acknowledged. When handling positive correlations, the model’s weight distribution for positively correlated variables was uneven, indicating room for improvement. Although the DeepAR model with an attention mechanism can self-learn temporal associations, integrating external control variables can still be enhanced. Drawing on the approach of Kingma and Ba. [74], increasing the input dimensions and exploring the impact mechanism of feature quality on predictive performance can be beneficial. Additionally, the model was prone to error accumulation due to inconsistent input data distribution during the training and generation phases. According to the suggestion of Mihaylova and Martins [84], future research could explore techniques such as scheduled sampling to mitigate this problem. The analysis may also be limited by the availability and quality of historical e-commerce data, which can impact accuracy and reliability. Furthermore, the model assumptions might not fully capture the complexities of the e-commerce market, such as sudden market changes and variations in consumer behavior.
The findings of this study extend existing knowledge by demonstrating the effectiveness of the MIDAS–AM–DeepAR model in the e-commerce industry. Even though previous studies (cf. [58,60]) have shown the potential of mixed-frequency models, this study highlights its potential application and scope in the e-commerce sector. The model offers more precise predictions by integrating high-frequency data and a time AM, which can be invaluable for strategic decision-making in the e-commerce sector. By addressing these limitations and situating our findings within the broader academic context, this study contributes to the ongoing discourse on predictive modeling in e-commerce, providing a foundation for future research.
Author Contributions
F.H. investigation, conceptualization, methodology, software, writing original draft preparation; M.L. validation, formal analysis, writing review and editing, supervision, funding acquisition; S.I.K. validation, formal analysis, writing review and editing, supervision. All authors have read and agreed to the published version of the manuscript.
Funding
This research was funded by the Fujian Provincial Department of Education project: Research on the Deep Integration of Fujian Province’s Digital Economy and Real Economy Development, grant number JAS23049.
Institutional Review Board Statement
Not applicable.
Informed Consent Statement
Not applicable.
Data Availability Statement
The raw data supporting the conclusions of this article will be made available by the authors on request.
Conflicts of Interest
The authors declare no conflicts of interest.
References
- Xue, C.; Shahbaz, M.; Ahmed, Z.; Ahmad, M.; Sinha, A. Clean Energy Consumption, Economic Growth, and Environmental Sustainability: What Is the Role of Economic Policy Uncertainty? Renew. Energy 2022, 184, 899–907. [Google Scholar] [CrossRef]
- Caferra, R.; Falcone, P.M. From the “Age of Instability” to the “Age of Responsibility”: Economic Uncertainty and Sustainable Investments. J. Econ. Stud. 2023, 50, 1297–1316. [Google Scholar] [CrossRef]
- Ghatee, A.; Zarrinpoor, N. Designing an Oil Supply Chain Network Considering Sustainable Development Paradigm and Uncertainty. Chem. Eng. Res. Des. 2022, 184, 692–723. [Google Scholar] [CrossRef]
- Li, P.; Menon, M.; Liu, Z. Green Innovation under Uncertainty-a Dynamic Perspective. Int. J. Serv. Econ. Manag. 2019, 10, 68–88. [Google Scholar]
- Bai, D. Research on Sustainable Development Ecosystem of Rural E-Commerce Based on Ecological Perspective. Fresen. Environ. Bull. 2021, 30, 2700–2709. [Google Scholar]
- Jain, V.; Malviya, B.; Arya, S. An Overview of Electronic Commerce (e-Commerce). J. Contemp. Issues Bus. Gov. 2021, 27, 665–670. [Google Scholar]
- Goldstein, A.; O’Connor, D. E-Commerce for Development: Prospects and Policy Issues. In OECD Development Centre Working Papers; OECD Publishing: Paris, France, 2000. [Google Scholar]
- Mishra, R.; Singh, R.K.; Koles, B. Consumer Decision-Making in Omnichannel Retailing: Literature Review and Future Research Agenda. Int. J. Consum. Stud. 2021, 45, 147–174. [Google Scholar] [CrossRef]
- Salamai, A.A.; Ageeli, A.A.; El-Kenawy, E. Forecasting E-Commerce Adoption Based on Bidirectional Recurrent Neural Networks. Comput. Mater. Contin. 2022, 70, 5091–5106. [Google Scholar] [CrossRef]
- Suma, V.; Hills, S.M. Data Mining Based Prediction of Demand in Indian Market for Refurbished Electronics. J. Soft Comput. 2020, 2, 101–110. [Google Scholar]
- Bag, S.; Gupta, S.; Kumar, A.; Sivarajah, U. An Integrated Artificial Intelligence Framework for Knowledge Creation and B2B Marketing Rational Decision Making for Improving Firm Performance. Ind. Mark. Manag. 2021, 92, 178–189. [Google Scholar] [CrossRef]
- Modgil, S.; Gupta, S.; Sivarajah, U.; Bhushan, B. Big Data-Enabled Large-Scale Group Decision Making for Circular Economy: An Emerging Market Context. Technol. Forecast. Soc. Chang. 2021, 166, 120607. [Google Scholar] [CrossRef]
- Shrestha, Y.R.; Krishna, V.; von Krogh, G. Augmenting Organizational Decision-Making with Deep Learning Algorithms: Principles, Promises, and Challenges. J. Bus. Res. 2021, 123, 588–603. [Google Scholar] [CrossRef]
- Reinhart, C.M.; Rogoff, K.S. Is the 2007 US Sub-Prime Financial Crisis so Different? An International Historical Comparison. Am. Econ. Rev. 2008, 98, 339–344. [Google Scholar] [CrossRef]
- Hu, C.; Wang, C.; Luo, Y.; Zheng, C. Green Financing and Technological Innovation Influence on E-Commerce Industry Green Environment. Environ. Sci. Pollut. Res. 2023, 30, 104886–104900. [Google Scholar] [CrossRef]
- Haddad, V.; Moreira, A.; Muir, T. When Selling Becomes Viral: Disruptions in Debt Markets in the COVID-19 Crisis and the Fed’s Response. Rev. Financ. Stud. 2021, 34, 5309–5351. [Google Scholar] [CrossRef]
- Wang, C. Analyzing the Effects of Cross-Border E-Commerce Industry Transfer Using Big Data. Mob. Inf. Syst. 2021, 2021, 9916304. [Google Scholar] [CrossRef]
- Li, M.; Ji, S.; Liu, G. Forecasting of Chinese E-Commerce Sales: An Empirical Comparison of ARIMA, Nonlinear Autoregressive Neural Network, and a Combined ARIMA-NARNN Model. Math. Probl. Eng. 2018, 2018, 6924960. [Google Scholar] [CrossRef]
- Safa, N.S.; Ghani, N.A.; Ismail, M.A. An Artificial Neural Network Classification Approach for Improving Accuracy of Customer Identification in E-Commerce. Malays. J. Comput. Sci. 2014, 27, 171–185. [Google Scholar]
- Fahmy, H. How Technological Emergence, Saturation, and Rejuvenation Are Re-Shaping the e-Commerce Landscape and Disrupting Consumption? A Time Series Analysis. Appl. Econ. 2021, 53, 742–759. [Google Scholar] [CrossRef]
- Niu, Y.; Ying, L.; Yang, J.; Bao, M.; Sivaparthipan, C. Organizational Business Intelligence and Decision Making Using Big Data Analytics. Inf. Process. Manag. 2021, 58, 102725. [Google Scholar] [CrossRef]
- Xin-Ying, W.; Min, H. Multivariate Chaotic Time Series Prediction Using Multiple Kernel Extreme Learning Machine. Acta Phys. Sin. 2015, 64, 070504. [Google Scholar] [CrossRef]
- Pan, H.; Zhou, H. Study on Convolutional Neural Network and Its Application in Data Mining and Sales Forecasting for E-Commerce. Electron. Commer. Res. 2020, 20, 297–320. [Google Scholar] [CrossRef]
- Zhang, Y. Application of Improved BP Neural Network Based on E-Commerce Supply Chain Network Data in the Forecast of Aquatic Product Export Volume. Cogn. Syst. Res. 2019, 57, 228–235. [Google Scholar] [CrossRef]
- Haryanti, T.; Subriadi, A.P. Factors and Theories for E-Commerce Adoption: A Literature Review. Int. J. Electron. Commer. Stud. 2020, 11, 87–106. [Google Scholar]
- Malone, T.W.; Yates, J.; Benjamin, R.I. Electronic Markets and Electronic Hierarchies. Commun. ACM 1987, 30, 484–497. [Google Scholar] [CrossRef]
- Akter, S.; Wamba, S.F. Big Data Analytics in E-Commerce: A Systematic Review and Agenda for Future Research. Electron. Mark. 2016, 26, 173–194. [Google Scholar] [CrossRef]
- Schlaile, M.P.; Urmetzer, S.; Blok, V.; Andersen, A.D.; Timmermans, J.; Mueller, M.; Fagerberg, J.; Pyka, A. Innovation Systems for Transformations towards Sustainability? Taking the Normative Dimension Seriously. Sustainability 2017, 9, 2253. [Google Scholar] [CrossRef]
- Ignatov, A. The Digital Economy of BRICS: Prospects for Multilateral Cooperation. Int. Organ. Res. J. 2020, 15, 31–62. [Google Scholar] [CrossRef]
- Xu, G.; Lu, T.; Liu, Y. Symmetric Reciprocal Symbiosis Mode of China’s Digital Economy and Real Economy Based on the Logistic Model. Symmetry 2021, 13, 1136. [Google Scholar] [CrossRef]
- Revinova, S. E-Commerce in BRICS: Similarities and Differences. Int. J. Econ. Policy Emerg. Econ. 2019, 12, 377–390. [Google Scholar] [CrossRef]
- Leung, K.H.; Mo, D.Y.; Ho, G.T.; Wu, C.-H.; Huang, G.Q. Modelling Near-Real-Time Order Arrival Demand in e-Commerce Context: A Machine Learning Predictive Methodology. Ind. Manag. Data Syst. 2020, 120, 1149–1174. [Google Scholar] [CrossRef]
- Tan, J.; Ludwig, S. Regional Adoption of Business-to-Business Electronic Commerce in China: Role of e-Readiness. Int. J. Electron. Commer. 2016, 20, 408–439. [Google Scholar] [CrossRef]
- Javanmardi, E.; Liu, S.; Xie, N. Exploring the Challenges to Sustainable Development from the Perspective of Grey Systems Theory. Systems 2023, 11, 70. [Google Scholar] [CrossRef]
- Qidi, J. Research on Influencing Factors of Retail Sales in E-Commerce Market. In Proceedings of the 2021 2nd International Conference on E-Commerce and Internet Technology (ECIT), Hangzhou, China, 5–7 March 2021; pp. 16–19. [Google Scholar]
- Liu, C.-J.; Huang, T.-S.; Ho, P.-T.; Huang, J.-C.; Hsieh, C.-T. Machine Learning-Based E-Commerce Platform Repurchase Customer Prediction Model. PLoS ONE 2020, 15, e0243105. [Google Scholar] [CrossRef] [PubMed]
- Feng, Y. Green Progress of Cross-Border E-Commerce Industry Utilizing Random Forest Algorithm and Panel Tobit Model. Appl. Artif. Intell. 2023, 37, 2219561. [Google Scholar] [CrossRef]
- Peng, X.; Li, X.; Yang, X. Analysis of Circular Economy of E-Commerce Market Based on Grey Model under the Background of Big Data. J. Enterp. Inf. Manag. 2022, 35, 1148–1167. [Google Scholar] [CrossRef]
- Jia, R.; Li, R.; Yu, M.; Wang, S. E-Commerce Purchase Prediction Approach by User Behavior Data. In Proceedings of the 2017 International Conference on Computer, Information and Telecommunication Systems (CITS), Dalian, China, 21–23 July 2017; pp. 1–5. [Google Scholar]
- Suglia, A.; Greco, C.; Musto, C.; De Gemmis, M.; Lops, P.; Semeraro, G. A Deep Architecture for Content-Based Recommendations Exploiting Recurrent Neural Networks. In Proceedings of the 25th Conference on User Modeling, Adaptation, and Personalization, Bratislava, Slovakia, 9–12 July 2017; pp. 202–211. [Google Scholar]
- Feng, X.; Zeng, Y. Joint Deep Modeling of Rating Matrix and Reviews for Recommendation. Chin. J. Comput. 2020, 43, 884–900. [Google Scholar]
- Gordini, N.; Veglio, V. Customers Churn Prediction and Marketing Retention Strategies. An Application of Support Vector Machines Based on the AUC Parameter-Selection Technique in B2B e-Commerce Industry. Ind. Mark. Manag. 2017, 62, 100–107. [Google Scholar] [CrossRef]
- Kauffmann, E.; Peral, J.; Gil, D.; Ferrández, A.; Sellers, R.; Mora, H. A Framework for Big Data Analytics in Commercial Social Networks: A Case Study on Sentiment Analysis and Fake Review Detection for Marketing Decision-Making. Ind. Mark. Manag. 2020, 90, 523–537. [Google Scholar] [CrossRef]
- Karthik, R.; Ganapathy, S. A Fuzzy Recommendation System for Predicting the Customers Interests Using Sentiment Analysis and Ontology in E-Commerce. Appl. Soft Comput. 2021, 108, 107396. [Google Scholar] [CrossRef]
- Babii, A.; Ghysels, E.; Striaukas, J. Machine Learning Time Series Regressions with an Application to Nowcasting. J. Bus. Econ. Stat. 2022, 40, 1094–1106. [Google Scholar] [CrossRef]
- Zhang, Q.; Wang, J.; Huang, H.; Huang, X.; Gong, Y. Hashtag Recommendation for Multimodal Microblog Using Co-Attention Network. In Proceedings of the International Joint Conference on Artificial Intelligence (IJCAI), Melbourne, Australia, 9–25 August 2017; pp. 3420–3426. [Google Scholar]
- Yuan, J.; Li, Z.; Zou, P.; Gao, X.; Pan, J.; Ji, W.; Wang, X. Community Trend Prediction on Heterogeneous Graph in E-Commerce. In Proceedings of the Fifteenth ACM International Conference on Web Search and Data Mining, Tempe, AZ, USA, 21–25 February 2022; pp. 1319–1327. [Google Scholar]
- Fathalla, A.; Salah, A.; Li, K.; Li, K.; Francesco, P. Deep End-to-End Learning for Price Prediction of Second-Hand Items. Knowl. Inf. Syst. 2020, 62, 4541–4568. [Google Scholar] [CrossRef]
- Zhao, Y. Risk Prediction for Internet Financial Enterprises by Deep Learning Algorithm and Sustainable Development of Business Transformation. J. Glob. Inf. Manag. 2021, 30, 1–16. [Google Scholar] [CrossRef]
- Yu, M.; Liu, T.; Guan, Z.; Sun, Y.; Guo, J.; Chen, L.; He, Y. SALSTM: An Improved LSTM Algorithm for Predicting the Competitiveness of Export Products. Int. J. Intell. Syst. 2022, 37, 6185–6200. [Google Scholar] [CrossRef]
- Su, X.; Zeng, L.; Shao, B.; Lin, B. Data-Driven Optimization for Production Planning with Multiple Demand Features. J. Kybernetes, 2023; ahead-of-print. [Google Scholar]
- Andreou, E.; Ghysels, E.; Kourtellos, A. Regression Models with Mixed Sampling Frequencies. J. Econom. 2010, 158, 246–261. [Google Scholar] [CrossRef]
- Guérin, P.; Marcellino, M. Markov-Switching MIDAS Models. J. Bus. Econ. Stat. 2013, 31, 45–56. [Google Scholar] [CrossRef]
- Asimakopoulos, S.; Paredes, J.; Warmedinger, T. Forecasting Fiscal Time Series Using Mixed Frequency Data. In ECB Working Paper; European Central Bank: Frankfurt, Germany, 2013. [Google Scholar]
- Ghysels, E.; Santa-Clara, P.; Valkanov, R. Predicting Volatility: Getting the Most out of Return Data Sampled at Different Frequencies. J. Econom. 2006, 131, 59–95. [Google Scholar] [CrossRef]
- Andreou, E.; Gagliardini, P.; Ghysels, E.; Rubin, M. Mixed-Frequency Macro-Finance Factor Models: Theory and Applications. J. Financ. Econom. 2020, 18, 585–628. [Google Scholar] [CrossRef]
- Qifa, X.; Liu, S.; Jiang, C. Conditional Bias Portfolio Investment Decision Based on MIDAS Quantile Regression. China Manag. Sci. 2021, 24–36. [Google Scholar]
- Guo, Y.; Li, P.; Wu, H. Jumps in the Chinese Crude Oil Futures Volatility Forecasting: New Evidence. Energy Econ. 2023, 126, 106955. [Google Scholar] [CrossRef]
- Götz, T.B.; Hecq, A.; Smeekes, S. Testing for Granger Causality in Large Mixed-Frequency VARs. J. Econom. 2016, 193, 418–432. [Google Scholar] [CrossRef]
- Xu, Q.; Zhuo, X.; Jiang, C.; Liu, Y. An Artificial Neural Network for Mixed Frequency Data. Expert Syst. Appl. 2019, 118, 127–139. [Google Scholar] [CrossRef]
- Clements, M.P.; Galvão, A.B. Macroeconomic Forecasting with Mixed-Frequency Data: Forecasting Output Growth in the United States. J. Bus. Econ. Stat. 2008, 26, 546–554. [Google Scholar] [CrossRef]
- Jardet, C.; Meunier, B. Nowcasting World GDP Growth with High-Frequency Data. J. Forecast. 2022, 41, 1181–1200. [Google Scholar] [CrossRef]
- Vaswani, A.; Shazeer, N.; Parmar, N.; Uszkoreit, J.; Jones, L.; Gomez, A.N.; Kaiser, Ł.; Polosukhin, I. Attention Is All You Need. In Proceedings of the 31st Conference on Neural Information Processing Systems (NIPS 2017), Long Beach, CA, USA, 4–9 December 2017; pp. 1–15. [Google Scholar]
- Qinglin, Z.; Bin, L.; Ruifeng, X.; Yuhan, L.; Yi, C.; Ruibin, M. Fine-Grained Sentiment Analysis Combining Sentiment Lexicon and Attention Mechanism in Financial Domain. Chin. J. Inf. 2022, 36, 109–117. [Google Scholar]
- Salinas, D.; Flunkert, V.; Gasthaus, J.; Januschowski, T. DeepAR: Probabilistic Forecasting with Autoregressive Recurrent Networks. Int. J. Forecast. 2020, 36, 1181–1191. [Google Scholar] [CrossRef]
- Ghysels, E.; Sinko, A.; Valkanov, R. MIDAS Regressions: Further Results and New Directions. Econom. Rev. 2007, 26, 53–90. [Google Scholar] [CrossRef]
- Niu, Z.; Zhong, G.; Yu, H. A Review on the Attention Mechanism of Deep Learning. Neurocomputing 2021, 452, 48–62. [Google Scholar] [CrossRef]
- Shih, S.-Y.; Sun, F.-K.; Lee, H. Temporal Pattern Attention for Multivariate Time Series Forecasting. Mach. Learn. 2019, 108, 1421–1441. [Google Scholar] [CrossRef]
- Gagliardini, P.; Ghysels, E.; Rubin, M. Indirect Inference Estimation of Mixed Frequency Stochastic Volatility State Space Models Using MIDAS Regressions and ARCH Models. J. Financ. Econom. 2017, 15, 509–560. [Google Scholar] [CrossRef]
- Yu, Y.; Si, X.; Hu, C.; Zhang, J. A Review of Recurrent Neural Networks: LSTM Cells and Network Architectures. Neural Comput. 2019, 31, 1235–1270. [Google Scholar] [CrossRef]
- Bangwayo-Skeete, P.F.; Skeete, R.W. Can Google Data Improve the Forecasting Performance of Tourist Arrivals? Mixed-Data Sampling Approach. Tour. Manag. 2015, 46, 454–464. [Google Scholar] [CrossRef]
- Xu, Q.; Liu, S.; Jiang, C.; Zhuo, X. QRNN-MIDAS: A Novel Quantile Regression Neural Network for Mixed Sampling Frequency Data. Neurocomputing 2021, 457, 84–105. [Google Scholar] [CrossRef]
- Silver, E.A.; Pyke, D.F.; Thomas, D.J. Inventory and Production Management in Supply Chains; CRC Press: Boca Raton, FL, USA, 2016; ISBN 978-1-4665-5861-8. [Google Scholar]
- Kingma, D.P.; Ba, J. Adam: A Method for Stochastic Optimization. arXiv 2014, arXiv:1412.6980. [Google Scholar] [CrossRef]
- Jurado, K.; Ludvigson, S.C.; Ng, S. Measuring Uncertainty. Am. Econ. Rev. 2015, 105, 1177–1216. [Google Scholar] [CrossRef]
- Xu, Q.; Niu, X.; Jiang, C.; Huang, X. The Phillips Curve in the US: A Nonlinear Quantile Regression Approach. Econ. Model. 2015, 49, 186–197. [Google Scholar] [CrossRef]
- Li, Y.; Yang, Y.; Zhu, K.; Zhang, J. Clothing Sale Forecasting by a Composite GRU–Prophet Model with an Attention Mechanism. IEEE Trans. Ind. Inform. 2021, 17, 8335–8344. [Google Scholar] [CrossRef]
- Dellino, G.; Laudadio, T.; Mari, R.; Mastronardi, N.; Meloni, C. Microforecasting Methods for Fresh Food Supply Chain Management: A Computational Study. Math. Comput. Simul. 2018, 147, 100–120. [Google Scholar] [CrossRef]
- Pedro, H.T.; Coimbra, C.F.; David, M.; Lauret, P. Assessment of Machine Learning Techniques for Deterministic and Probabilistic Intra-Hour Solar Forecasts. Renew. Energy 2018, 123, 191–203. [Google Scholar] [CrossRef]
- Harvey, D.; Leybourne, S.; Newbold, P. Testing the Equality of Prediction Mean Squared Errors. Int. J. Forecast. 1997, 13, 281–291. [Google Scholar] [CrossRef]
- Diebold, F.X.; Mariano, R.S. Comparing Predictive Accuracy. J. Bus. Econ. Stat. 2002, 20, 134–144. [Google Scholar] [CrossRef]
- Wang, T.; Zheng, Z.; Wang, P.; Liu, X. Research on System Economic Operation and Management Based on Deep Learning. Sci. Program. 2022, 2022, 4845014. [Google Scholar]
- Xu, Q.; Wang, Z.; Jiang, C.; Liu, Y. Deep Learning on Mixed Frequency Data. J. Forecast. 2023, 42, 2099–2120. [Google Scholar] [CrossRef]
- Mihaylova, T.; Martins, A.F. Scheduled Sampling for Transformers. arXiv 2019, arXiv:1906.07651. [Google Scholar] [CrossRef]
Disclaimer/Publisher’s Note: The statements, opinions and data contained in all publications are solely those of the individual author(s) and contributor(s) and not of MDPI and/or the editor(s). MDPI and/or the editor(s) disclaim responsibility for any injury to people or property resulting from any ideas, methods, instructions or products referred to in the content. |
© 2024 by the authors. Licensee MDPI, Basel, Switzerland. This article is an open access article distributed under the terms and conditions of the Creative Commons Attribution (CC BY) license (https://creativecommons.org/licenses/by/4.0/).