Abstract
Industrial park (IP) development has passed through many stages, and the development evolution pathways of IPs have different characteristics according to different perspectives. Understanding the evolutionary characteristics of IPs will assist us in understanding their essential developmental trajectories. Achieving carbon neutrality in IPs is important for combating climate change. In order to reveal the evolutionary characteristics of IPs from a carbon neutrality perspective, this study examines the Kalundborg eco-industrial park by dividing its development into three stages. We also quantitatively analyze this evolution based on enterprise connectance and enterprise repetitive connectance. We then analyze the evolutionary characteristics at the national level by using China and South Korea as examples. The results showed that the development trajectories of IPs had spontaneous and conscious characteristics. Compared with the spontaneous stage, enterprise connectance and enterprise repetitive connectance were obviously higher during the conscious stage. This article contributes to our understanding of the nature of IP development from a carbon neutrality perspective.
1. Introduction
The concept of an industrial park (IP) can be traced back to the “industrial district”, which refers to an industrial agglomeration area composed of a large number of related, specialized, small enterprises, as mentioned by Alfred Marshall in the Principles of Economics. With the process of industrialization, IP forms have also been constantly developed and improved [1,2]. Currently, IPs primarily refer to modern industrial parks (MIPs) since the mid-19th century. MIPs originated in the United States and initially emerged as a means of planning, organizing, and managing industrial development. With the development of industry, all the existing types of IPs in the world have become primary examples for the development of modern and high-tech industries. Essentially, the MIP development process can be roughly divided into three stages: the slow development stage (1951–1980), the rapid development stage (1981–1990), and the diffusion development stage (1991–present).
At the beginning of the 19th century, the rapid development of industry caused serious environmental problems, the most famous of which were eight major environmental pollution incidents. As the gathering place of industrial enterprises, IPs have become the primary sources of these environmental problems [3,4,5]. Subsequently, people gradually realized the importance of environmental protection and began to pay attention to environmental protection during the process of industrial development [6,7]. Environmental protection measures that were initially instituted were primarily end-of-pipe treatments, which can effectively reduce pollutant emissions but are not an optimal measure [8,9]. Since the eco-industrial system in Kalundborg was discovered in 1989 (detailed description in the Section 3), the development of IPs has entered a new mode called eco-industrial parks (EIPs) [10]. EIPs can not only realize pollutant emission reductions but also effectively improve resource utilization efficiency [11,12]. In the 21st century, combating climate change has become a major environmental problem faced by human beings [13]. In this context, the low-carbon development of IPs is particularly important.
The evolution of IPs refers to the change in the internal development logic and external mode of IPs. Understanding IP evolution not only clearly defines the nature of IP development but also promotes high-quality IP development. Based on the published literature, we found that many researchers have conducted much work regarding IP evolution, especially the evolution of EIP [14,15]. There are certain dynamic mechanisms on the formation and evolution of eco-industrial systems structure [16], and understanding these mechanisms is crucial for promoting the development of eco-industrial systems. Meanwhile, based on a process model of EIP evolution, IPs in different development stages can better replicate the successful experience of EIPs [15]. Yu et al. used the National Demonstration Eco-Industrial Park of China as a case study to research the evolution of industrial symbiosis and the construction of EIP and summarized the driving factors of industrial symbiosis evolution [17]. Korhonen and Snakin analyzed the evolution of industrial ecosystems from a conceptual and applied perspective and calculated some of the environmental effects of industrial symbiosis [18]. Cui et al. constructed a system dynamics model of industrial symbiosis, which provides a more intuitive representation of the evolutionary process of industrial symbiosis [19]. Behera et al. analyzed the evolution of “designed” industrial symbiosis networks and calculated the environmental and economic benefits [20]. In terms of policy and technology, the evolution of environmental policies is conducive to the sustainable development of IPs [21], and green innovative technologies play a crucial role in enabling IPs to achieve their carbon neutrality goals [22]. In addition, carbon neutrality pathways’ evolution of IPs has gradually become research hotspots [23,24].
These existing studies have revealed IP development trends and characteristics from different perspectives which mainly focus on the evolution of industrial symbiosis, EIPs, and environmental policies. In the context of global carbon neutrality goals, it is crucial for IPs to achieve carbon neutrality. However, IP evolutionary characteristics from the perspective of carbon neutrality (low-carbon development) have not been fully examined. In order to reveal the evolutionary characteristics of IPs from a carbon neutrality perspective, this study used the Kalundborg EIP as an example case. We then re-sorted all of the industrial symbiosis projects according to timeline. The evolution of the Kalundborg EIP was divided into three stages according to unconscious or conscious carbon emission reductions, and the evolutionary characteristics were quantitatively analyzed by calculating the enterprise connectance and enterprise repetitive connectance. Then, by using China and South Korea as example cases, we analyzed the IP evolutionary characteristics at the national level. This paper reveals the IP evolutionary characteristics from a carbon-neutral perspective that promotes an understanding of IP development history. With this additional information, we were able to propose great suggestions for low-carbon IP development. Meanwhile, this study provides important references for theoretical and practical research on IPs.
The structure of this article is as follows. We first introduce the methodology in Section 2. In Section 3, we analyze the IP evolutionary characteristics based on a case study of the Kalundborg EIP. In Section 4, we analyze the IP evolutionary characteristics viewed at the national level. In Section 5, we discuss the results. Finally, Section 6 presents our conclusions.
2. Methodology
2.1. Methods and Data Sources
What are the evolutionary characteristics of IPs from a carbon-neutral perspective? In order to reveal the evolutionary characteristics and promote industrial sustainable development, this study was carried out. Firstly, this study took Kalundborg EIP as a case and reconstructed the low-carbon development measures from a spontaneous and conscious perspective and then quantitatively analyzed the evolutionary characteristics in different stages based on two indicators of enterprise connectance and enterprise repetitive connectance. Secondly, the experience gained at one unit was taken and popularized in a whole area. Based on the evolutionary characteristics of Kalundborg EIP, the evolutionary characteristics of IPs from the perspective of carbon neutrality were analyzed at the national level (China and South Korea). Finally, the driving factors of low-carbon development in different stages were discussed, and the principles for IPs low-carbon development were proposed. The data utilized in this study are derived from the published literature and accessible websites, all of which are properly cited.
2.2. Calculation Method of Connectance
In natural ecosystems, the most essential relationships between organisms are realized through the food chain that consists of energy flows and material circulation. Similar to natural ecosystems, the relationships between enterprises in industrial ecosystems are achieved through industrial symbiosis chains that include the step utilization of energy and the exchange of water and materials. Therefore, industrial ecosystems and natural ecosystems have similar characteristics [25,26].
Biotic community connectance is defined as the ratio of the number of actual interactions to the number of potential interactions in a community and can be expressed using the following equation [27]:
where C is the biotic community connectance; L is the number of actual interactions; and S is the number of species in the community (species richness).
Analogous to biotic community connectance, the degree of connection between enterprises in IPs can be defined as the enterprise connectance and can be expressed using the following equation [28]:
where CP is the enterprise connectance; LP is the number of actual interactions among enterprises in the IP; and SP is the number of enterprises in the IP.
During the ecological development of IPs, there are multiple exchanges of substances and energy between enterprises. For example, plant A supplies steam and by-products to plant B, while plant B supplies recycled water and solid waste to plant A; that is, there are four exchanges of substances and energy between plant A and plant B. However, when calculating the enterprise connectance, regardless of how many actual substances and energy exchanges exist between plant A and plant B, LP is only counted as one. To solve this problem, we defined a new concept, the enterprise repetitive connectance, that is given by
where CPR is the enterprise repetitive connectance; LPR is the number of actual substances and energy exchanges; and SP is the number of enterprises in the IP.
From Equations (2) and (3), we see that the maximum value of the enterprise connectance is one, while in IPs with a high ecological degree, the enterprise repetitive connectance may be greater than one. At the IP level, the higher the enterprise connectance, the more enterprises are involved in substance and energy exchanges. The higher the enterprise repetitive connectance, the more types of actual substances and energy exchanges among the enterprises in the IP. By combining these two indicators, the ecological degree of an IP is clearly shown.
3. Evolutionary Characteristics of IPs Based on the Kalundborg EIP Case
3.1. Evolutionary Characteristics from Spontaneous to Conscious
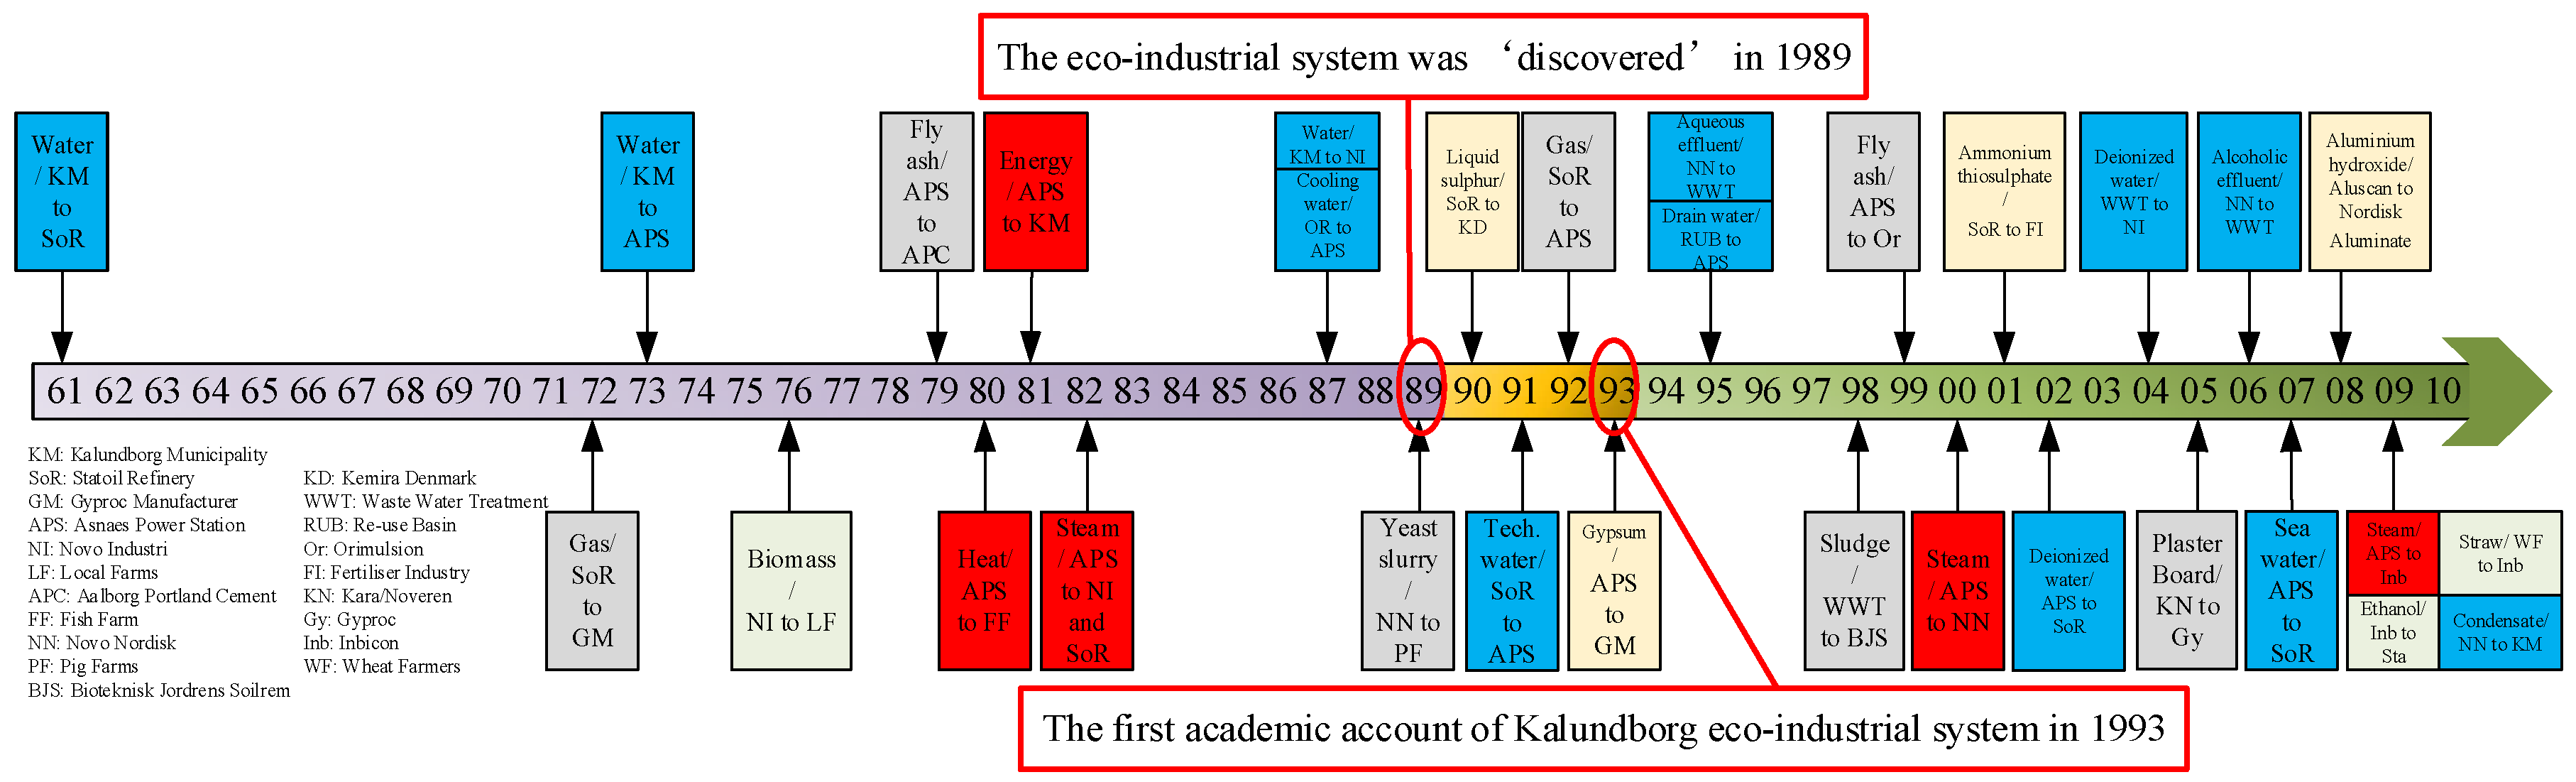
As the most typical EIP, the Kalundborg EIP has been regarded as a template for industrial symbiosis since being discovered in 1989 [10]. The exchange of materials, water, and energy among the enterprises has been gradually enriched since the establishment of the Kalundborg EIP [29]. From a carbon-neutral perspective, all of the exchanges of substances and energy of this industrial symbiosis project were re-sorted according to the developmental timeline (Figure 1). The environmental standard, pollutant discharge control, and other policy factors were combined, and then, the evolution of the Kalundborg EIP was divided into three stages: the spontaneous stage, the transition stage, and the conscious stage. Spontaneity and consciousness are two important concepts in philosophy. Spontaneity refers to a phenomenon or behavior that occurs naturally in nature or human society without the control of external forces, and it is typically unconscious, instinctive, or mechanical. Consciousness refers to behaviors or decisions where human beings utilize their own consciousness and thinking that is rational and autonomous. The behavioral motivations and decision-making processes are the primary differences between the concepts of spontaneity and consciousness. The evolutionary stages of the Kalundborg EIP involve similar distinctions from a carbon perspective.

Figure 1.
Industrial symbiosis project in Kalundborg EIP.
According to two important time nodes, 1989 (when the eco-industrial system was discovered) and 1993 (when the first academic account of the system was written), we classified the period before 1989 as the spontaneous stage (first stage), the period from 1990 to 1993 as the transition stage (second stage), and the period after 1994 as the conscious stage (third stage).
The first stage: the spontaneous stage (–1989)
The primary enterprises of the Kalundborg EIP are the following: the Asnaes Power Station, that was initially oil-fired and then transformed to become coal-fired after the first oil crisis; the Statoil Refinery, that is a large oil refinery operated by Statoil; Gyproc, which recycles waste gypsum; Novozymes and Novo Nordisk, that are the largest bioengineering companies and one of the manufacturers of industrial enzymes and insulin; and the municipality of Kalundborg, that supplies centralized water and wastewater treatment. Figure 1 shows that the earliest industrial symbiosis project was water exchange in 1961. A new project required water for processing and cooling, and Tisso Lake water was supplied to the Statoil Refinery by the municipality. Soon afterward, Gyproc used flare gas supplied by the Statoil Refinery as fuel for their production process in 1972. Since then, industrial symbiosis projects in Kalundborg gradually increased in number. From 1973 to 1989, over a period of 27 years, 10 symbiosis projects were added to the Kalundborg EIP, including cooperation with enterprises outside the EIP. These projects were as follows: surface water was supplied to Asnaes and Novozymes by the municipality; Novozymes supplied sludge to farms as fertilizer and yeast slurry to pig farms as feed; fly ash from Asnaes was transported to a cement factory in the United Kingdom (UK) for reuse; Asnaes supplied heat or steam to the fish farm, the municipality, Novozymes, and the Statoil Refinery; and cooling water was supplied to Asnaes by the Statoil Refinery.
Prior to the discovery of the Kalundborg industrial symbiosis in 1989, the EIP had never made any plans for low-carbon development, and without government involvement, all of the symbiosis projects were conducted spontaneously by the enterprises [30]. By analyzing the original intention of these projects, it was found that during the spontaneous stage, the driving factors of industrial symbiosis were primarily resource demand, economic benefits, and specific policies and standards. (1) Resource demand: Due to a lack of groundwater resources, Statoil Refinery, Asnaes, and Novozymes used lake water through the municipality of Kalundborg when they expanded their production [29]. (2) Economic benefits: To reduce costs, Gyproc purchased low-priced flare gas from the Statoil Refinery as fuel for production. For the same reason, the fish farm, the municipality, the Statoil Refinery, and Novozymes used steam from Asnaes rather than producing it themselves. By selling yeast slurry to pig farms, Novo Nordisk not only reduced treatment costs but also received additional revenue [31]. (3) Specific policies and standards: Prior to 1979, fly ash from Asnaes was directly dumped. By 1979, Asnaes required more space for dumping, but it was difficult to obtain governmental permission. After an investigation, the director of Asnaes decided to transport fly ash to a cement plant in the UK for recycling. Novo Nordisk was prevented by the government from dumping sludge into the sea, so they began to supply sludge as fertilizer to local farms [10].
The second stage: the transition stage (1990–1993)
Since the Kalundborg industrial symbiosis was discovered in 1989, it gradually entered people’s vision, especially attracting the attention of economists. In 1993, Engberg wrote the first academic account, the Industrial Symbiosis in Denmark, of the Kalundborg eco-industrial system [10]. Since then, the industrial symbiosis system in Kalundborg has attracted more attention [29,32,33]. There were four symbiosis projects that were implemented during the transition stage. In 1990, the Statoil Refinery began to supply liquid sulfur to Kemira Denmark, a fertilizer plant in Fredericia, Jutland. However, with the development of new technology, liquid sulfur was replaced by ammonium thiosulfate due to the greater economic benefits. In terms of waste exchange, technical water from the Statoil Refinery was recycled by Asnaes to reduce the utilization of fresh water in 1991. In 1992, Asnaes purchased the flare gas from the Statoil Refinery as fuel for production, but this ended in 1997 due to an erratic supply. By analyzing the two waste exchanges, we found that the driving factor was resource demand. In 1993, because environmental legislation restricted the release of sulfur-containing compounds into the atmosphere, Asnaes deliberately chose a sulfur-removal system to produce a new product, gypsum, that could be supplied to gypsum manufacturers.
The third stage: the conscious stage (1994–)
After 1993, the Kalundborg industrial symbiosis had been examined in several research papers [34,35,36], and as the most typical eco-industrial system, its important position in the field of industrial ecology was gradually established. From then on, the evolution of the Kalundborg EIP had entered an organized and planned stage, termed the conscious stage. In 1996, a coordinating organization, the Symbiosis Institute, was launched; its aim was to plan and accelerate the creation of new symbiosis projects.
Since then, an increasing number of scholars had begun to visit Kalundborg to investigate and survey the industrial symbiosis model. To manage international delegations visiting the Kalundborg symbiosis network, the symbiosis partners established a visitor service in 1996.
The planning and establishment of the initial industrial symbiosis were jointly conducted by three large enterprises, Asnaes, Novozymes, and the Statoil Refinery, because they were familiar with each other. The level of trust that existed among the three enterprises was an important factor because it facilitated the development of the symbiosis network that then served as a baseline for agreement among the partners. After formulating the industrial symbiosis plan, a series of symbiosis projects were conducted.
Shortly afterward, in order to create sustainable development in member companies through joint projects, a membership association company, the Kalundborg Symbiosis, was registered in the Kalundborg municipality. The company wanted to achieve its vision of becoming the world’s leading industrial symbiosis project by disseminating knowledge on industrial symbiosis, promoting new symbiotic cooperation, and demonstrating social–environmental–economic values.
As of 2009, 14 projects were implemented during the conscious stage that included exchanges of water, energy, solid waste, and by-products. These projects were as follows: (1) the municipality of Kalundborg supplied deionized water and received all types of sewage from the other enterprises; (2) Soilrem recycled sludge from the wastewater treatment plant (municipality) for contaminated soil bioremediation; (3) seawater was supplied by Asnaes to the Statoil Refinery; (4) Asnaes supplied steam to Inbicon; (5) Inbicon recycled straw for ethanol production; and (6) Inbicon supplied ethanol to Asnaes as a gasoline additive.
In addition to the establishment of companies and the Symbiosis Institute, the regulatory context in Kalundborg also greatly promoted industrial symbiosis. Compared with the traditional industrial symbiosis model, further industrial symbiosis that produced beneficial environmental benefits was bound to lead to higher costs. Therefore, political promotion was essential if symbiosis in IPs was to be pursued [37]. The regulatory context of Denmark was conducive to the development of industrial symbiosis, and its regulatory system was flexible, consultative, and open. In addition, companies needed to submit detailed plans to the government that regulated their efforts to reduce their environmental impact, and this promoted the development of symbiotic projects among enterprises [29].
As the most typical case of industrial symbiosis, the Kalundborg EIP, after conscious development, achieved not only economic benefits but also great environmental benefits every year, saving 4 million m3 of groundwater by using lake water, reducing 586,000 tons of CO2 emissions, and recycling 62,000 tons of solid waste.
3.2. Comparison of the Different Stages
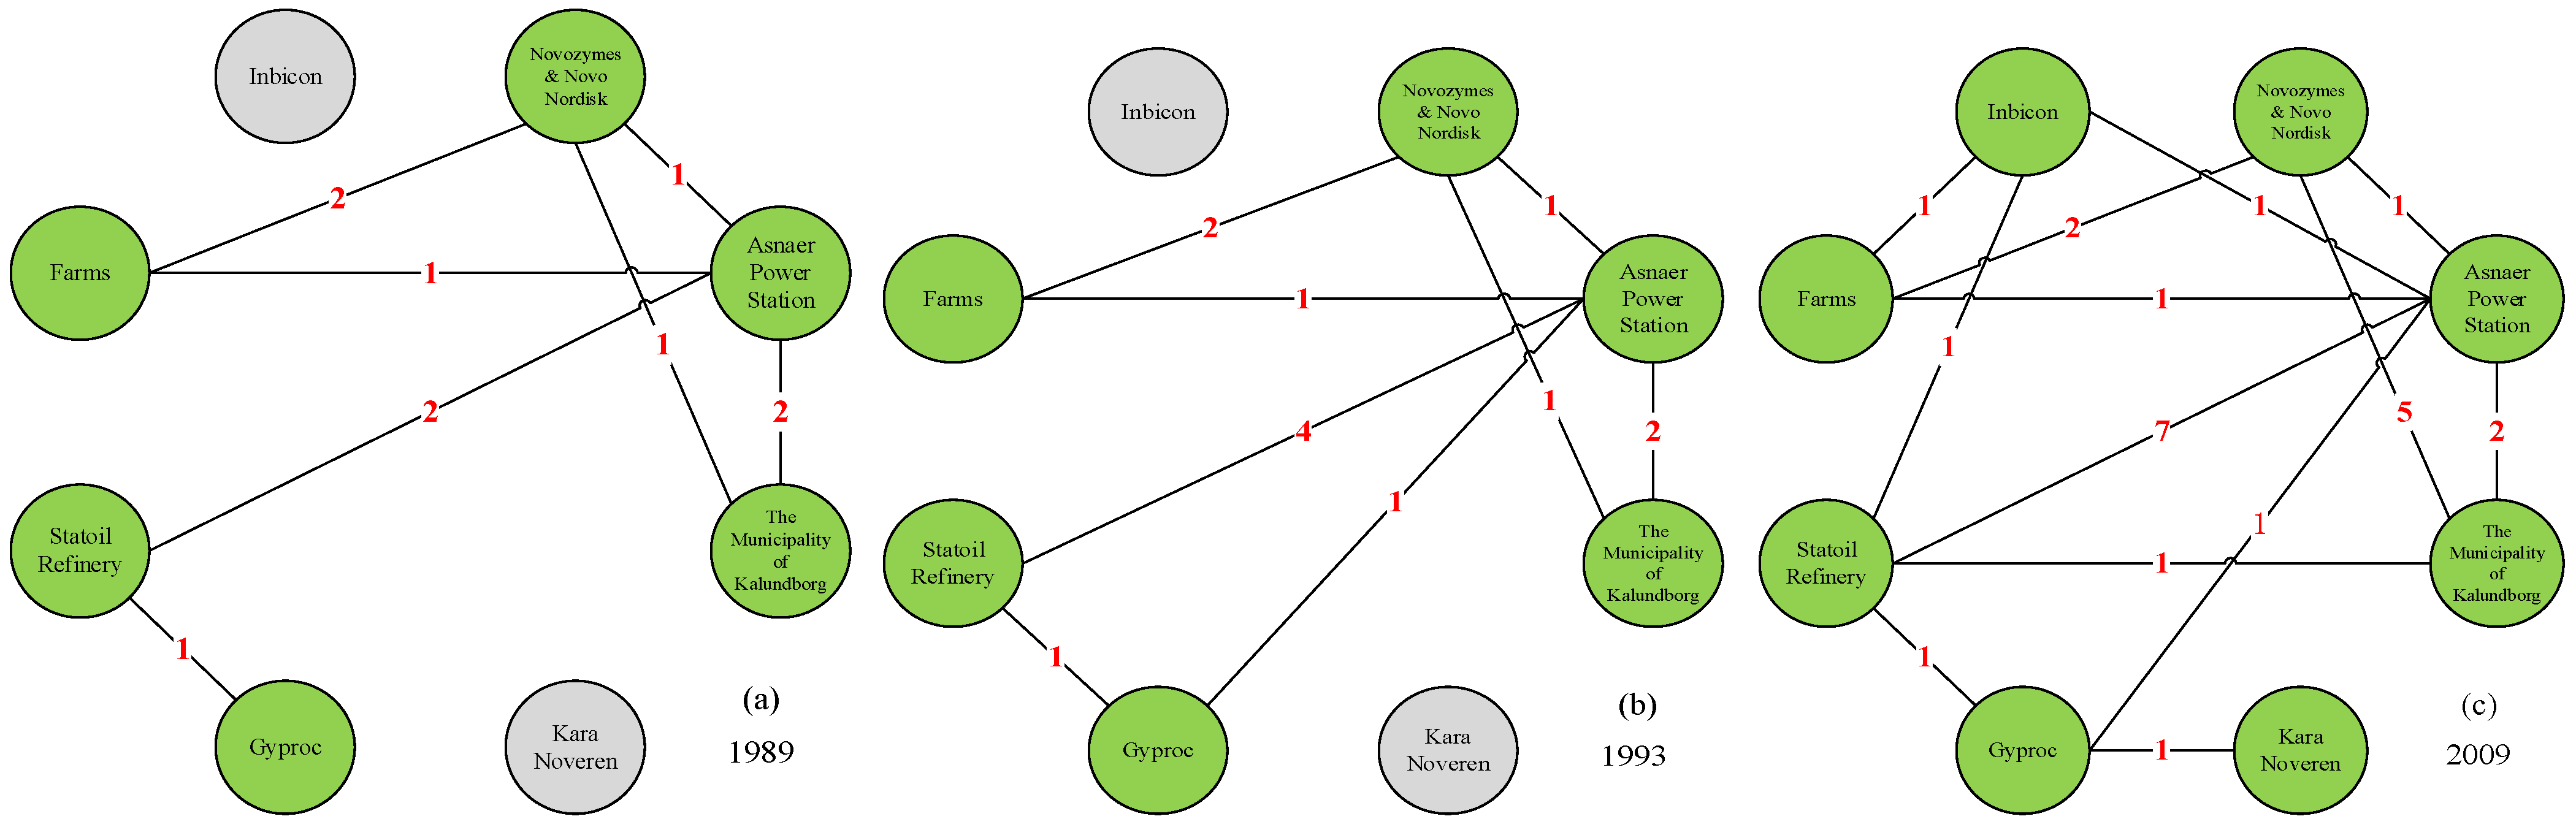
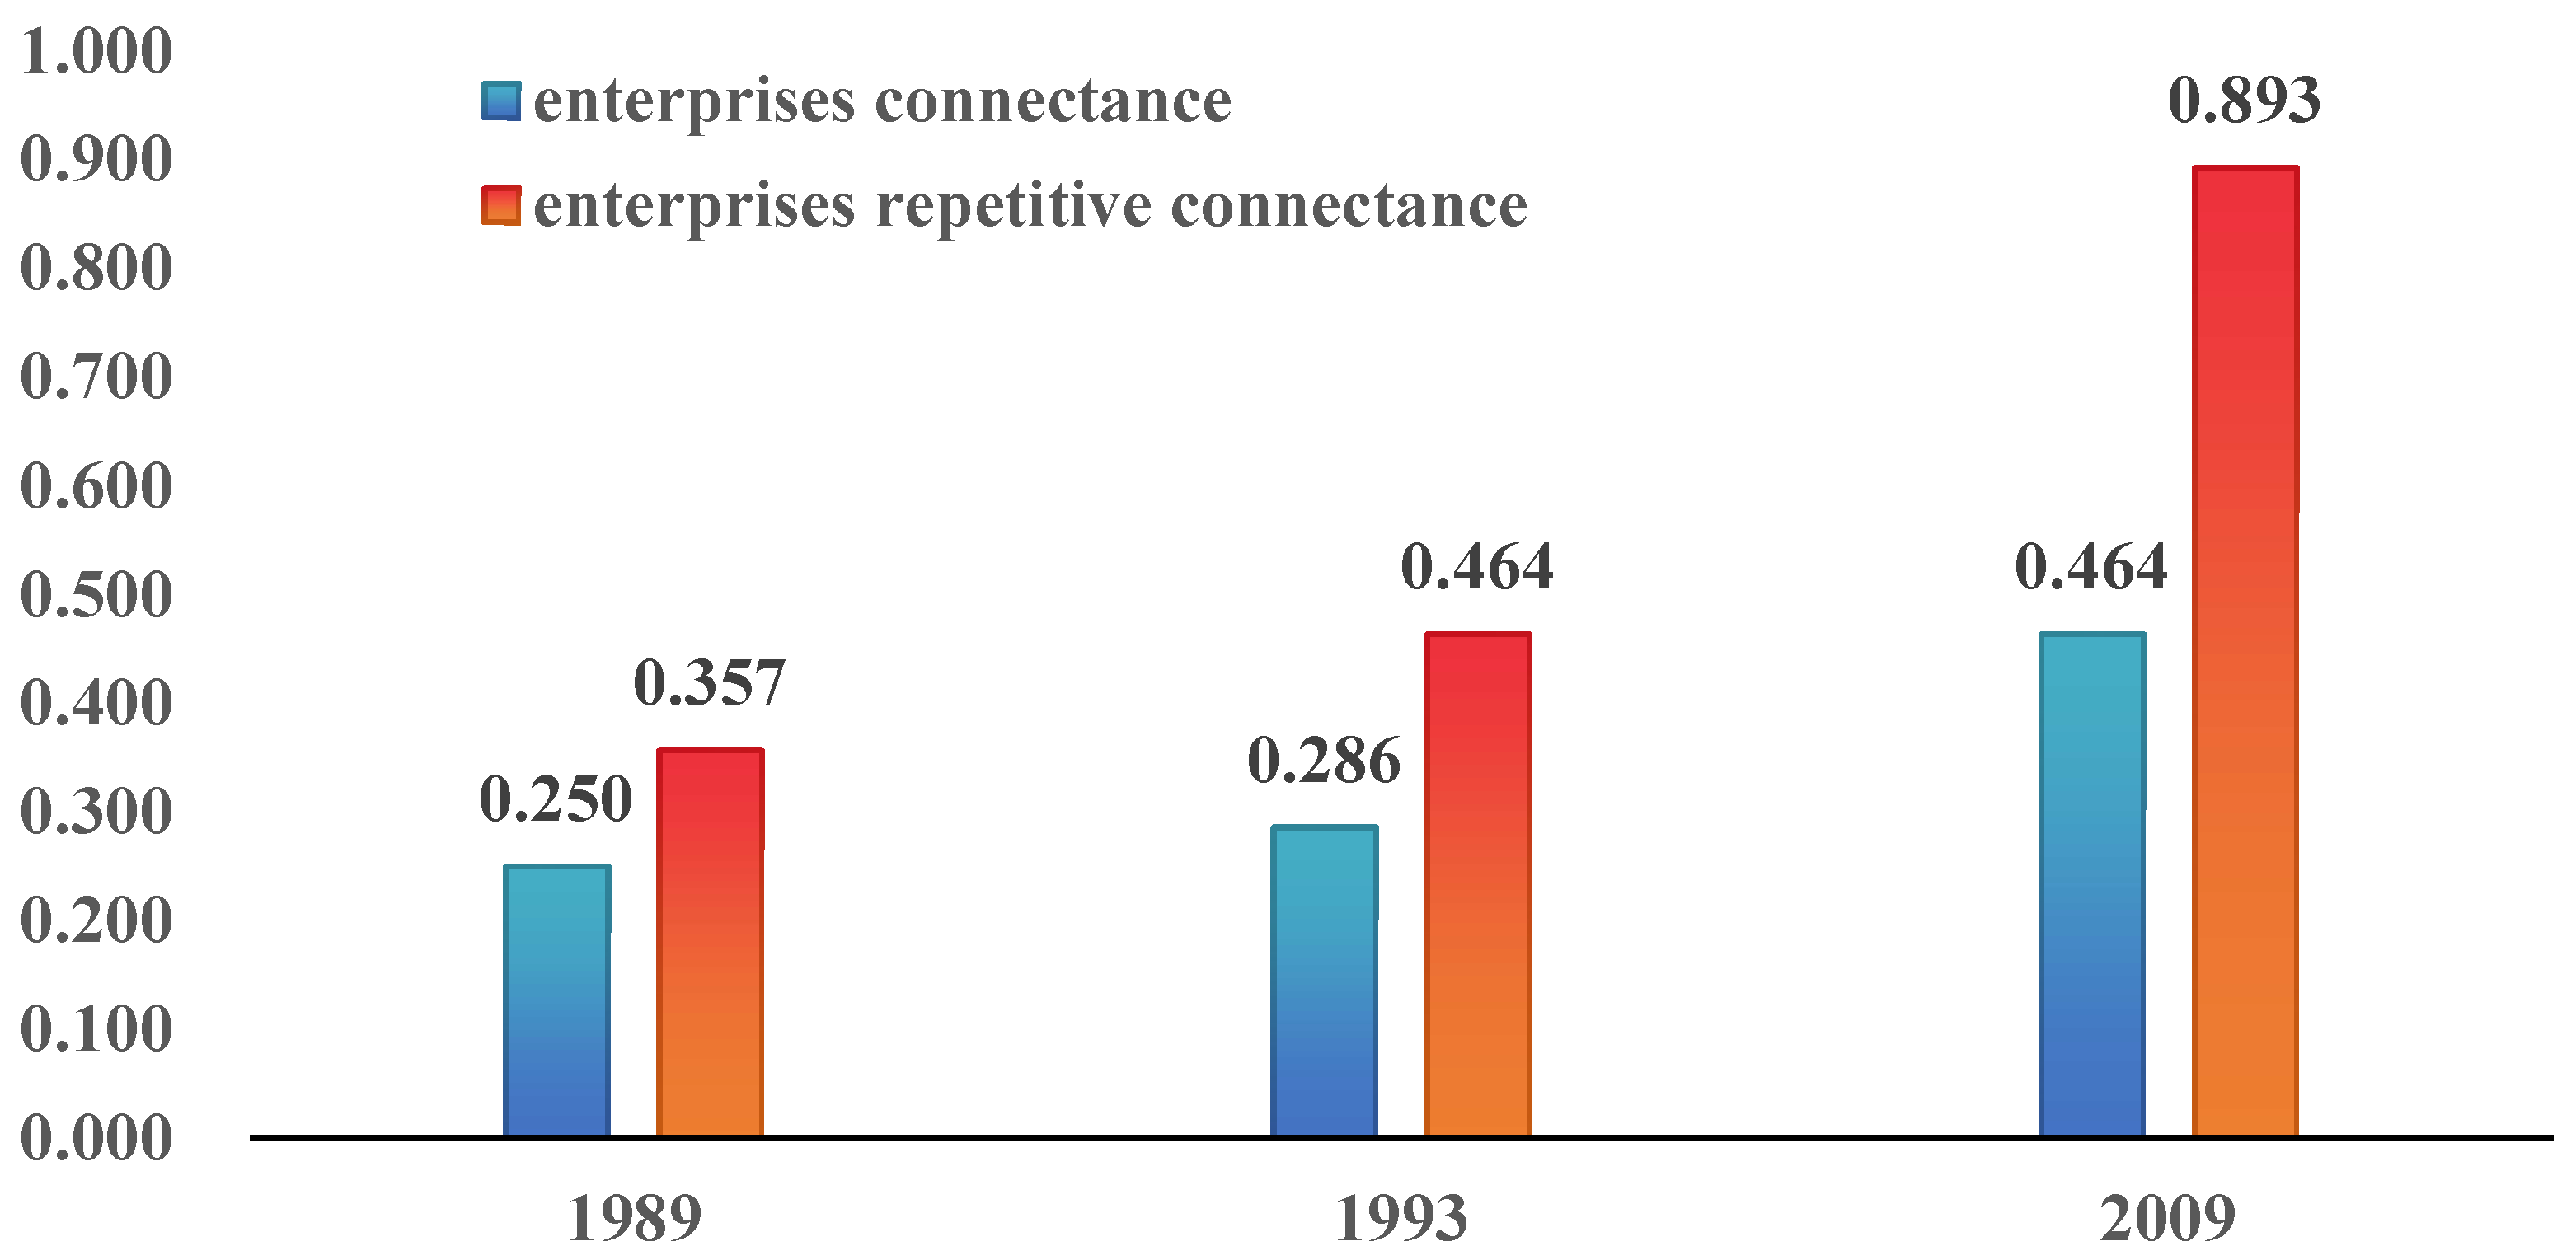
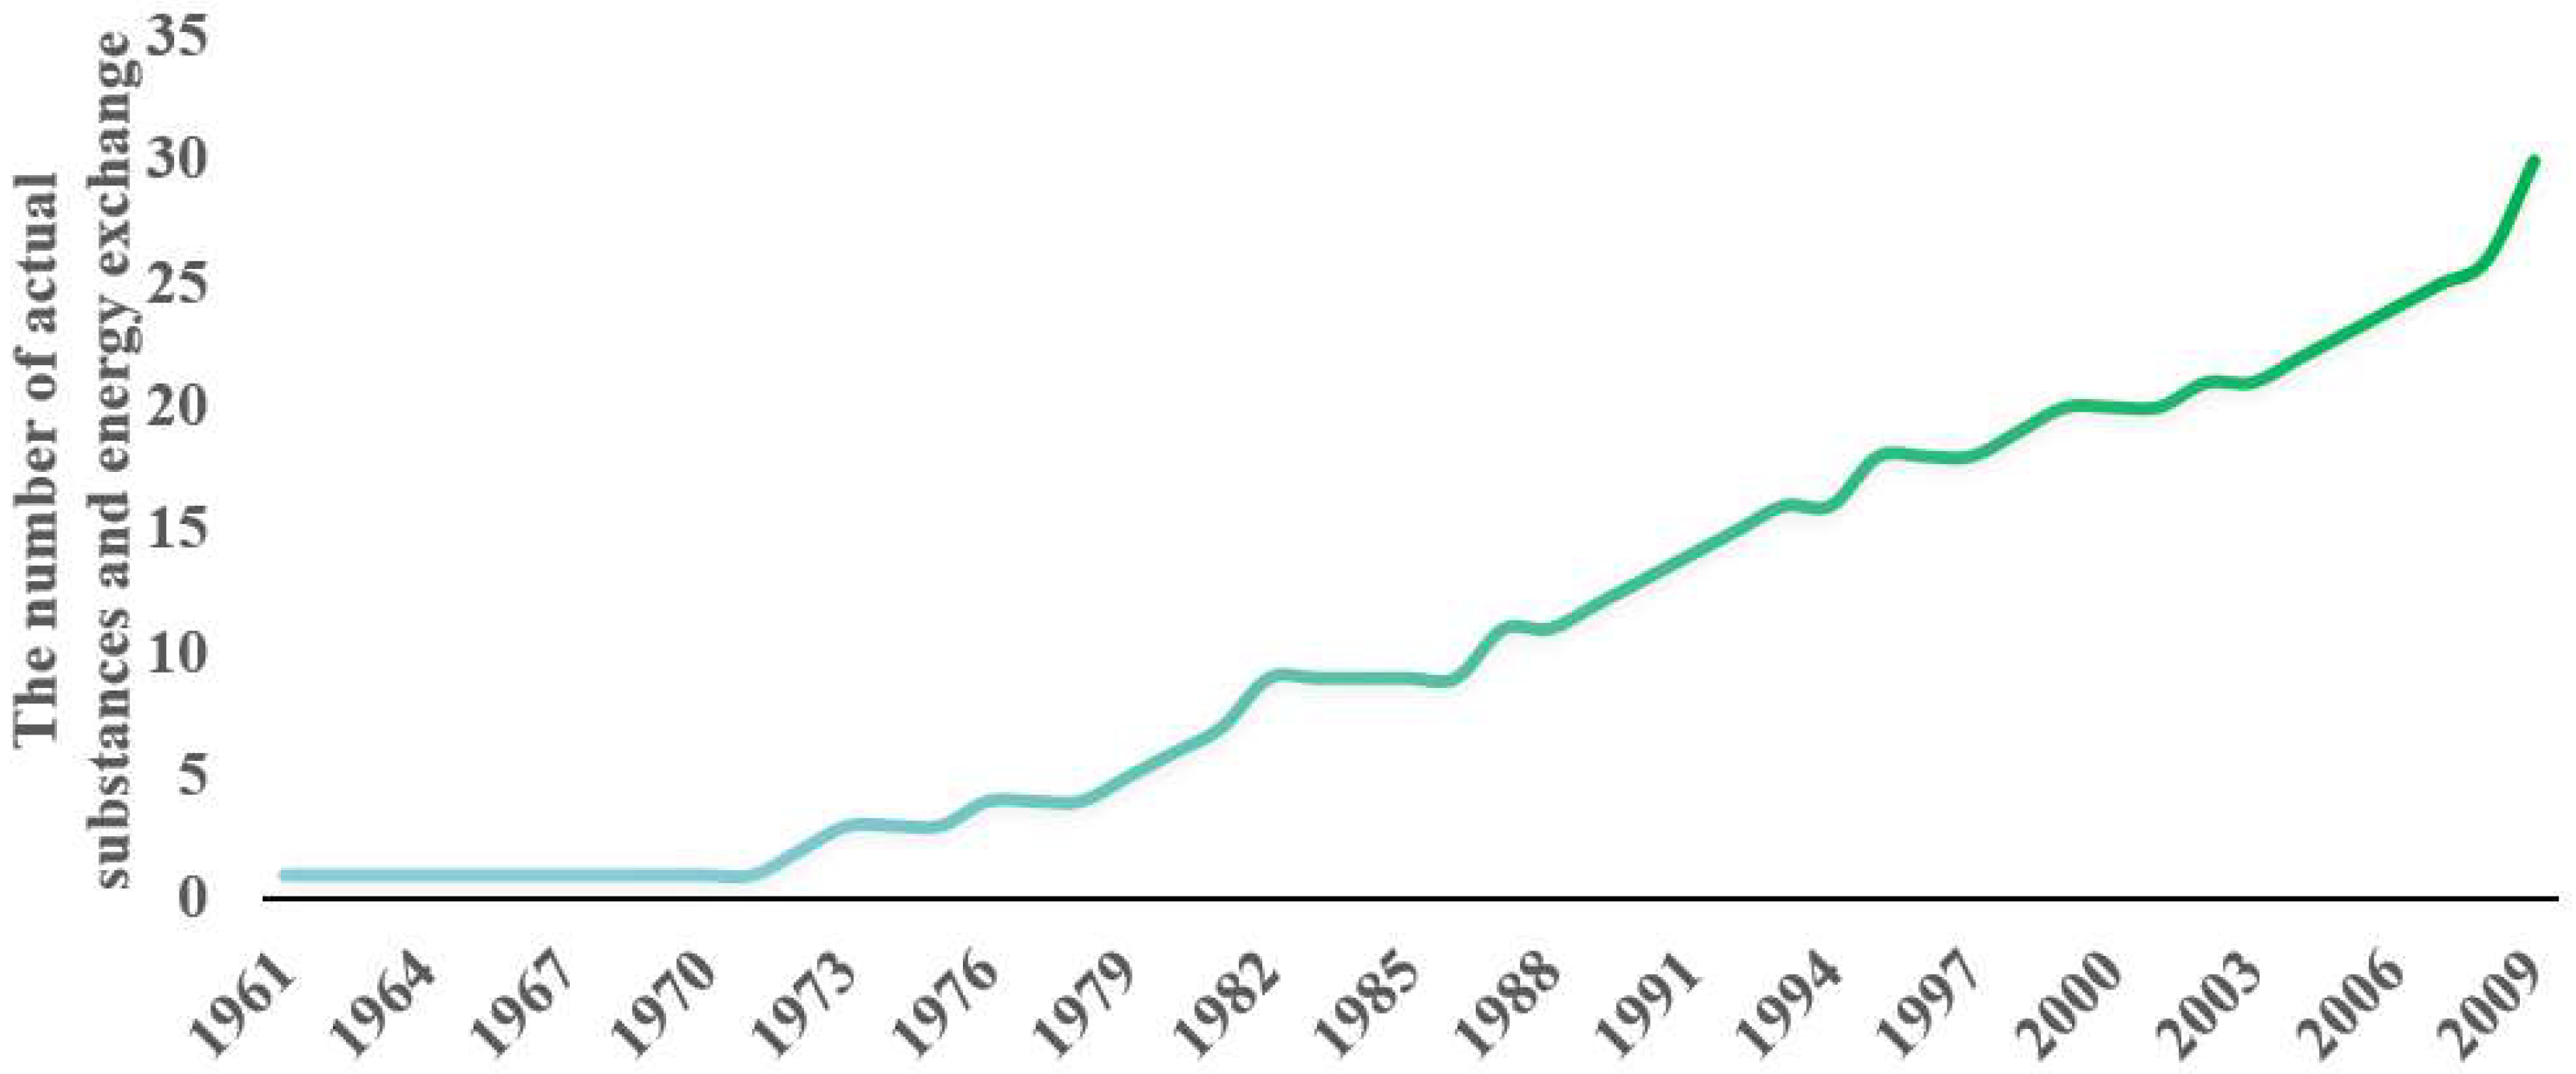
The eco-industrial network of Kalundborg at different stages is shown in Figure 2. The numbers on each eco-industrial chain in Figure 2 represent the actual substances and energy exchanges, that is, LPR. Figure 2 shows that with the evolution of the Kalundborg EIP, the exchange of substances and energy gradually increased, and all eight major enterprises in this EIP were involved in the exchange in 2009. Figure 3 shows the enterprise connectance and enterprise repetitive connectance of the different stages. In 1989, the enterprise connectance of the Kalundborg EIP was 0.250, and after two decades of development, it reached 0.464 in 2009. The enterprise repetitive connectance was only 0.357 in 1989 but reached 0.893 in 2009. The increase in the enterprise connectance and enterprise repetitive connectance demonstrated the benefit due to good symbiotic development planning during the conscious stage. In addition, Figure 4 shows that an increasing number of symbiosis projects were conducted among these enterprises.
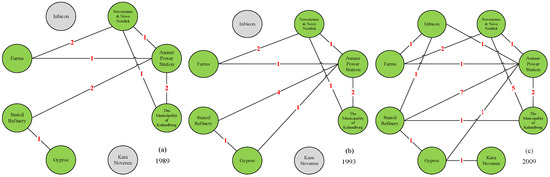
Figure 2.
Eco-industrial network at different stages. (a) represents the spontaneous stage (1989), (b) represents the transition stage (1993), and (c) represents the conscious stage (2009).
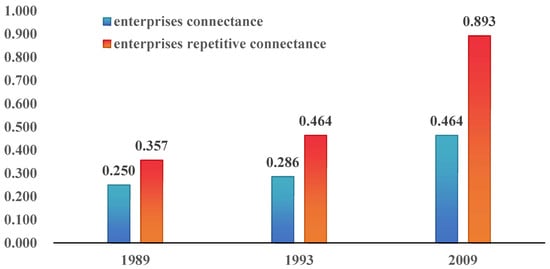
Figure 3.
Enterprise connectance and enterprise repetitive connectance at different stages.
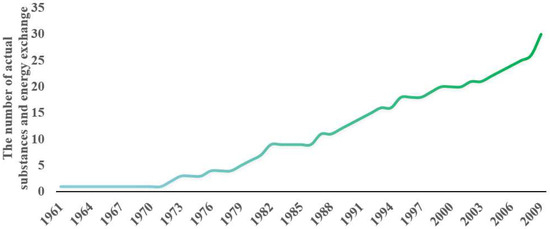
Figure 4.
The number of actual substances and energy exchange.
4. Evolutionary Characteristics of IPs at the National Level
IPs in nearly all countries have undergone spontaneous and conscious evolutionary characteristics similar to those of the Kalundborg EIP. In the following section, we examine cases in China and South Korea.
4.1. Evolutionary Characteristics of Chinese IPs
IP construction in China began with the establishment of the Shenzhen Shekou Industrial Zone in 1979. In December 1978, the Third Plenary Session of the Eleventh Central Committee of the Communist Party of China (CPC) was held, during which the policy of reform and opening up was determined. In early 1979, with the opportunity of “taking economic construction as the center” and reform and opening up, the Guangdong Provincial Government and the Ministry of Communications proposed to the State Council that Hong Kong China Merchants establish an industrial zone in Shekou, Shenzhen. This proposal was approved by the State Council, and in July of the same year, the Shekou Industrial Zone broke ground, marking the beginning of Chinese IP construction.
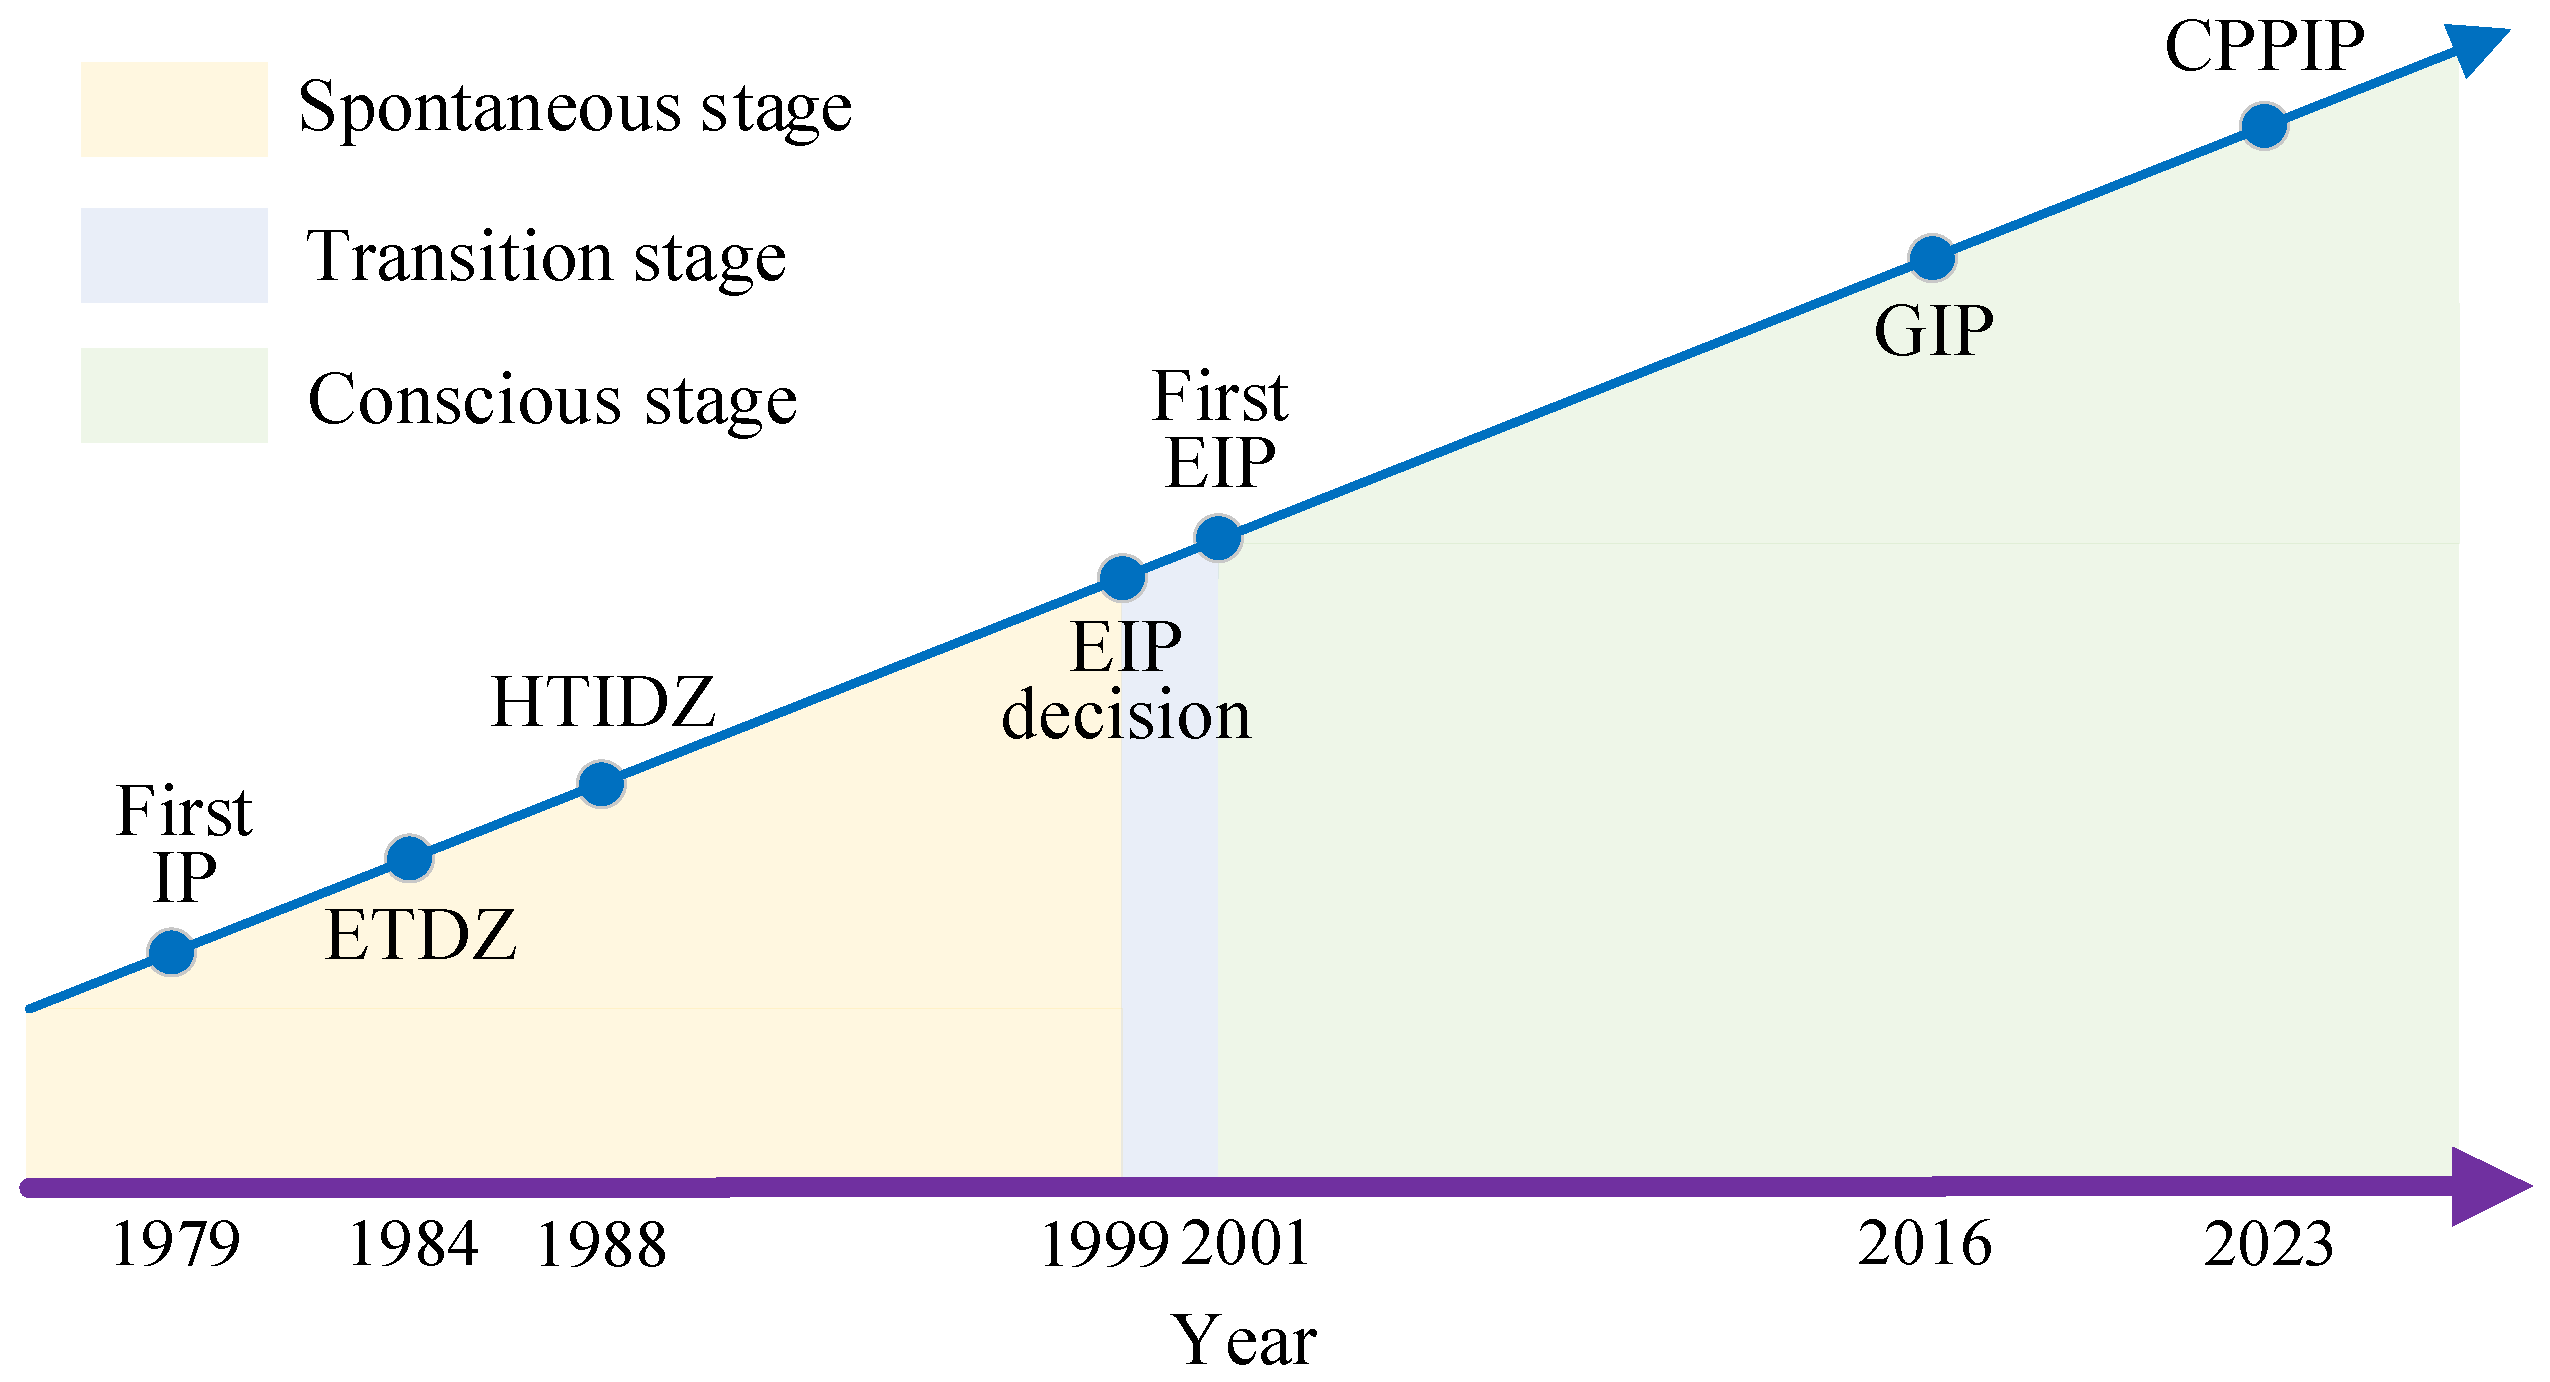
With the process of reform and opening up, the achievements and experience obtained needed to be promoted and expanded in a timely manner. In addition, industrial development needed to introduce foreign capital and advanced manufacturing. Based on this, in 1981, the Chinese government began to deploy the construction of economic and technological development zones (ETDZs). Three years later, in 1984, the Chinese government established 17 ETDZs in 14 coastal port cities, and many more were added in the subsequent development. As of December 2022, there were 230 national-level ETDZs. In 1988, to maximize the transformation of scientific and technological achievements into productive forces, the Chinese government established high-tech industrial development zones (HTIDZs) in knowledge- and technology-intensive cities, and there was a clear stipulation on what types of industries should be developed in different HTIDZs. As of December 2022, there were 177 national-level HTIDZs in China. To promote environmental protection and industrial ecological development, the Chinese government decided to conduct the construction of EIPs in 1999, and in August 2001, the Guigang Sugar Industrial Park became the first EIP in China. By December 2022, there were 73 national-level EIPs in China. To accelerate the construction of green manufacturing systems, create a number of typical IPs with demonstration roles, and promote green development in the industrial field, the Ministry of Industry and Information Technology of China proposed to build green industrial parks (GIPs) in September 2016. In 2017, 24 IPs became the first batch of national-level GIPs, and as of December 2022, there were 271 national-level GIPs in China. In 2020, the Chinese government made a solemn commitment to the international community that China would strive to achieve carbon peaking before 2030 and carbon neutrality before 2060. Since then, the Chinese government has issued a series of policies on carbon peaking and carbon neutrality, including the policy on carbon peaking in IPs. In October 2023, a review of carbon peaking pilot industrial parks (CPPIPs) officially began. Under a carbon-neutral perspective and by combining the developmental process (Figure 5), it was found that IPs in China also had spontaneous and conscious evolutionary characteristics.
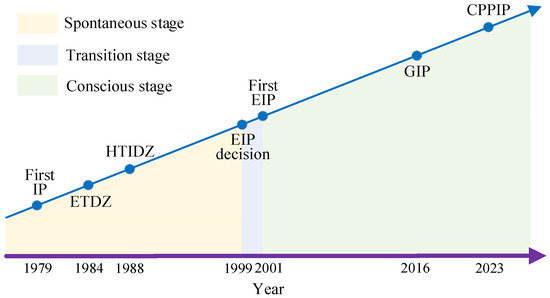
Figure 5.
The evolutionary characteristics of Chinese IPs from a carbon neutrality perspective.
The first stage: the spontaneous stage (1979–1998)
During this stage, the IP types in China were primarily ETDZs and HTIDZs. ETDZs were labor-intensive IPs whose economic structures were relatively single and primarily focused on economic development, and there also existed some serious environmental pollution problems. HTIDZs were intelligence-intensive IPs supported by sophisticated technology. Although HTIDZs have advanced production technologies, the environmental pollution problems caused by economic development remained unsolved. Although both types of IPs had relevant development plans, they were primarily planned in terms of economic development and did not consider the coordination of economic development and environmental protection. Therefore, this stage can be regarded as the spontaneous stage from a carbon-neutral perspective.
The second stage: the transition stage (1999–2001)
The Chinese government began to develop EIPs in 1999, drawing on the excellent experience of other countries. By saving resources and protecting the environment, EIPs can solve the problem of environmental pollution while developing the economy so as to maximize the utilization of resources and minimize the discharge of waste. The first EIP in China was established in 2001.
The third stage: the conscious stage (2002–)
Since the successful establishment of EIPs, the ecological development of IPs in China has made a qualitative leap, and the green and low-carbon development of IPs has been on the right track [4]. The development of GIPs and CPPIPs has promoted the green, low-carbon, and sustainable development of IPs through different priorities.
4.2. Evolutionary Characteristics of South Korean IPs
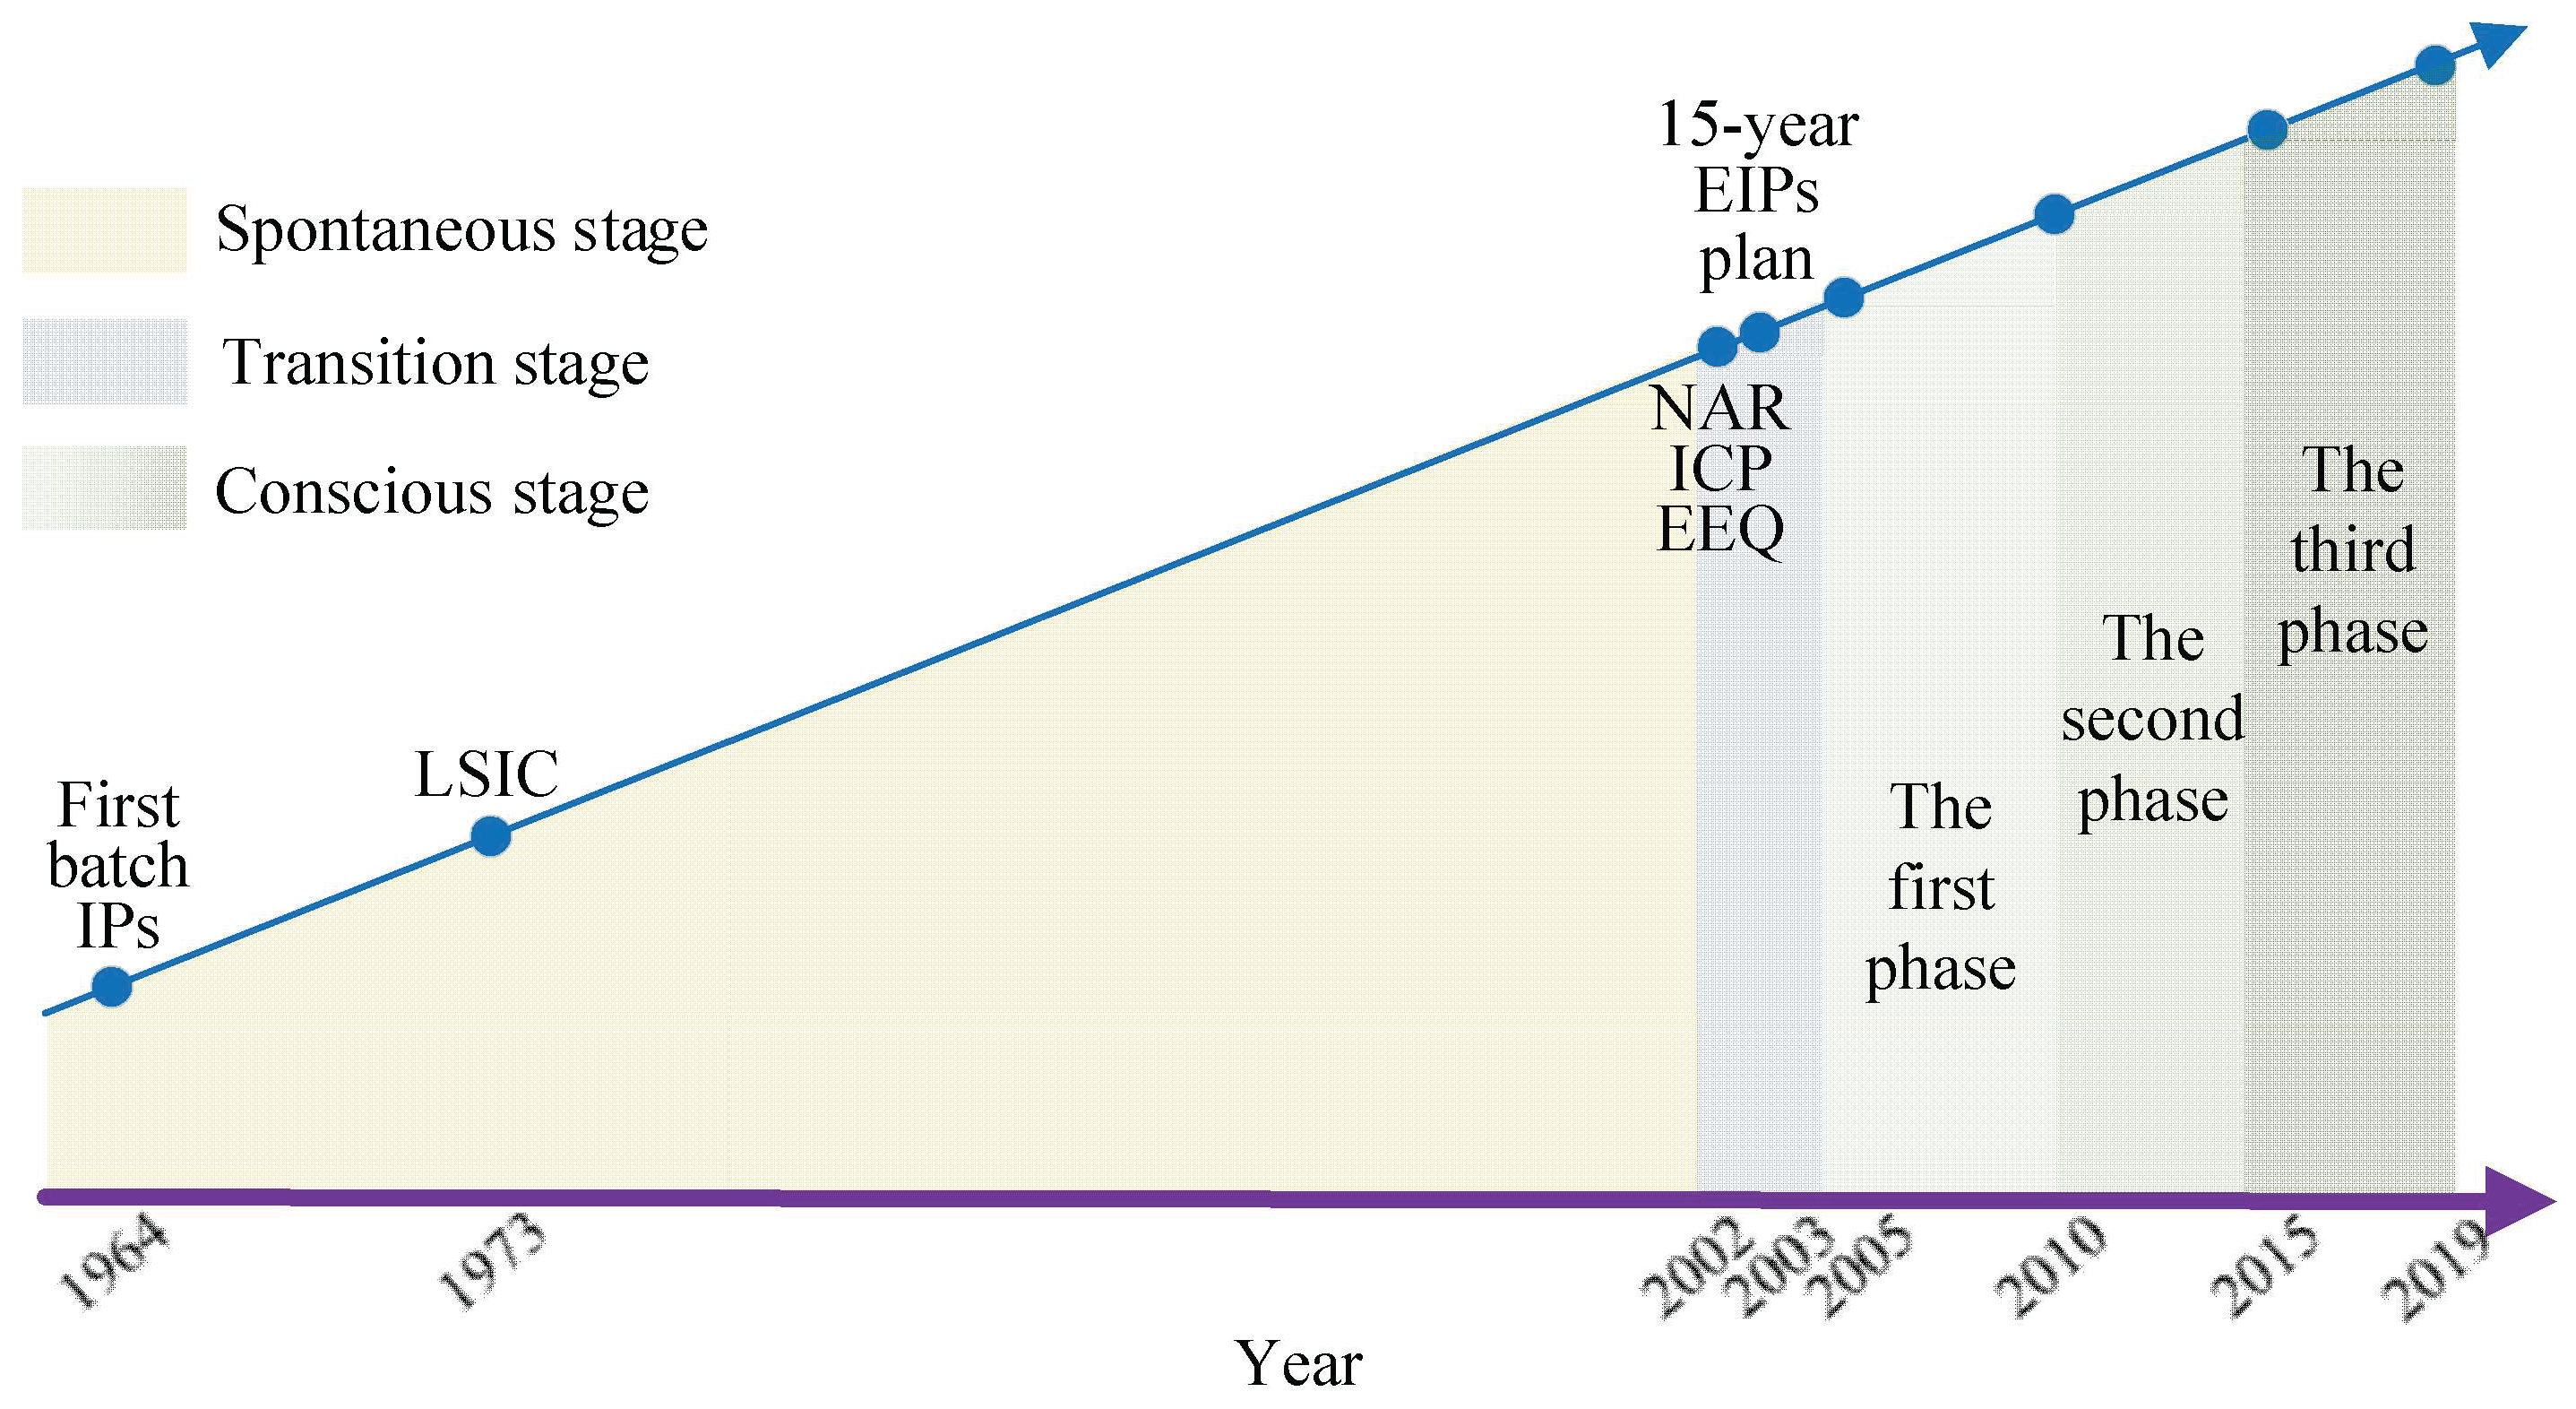
IPs in Korea have grown rapidly since the establishment of the Guro Export Complex and the Ulsan Petrochemical Complex in 1964. As of December 2022, the number of IPs in South Korea had reached 1274. The IP types are divided into national industrial parks, local industrial parks, urban cutting-edge industrial parks, and agricultural industrial parks.
The IP development process in South Korea was similar to that in China, with the government leading throughout. However, at the beginning, the focus was primarily on economic development. After entering the 21st century, the policy that related to IP development gradually shifted to green and low-carbon development, as represented by the EIPs. Therefore, from a carbon-neutral perspective, IP evolution in South Korea has also been spontaneous and conscious (Figure 6).
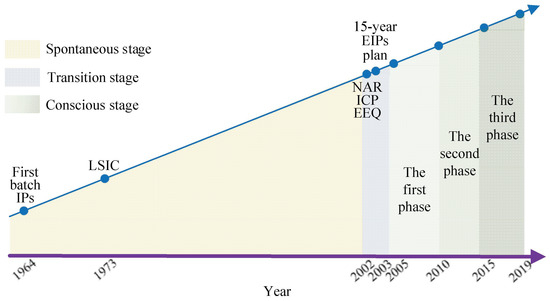
Figure 6.
The evolutionary characteristics of South Korea IPs from a carbon neutrality perspective.
The first stage: the spontaneous stage (1964–2001)
To support the export-driven national industrial strategy in the 1960s, the South Korean government launched the Construction Plan of Export Industrial Parks and established the first IPs, including the Guro Export Industrial Park (now known as the Seoul Digital Industrial Park) and the Ulsan Chemical Industrial Park. IP establishment had significantly promoted economic development in South Korea. In the beginning, these IPs were dominated by light industries such as textiles. There was a significant change in industrial development in South Korea after the 1870s due to fierce global competition in light industries. In 1973, the government introduced the Industrial Base Development Promotion Act, and large specialized industrial complexes were established in Ulsan and Songpo. Since the 1990s, industrial policy had focused on technological development, and rapid industrial development caused an economic boom that made South Korea become one of the Four Asian Tigers.
The second stage: the transition stage (2001–2004)
During rapid industrial development, a large number of resources are consumed, a large amount of waste is produced, and serious environmental pollution is caused [38]. For example, Ulsan, the industrial capital of South Korea, has been called the “pollutant storage place” and the “most polluted city in the country”. In 2002, residents of the communities surrounding the IP founded the National alliance for reforming the industrial complex policy and enhancing environmental quality, which reflected the seriousness of the environmental problems. In October 2003, according to the requirements of industrial restructuring, the Ministry of Commerce, Industrial, and Energy of South Korea formulated the innovative sustainable industrial development strategy and developed a 15-year master plan for EIP development. The program was led by the Korean National Cleaner Production Center [16,39].
The third stage: the conscious stage (2005–)
The master plan for the EIP in Korea was divided into three phases. The first phase was from 2005 to May 2010 during which a total of seven IPs with different characteristics in five pilot areas (Pohang, Yeosu, Ulsan Mipo–Onsan, Gyeonggi, Banwol–Sihwa, and Cheongju) were identified as demonstration areas for EIP development. After 5 years of development, a total of 116 industrial symbiosis projects had been developed in the 5 pilot areas, 52 of which were in stable operation, which brought huge economic and environmental benefits [38,39]. The second phase was from June 2010 to December 2014. Based on the first phase, the second phase focused on the development of industrial symbiosis at a broader regional level. Compared with the first phase, the second phase had achieved greater achievements, with the number of operational projects increasing from 52 to 159 and the number of companies involved in industrial symbiosis increasing from 90 to 596 [40]. The third phase, from January 2015 to December 2019, made up for some shortcomings of the symbiotic project during the first two phases, and this completed the South Korean EIP model [41].
After 15 years of EIP construction, South Korea has achieved tremendous economic and environmental benefits, with annual exports reaching 2.5 billion dollars and the annual production value reaching 6.5 billion won. Additionally, resource consumption and waste generation have been greatly reduced.
5. Discussion
From the spontaneous philosophical viewpoint, if the development of IPs stays in the spontaneous stage and is not guided by the government, although a certain scale of industrial symbiosis that is dominated by economic benefits will form, the formation process may be long. Once the economic benefits disappear, the industrial symbiosis model is bound to collapse. However, the environmental benefits produced during the spontaneous stage will be smaller. Currently, the problem of climate change is becoming increasingly serious, and only focusing on maximizing economic benefits without seeking environmental benefits will cause extreme environmental problems, and this approach does not meet the requirements of sustainable development. In contrast, during the conscious stage, through government guidance (financial subsidies and other forms) and enterprises’ own strong sense of social responsibility, the industrial symbiosis model in IPs will soon take shape and exist stably, nearly unaffected by other factors. This type of symbiotic mode can help a country and region to achieve the carbon-neutral goal, and this will not only bring certain economic benefits but also reduce the use of primary resources through waste utilization and other strategies. This will maximize environmental benefits and truly realize the coordinated development of economic development and environmental protection [42,43].
5.1. Driving Factors
In terms of driving factors, carbon reduction measures during the spontaneous stage are primarily driven by resource demand, cost reduction, and economic development. The reason that the Kalundborg EIP used surface water was a lack of groundwater resources, and enterprises had to use lake water through the municipality. The cost reduction was considered from the perspective of the enterprise. At the beginning of the establishment of Gyproc, low-priced flare gas from the Statoil Refinery was purchased as fuel for production in order to reduce costs. Economic development was a stronger driver for industrial development in China and South Korea. The driving forces of carbon reduction measures during the conscious stage primarily included environmental protection policies and standards, national and regional development plans, and the enterprises’ own social responsibility. Since the 1990s, especially after entering the 21st century, to combat climate change and protect human health, many countries have formulated many environmental protection policies and sustainable development plans that consciously promote low-carbon IP development. In the context of environmental protection, the leadership and employees of enterprises will receive relevant education on environmental protection, and this will cause the enterprises themselves to possess a good sense of social responsibility.
5.2. Principles for IPs’ Low-Carbon Development
As a gathering place of industrial activities, the sustainable development of IPs is very important. Throughout the world, since the 21st century, the development of IPs has gradually stepped into the conscious stage. At this stage, to better achieve green, low-carbon, and sustainable development, IPs should adhere to the following principles (as shown in Figure 7). The first is coordination between economic construction and environmental protection. The rapid development of industry is bound to help local economies grow rapidly, but in the context of climate change, we must protect the environment we depend on for survival. Therefore, during the process of the IP development, we must achieve the coordination of economic benefits and environmental benefits. The second is the 3R principle of the circular economy. Industrial production activities will cause a large amount of energy and resource consumption. Through the development of a circular economy, the utilization efficiency of energy and resources can be improved, the step utilization of energy can be achieved, and the reduction, recycling, and reuse of resources can be realized. The third is sustainable development principles, including fairness, sustainability, commonality, and stage. At the IP level, fairness means that when a sustainable development policy is implemented, all enterprises in IPs should be treated equally. For example, when there are industrial symbiosis opportunities, all enterprises should have equal choices. Sustainability refers to the continuous utilization of resources, including waste recycling and water reuse. Commonality means that the sustainable development of IPs is the common responsibility of all the enterprises in the IPs. A stage refers to the different requirements and goals for enterprises during different development stages, that is, the differences in the goals and responsibilities of large, medium-sized, and small enterprises.
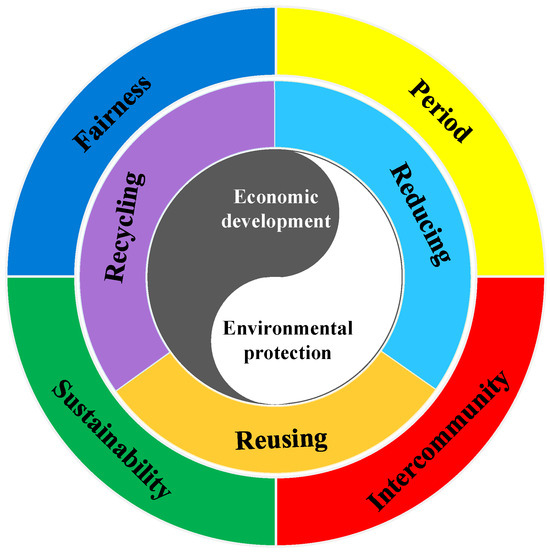
Figure 7.
Principles that should be adhered to for IP development in the conscious stage.
5.3. Research Limitations
Due to the limitations of data sources, this study solely analyzed Kalundborg EIP, an international typical case and did not select other IP at different development stages for comparison. In the future, we will select some IPs in different regions and at different development stages to analyze their evolutionary characteristics from the perspective of carbon neutrality.
6. Conclusions and Recommendations
6.1. Conclusions
From the perspective of carbon neutrality, this paper used the Kalundborg EIP as an example. We divided its development into three stages and analyzed the evolutionary characteristics in combination with the enterprise connectance and enterprise repetitive connectance. Next, we analyzed the evolutionary characteristics of IPs at the national level by using China and South Korea as examples. The primary conclusions are as follows:
- (1)
- At both the IP level and the national level, the IP evolutionary characteristics were spontaneous and conscious in terms of carbon neutrality.
- (2)
- Compared with the spontaneous stage, the enterprise connectance and enterprise repetitive connectance in IPs during the conscious stage were significantly higher, and the enterprise repetitive connectance more clearly showed the number of actual substances and energy exchanges.
- (3)
- In the spontaneous stage, the primary driving factors of carbon reduction measures were resource demand, cost reductions, and economic development, whereas in the conscious stage, the primary driving factors were environmental protection policies and standards, national and regional development plans, and the enterprises’ sense of social responsibility.
6.2. Recommendations
Achieving the goal of carbon neutrality in IPs is of great significance for industrial sustainable development. In future research, it is imperative to concentrate on the following aspects: (1) optimizing low-carbon development pathways. In the context of carbon neutrality, the formulation of low-carbon development measures is a common practice for almost all IPs. However, identifying the most suitable pathway for their own low-carbon development remains the primary task for IPs. (2) Currently, the development of IPs has entered conscious stage, and during this stage, the strategic planning and construction of newly established IPs are crucial. (3) Different countries and regions have varying policy standards, regulatory frameworks, economic incentives, and technological capabilities, which have different impacts on IPs for achieving the goal of carbon neutrality. Therefore, we suggest research on those differences be strengthened to enhance IPs’ sustainable development. (4) More indicators, including energy efficiency, waste management practices, and the utilization of renewable energy, should be considered for measuring progress towards carbon neutrality. (5) Stakeholder perspectives, which can offer insights into the practical challenges and social dynamics that influence the implementation of carbon-neutral practices, should be analyzed in depth. (6) Longitudinal analysis is necessary for achieving the goals of IPs. By tracking changes and developments over multiple years, we can identify long-term trends and the effectiveness of various interventions aimed at achieving carbon neutrality.
Author Contributions
Conceptualization, Y.S. and H.F.; Data curation, Y.S.; Formal analysis, Y.S., H.F. and S.Z.; Funding acquisition, S.Z.; Investigation, Y.S., Y.L., J.N. and F.L.; Methodology, Y.S. and H.F.; Resources, Y.S., S.Z. and Z.F.; Supervision, H.F.; Validation, Y.S., S.Z. and H.F.; Visualization, Y.S. and Y.L.; Writing—original draft, Y.S., F.L., Z.F. and H.F.; Writing—review and editing, Y.S., S.Z., J.N. and H.F. All authors have read and agreed to the published version of the manuscript.
Funding
This research received no external funding.
Institutional Review Board Statement
Not applicable.
Informed Consent Statement
Not applicable.
Data Availability Statement
No data were used for the research described in this article.
Acknowledgments
This research was supported by the National Science and Technology Major Project of the Ministry of Science and Technology of China (Grant NO. 2022YFE020850002).
Conflicts of Interest
The authors declare no conflicts of interest.
References
- Ai, C.; Wu, H.; Huang, T.; Wang, R. How does knowledge flow in industrial clusters? The comparison between both naturally and intentionally formed industrial clusters in China. Asian J. Technol. Innov. 2022, 30, 245–275. [Google Scholar] [CrossRef]
- Shepelev, V.M.; Larkin, A.A.; Kosyakova, I.V.; Gavrilova, M.A.; Kulaeva, O.A. Evolution of industrial complexes: From industrial parks to science and technology parks. In Proceedings of the Gcpmed 2018—International Scientific Conference Global Challenges and Prospects of the Modern Economic Development, Samara, Russia, 6–7 December 2018; Volume 57, pp. 1621–1628. [Google Scholar]
- Han, X.; Sun, T.; Feng, Q. Study on environmental pollution loss measurement model of energy consumption emits and its application in industrial parks. Sci. Total Environ. 2019, 668, 1259–1266. [Google Scholar] [CrossRef] [PubMed]
- Lu, J.; Zhou, Q.; Qi, W.; Qu, S.; Bi, J. The heterogeneous effects of Chinese industrial parks on environmental pollution. Sci. Total Environ. 2023, 896, 165279. [Google Scholar] [CrossRef] [PubMed]
- Zhao, X.; Meng, J.; Li, Q.; Su, G.; Zhang, Q.; Shi, B.; Dai, L.; Yu, Y. Source apportionment and suitability evaluation of seasonal VOCs contaminants in the soil around a typical refining-chemical integration park in China. J. Environ. Sci. 2024, 137, 651–663. [Google Scholar] [CrossRef] [PubMed]
- Daddi, T.; Iraldo, F.; Frey, M.; Gallo, P.; Gianfrate, V. Regional policies and eco-industrial development: The voluntary environmental certification scheme of the eco-industrial parks in Tuscany (Italy). J. Clean. Prod. 2016, 114, 62–70. [Google Scholar] [CrossRef]
- Liu, Z.; Adams, M.; Cote, R.P.; Geng, Y.; Li, Y. Comparative study on the pathways of industrial parks towards sustainable development between China and Canada. Resour. Conserv. Recycl. 2018, 128, 417–425. [Google Scholar] [CrossRef]
- Fang, Y.; Shao, Z. How does green finance affect cleaner industrial production and end-of-pipe treatment performance? Evidence from China. Environ. Sci. Pollut. Res. Int. 2023, 30, 33485–33503. [Google Scholar] [CrossRef]
- Tang, Y.; Chen, Y.; Yang, R.; Miao, X. The Unified Efficiency Evaluation of China’s Industrial Waste Gas Considering Pollution Prevention and End-Of-Pipe Treatment. Int. J. Environ. Res. Public Health 2020, 17, 5724. [Google Scholar] [CrossRef]
- Branson, R. Re-constructing Kalundborg: The reality of bilateral symbiosis and other insights. J. Clean. Prod. 2016, 112, 4344–4352. [Google Scholar] [CrossRef]
- Conticelli, E.; Tondelli, S. Application of Strategic Environmental Assessment to Eco-Industrial Parks: Raibano Case in Italy. J. Urban Plan. Dev. 2013, 139, 185–196. [Google Scholar] [CrossRef]
- Fan, Y.; Fang, C. Assessing environmental performance of eco-industrial development in industrial parks. Waste Manag. 2020, 107, 219–226. [Google Scholar] [CrossRef] [PubMed]
- Weinmayr, G.; Forastiere, F. A health-based long term vision to face air pollution and climate change. Front. Public Health 2022, 10, 947971. [Google Scholar] [CrossRef] [PubMed]
- Koenig, A. Quo vadis EIP? How eco-industrial parks are evolving. J. Ind. Ecol. 2005, 9, 12–14. [Google Scholar] [CrossRef]
- Schluter, L.; Mortensen, L.; Gjerding, A.N.; Kornov, L. Can we replicate eco-industrial parks? Recommendations based on a process model of EIP evolution. J. Clean. Prod. 2023, 429, 139499. [Google Scholar] [CrossRef]
- Huo, C.H.; Chai, L.H. Physical principles and simulations on the structural evolution of eco-industrial systems. J. Clean. Prod. 2008, 16, 1995–2005. [Google Scholar] [CrossRef]
- Yu, F.; Han, F.; Cui, Z. Evolution of industrial symbiosis in an eco-industrial park in China. J. Clean. Prod. 2015, 87, 339–347. [Google Scholar] [CrossRef]
- Korhonen, J.; Snakin, J.P. Analysing the evolution of industrial ecosystems: Concepts and application. Ecol. Econ. 2005, 52, 169–186. [Google Scholar] [CrossRef]
- Cui, H.; Liu, C.; Cote, R.; Liu, W. Understanding the Evolution of Industrial Symbiosis with a System Dynamics Model: A Case Study of Hai Hua Industrial Symbiosis, China. Sustainability 2018, 10, 3873. [Google Scholar] [CrossRef]
- Behera, S.K.; Kim, J.; Lee, S.; Suh, S.; Park, H. Evolution of ‘designed’ industrial symbiosis networks in the Ulsan Eco-industrial Park: ‘research and development into business’ as the enabling framework. J. Clean. Prod. 2012, 29–30, 103–112. [Google Scholar] [CrossRef]
- Jiao, W.; Boons, F.; Teisman, G.; Li, C. Durable policy facilitation of Sustainable Industrial Parks in China: A perspective of co-evolution of policy processes. J. Clean. Prod. 2018, 192, 179–190. [Google Scholar] [CrossRef]
- Zhang, S.; Wang, X.T.; Xu, J.Y.; Chen, Q.Q.; Peng, W.; Hao, J.M. Green manufacturing for achieving carbon neutrality goal requires innovative technologies: A bibliometric analysis from 1991 to 2022. J. Environ. Sci. 2024, 140, 255–269. [Google Scholar] [CrossRef] [PubMed]
- Li, W.; Zhang, S.; Lu, C. Exploration of China’s net CO2 emissions evolutionary pathways by 2060 in the context of carbon neutrality. Sci. Total Environ. 2022, 831, 154909. [Google Scholar] [CrossRef] [PubMed]
- Sun, Y.H.; Li, Y.H.; Ning, J.; Fu, H.; Liu, F.T.; Feng, Z.Y.; Liu, G.X.; Shi, L. Twelve pathways of carbon neutrality for industrial parks. J. Clean. Prod. 2024, 437, 140753. [Google Scholar] [CrossRef]
- Layton, A.; Bras, B.; Weissburg, M. Industrial Ecosystems and Food Webs: An Expansion and Update of Existing Data for Eco-Industrial Parks and Understanding the Ecological Food Webs They Wish to Mimic. J. Ind. Ecol. 2016, 20, 85–98. [Google Scholar] [CrossRef]
- Wright, R.A.; Cote, R.P.; Duffy, J.; Brazner, J. Diversity and Connectance in an Industrial Context The Case of Burnside Industrial Park. J. Ind. Ecol. 2009, 13, 551–564. [Google Scholar] [CrossRef]
- Warren, P.H. Making Connections in Food Webs. Trends Ecol. Evol. 1994, 9, 136–141. [Google Scholar] [CrossRef] [PubMed]
- Hardy, C.; Graedel, T.E. Industrial ecosystems as food webs. J. Ind. Ecol. 2002, 6, 29–38. [Google Scholar] [CrossRef]
- John, E.; Nicholas, G. Industrial Ecology in Practice: The Evolution of Interdependence at Kalundborg. J. Ind. Ecol. 1997, 1, 67–79. [Google Scholar]
- Adamides, E.D.; Mouzakitis, Y. Industrial ecosystems as technological niches. J. Clean. Prod. 2009, 17, 172–180. [Google Scholar] [CrossRef]
- Jacobsen, N.B. Industrial symbiosis in Kalundborg, Denmark—A quantitative assessment of economic and environmental aspects. J. Ind. Ecol. 2006, 10, 239–255. [Google Scholar] [CrossRef]
- Chertow, M.R. The Eco-industrial Park Model Reconsidered. J. Ind. Ecol. 1999, 3, 8–10. [Google Scholar] [CrossRef]
- Chertow, M.R. Industrial symbiosis: Literature and taxonomy. Annu. Rev. Energy Environ. 2000, 25, 313–337. [Google Scholar] [CrossRef]
- Chertow, M.R. “Uncovering” industrial symbiosis. J. Ind. Ecol. 2007, 11, 11–30. [Google Scholar] [CrossRef]
- Desrochers, P. Cities and Industrial Symbiosis Some Historical Perspectives and Policy. J. Ind. Ecol. 2002, 5, 29–44. [Google Scholar] [CrossRef]
- Tolstykh, T.; Shmeleva, N.; Gamidullaeva, L. Evaluation of Circular and Integration Potentials of Innovation Ecosystems for Industrial Sustainability. Sustainability 2020, 12, 4574. [Google Scholar] [CrossRef]
- de Abreu, M.C.S.; Ceglia, D. On the implementation of a circular economy: The role of institutional capacity-building through industrial symbiosis. Resour. Conserv. Recycl. 2018, 138, 99–109. [Google Scholar] [CrossRef]
- Park, J.M.; Park, J.Y.; Park, H. A review of the National Eco-Industrial Park Development Program in Korea: Progress and achievements in the first phase, 2005–2010. J. Clean. Prod. 2016, 114, 33–44. [Google Scholar] [CrossRef]
- Park, H.; Rene, E.R.; Choi, S.; Chiu, A.S.F. Strategies for sustainable development of industrial park in Ulsan, South Korea—From spontaneous evolution to systematic expansion of industrial symbiosis. J. Environ. Manag. 2008, 87, 1–13. [Google Scholar] [CrossRef] [PubMed]
- Park, J.; Park, J.; Park, H. Scaling-Up of Industrial Symbiosis in the Korean National Eco-Industrial Park Program: Examining Its Evolution over the 10 Years between 2005–2014. J. Ind. Ecol. 2019, 23, 197–207. [Google Scholar] [CrossRef]
- Son, C.H.; Oh, D.; Ban, Y.U. Eco-industrial development strategies and characteristics according to the performance evaluation of eco-industrial park projects in Korea. J. Clean. Prod. 2023, 416, 137971. [Google Scholar] [CrossRef]
- Nie, X.; Wu, J.; Wang, H.; Li, W.; Huang, C.; Li, L. Contributing to carbon peak: Estimating the causal impact of eco-industrial parks on low-carbon development in China. J. Ind. Ecol. 2022, 26, 1578–1593. [Google Scholar] [CrossRef]
- Qian, L.; Xu, X.; Sun, Y.; Zhou, Y. Carbon emission reduction effects of eco-industrial park policy in China. Energy 2022, 261, 125315. [Google Scholar] [CrossRef]

Disclaimer/Publisher’s Note: The statements, opinions and data contained in all publications are solely those of the individual author(s) and contributor(s) and not of MDPI and/or the editor(s). MDPI and/or the editor(s) disclaim responsibility for any injury to people or property resulting from any ideas, methods, instructions or products referred to in the content. |
© 2024 by the authors. Licensee MDPI, Basel, Switzerland. This article is an open access article distributed under the terms and conditions of the Creative Commons Attribution (CC BY) license (https://creativecommons.org/licenses/by/4.0/).