Review

Socialscape Ecology: Integrating Social Features and Processes into Spatially Explicit Marine Conservation Planning

1
Environmental Studies Program, Middlebury College, Middlebury, VT 05753, USA
2
Department of Biological Sciences, University of New Hampshire, Durham, NH 03824, USA
*
Author to whom correspondence should be addressed.
Sustainability 2024, 16(14), 6078; https://doi.org/10.3390/su16146078
Submission received: 7 June 2024 / Revised: 11 July 2024 / Accepted: 14 July 2024 / Published: 16 July 2024

Abstract

:
Conservation planning is the process of locating, implementing, and maintaining areas that are managed to promote the persistence of biodiversity, ecosystem function, and human use. In this review, we analyze the ways in which social processes have been integrated into Marxan, a spatially explicit conservation planning tool used as one step in a broader process to select the location and size of protected areas. Drawing on 89 peer-reviewed articles published between 2005 and 2020, we analyzed the ways in which human activity, values, and processes are spatialized in the environment, something we call socialscape ecology. A socialscape ecology approach to conservation planning considers not only the spatial configuration of human activity in a land or seascape but also the underlying drivers of these activities, how resource use rights and access operate in an area, and how resource users contribute to data collection and decision making. Our results show that there has been a small but statistically significant increase in the total number of cost variables into Marxan analysis over time, with uneven performance across seven of the nine categories assessed. One notable area of improvement has been the increase over time in number of studies integrating socio-environmental change (e.g., climate change) in their analysis. Including accurate, context-specific, and detailed accounts of social features and processes within land and seascapes is essential for developing conservation plans that are cost-effective, ecologically sound, socially desirable, and just.

1. Introduction

Systematic conservation planning (SCP) is a process that helps decision-makers strategize and implement spatial conservation schemes that are cost-effective [1]. Historically, SCP focused primarily on protecting biodiversity; however, over the past 35 years, it has broadened to also take into consideration a variety of ecosystem service, socioeconomic, and cultural objectives [2]. Nonetheless, numerous scholars have shown that a robust analysis of social features and processes in systematic conservation planning is still lacking [3,4,5,6,7], not only potentially jeopardizing conservation outcomes but also possibly exacerbating existing social problems or creating new social problems [4,8,9,10]. Here, we collate a suite of social processes and features to offer a novel heuristic framework for conservation scientists and planners to use. We use the term social feature to mean human-created features in a land/seascape such as a port, tourist facility, artificial reef, or town, and social process to mean a social practice or activity present in the land/seascape such as fishing, social connectivity, and cultural value. However, we recognize that in practice, these two concepts are intersecting and overlapping, and thus we refer to any social process or feature simply as a social variable.
Integrated analysis across social and ecological systems is rooted in the field of landscape ecology, which considers the interdependence of patterns and processes between biota, climate, soil, and humans at the broadest levels of nested, spatially heterogenous environments [11,12,13,14]. Although landscape ecology focuses on elements of human use and processes in a landscape, these social elements are most often framed in terms of disturbance of ecological processes and are generally undertheorized [11,15,16].
In this paper, we use “socialscape ecology” to refer to a method of analyzing the complex and interdependent social systems (e.g., economic, cultural, political) that shape human–nature interactions, which considers not only the spatial configuration of human activity in a land or seascape but also focuses on the underlying drivers of these activities, how resource use rights and access operate within the land or seascape, and how resource users and other key stakeholders inform data collection and decision making. Drawing on the fields of landscape ecology [11,15], human geography [3,17], political ecology [18,19], and conservation science [9,20,21], we devised a heuristic framework to help researchers and conservation practitioners reflect on, and give greater consideration to, the variety of social features and processes that shape the spaces they aim to conserve (Figure 1, Table 1). This heuristic builds on frameworks derived from indigenous understandings of interconnected human–natural systems [22,23,24,25], social-ecological systems theory [26,27,28], and multiple-driver models [29,30,31]. Together, these fields and frameworks help underscore the importance of developing a deep and nuanced understanding of how social systems both shape and are shaped by natural systems in order to make conservation efforts more effective and just. Core arguments that emerge from these fields and frameworks converge on the importance of centering the knowledge, rights, and access of local people in conservation efforts [3,9,17,18,19,22]; the need to address proximate (local and direct) as well as distal (more distant and underlying) drivers of social and environmental change [15,20,27,28,29,30,31]; and given the dynamic nature of both social and natural processes, the need to integrate temporal change into conservation planning [32,33,34]. Developing our understanding and ability to integrate social features and processes into conservation planning will ultimately strengthen the legitimacy, salience, and local desirability of conservation planning, thus improving the effectiveness of conservation programs [35,36,37].
We evaluated a total of four categories (nine sub-categories) of social variables (Figure 1, Table 1 and Table S1), which include a suite of social features (e.g., where ports are located) and social processes (e.g., whether local resource users were involved in marine reserve siting) used to inform marine spatial planning. We then analyzed trends across time and between categories.
As a case study of this framework, we analyzed how social dynamics are integrated into the design and implementation of marine protected areas (MPAs). With the world’s oceans experiencing increasing anthropogenic pressures, governmental and non-governmental conservation organizations around the globe have embraced MPAs as a solution to conserve marine biodiversity; manage marine fisheries; and reach a variety of social, cultural, and economic objectives [38,39,40]. In the past two decades, there has been an exponential increase in the total marine area under protection [41].
Several decision support tools (DSTs) have been created to streamline the spatial allocation of MPAs, with a focus specifically on reserves, or no-take zones [42]. Marxan is one of the most popular and widely used decision support tools in marine spatial planning [43], and it was designed to aid systematic reserve design by allowing conservation planners to set targets for biogeographic and ecological features weighted against layers representing costs to local populations or industry [44]. Nearly a decade after the launch of Marxan in the early 2000s, Marxan with Zones was created, which allows the integration of multiple uses in multiple planning zone. For instance, regions within the same proposed conservation area can be categorized using different zones such as no-take, or fishing limited by gear type [45], or subsistence fishing may be categorized as a cost in one zone and a target in a different zone [46]. This development helped nuance the way both ecological and social features were considered in conservation planning.
With the expanding knowledge and use of Marxan, social variables have been considered alongside ecological variables in the reserve design process [47,48,49]. Including accurate data in Marxan of the location and intensity of human presence is seen as a critical factor in creating cost-effective and socially acceptable MPAs [50,51,52,53]. We hope that our heuristic can help conservation efforts go beyond achieving a conservation outcome that is acceptable to one that is desired by local stakeholders.
While Marxan is but one step within a broader SCP process, our review focuses narrowly on Marxan because of its power in shaping decisions regarding the location and size of a protected area network. Our review does not, however, analyze the way in which conservation practitioners integrate socialscape features and processes into the broader systematic conservation planning, which typically contains anywhere from six to sixteen steps and is often iterative and takes place over the span of years if not decades [1,2]. There are numerous challenges to integrating social features into planning software such as Marxan. These range from limited data availability to the significant amount of time it takes to engage stakeholders in land/seascape planning [7,49,54]. Furthermore, Marxan and analogous planning software is highly technical, and it requires significant training to use and thus presents a barrier to entry for those who are often most reliant on and familiar with the environments targeted for conservation [7].
Lastly, our review does not consider the specific objectives of each study, nor whether and how the prioritization outputs were intended to inform actions in each case. Future research [49] could build on this framework to analyze more deeply the congruence between research goals and the social features and processes used within each case study.
Our analysis is heuristic and not deterministic. The framework we advance here offers a lens on how conservation planners can integrate social values, rights and interests in the land and seascape both within and beyond the highly technical use of Marxan within the broader conservation planning process.

2. Materials and Methods

2.1. Database

This review relied on a detailed search ending on 19 August 2020 of key words using Google Scholar and ProQuest Summon Search. We selected these databases because they are the most frequently used scholarly search platforms [55] and highlight primarily peer-reviewed literature instead of grey literature (e.g., non-governmental reports) or white literature (e.g., private sector reports), which are generally less known by and/or less accessible to the public.
All selected items had to contain the word “Marxan” in the title or text of the document. We further narrowed this group to documents that contained any of the following exact phrases “marine reserve”, “marine protected area”, or “marine conservation”, and lastly narrowed our search further by only including studies with any of the following exact phrases: “case study”, “social”, “socio-economic”, or “human”.
These terms were searched for in English-language studies, resulting in a collection of documents from 2005 to the summer of 2020. We did not find any articles prior to 2005 that met our criteria, and we stopped in 2020 to start our analysis, which started in late 2021 and took over a year to complete. A total of 778 studies were retrieved using these search words. These studies were further culled by reviewing abstracts and methods sections to exclude purely theoretical models and thought pieces on spatial planning that were not grounded in data from a particular place, case studies that did not include any socio-economic cost layers, or comparisons of previous studies that offered no new nuances to existing data. We omitted studies that did not include any social cost layers to narrow our field to research committed to engaging (at least in part) the socialscape. We accounted for boundary length modifier (BLM) as a social parameter when the authors specifically state it to be a proxy for a social concern such as management feasibility. However, we did not include studies that only included area as a cost without a stated social reasoning. This resulted in a total of 89 studies. We read each article and book chapter to determine what social features and processes were used in Marxan or Spexan (SPEXAN, which stands for spatially explicit annealing, was the precursor to Marxan and was based on the program SIMAN, written at the University of Adelaide; see Ball et al. (2009) [44]) analysis. Our aim to study the spatial prioritization stage of SCP resulted in our selection priorities and the omission of grey literature from the search process.
We included book chapters and journal articles but chose not to include grey literature (organization reports, memos, etc.). While some reports from conservation organizations emerge on search engines such as Google Scholar, many do not and would be arbitrarily left out of analysis. Tracking down a comprehensive sample of reports by marine conservation practitioners using Marxan would entail a different, and much more network-based, approach to obtaining articles (for a useful database that partially does this, see http://database.conservationplanning.org/ accessed on 19 January 2024).

2.2. Categorization and Analysis

To categorize the way in which social features and processes are integrated by researchers into Marxan, we came up with nine variables across four categories (Table 1 and Table S1). The first three categories, namely, Stakeholder Involvement, Underlying Drivers, and Rights and Access, were each divided into two sub-categories. We used each sub-category (e.g., resource user participation under the Stakeholder Involvement category) to evaluate and rank each study from 0 to 3. For example, if a study did not mention any engagement with stakeholders, it received a zero in that sub-category.
The fourth category, Marxan Inputs, helped us analyze how researchers used the Marxan software to consider the socialscape. Geographic data of social features are categorized as either costs or targets within Marxan, and researchers set parameters within Marxan that may or may not explicitly consider social features or processes. These data are discrete and thus countable (e.g., a study that avoids siting reserves next to ports and targets sites adjacent to tourist lodging would receive a count of 1 for both the social costs and social targets). Each study received a summed total calculation from the reported variables in each count category (costs, targets, and parameters) and was scored from 0 to 3 for each rank category.
We considered studies that ranked higher in our three rank categories and included more count variables as more “socially nuanced”. Codifying, categorizing, and spatially representing intersecting and overlapping human uses, values, and goals in a land- or seascape is a complex and challenging endeavor; however, striving for accurate, context-specific, and detailed accounts of social features and processes within these spaces is essential for developing conservation plans that are cost-effective, ecologically sound, socially desirable, and socially just.
Stakeholder Involvement, the first of our three ranked categories, included both resource user participation (participation) and the source and local validity of the social data collected (data source). We base this category of analysis on research that shows that participatory science and management models that engage resource users in decision-making processes are essential to both ethical and effective conservation interventions, and they help start to dismantle the knowledge hierarchies that continue to shape conservation practices [3,17,56,57].
Our second category of analysis focuses on underlying or distal drivers of human use and value in a land- or seascape, which we consider across time (temporal change) and space (multi-scalar). Human geographers, political economists, and political ecologists emphasize the importance of understanding underlying drivers of resource use and ecological change because these drivers, often distal to a given location, can undermine conservation intervention and lead to unforeseen and detrimental social, economic, and political outcomes [19,58,59,60]. These drivers can vary widely and may include anything from factors such as access to markets and global price fluctuations to projected deforestation rates based on trade negotiations that will lead to increased sedimentation of corals in a downstream area. Distal drivers are often overlooked because they are complex and difficult to measure; however, they are nonetheless essential to addressing obstacles to more sustainable human–nature relations [31]. Climate change was included within this category, even though it contrasts with other social features included in the dataset that tend to be more proximately derived, such as local fishing or tourism. Climate change, while anthropogenic in origin, cannot be quantified from direct use of coastal resources. Instead, it often integrated into Marxan as a socially derived biophysical feature that leads to proximate outcomes such as coral bleaching, although ocean-wide effects were also measured [61].
Our third category of analysis focuses on rights and access, which we consider in terms of whether marine reserve goals are oriented to enhance access to marine resources and/or provision ecosystem services to local resource users (local provisioning and access) and how marine property (e.g., local rights or territorial claims) is recognized and integrated into marine reserve design. Researchers from a variety of disciplinary backgrounds emphasize the importance of understanding how protected areas map onto rights and access in the marine realm. There is a rich and detailed literature focused on marine property systems across the globe [62,63,64,65,66,67,68]. Many coastal communities do not have formal marine tenure or marine property regimes legible to conservationists, often either erased by processes of colonization or thought to not exist at all [22,69]. Therefore, we use the term marine property broadly, defined primarily in terms of historical access and use, which may or may not have through custom or law been “exclusionary, transferable, and enforceable” [69,70]. Recognizing and accounting for marine property systems is essential to both ethical approaches to and effective outcomes of conservation [18,19,57,71].
Our fourth category was focused on the total number of social cost variables, target variables (which also include negative social costs), and social parameters. The importance of including nuanced social costs data in conservation planning efforts is widely recognized in the SCP literature [49,72,73,74]. Social costs in Marxan reflect the negative impact reserve placement would have on resource harvest value, cultural value, spiritual value, or other elements of human interests and needs [44]. Marxan is designed to minimize these costs. Generally, costs are combined into a single index, or run independently under separate planning scenarios. Social targets, similar to biodiversity or habitat-specific targets, are the amount of each social feature (e.g., traditional fishing grounds) that the software is instructed to select. We categorized negative social costs also as “targets”, given that they provide a positive weighting for a given planning unit in Marxan. Social targets entered into Marxan with Zones allows conservationists to allot specific action and objectives to certain units rather than defining them simply as “reserved” or “unreserved”. Zones allow researchers to consider social features and processes with more nuance by selecting “for” certain social targets, such as fishing spots of cultural or religious significance that correlate with areas of high biodiversity, instead of selecting “against” all fishing (including it as a cost) within Marxan. Social parameters relate to how users set up the software, which includes things such as defining the target region (e.g., excluding an area from analysis) and determining the boundary length modifier (BLM), which shapes the aggregation or clumping of selected units.
Social cost and target counts were categorized into meta-categories to look for commonalities across papers (Table S1) and quantified based on the total number of reported social variables researchers added to their cost or target layers. A handful of studies used a human impact cost layer [34,75], which used a large variety and number of social features to generate the cost layer. In these cases, we used the total number of social variables that were combined to form a single index. Social parameters additionally quantified “shadow” social features and processes embedded in the technical application of Marxan such as exclusion of planning units containing artificial habitats (piles, marina, and rock wall) associated with industrial and commercial purposes (e.g., Banks et al. [76]), or “locking in” or “locking out” certain areas due to stakeholder preference (e.g., Ban et al. [77]). Consideration of social parameters highlights the biases and assumptions that researchers may rely on when using Marxan. Furthermore, it underscores how these kinds of software-based customizations increase the variability in how Marxan is applied.
There are many ways these categories intersect and overlap; thus, their separation is more heuristic than deterministic. The categories emphasized here illustrate that planning for the needs and rights of humans in seascapes alongside the threats to biodiversity caused by human use is a critical part of conservation planning that will ultimately help attenuate inevitable human-caused threats and improve protected area outcomes [78,79,80].
We examined how the number of cost, target, and parameter variables included in each publication changed over time. To do this, we used a generalized linear model with a Poisson error term and year as the only predictor variable. We used a series of logistic models (one for each variable) to study whether the inclusion of the six social sub-category ranks (participation, data source, temporal change, scale, marine property, and provisioning) changed over time. Ordinal regression, which accounts for different levels of inclusion of the six social category ranks, showed the same qualitative findings as logistic regression. Thus, we only present the results of logistic regression in the main text and include the ordinal regression results in the Supplementary Materials (Figures S1–S5). For both sets of models, we examined residual plots to ensure model assumptions (e.g., normality of residuals, heterozygosity) were met. To examine the relationship between the social category rank variables, we examined pairwise correlations between each variable and used Spearman’s test for significance (p < 0.05). All analyses were conducted in R version 4.2.2 [81]. We used the “ordinal” package [82] for the ordinal regression results in the Supplementary Materials.

3. Results

There were 28 meta-categories of social variables included by researchers in our database (see Table S1), the most common three variables being commercial fishing (n = 55), artisanal fishing (n = 33), and tourism (n = 26).
Qualitative assessments of six ranked social variables (variable “data” given that it was included in every study) indicated no significant increase over time, except for studies integrating temporal change (Figure 2). Specifically, the odds that a study included temporal change increased by 1.13 each year (exp(β) = 1.13, p = 0.045). A cluster of studies in 2015 and 2016 scored higher than the average ranks per year in the rest of the dataset across four variables: scale, temporal change, data source, and provision (Figure 2). This cluster shapes the slight but not significant increase in the total number of Marxan publications in our database relative to total number of Marxan studies over time (Figure S6).
The social variable in which the greatest number of studies ranked above zero was social data source, followed by temporal change and scale (Figure 3). The social variables in which the fewest studies ranked above zero included marine property, provision, and participation. There was no significant increase in the aggregate value of rank scores per study across time (Figure S7).
The correlation plot between rank variables illustrates that there were some trade-offs among the six variables. The strongest of these occurred with the temporal variation variable, where studies that ranked high in terms of integrating temporal variation in their studies tended to rank lower in marine property and provisioning (Figure 4), but this was also non-significant. The strongest correlation occurred between participation and consideration of marine property (Figure 4). Studies that ranked well in relation to the socialscape category of Participation tended to rank high across all other variables.
Articles that scored higher across multiple rank categories tended to include selecting both for and against particular social features in a seascape. While some of the social features integrated as a target or negative cost served local uses categorized broadly as “community interest” or “cultural sites” [72,83], others explicitly served non-local uses considered less threatening to biodiversity conservation such as “research facilities” [48], “tourism infrastructure” [48,72,84], and “dive sites” [72,83].
The sum of cost variables used within our dataset increased by 5% each year (exp(β) = 1.05, p < 0.001). Prior to 2009, there were no studies in our database with more than five cost variables (Figure 5a). The sum of negative social cost/target variables used per study decreased significantly (exp(β) = 0.89, p < 0.001) over time (Figure 5b). However, the total number of negative social costs/social target variables is small, approximately 1/10th the sum, of regular social costs. The total social parameter variables used also did not significantly change over time (Figure S8).

4. Discussion

A growing number of studies demonstrate the importance of integrating social features and processes into systematic conservation planning [8,74,85,86]. Attention paid to socioeconomic and political realities can produce significantly different conservation assessments as compared to prioritizing biological targets [10]. Integrating social features and processes will determine the long-term success of an MPA as well as whether people whose livelihoods and cultural identity are tied to a marine environment benefit or are harmed by conservation efforts. Within the Marxan literature, scholars recognize the importance of considering and integrating social features and processes into conservation planning, and a subset of scholars have long called for better integration of social variables into the spatial planning process [7,72,87]. Given this recognition, we hypothesized that we would see an increase in both quantity and quality of social variables and processes represented in the dataset over time. Despite immense advances in spatial planning research and improved computational capacity of Marxan, this review shows that, collectively, researchers are not making parallel improvements in the nuance with which they integrate social features and processes into marine reserve design. While social nuance may, or may not, be considered later in the planning process, the omission of important social features and processes within the spatial prioritization process using Marxan will not only result in less robust spatial analysis but may also lead to incongruity across different stages of conservation planning, thus impacting long-term sustainability of conservation efforts. Additionally, in the face of climate change, it is essential that researchers work to analyze variables across space and time, analyzing distal as well as proximate social drivers of change over time.
Our work here compliments the analysis conducted by Alvarez Romero et al. [74], which examined researchers’ use of socioeconomic variables in SCP over time. Our analysis looks at a broader array of social features and processes, however we narrowly focused our analysis on just one key step, the use of Marxan, within SCP. Taken together, these two papers show the need to better nuance and improve the way in which the socialscape is integrated into all stages of conservation planning.
Given the growing number of studies showing why social variables and processes matter to conservation outcomes, it is a positive sign that there was a slight increase in the number of social cost variables used per study over time (see Figure 5). This slight improvement stands in contrast to the small and decreasing number of target variables integrated into Marxan-related research, despite the introduction of Marxan with Zones in 2009. The introduction of the Marxan with Zones extension was to provide researchers with the ability to improve the nuance with which they apply ecological and social target to spatial planning by assigning zones to land parcels specifying their contribution to planning targets, rather than simply categorizing each unit as reserved or unreserved (Figure 5) [45]. The practicality and efficiency of using Marxan to provide a useful starting point for conservation efforts has been widely recognized; however, little research has been conducted to understand whether the stated goals of Marxan with Zones are realized in practice. Some conservation practitioners feel that the added complexity associated with Marxan with Zones makes interpretation of its output more difficult, an observation that contradicts the explicitly stated goals of Marxan with Zones [45] but speaks to a broader question of who and what benefits most from the use of highly technical DSTs like Marxan for conservation planning. The added complexity of Marxan with Zones conveyed by planners might account for the statistically significant negative relationship of social targets with time (see Figure 2).
While there was a general lack of improvement in ranked variables over time, the slight improvement in count variables illustrates that more researchers are trying to account for broad human-mediated changes over time in the marine environment (Figure 2). Some studies that ranked high for the temporal variable modeled dynamics such as land use change and its projected impact on coral reefs, e.g., [32]; however, the majority integrated the increasingly alarming and politically salient problem of climate change into their marine spatial planning [88,89,90]. While this is heartening in some regards, climate change is often represented in terms of biophysical features in the land and seascape, thus likely overlooking important human processes related to risk, resilience, and recovery [61].
The lack of improvement over time with the other five ranked variables indicates that there are either resource-specific challenges or a general lack of awareness relating to these variables. The socialscape category Stakeholder Involvement represented both the highest and lowest total ranking on the spectrum (Figure 3). Numerous studies went beyond using proxies and integrated some regionally or locally specific ground-truthed social data; however, few directly engaged resource users in decision making. For example, 13 of the 89 studies relied on human impact indices to integrate multiple social variables into their studies. The most widely used index was created by Halpern et al. in a study that performed a cumulative impact assessment compiling ecosystem data alongside human activity to assess regional vulnerabilities [34,75]. Some studies used the entirety of Halpern’s human impact layer to represent social costs in Marxan [91], while others used single layers of the index such as shipping lanes [92] or artisanal fishing [93]. While human impact indices provide a relatively easy way for researchers to integrate temporal and macro-level social processes, it was rare for them to be included alongside participant engagement, demonstrating that they pose a risk for reliance on global quantitative trends over ground-truthed patterns of human preference and involvement. Additionally, the reliance of many studies on this index suggests the lack of available nuanced data for both social and ecological patterns in the marine environment, an issue compounded by the data-demanding nature of Marxan [49,94,95,96].
Studies that ranked high in participation tended rank well across all other variables and consider a holistic range of social costs that influence marine systems, as opposed to just extractive activity such as fishing, and they tended to use higher-resolution, directly observed data. Several articles stand out for their multi-faceted and nuanced social approach to marine spatial planning. They integrated numerous social costs and targets into Marxan, directly engaged local stakeholders in participatory mapping, and solicited input from stakeholders at multiple levels and at multiple points in the planning process. For example, Ban et al. [77] outlined a comparative analysis of community-based versus science-based approaches to marine conservation in the traditional territories of the Gitga’at First Nation and the Huu-ay-aht First Nation. The values and interests of local resource users, obtained from interviews and community-wide meetings, guided the goals and priorities embedded in the Marxan analysis. This case was regarded as successful by both conservation planners and resource users in the area and has since been wrapped into broader regional efforts that center indigenous voice and rights within marine spatial planning efforts [97,98,99]. Wendt et al.’s [100] work in Fiji integrated a wide variety of social features and processes with the inclusion of cost and target layers related to cultural use, subsistence fishing, feasibility of enforcement, and disputed areas. Their data were obtained through participatory mapping and community-wide workshops. Additionally, workshops separated stakeholders into sub-categories, such as subsistence fishers, commercial fishers, environmental groups, community leaders, and women, before using participatory mapping to identify priority areas for conservation.
A siting process lead by [92] in South Africa was notable for its inclusion of a wide range of stakeholders that considered conservation and marine use priorities across multiple scales, including interviews of conservation scientists, urban planners, and representatives from the commercial fishing and recreational sectors. Their process of multi-scale stakeholder involvement lasted nearly a decade before Marxan was even introduced into the siting process. By employing analysis that attempted to identify both proximate and distal drivers of marine resource use, an element of social justice entered conservation planning by shifting some of the responsibility for habitat degradation and over-extraction from local users to distal factors at national and international levels. This case was somewhat unique in our dataset and suggests that more research is needed that directly attends to how scale affects the elements of socialscape ecology that are integrated into protected area design and how this might influence reserve effectiveness.
The studies that ranked highest in our assessment often indicated that their analysis was oriented towards implementation, rather than primarily a contribution to SCP theory or academic debates. Because of our omission of grey literature, which is often written by conservation organizations focused on implementation, our results may underestimate the nuance with which social features and processes are integrated, pre- and post-Marxan analysis, into SCP. Additionally, our categorization of each study’s social rank relied upon our judgements and thus introduced some level of bias and subjectivity in our results. A review of the use of SCP in European waters noted that social features and processes were absent or underrepresented in SCP oriented explicitly for implementation, instead prioritizing ecological goals over stakeholder buy-in [52]. While we understand that social processes were not the focus of many of our studies, proving scientific defensibility for real-world implications of theoretical studies requires that conservationists are just as attuned to social processes—even those working at much larger scales than the proposed MPA—as they are to ecological ones, and that including social features and processes in published research is necessary both to advance conservation planning outcomes and to account for human values and trade-offs as a standard best practice for the use of Marxan [7].
Many articles that scored high across multiple ranked categories also included a higher number of social cost variables; however, this was not always the case. For example, Habtermariam and Fang [101] included three cost variables: non-consumptive tourism, cultural sites, and subsistence fishing. However, the detail and content of these data layers demonstrated that the authors were thinking holistically about the needs and desires of the people who lived in the target area. To approximate non-consumptive tourism, the presence/absence of swimming and snorkeling areas was included in analysis. Cultural uses were provisioned through the inclusion of archeological and religious sites, and subsistence fishing was spatialized through participatory mapping with resource users that engaged with stakeholders at multiple points throughout the siting process.
By identifying social parameters present in studies, we sought to quantify the “shadow social variables” embedded in how researchers use Marxan. Examples include “locking out” planning units containing artificial habitats (piles, marina, and rock walls) [76] or “locking in” planning units due to stakeholder preference [49] and reduced management costs adjacent due to proximity to other MPAs [33]. While the social parameter count did not vary significantly over time (Figure S8), it is unclear if this trend is correct or if it is due to inadequate sampling. The social parameters variable helps underscore the black-box nature of technically complex software like Marxan and emphasizes the ways in which these often “hidden” parameters shape Marxan output. Only social parameters that were explicitly mentioned in papers were recorded in our database. It is likely that other researchers modified parameters in Marxan that involved social processes and did not mention it. For example, management concerns such as monitoring costs and enforcement feasibility influence how researchers configure boundary-length modifiers (BLMs) [102]. However, few researchers were explicit about their rationale for the BLM parameters they set. Clearly reporting parameters is one way current Marxan users can improve transparency regarding a seemingly mundane decision that can influence socialscape outcomes.
As previously noted, many of the studies we included in this review do not claim to be creating MPAs for immediate implementation, a factor influenced by our decision to omit grey literature. Some of the case studies we included state that they are for demonstration or theoretical purposes only [73]. However, all studies included in our review analyzed real data from case studies around the world and make claims about the relevance of their findings to conservation in practice. Similarly, some of our more theory-driven case studies narrow the number and kind of social variables they included to match a specific goal in their analysis. We recognize the limitations of our scoring system that broadly suggests that “more is better”, where studies with higher number of social variables rank higher overall. Additionally, summing count categories does not control for the underlying contextual differences where researchers conduct Marxan analysis. For example, highly urbanized areas may have more cost layers than remote areas due to a greater presence of human-created features and social processes in the land/seascape. This potential bias could be tested in future research but is a notable limitation of our study. When considering ecological data, a similar rule of thumb exists arguing that more and varied ecological data that account for ecosystem complexity and interconnection afford greater analytical power and nuanced output in conservation planning [103]. We argue that this same tenant holds for social systems and that social features and processes, like ecological ones, should be numerous, de-aggregated, and as detailed as possible. However, while we believe the number of variables is an acceptable shorthand for social nuance, future research could analyze the total number and category of social variables within a given study relative to the study’s purported goal. Ultimately, developing and nuancing analysis of the marine socialscape will strengthen the legitimacy, sustainability in the face of climate change, and desirability of conservation planning globally [35,36,37].

5. Conclusions

Given that humans are a critical part of ecosystems globally, conservation objectives will be more efficiently and effectively achieved through the integration of a socialscape analysis. The process of investigating and integrating elements of the socialscape in conservation planning will help guard against uncertainty and create more socially acceptable and sustainable conservation strategies. Our findings also speak to the importance of establishing best-practice guidelines for Marxan within the broader SCP process [85]. One major difficulty, similar to the uncertainty in biological models, is that many social features and processes are dynamic, multi-faceted, and interdependent. Layering various components of the socialscape into the spatial prioritization process of conservation planning adds additional uncertainty to the process but remains an imperfect best option to a lack of integrating social features and processes.
Beyond parameters set in Marxan, there are broad concerns over the black-box nature of this decision-support tool. While proponents of Marxan argue that it is simply a tool to help conservation planners make informed decisions, others suggest that software like Marxan has the potential to exacerbate existing social inequalities given differences in scientific, computational, and technological literacy [3,8]. For example, Kirlin et al. [104] explain that the use of Marxan to design a marine protected area network for the California Central Coast [105] was legally rejected through the Marine Life Protection Act because it was “not sufficiently transparent to policy makers or stakeholders”. This legal issue emphasizes the risks involved in relying too heavily on Marxan and other highly technical DSTs without high levels of transparency and stakeholder involvement in setting the parameters of Marxan and informing what types of information are included in an analysis. This aligns with our broader argument that socialscape features and processes must be integrated into all stages of SCP, not relegated to a single layer within Marxan or a single moment in what others argue should be a long and iterative process of evaluation and planning [57,106]. The six rank categories outlined in this paper can help future researchers structure their consideration of these broader social values and political processes.
Our work uses Marxan as a case study to provide an initial framework for understanding how conservation scientists have categorized and incorporated social features and processes into spatial conservation planning. We hope conservation practitioners can use our heuristic framework (e.g., Table 1 and Figure 1) to think through possible blind spots or weaknesses in the ways they are integrating data into Marxan, or other comparable spatial prioritization software, and how people and the broader socialscape is factored into the spatial prioritization process. Lastly, we hope that other researchers improve on our analysis and add new facets of socialscape ecology to the framework we have outlined here in order to make conservation efforts more ethical and effective.

Supplementary Materials

The following supporting information can be downloaded at: https://www.mdpi.com/article/10.3390/su16146078/s1, Table S1: Metacategories Table. Figure S1: Output from ordinal regression of temporal social category versus year. Figure S2: Output from ordinal regression of scale social category versus year. Figure S3: Output from ordinal regression of property social category versus year. Figure S4: Output from ordinal regression of provision social category versus year. Figure S5: Output from ordinal regression of participation social category versus year. Figure S6: Total number of Marxan publications in our database relative to total number of Marxan studies over time. The studies contained in the “total Marxan pubs” were selected if they had “Marxan” in the title or text of the document and contained any of the following exact phrases “marine reserve”, “marine protected area”, and/or “marine conservation”, and “case study.” The studies eligible for our specific database also were required to have any of the following exact phrases: “social”, “socio-economic”, or “human.” (See methods description above for more detail). Figure S7: Total aggregate value of rank scores per study across time. Each study was evaluated across six categories and was ranked on a score from 0–3. The highest aggregate score a study could obtain was 18. The dark black curve (with corresponding grey standard error bands) represents the line of best fit from a generalized linear model with a Poisson error term. Figure S8: Total parameter count across all studies over time. The dark black curve (with corresponding grey standard error bands) represents the line of best fit from a generalized linear model with a Poisson error term.

Author Contributions

Conceptualization, M.B.-M.; methodology, M.B.-M., K.C. and S.M.; formal analysis, C.G. and E.R.W.; data curation, M.B.-M., K.C. and S.M.; writing—original draft preparation, M.B.-M., K.C., C.G. and E.R.W.; writing—review and editing, M.B.-M., K.C. and E.R.W.; visualization, M.B.-M., C.G. and E.R.W.; supervision, M.B.-M. and E.R.W.; funding acquisition, M.B.-M. and E.R.W. All authors have read and agreed to the published version of the manuscript.

Funding

This research was funded by NSF DEB, grant number 1923707. The APC was funded by Middlebury College.

Institutional Review Board Statement

Not applicable.

Informed Consent Statement

Not applicable.

Data Availability Statement

The original contributions presented in the study are included in the article/Supplementary Materials, further inquiries can be directed to the corresponding author.

Acknowledgments

We would like to thank Claire Kremen, Louise Fortmann, Nancy Peluso and Tom Allnutt for helping inspire the frameworks we outline here; and Mark Lapin for providing feedback on early draft. We also would like to thank three anonymous reviewers for their excellent help.

Conflicts of Interest

The authors declare no conflicts of interest.

References

  1. Margules, C.R.; Pressey, R.L. Systematic conservation planning. Nature 2000, 405, 243–253. [Google Scholar] [CrossRef]
  2. Adams, V.M.; Mills, M.; Weeks, R.; Segan, D.B.; Pressey, R.L.; Gurney, G.G.; Groves, C.; Davis, F.W.; Álvarez-Romero, J.G. Implementation strategies for systematic conservation planning. Ambio 2019, 48, 139–152. [Google Scholar] [CrossRef] [PubMed]
  3. St. Martin, K.; Hall-Arber, M. The missing layer: Geo-technologies, communities, and implications for marine spatial planning. Mar. Policy 2008, 32, 779–786. [Google Scholar] [CrossRef]
  4. Noble, M.M.; Harasti, D.; Pittock, J.; Doran, B. Linking the social to the ecological using GIS methods in marine spatial planning and management to support resilience: A review. Mar. Policy 2019, 108, 103657. [Google Scholar] [CrossRef]
  5. Cunningham, C.A.; Crick, H.Q.P.; Morecroft, M.D.; Thomas, C.D.; Beale, C.M. Reconciling diverse viewpoints within systematic conservation planning. People Nat. 2023, 5, 621–632. [Google Scholar] [CrossRef]
  6. Perschke, M.J.; Harris, L.R.; Sink, K.J.; Lombard, A.T. Systematic conservation planning for people and nature: Biodiversity, ecosystem services, and equitable benefit sharing. Ecosyst. Serv. 2024, 68, 101637. [Google Scholar] [CrossRef]
  7. Fortnam, M.; Chaigneau, T.; Evans, L.; Bastian, L. Practitioner approaches to trade-off decision-making in marine conservation development. People Nat. 2023, 5, 1636–1648. [Google Scholar] [CrossRef]
  8. Pınarbaşı, K.; Galparsoro, I.; Borja, Á. End users’ perspective on decision support tools in marine spatial planning. Mar. Policy 2019, 108, 103658. [Google Scholar] [CrossRef]
  9. Kockel, A.; Ban, N.C.; Costa, M.; Dearden, P. Addressing distribution equity in spatial conservation prioritization for small-scale fisheries. PLoS ONE 2020, 15, e0233339. [Google Scholar] [CrossRef]
  10. Adams, V.M. Costs in conservation: Common costly mistakes and how to avoid them. PLoS Biol. 2024, 22, e3002676. [Google Scholar] [CrossRef]
  11. Turner, M.G. Landscape Ecology: The Effect of Pattern on Process. Annu. Rev. Ecol. Syst. 1989, 20, 171–197. [Google Scholar] [CrossRef]
  12. Farina, A. Principles and Methods in Landscape Ecology: Towards a Science of the Landscape; Springer: Dordrecht, The Netherlands, 2008; Volume 3. [Google Scholar]
  13. Naveh, Z.; Lieberman, A.S. Landscape Ecology: Theory and Application; Springer: New York, NY, USA, 2013. [Google Scholar]
  14. Urban, D.L. Landscape ecology: A hierarchical perspective can help scientists understand spatial patterns. BioScience 1987, 37, 119–127. [Google Scholar] [CrossRef]
  15. Field, D.R.; Voss, P.R.; Kuczenski, T.K.; Hammer, R.B.; Radeloff, V.C. Reaffirming Social Landscape Analysis in Landscape Ecology: A Conceptual Framework. Soc. Nat. Resour. 2003, 16, 349–361. [Google Scholar] [CrossRef]
  16. Endter-Wada, J.; Blahna, D.; Krannich, R.; Brunson, M. A framework for understanding social science contributions to ecosystem management. Ecol. Appl. 1998, 8, 891–904. [Google Scholar] [CrossRef]
  17. Trouillet, B.; Bellanger-Husi, L.; El Ghaziri, A.; Lamberts, C.; Plissonneau, E.; Rollo, N. More than maps: Providing an alternative for fisheries and fishers in marine spatial planning. Ocean Coast. Manag. 2019, 173, 90–103. [Google Scholar] [CrossRef]
  18. Ribot, J.C.; Peluso, N.L. A Theory of Access. Rural Sociol. 2003, 68, 153–181. [Google Scholar] [CrossRef]
  19. Bennett, N.J. In Political Seas: Engaging with Political Ecology in the Ocean and Coastal Environment. Coast. Manag. 2019, 47, 67–87. [Google Scholar] [CrossRef]
  20. Précoma-de la Mora, M.; Bennett, N.J.; Fulton, S.; Munguia-Vega, A.; Lasch-Thaler, C.; Walther-Mendoza, M.; Zepeda-Domínguez, J.A.; Finkbeiner, E.M.; Green, A.L.; Suárez, A.; et al. Integrating Biophysical, Socio-Economic and Governance Principles Into Marine Reserve Design and Management in Mexico: From Theory to Practice. Front. Mar. Sci. 2021, 8, 778980. [Google Scholar] [CrossRef]
  21. Ban, N.C.; Gurney, G.G.; Marshall, N.A.; Whitney, C.K.; Mills, M.; Gelcich, S.; Bennett, N.J.; Meehan, M.C.; Butler, C.; Ban, S.; et al. Well-being outcomes of marine protected areas. Nat. Sustain. 2019, 2, 524–532. [Google Scholar] [CrossRef]
  22. Diver, S.; Vaughan, M.B.; Baker-Médard, M.; Lukacs, H. Recognizing “reciprocal relations” to restore community access to land and water. Int. J. Commons 2019, 13, 400–429. [Google Scholar] [CrossRef]
  23. Vaughan, M.B. Kaiaulu: Gathering Tides; Oregon State University Press: Corvallis, OR, USA, 2018. [Google Scholar]
  24. Berkes, F. Sacred Ecology; Routledge: New York, NY, USA, 2008. [Google Scholar]
  25. Winter, K.B.; Vaughan, M.B.; Kurashima, N.; Wann, L.; Cadiz, E.; Kawelo, A.H.; Cypher, M.; Kaluhiwa, L.; Springer, H.K. Indigenous stewardship through novel approaches to collaborative management in Hawai’i. Ecol. Soc. 2023, 28, 26. [Google Scholar] [CrossRef]
  26. Ostrom, E. A general framework for analyzing sustainability of social-ecological systems. Science 2009, 325, 419–422. [Google Scholar] [CrossRef] [PubMed]
  27. Cumming, G.S.; Allen, C.R. Protected areas as social-ecological systems: Perspectives from resilience and social-ecological systems theory. Ecol. Appl. 2017, 27, 1709–1717. [Google Scholar] [CrossRef] [PubMed]
  28. Pollnac, R.; Christie, P.; Cinner, J.E.; Dalton, T.; Daw, T.M.; Forrester, G.E.; Graham, N.A.J.; McClanahan, T.R. Marine reserves as linked social–ecological systems. Proc. Natl. Acad. Sci. USA 2010, 107, 18262–18265. [Google Scholar] [CrossRef] [PubMed]
  29. Mazor, T.; Doropoulos, C.; Schwarzmueller, F.; Gladish, D.W.; Kumaran, N.; Merkel, K.; Di Marco, M.; Gagic, V. Global mismatch of policy and research on drivers of biodiversity loss. Nat. Ecol. Evol. 2018, 2, 1071–1074. [Google Scholar] [CrossRef] [PubMed]
  30. Rohe, J.R.; Aswani, S.; Schlüter, A.; Ferse, S.C.A. Multiple Drivers of Local (Non-) Compliance in Community-Based Marine Resource Management: Case Studies from the South Pacific. Front. Mar. Sci. 2017, 4, 172. [Google Scholar] [CrossRef]
  31. Forster, J.; Turner, R.A.; Fitzsimmons, C.; Peterson, A.M.; Mahon, R.; Stead, S.M. Evidence of a common understanding of proximate and distal drivers of reef health. Mar. Policy 2017, 84, 263–272. [Google Scholar] [CrossRef]
  32. Tulloch, V.J.D.; Brown, C.J.; Possingham, H.P.; Jupiter, S.D.; Maina, J.M.; Klein, C. Improving conservation outcomes for coral reefs affected by future oil palm development in Papua New Guinea. Biol. Conserv. 2016, 203, 43–54. [Google Scholar] [CrossRef]
  33. Haupt, P.W.; Lombard, A.T.; Goodman, P.S.; Harris, J.M. Accounting for spatiotemporal dynamics in conservation planning for coastal fish in KwaZulu-Natal, South Africa. Biol. Conserv. 2017, 209, 289–303. [Google Scholar] [CrossRef]
  34. Halpern, B.S.; Frazier, M.; Potapenko, J.; Casey, K.S.; Koenig, K.; Longo, C.; Lowndes, J.S.; Rockwood, R.C.; Selig, E.R.; Selkoe, K.A.; et al. Spatial and temporal changes in cumulative human impacts on the world’s ocean. Nat. Commun. 2015, 6, 7615. [Google Scholar] [CrossRef]
  35. Mascia, M.B.; Brosius, J.P.; Dobson, T.A.; Forbes, B.C.; Horowitz, L.; McKean, M.A.; Turner, N.J. Conservation and the Social Sciences. Conserv. Biol. 2003, 17, 649–650. [Google Scholar] [CrossRef]
  36. Büscher, B.; Wolmer, W. Introduction: The Politics of Engagement between Biodiversity Conservation and the Social Sciences. Conserv. Soc. 2007, 5, 1–21. [Google Scholar]
  37. Bennett, N.J.; Roth, R.; Klain, S.C.; Chan, K.; Christie, P.; Clark, D.A.; Cullman, G.; Curran, D.; Durbin, T.J.; Epstein, G.; et al. Conservation social science: Understanding and integrating human dimensions to improve conservation. Biol. Conserv. 2017, 205, 93–108. [Google Scholar] [CrossRef]
  38. Venter, O.; Fuller, R.A.; Segan, D.B.; Carwardine, J.; Brooks, T.; Butchart, S.H.M.; Di Marco, M.; Iwamura, T.; Joseph, L.; O’Grady, D.; et al. Targeting Global Protected Area Expansion for Imperiled Biodiversity. PLoS Biol. 2014, 12, e1001891. [Google Scholar] [CrossRef]
  39. Boonzaier, L.; Pauly, D. Marine protection targets: An updated assessment of global progress. Oryx 2016, 50, 27–35. [Google Scholar] [CrossRef]
  40. Jantke, K.; Jones, K.R.; Allan, J.R.; Alienor, L.M.C.; James, E.M.W.; Possingham, H.P. Poor ecological representation by an expensive reserve system: Evaluating 35 years of marine protected area expansion. Conserv. Lett. 2018, 11, e12584. [Google Scholar] [CrossRef]
  41. IUCN; UNEP-WCMC. The World Database on Protected Areas (WDPA); UNEP-WCMC, Ed.; UNEP-WCMC: Cambridge, UK, 2019. [Google Scholar]
  42. Pınarbaşı, K.; Galparsoro, I.; Borja, Á.; Stelzenmüller, V.; Ehler, C.N.; Gimpel, A. Decision support tools in marine spatial planning: Present applications, gaps and future perspectives. Mar. Policy 2017, 83, 83–91. [Google Scholar] [CrossRef]
  43. Marxan. MARXAN Conservation Solutions. Available online: https://marxansolutions.org/ (accessed on 23 November 2020).
  44. Ball, I.R.; Possingham, H.P.; Watts, M.E. Marxan and relatives: Software for spatial conservation prioritization. In Spatial Conservation Prioritization: Quantitative Methods and Computational Tools; Moilanen, A., Possingham, H.P., Wilson, K.A., Eds.; Oxford University Press: Oxford, UK, 2009. [Google Scholar]
  45. Watts, M.E.; Ball, I.R.; Stewart, R.S.; Klein, C.J.; Wilson, K.; Steinback, C.; Lourival, R.; Kircher, L.; Possingham, H.P. Marxan with Zones: Software for optimal conservation based land- and sea-use zoning. Environ. Model. Softw. 2009, 24, 1513–1521. [Google Scholar] [CrossRef]
  46. Klein, C.J.; Steinback, C.; Watts, M.; Scholz, A.J.; Possingham, H.P. Spatial marine zoning for fisheries and conservation. Front. Ecol. Environ. 2010, 8, 349–353. [Google Scholar] [CrossRef]
  47. Stephanson, S.; Mascia, M. Putting People on the Map through an Approach That Integrates Social Data in Conservation Planning. Conserv. Biol. 2014, 28, 1236–1248. [Google Scholar] [CrossRef]
  48. Klein, C.J.; Chan, A.; Kircher, L.; Cundiff, A.J.; Gardner, N.; Hrovat, Y.; Scholz, A.; Kendall, B.E.; AiramÉ, S. Striking a Balance between Biodiversity Conservation and Socioeconomic Viability in the Design of Marine Protected Areas. Conserv. Biol. 2008, 22, 691–700. [Google Scholar] [CrossRef] [PubMed]
  49. Ban, N.C.; Hansen, G.J.A.; Jones, M.; Vincent, A.C.J. Systematic marine conservation planning in data-poor regions: Socioeconomic data is essential. Mar. Policy 2009, 33, 794–800. [Google Scholar] [CrossRef]
  50. Polasky, S. Why conservation planning needs socioeconomic data. Proc. Natl. Acad. Sci. USA 2008, 105, 6505–6506. [Google Scholar] [CrossRef] [PubMed]
  51. Ban, N.C.; Klein, C.J. Spatial socioeconomic data as a cost in systematic marine conservation planning. Conserv. Lett. 2009, 2, 206–215. [Google Scholar] [CrossRef]
  52. Smith, R.J.; Eastwood, P.D.; Ota, Y.; Rogers, S.I. Developing best practice for using Marxan to locate Marine Protected Areas in European waters. ICES J. Mar. Sci. 2009, 66, 188–194. [Google Scholar] [CrossRef]
  53. Lundquist, C.; Granek, E.F.; Bustamante, R.H. Implementation and management of marine protected areas-introduction. Conserv. Biol. 2005, 19, 1699–1700. [Google Scholar] [CrossRef]
  54. Lester, S.E.; Dubel, A.K.; Hernán, G.; McHenry, J.; Rassweiler, A. Spatial Planning Principles for Marine Ecosystem Restoration. Front. Mar. Sci. 2020, 7, 328. [Google Scholar] [CrossRef]
  55. Gusenbauer, M. Google Scholar to overshadow them all? Comparing the sizes of 12 academic search engines and bibliographic databases. Scientometrics 2019, 118, 177–214. [Google Scholar] [CrossRef]
  56. Burke, B.J.; Heynen, N. Transforming Participatory Science into Socioecological Praxis: Valuing Marginalized Environmental Knowledges in the Face of the Neoliberalization of Nature and Science. Environ. Soc. 2014, 5, 7–27. [Google Scholar] [CrossRef]
  57. Ban, N.C.; Frid, A. Indigenous peoples’ rights and marine protected areas. Mar. Policy 2018, 87, 180–185. [Google Scholar] [CrossRef]
  58. Lambin, E.F.; Turner, B.L.; Geist, H.J.; Agbola, S.B.; Angelsen, A.; Bruce, J.W.; Coomes, O.T.; Dirzo, R.; Fischer, G.; Folke, C.; et al. The causes of land-use and land-cover change: Moving beyond the myths. Glob. Environ. Chang. 2001, 11, 261–269. [Google Scholar] [CrossRef]
  59. Baker-Médard, M. Gendering Marine Conservation: The Politics of Marine Protected Areas and Fisheries Access. Soc. Nat. Resour. 2017, 30, 723–737. [Google Scholar] [CrossRef]
  60. Hicks, C.C.; Crowder, L.B.; Graham, N.A.; Kittinger, J.N.; Cornu, E.L. Social drivers forewarn of marine regime shifts. Front. Ecol. Environ. 2016, 14, 252–260. [Google Scholar] [CrossRef]
  61. Jones, K.R.; Watson, J.E.M.; Possingham, H.P.; Klein, C.J. Incorporating climate change into spatial conservation prioritisation: A review. Biol. Conserv. 2016, 194, 121–130. [Google Scholar] [CrossRef]
  62. Aswani, S.; Basurto, X.; Ferse, S.; Glaser, M.; Campbell, L.; Cinner, J.E.; Dalton, T.; Jenkins, L.D.; Miller, M.L.; Pollnac, R. Marine resource management and conservation in the Anthropocene. Environ. Conserv. 2018, 45, 192–202. [Google Scholar] [CrossRef]
  63. Seto, K.; Campbell, B. The last commons: (re)constructing an ocean future. In Predicting Future Oceans; Cisneros-Montemayor, A.M., Cheung, W.W.L., Ota, Y., Eds.; Elsevier: Amsterdam, The Netherlands, 2019; pp. 365–376. [Google Scholar] [CrossRef]
  64. Ruddle, K.; Hviding, E.; Johannes, R.E. Marine Resources Management in the Context of Customary Tenure. Mar. Resour. Econ. 1992, 7, 249–273. [Google Scholar] [CrossRef]
  65. Foale, S.; Manele, B. Social and political barriers to the use of Marine Protected Areas for conservation and fishery management in Melanesia. Asia Pac. Viewp. 2004, 45, 373–386. [Google Scholar] [CrossRef]
  66. Weeks, R.; Russ, G.R.; Bucol, A.A.; Alcala, A.C. Incorporating local tenure in the systematic design of marine protected area networks. Conserv. Lett. 2010, 3, 445–453. [Google Scholar] [CrossRef]
  67. Mascia, M.B.; Claus, C.A. A Property Rights Approach to Understanding Human Displacement from Protected Areas: The Case of Marine Protected Areas. Conserv. Biol. 2009, 23, 16–23. [Google Scholar] [CrossRef]
  68. Wilson, D. European colonisation, law, and Indigenous marine dispossession: Historical perspectives on the construction and entrenchment of unequal marine governance. Marit. Stud. 2021, 20, 387–407. [Google Scholar] [CrossRef]
  69. Aswani, S. Customary Sea Tenure in Oceania as a Case of Rights-based Fishery Management: Does it Work? Rev. Fish Biol. Fish. 2005, 15, 285–307. [Google Scholar] [CrossRef]
  70. Gruby, R.L.; Basurto, X. Multi-level governance for large marine commons: Politics and polycentricity in Palau’s protected area network. Environ. Sci. Policy 2013, 33, 260–272. [Google Scholar] [CrossRef]
  71. Vaughan, M.B.; Thompson, B.; Ayers, A.L. Pāwehe Ke Kai a’o Hā’ena: Creating State Law based on Customary Indigenous Norms of Coastal Management. Soc. Nat. Resour. 2017, 30, 31–46. [Google Scholar] [CrossRef]
  72. Ban, N.C.; Mills, M.; Tam, J.; Hicks, C.C.; Klain, S.; Stoeckl, N.; Bottrill, M.C.; Levine, J.; Pressey, R.L.; Satterfield, T. A social-ecological approach to conservation planning: Embedding social considerations. Front. Ecol. Environ. 2013, 11, 194–202. [Google Scholar] [CrossRef] [PubMed]
  73. Cheok, J.; Pressey, R.L.; Weeks, R.; Andréfouët, S.; Moloney, J. Sympathy for the Devil: Detailing the Effects of Planning-Unit Size, Thematic Resolution of Reef Classes, and Socioeconomic Costs on Spatial Priorities for Marine Conservation. PLoS ONE 2016, 11, e0164869. [Google Scholar] [CrossRef]
  74. Álvarez-Romero, J.G.; Mills, M.; Adams, V.M.; Gurney, G.G.; Pressey, R.L.; Weeks, R.; Ban, N.C.; Cheok, J.; Davies, T.E.; Day, J.C.; et al. Research advances and gaps in marine planning: Towards a global database in systematic conservation planning. Biol. Conserv. 2018, 227, 369–382. [Google Scholar] [CrossRef]
  75. Halpern, B.S.; Walbridge, S.; Selkoe, K.A.; Kappel, C.V.; Micheli, F.; D’Agrosa, C.; Bruno, J.F.; Casey, K.S.; Ebert, C.; Fox, H.E.; et al. A Global Map of Human Impact on Marine Ecosystems. Science 2008, 319, 948–952. [Google Scholar] [CrossRef] [PubMed]
  76. Banks, S.A.; Skilleter, G.A.; Possingham, H.P. Intertidal habitat conservation: Identifying conservation targets in the absence of detailed biological information. Aquat. Conserv. Mar. Freshw. Ecosyst. 2005, 15, 271–288. [Google Scholar] [CrossRef]
  77. Ban, N.C.; Picard, C.R.; Vincent, A.C.J. Comparing and Integrating Community-Based and Science-Based Approaches to Prioritizing Marine Areas for Protection. Conserv. Biol. 2009, 23, 899–910. [Google Scholar] [CrossRef]
  78. Richardson, E.A.; Kaiser, M.J.; Edwards-Jones, G.; Possingham, H.P. Sensitivity of Marine-Reserve Design to the Spatial Resolution of Socioeconomic Data. Conserv. Biol. 2006, 20, 1191–1202. [Google Scholar] [CrossRef]
  79. Naughton-Treves, L.; Holland, M.B.; Brandon, K. The Role of Protected Areas in Conserving Biodiversity and Sustaining Local Livelihoods. Annu. Rev. Environ. Resour. 2005, 30, 219–252. [Google Scholar] [CrossRef]
  80. Chan, K.M.A.; Pringle, R.M.; Ranganathan, J.A.I.; Boggs, C.L.; Chan, Y.L.; Ehrlich, P.R.; Haff, P.K.; Heller, N.E.; Al-Khafaji, K.; Macmynowski, D.P. When Agendas Collide: Human Welfare and Biological Conservation Cuando las Agendas Chocan: Bienestar Humano y Conservación Biológica. Conserv. Biol. 2007, 21, 59–68. [Google Scholar] [CrossRef] [PubMed]
  81. R Core Team. R: A Language and Environment for Statistical Computing; R Core Team: Vienna, Austria, 2022; Available online: https://www.R-project.org/ (accessed on 2 December 2023).
  82. Christensen, R.H.B. Ordinal-Regression Models for Ordinal Data. R Package Version 2022.11-16. 2022. Available online: https://CRAN.R-project.org/package=ordinal (accessed on 2 December 2023).
  83. Green, A.; Smith, S.E.; Lipsett-Moore, G.; Groves, C.; Peterson, N.; Sheppard, S.; Lokani, P.; Hamilton, R.; Almany, J.; Aitsi, J.; et al. Designing a resilient network of marine protected areas for Kimbe Bay, Papua New Guinea. Oryx 2009, 43, 488. [Google Scholar] [CrossRef]
  84. Giakoumi, S.; Grantham, H.S.; Kokkoris, G.D.; Possingham, H.P. Designing a network of marine reserves in the Mediterranean Sea with limited socio-economic data. Biol. Conserv. 2011, 144, 753–763. [Google Scholar] [CrossRef]
  85. McIntosh, E.J.; Pressey, R.L.; Lloyd, S.; Smith, R.J.; Grenyer, R. The Impact of Systematic Conservation Planning. Annu. Rev. Environ. Resour. 2017, 42, 677–697. [Google Scholar] [CrossRef]
  86. O’Connor, C.; Marvier, M.; Kareiva, P. Biological vs. social, economic and political priority-setting in conservation. Ecol. Lett. 2003, 6, 706–711. [Google Scholar] [CrossRef]
  87. Ardron, J.A.; Possingham, H.P.; Klein, C.J. Marxan Good Practices Handbook; Pacific Marine Analysis and Research Association: Victoria, BC, Canada, 2008; p. 149. [Google Scholar]
  88. Giménez, J.; Cardador, L.; Mazor, T.; Kark, S.; Bellido, J.M.; Coll, M.; Navarro, J. Marine protected areas for demersal elasmobranchs in highly exploited Mediterranean ecosystems. Mar. Environ. Res. 2020, 160, 105033. [Google Scholar] [CrossRef] [PubMed]
  89. Maina, J.M.; Jones, K.R.; Hicks, C.C.; McClanahan, T.R.; Watson, J.E.; Tuda, A.O.; Andréfouët, S. Designing climate-resilient marine protected area networks by combining remotely sensed coral reef habitat with coastal multi-use maps. Remote Sens. 2015, 7, 16571–16587. [Google Scholar] [CrossRef]
  90. McClanahan, T.R.; Maina, J.M.; Graham, N.A.J.; Jones, K.R. Modeling Reef Fish Biomass, Recovery Potential, and Management Priorities in the Western Indian Ocean. PLoS ONE 2016, 11, e0154585. [Google Scholar] [CrossRef]
  91. Klein, C.J.; Tulloch, V.J.; Halpern, B.S.; Selkoe, K.A.; Watts, M.E.; Steinback, C.; Scholz, A.; Possingham, H.P. Tradeoffs in marine reserve design: Habitat condition, representation, and socioeconomic costs. Conserv. Lett. 2013, 6, 324–332. [Google Scholar] [CrossRef]
  92. Lagabrielle, E.; Lombard, A.T.; Harris, J.M.; Livingstone, T.-C. Multi-scale multi-level marine spatial planning: A novel methodological approach applied in South Africa. PLoS ONE 2018, 13, e0192582. [Google Scholar] [CrossRef] [PubMed]
  93. Beger, M.; McGowan, J.; Treml, E.A.; Green, A.L.; White, A.T.; Wolff, N.H.; Klein, C.J.; Mumby, P.J.; Possingham, H.P. Integrating regional conservation priorities for multiple objectives into national policy. Nat. Commun. 2015, 6, 8208. [Google Scholar] [CrossRef]
  94. Ruiz-Frau, A.; Kaiser, M.J.; Edwards-Jones, G.; Klein, C.J.; Segan, D.; Possingham, H.P. Balancing extractive and non-extractive uses in marine conservation plans. Mar. Policy 2015, 52, 11–18. [Google Scholar] [CrossRef]
  95. Markantonatou, V.; Giakoumi, S.; Koukourouvli, N.; Maina, I.; Gonzalez-Mirelis, G.; Sini, M.; Maistrelis, K.; Stithou, M.; Gadolou, E.; Petza, D.; et al. Marine spatial plans focusing on biodiversity conservation: The case of the Aegean Sea. Aquat. Conserv. Mar. Freshw. Ecosyst. 2021, 31, 2278–2292. [Google Scholar] [CrossRef]
  96. Mazor, T.; Giakoumi, S.; Kark, S.; Possingham, H.P. Large-scale conservation planning in a multinational marine environment: Cost matters. Ecol. Appl. 2014, 24, 1115–1130. [Google Scholar] [CrossRef] [PubMed]
  97. Ban, N.C.; Bodtker, K.M.; Nicolson, D.; Robb, C.K.; Royle, K.; Short, C. Setting the stage for marine spatial planning: Ecological and social data collation and analyses in Canada’s Pacific waters. Mar. Policy 2013, 39, 11–20. [Google Scholar] [CrossRef]
  98. Short, C.; Smith, J.L.; Bones, J.; Diggon, S.; Heidt, A.; McDougall, C.; Pawluk, K.A. Marine zoning for the Marine Plan Partnership (MaPP) in British Columbia, Canada. Mar. Policy 2023, 152, 105524. [Google Scholar] [CrossRef]
  99. Diggon, S.; Butler, C.; Heidt, A.; Bones, J.; Jones, R.; Outhet, C. The Marine Plan Partnership: Indigenous community-based marine spatial planning. Mar. Policy 2021, 132, 103510. [Google Scholar] [CrossRef]
  100. Wendt, H.K.; Weeks, R.; Comley, J.; Aalbersberg, W. Systematic conservation planning within a Fijian customary governance context. Pac. Conserv. Biol. 2016, 22, 173–181. [Google Scholar] [CrossRef]
  101. Habtemariam, B.T.; Fang, Q. Zoning for a multiple-use marine protected area using spatial multi-criteria analysis: The case of the Sheik Seid Marine National Park in Eritrea. Mar. Policy 2016, 63, 135–143. [Google Scholar] [CrossRef]
  102. Stewart, R.; Possingham, H. Efficiency, costs and trade-offs in marine reserve system design. Environ. Model. Assess. 2005, 10, 203–213. [Google Scholar] [CrossRef]
  103. Fletcher, R.J.; Hefley, T.J.; Robertson, E.P.; Zuckerberg, B.; McCleery, R.A.; Dorazio, R.M. A practical guide for combining data to model species distributions. Ecology 2019, 100, e02710. [Google Scholar] [CrossRef] [PubMed]
  104. Kirlin, J.; Caldwell, M.; Gleason, M.; Weber, M.; Ugoretz, J.; Fox, E.; Miller-Henson, M. California’s Marine Life Protection Act Initiative: Supporting implementation of legislation establishing a statewide network of marine protected areas. Ocean Coast. Manag. 2013, 74, 3–13. [Google Scholar] [CrossRef]
  105. Klein, C.J.; Steinback, C.; Scholz, A.J.; Possingham, H.P. Effectiveness of marine reserve networks in representing biodiversity and minimizing impact to fishermen: A comparison of two approaches used in California. Conserv. Lett. 2008, 1, 44–51. [Google Scholar] [CrossRef]
  106. Adams, V.M.; Pressey, R.L.; Álvarez-Romero, J.G. Using Optimal Land-Use Scenarios to Assess Trade-Offs between Conservation, Development, and Social Values. PLoS ONE 2016, 11, e0158350. [Google Scholar] [CrossRef]
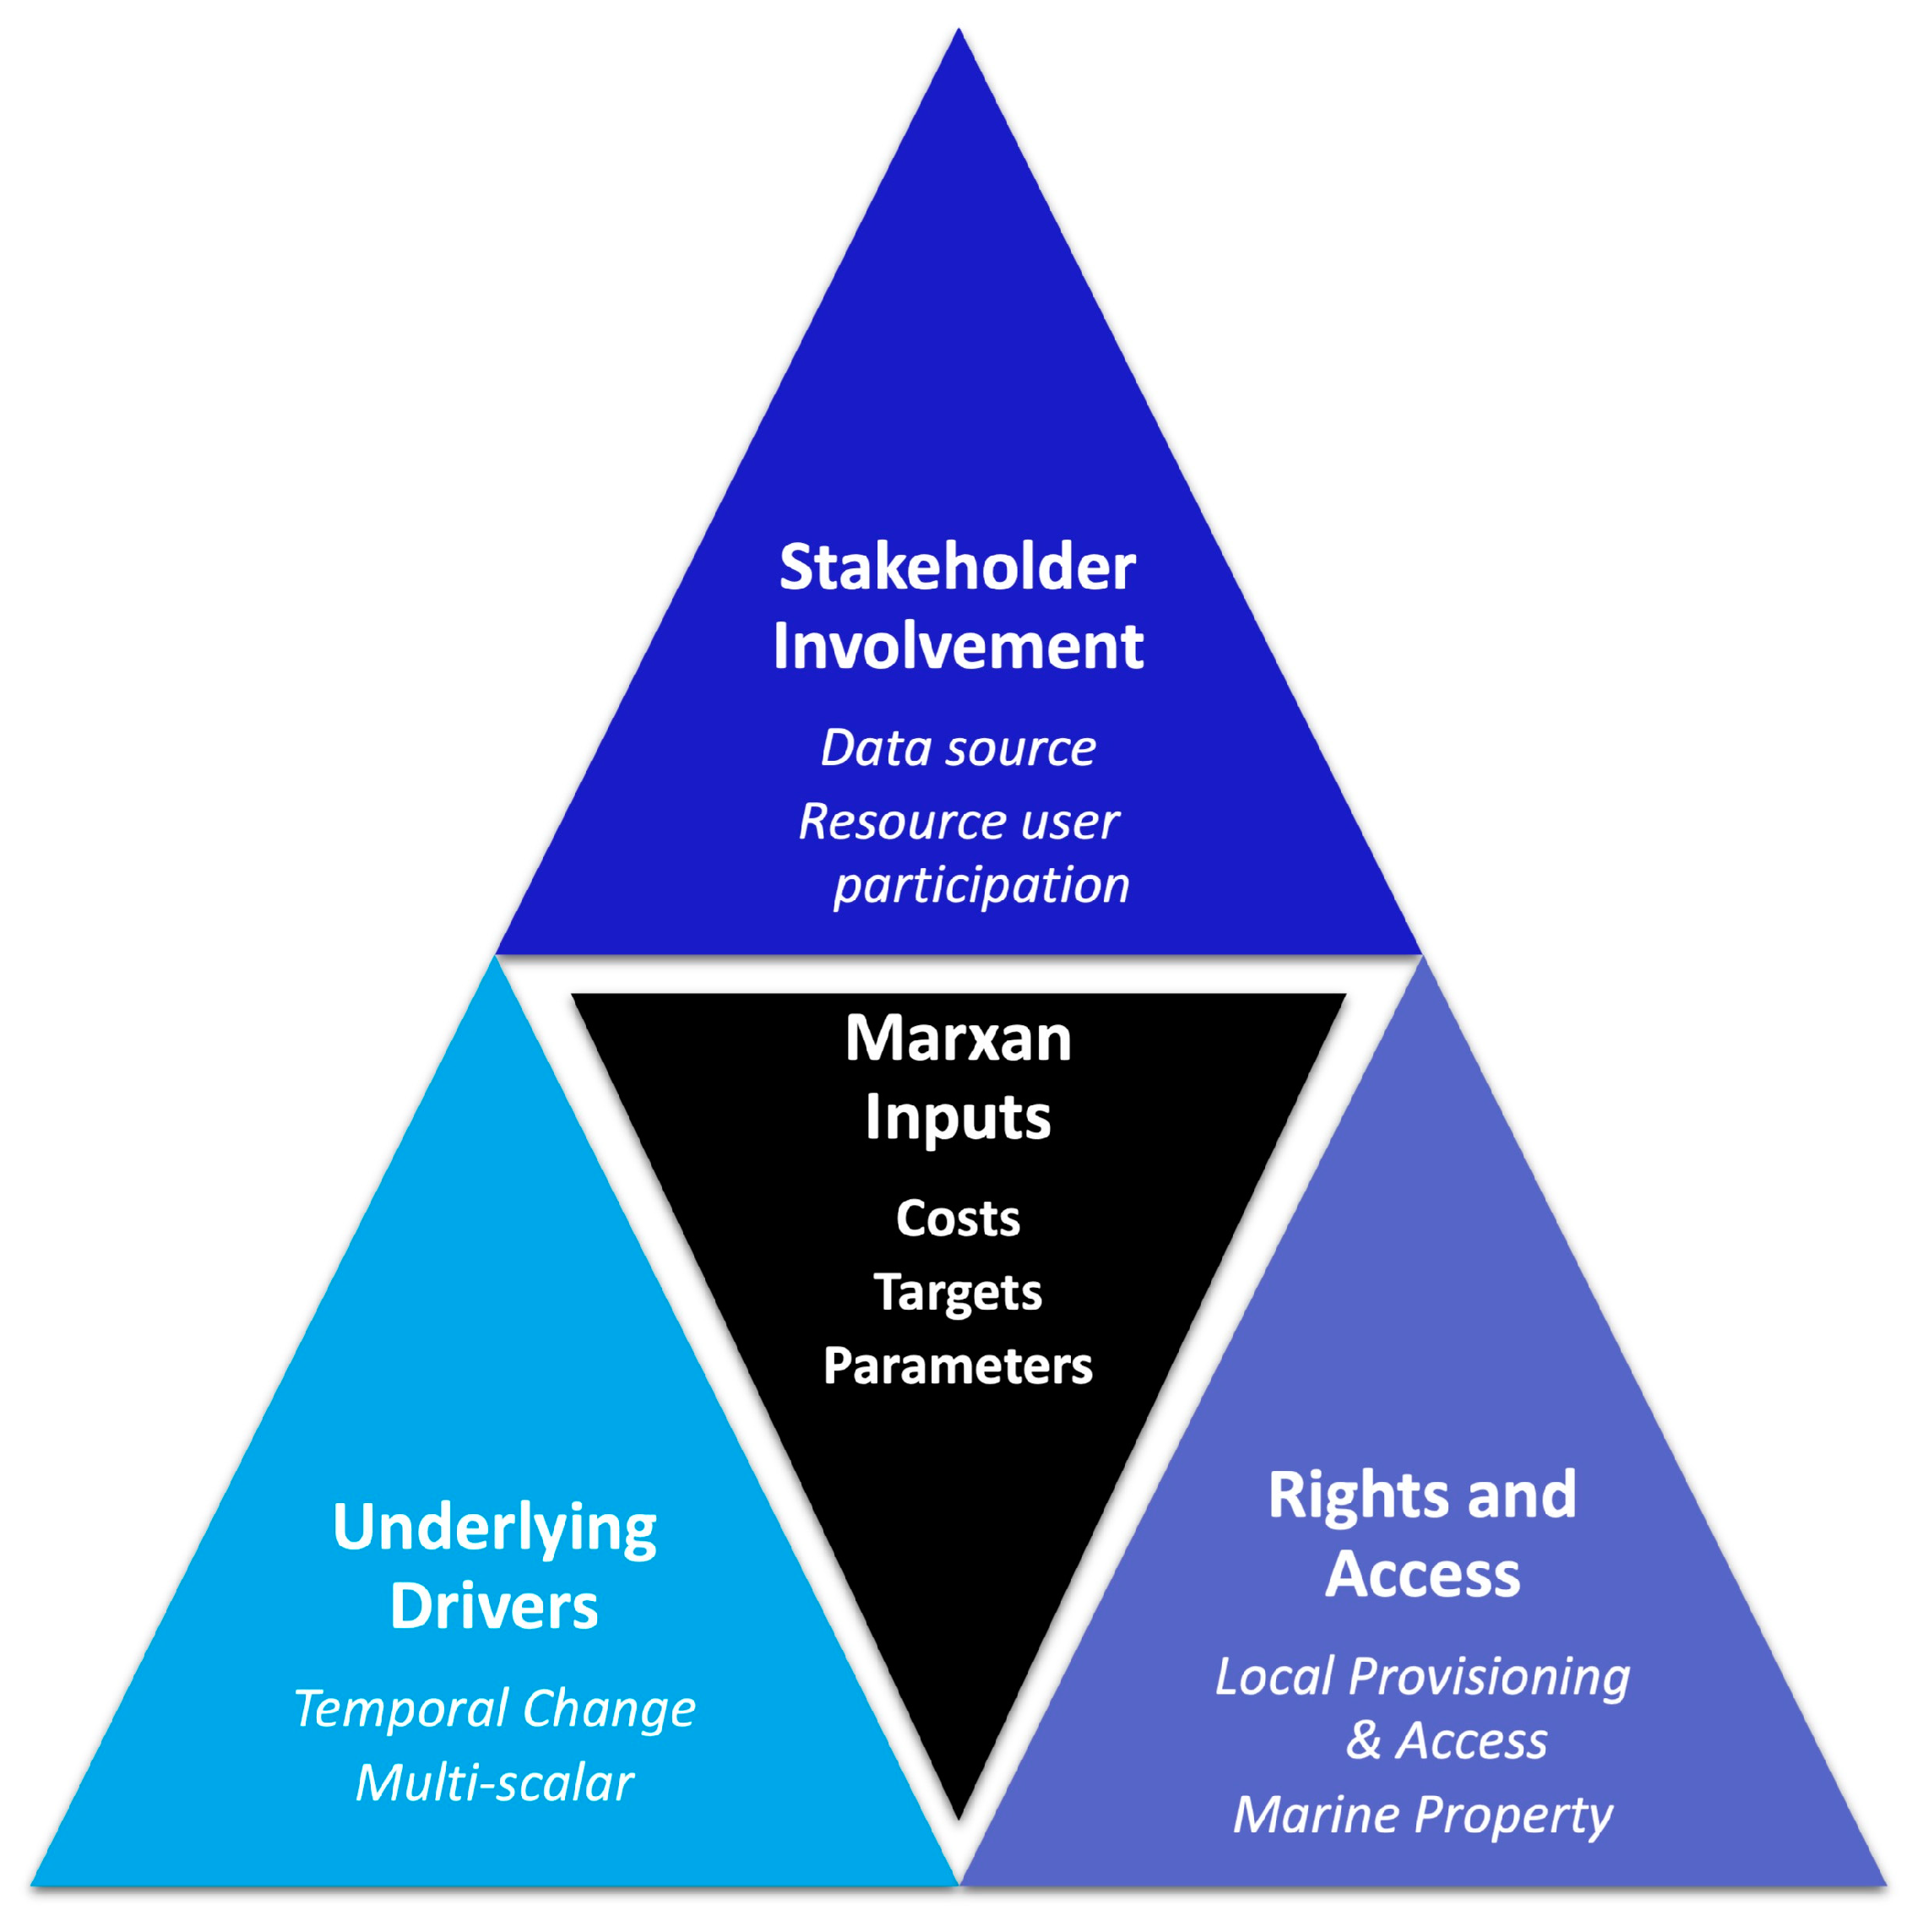
Figure 1. Socialscape ecology heuristic schemata as related to the spatially explicit decision-support tool Marxan. Each section operates iteratively between stakeholder involvement, assessing underlying social drivers of resource use, consideration of local resource users’ rights and access to marine resources, and how these inform how researchers input social variables into Marxan software (https://marxansolutions.org/software/, accessed on 19 January 2024). Rank variables are color-coded to match Table 1: data source and resource user participation correspond to the dark blue column Stakeholder Involvement, temporal change and multi-scalar analysis correspond to the light blue column Underlying Drivers, local provisioning and access and marine property correspond to the purple column Rights and Access. Count variables—costs, targets, and parameters correspond to the black column Marxan Inputs at the bottom of Table 1.
Sustainability 16 06078 g001
Figure 2. Probability of including the five social rank variables (temporal change, scale, marine property, provision, and participation) in a paper over time. Each study was initially ranked on a scale from 0 to 3 concerning how well they integrated each social feature or process. Each line then represents the best fitting curve (and corresponding 95% confidence interval, lighter shaded area around each line) from logistic regression. For both logistic regression and ordinal regression methods, only the temporal social variable had a significant positive relationship with year (p < 0.05), whereas scale (an integration of analysis at multiple scales) had a positive yet insignificant relationship with year. Property (the integration of property systems and use rights), provision (a focus on improving access to particular ecosystem services), and participation (the involvement of stakeholders in multiple facets of decision making) had insignificant negative relationships with year. The “data” social variable was not included here as it was present in every study, making the binary version only ones.
Sustainability 16 06078 g002
Figure 3. Number of studies with ranks of 0–3 across six social rank variables. Categories are ordered according to the number of studies with 0 as a value. All studies included some social data, a requirement for inclusion in our analysis, and studies performed the best with this variable: over half included ground-truthed data instead of remote proxies. Temporal, property, scale, and provision variables performed next best: 25–35% of the studies included some elements of socio-environmental change, some element of resource use and access patterns, data that reflected at least two scales, and a focus on at least one human benefit and not just cost of reserve placement. Participation performed the worst, with fewer than 15% of studies reporting direct participation of stakeholders in the spatial prioritization process.
Sustainability 16 06078 g003
Figure 4. Correlation plot between rank social variables illustrating the relative trade-offs among the six variables across all studies. Boxes with an X indicate no significance (Spearman’s test, p < 0.05). The strongest negative correlation (trade-off) was with temporal change. In aggregate, studies that ranked high in terms of integrating temporal variation ranked lower in marine property and provisioning. The strongest positive correlation was with participation, where overall studies that directly involved stakeholders also considered marine property systems, focused on provisioning local stakeholders, and considered both proximate and distal drivers of marine resource use.
Sustainability 16 06078 g004
Figure 5. Count variables showing (a) total cost counts and (b) total target counts for each paper over time. The dark black curves represent the best fit curve for a generalized linear model with a Poisson error term and year as the only predictor variable. The darker dots indicate multiple papers with the same value. Year had a significant positive relationship for cost (exp(β) = 1.05, p < 0.001) and significant negative for the target (exp(β) = 1.05, p < 0.001) response variable.
Sustainability 16 06078 g005
Table 1. Description of socialscape rank and count categories.
CategorySocial Nuance Rank
123
Stakeholder InvolvementResource user participationMinimal participation from stakeholders concerning reserve siting or the overall goals of the spatial prioritization process.Some engagement of stakeholders concerning different iterations of reserve network design.Deep engagement with local resource users and other stakeholders at every step of the process from helping shape the goals/priorities of the reserve or network, to helping determine what social data should be collected and analyzed, to weighing in different solutions produced by Marxan.
Data sourceRelied only on proxy data, such as distance from closest population center as a surrogate for fishing pressure. Used some social data that were ground-truthed or collected by researchers at a local or regional level. Data sources were specific to the sites in question, ground-truthed and recently collected. Common data sources in this category were surveys of local stakeholders, landings logbooks, VMS records, boat-based surveys, etc.
Underlying DriversTemporal changeConsidered some elements of social or socio-environmental change (e.g., climate change) through proxy factors such as sea surface temperature. Included some data from a significant period of time (e.g., more than a decade) that show temporal trends of resource use or other social processes.Included data from a significant period of time and explicitly referenced projected patterns of future resource use, resource conflicts, or other social factors influenced by environmental and/or social processes (e.g., land use change, deforestation, urbanization, etc.)
Multi-scalarFocused primarily on proximate drivers of marine resource use. Analyzed social processes primarily at one scale. Considered proximate and some ultimate drivers of marine resource use. Some input from stakeholders and experts at multiple scales from different backgrounds/fields. Included input from stakeholders at multiple scales (local, regional, and national) and experts from multiple fields. Considered both proximate as well as ultimate drivers of marine resource use (e.g., inclusion of global or regional human impact aggregates alongside regionally and locally specific social data collection).
Rights and AccessSea tenureIncluded some element of fisher or community resource use and access patterns. Recognized some elements of local marine tenure and included some areas into the reserve siting framework.Robustly integrated local marine tenure systems and marine resource rights into the reserve planning. Recognized that rights can exist at the individual, collective, or broader community level.
Local Provisioning & AccessIncluded at least one way of spatializing human activities and interest in reserve design other than strict avoidance. Partially focused on improving access to marine resources for local stakeholders. Included explicit ecosystem service provision goals, focused on sustainable use, or considered the benefits in addition to costs of placing a reserve adjacent to high-use areas.Explicitly focused on improving access to marine resources for local stakeholders, enhancing ecosystem service provision, and the benefits in addition to costs of placing a reserve adjacent to a high use area. Potentially included the protection of traditional or indigenous fishing grounds, historical or cultural sites, and/or other sites of high human value or interest.
Count
Marxan InputsSocial costsTotal number of social costs listed by authors. Costs in this category are selected against a planning unit in each run of Maxan. Examples include areas of high fishing effort, ports, sewage pollution, and urban centers.
Social targetsTotal number of negative social costs or social targets listed by authors. Often, although not exclusively associated with the use of layers in Marxan with Zones. Examples include small-scale fishing effort, recreation areas, and areas adjacent to tourist facilities.
Social parametersTotal number of “shadow” social factors. Examples include “locking out” planning units associated with industrial and commercial interests, or “locking in” units tied to stakeholder preference.
Disclaimer/Publisher’s Note: The statements, opinions and data contained in all publications are solely those of the individual author(s) and contributor(s) and not of MDPI and/or the editor(s). MDPI and/or the editor(s) disclaim responsibility for any injury to people or property resulting from any ideas, methods, instructions or products referred to in the content.

