
Trend and Variability Analysis of Annual Maximum Rainfall Using Observed and Remotely Sensed Data in the Tropical Climate Zones of Uganda


Abstract
:1. Introduction
- To analyze the trends of MAM and SON seasonal rainfall.
- To analyze the trends of AMS observed rainfall and RSR datasets.
- To assess the variability in the AMS between observed rainfall and RSR datasets.
- To evaluate the fit between observed rainfall and RSR data distributions.
- Are there significant trends in MAM and SON seasonal rainfall?
- Do AMS rainfall data show significant trends across the different climatic zones?
- Are there identifiable patterns of variability in RSR AMS data comparable to observed AMS rainfall data?
- Does the distribution of RSR datasets significantly differ from observed AMS rainfall data?
2. Materials and Methods
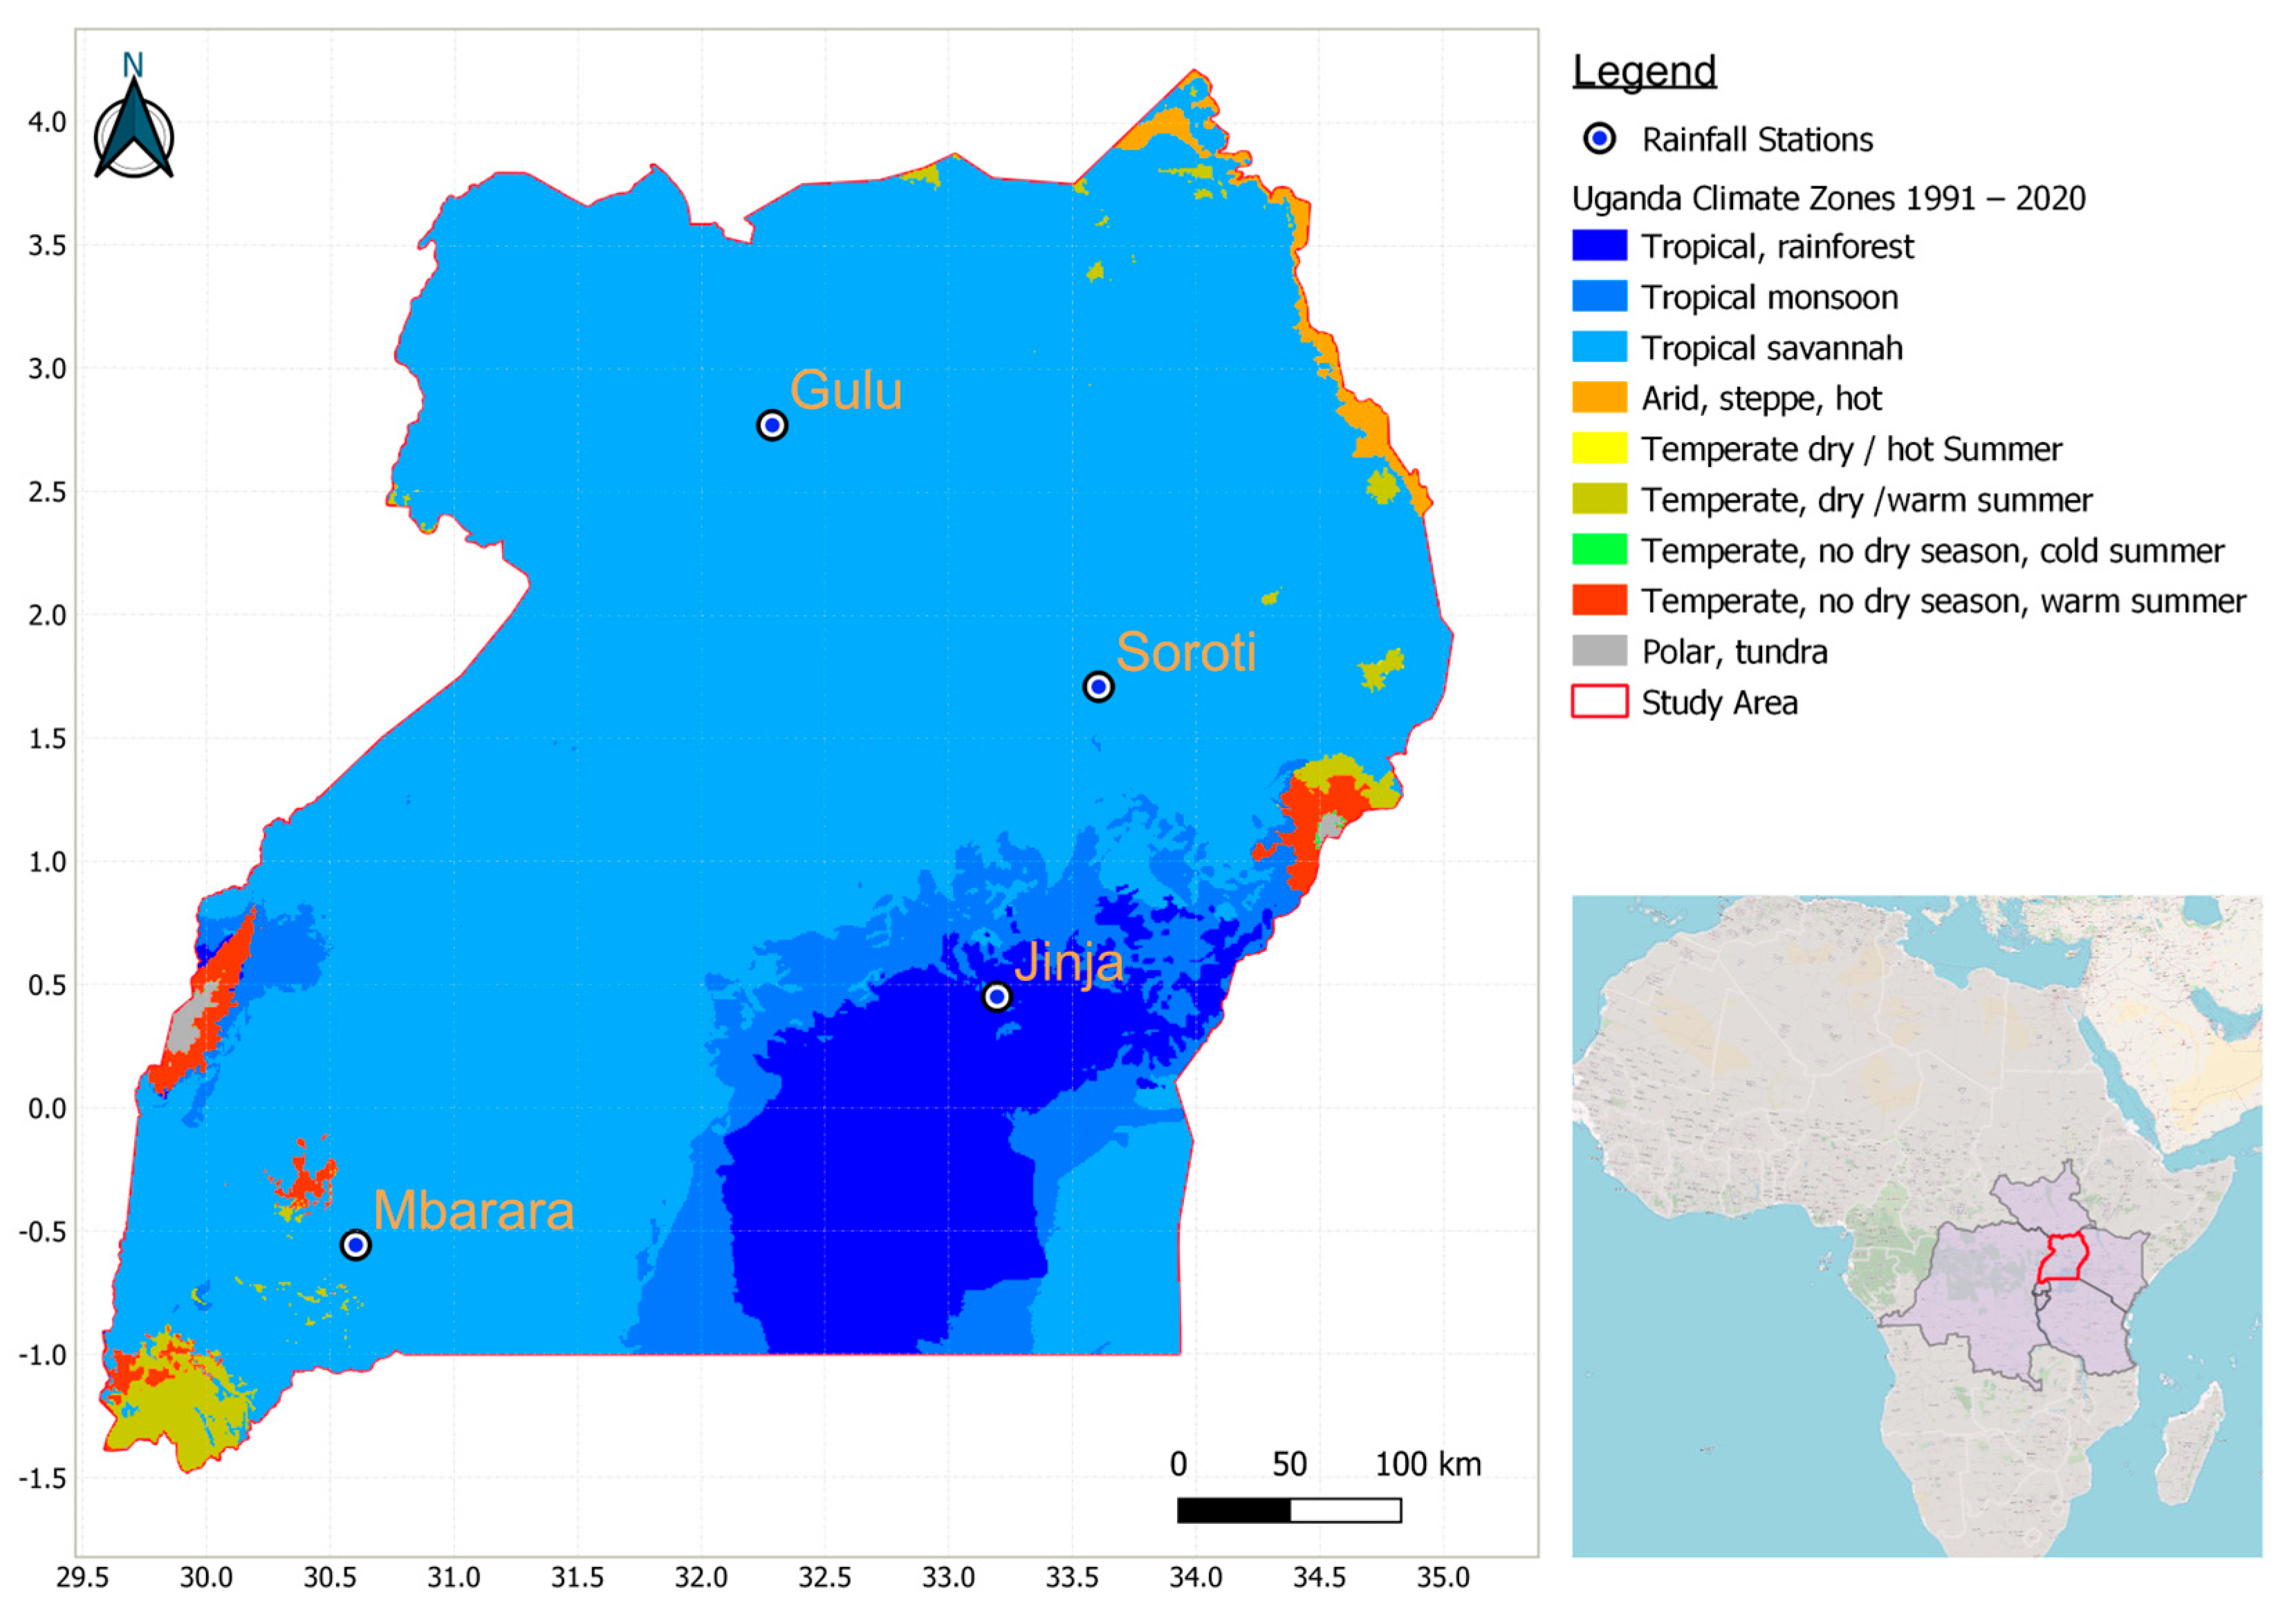
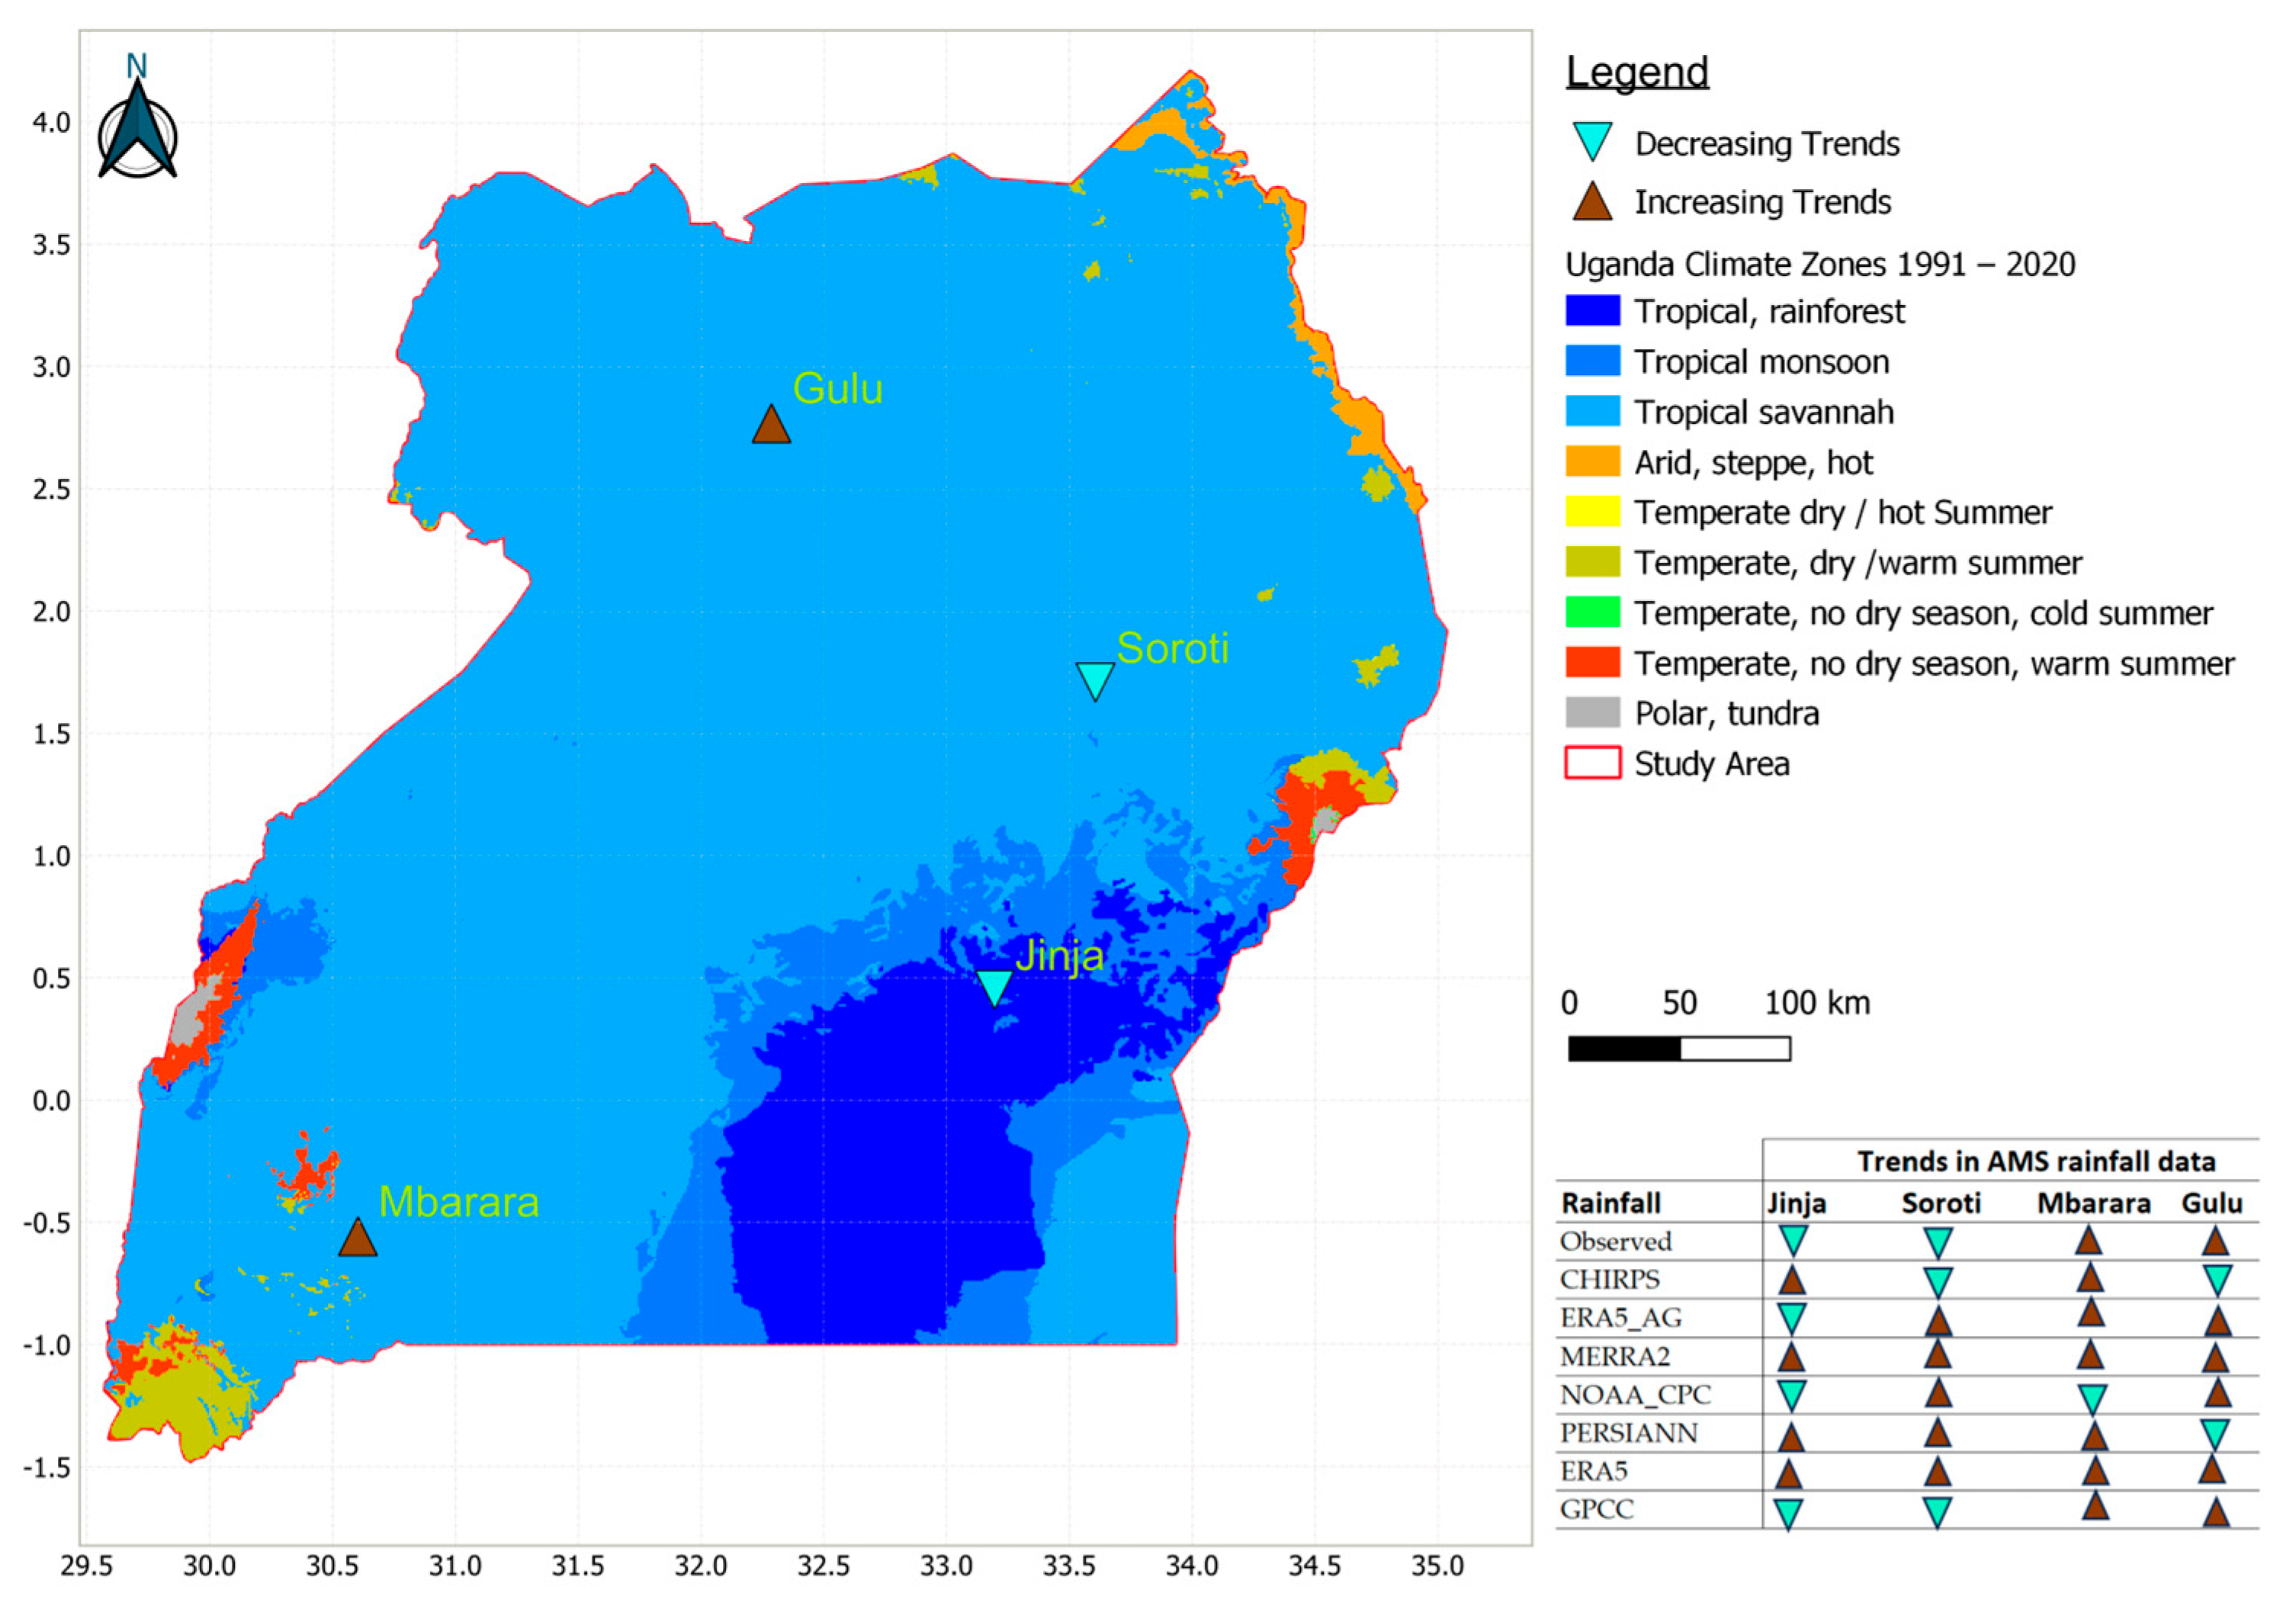
2.1. Description of the Study Area
2.2. Rainfall Datasets
2.2.1. Observed Rainfall Data
2.2.2. Remotely Sensed Rainfall Products
- Gauge-only products: These rely exclusively on observations from rain gauge stations, using various interpolation methods to construct the data. An example includes the Global Precipitation Climatology Centre daily rainfall product, which solely utilizes rain gauge data. This product is often available at a coarser spatial resolution exceeding 0.5° according to Macharia et al. [13] and Duan et al. [20]. GPCC data can be accessed from: https://opendata.dwd.de/climate_environment/GPCC/full_data_daily_v2022/ (accessed on 16 June 2024).
- Satellite-gauge combined products: These integrate gauge-only and satellite-only data through various bias correction or blending procedures:
- Climate Hazards Group Infrared Precipitation with Stations (CHIRPS): This product merges rain gauge measurements with satellite observations. It offers a spatial resolution of 4.8 km and covers latitudes between 50° N and 50° S from 1981 to the near present according to Du Plessis and Kibii [21].
- National Oceanic and Atmospheric Administration Climate Prediction Centre (NOAA_CPC): Developed from the CPC Unified Precipitation Project, this product combines a global dataset (55 km resolution) and a dataset for the conterminous United States (28 km resolution), providing daily data from 1979 to the near present.
- The Precipitation Estimation from Remotely Sensed Information using Artificial Neural Networks (PERSIANN)—Climate Data Record (CDR) is a rainfall dataset offering a 24 km spatial resolution with daily updates, covering the period from 1983 to the near present. It spans latitudes from 60° N to 60° S. Developed by the Centre for Hydrometeorology and Remote Sensing (CHRS) at the University of California, Irvine, this dataset leverages remotely sensed data processed through artificial neural networks to estimate precipitation according to Macharia et al. [13] and Duan et al. [20]. Further information can be found at: https://chrsdata.eng.uci.edu/ (accessed on 16 December 2022).
- Numerical weather prediction products: These rainfall products from atmospheric models use a combination of satellite and in situ observations:
- MERRA2: Developed by NASA’s Global Modeling and Assimilation Office, MERRA2 offers data with a spatial resolution of 50 km, covering the period from 1980 to the near present according to [13].
- European Centre for Medium-Range Weather Forecasts (ECMWF) reanalysis version 5 (ERA5): This fifth-generation global reanalysis dataset provides a daily precipitation dataset with a spatial resolution of 24 km from 1979 to the near present, available through the climate data store: https://cds.climate.copernicus.eu/cdsapp#!/home (accessed on 16 December 2022).
- ERA5_AG (for Agriculture): Specifically designed for agricultural and agro-ecological applications, this dataset offers daily precipitation data at a spatial resolution of 9.6 km from 1979 to the near present. The data is developed by ECMWF’s Copernicus climate change service and is available at: https://cds.climate.copernicus.eu/cdsapp#!/home (accessed on 16 December 2022).
2.2.3. Annual Maximum Series Rainfall Data
2.3. Methodology
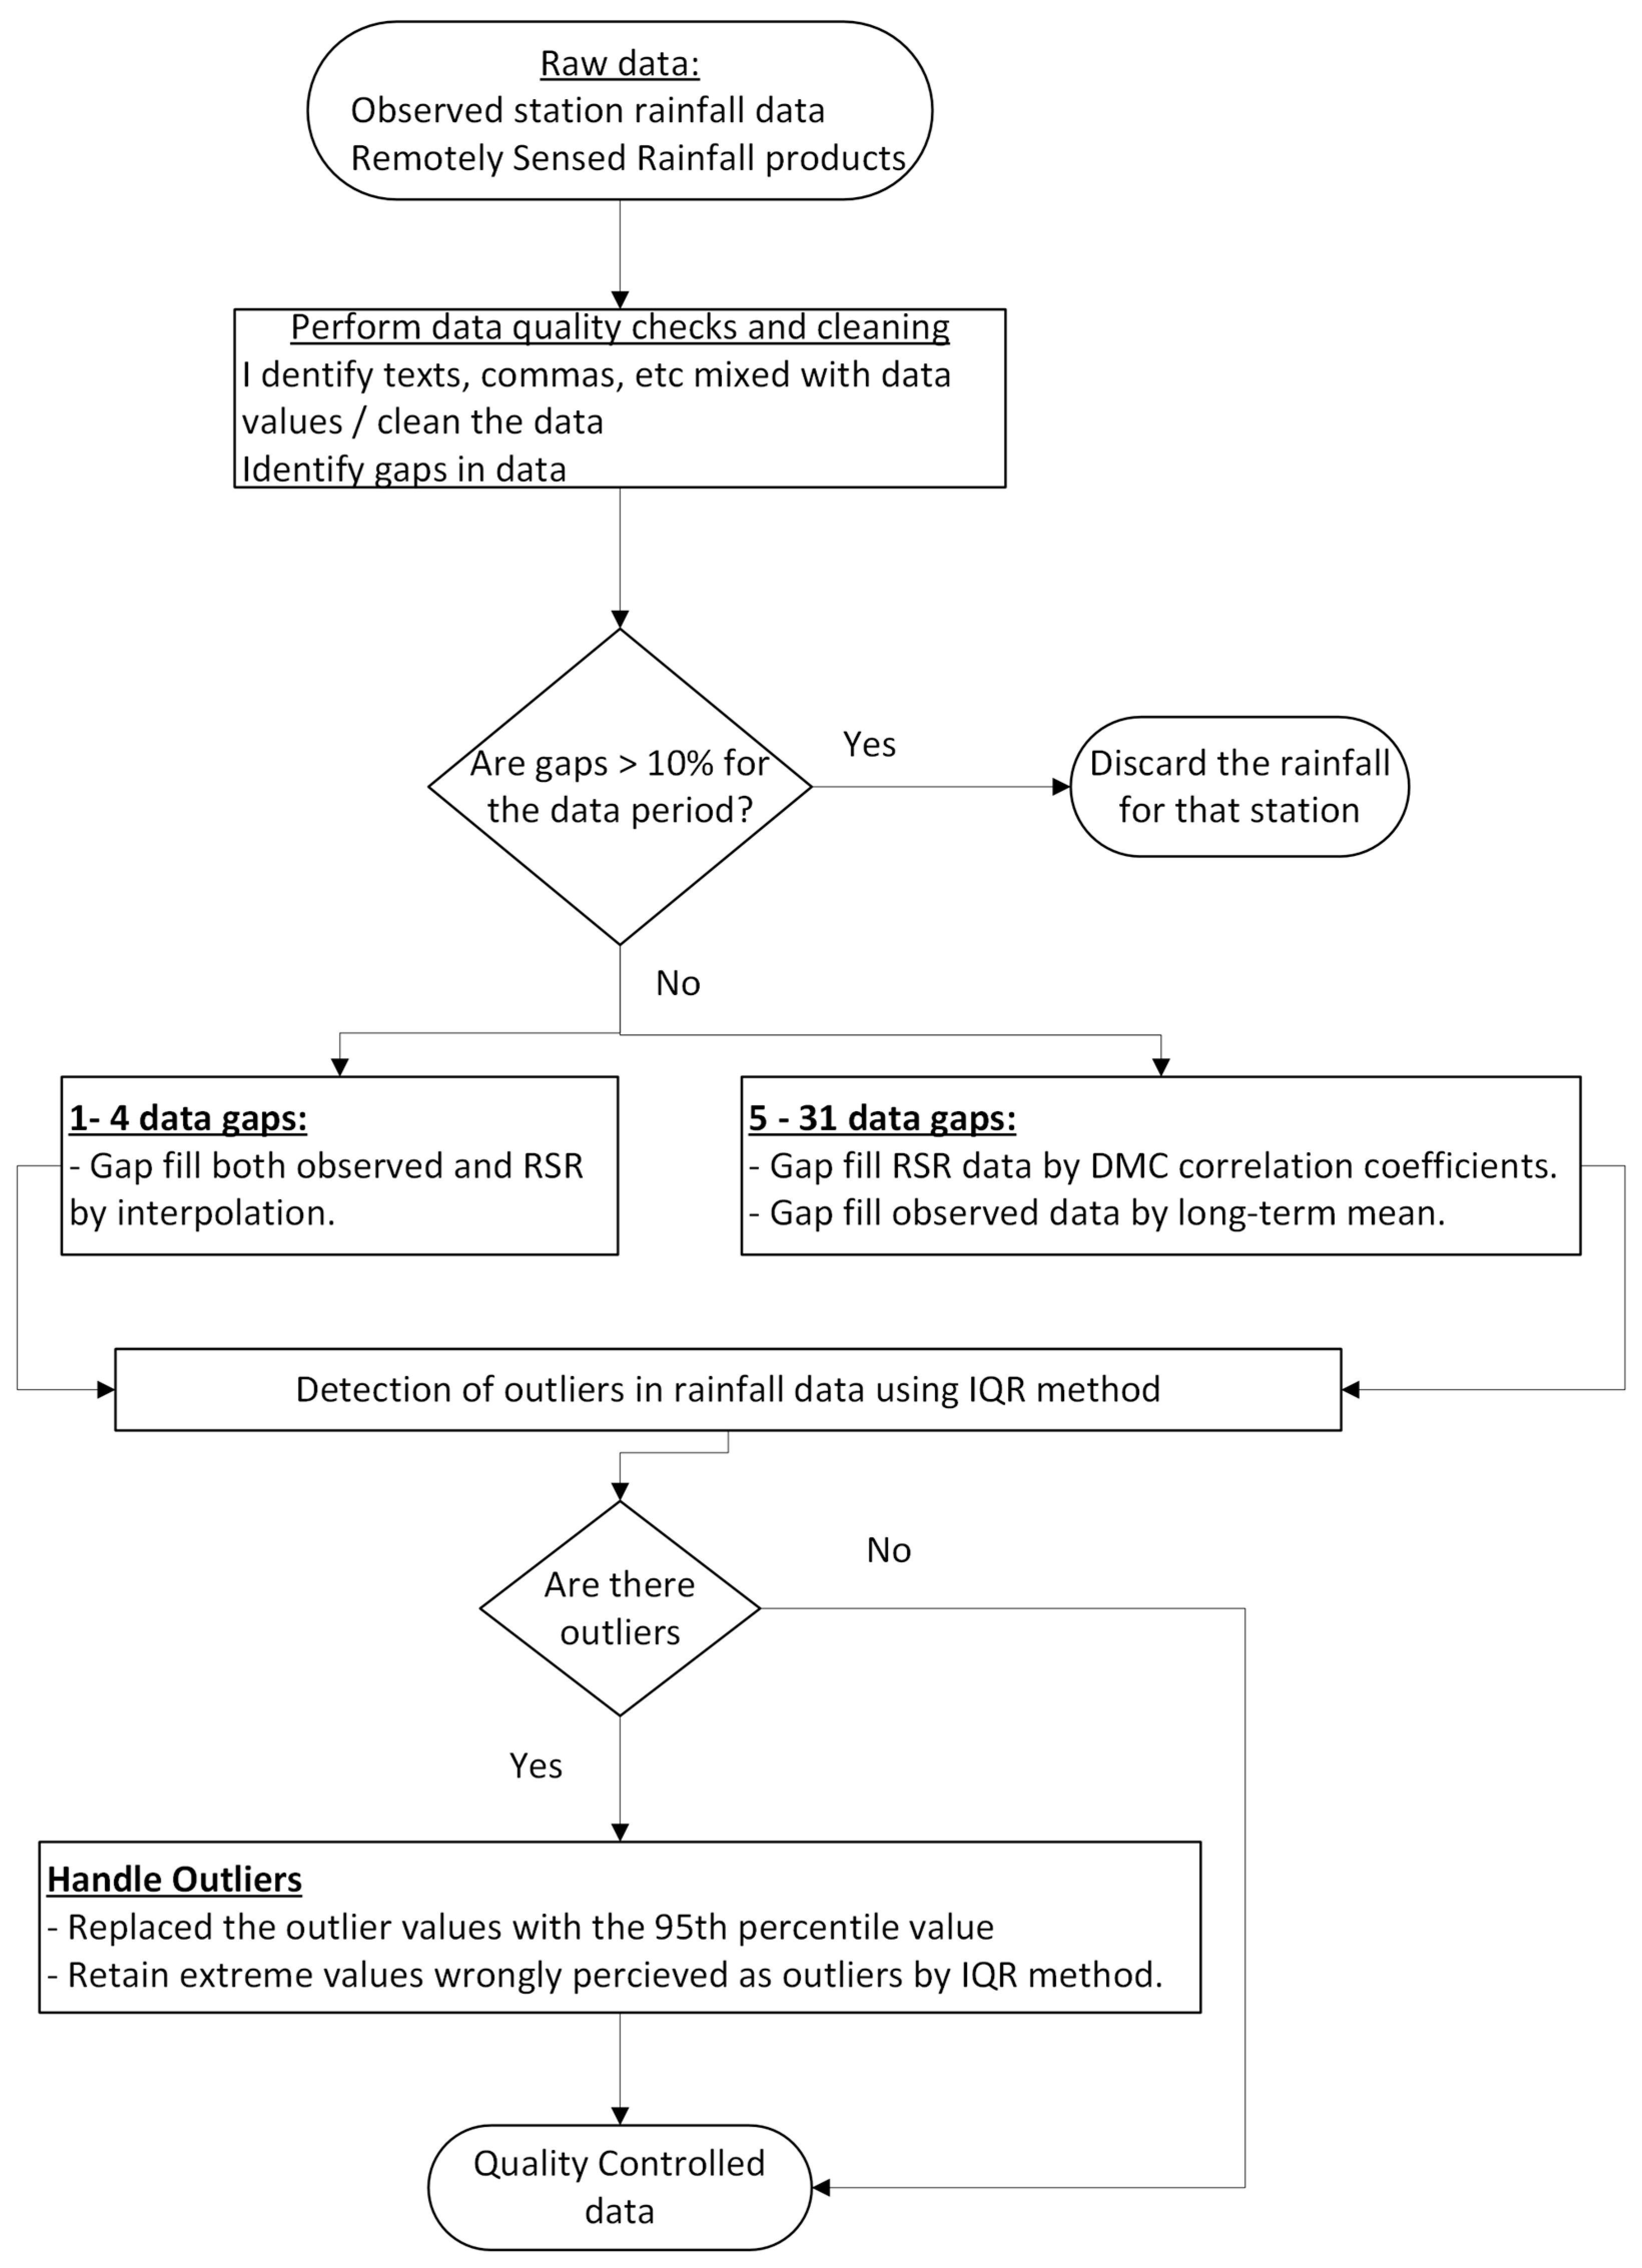
2.3.1. Data Pre-Processing
- Rainfall data quality control
- Gap filling of observed rainfall data
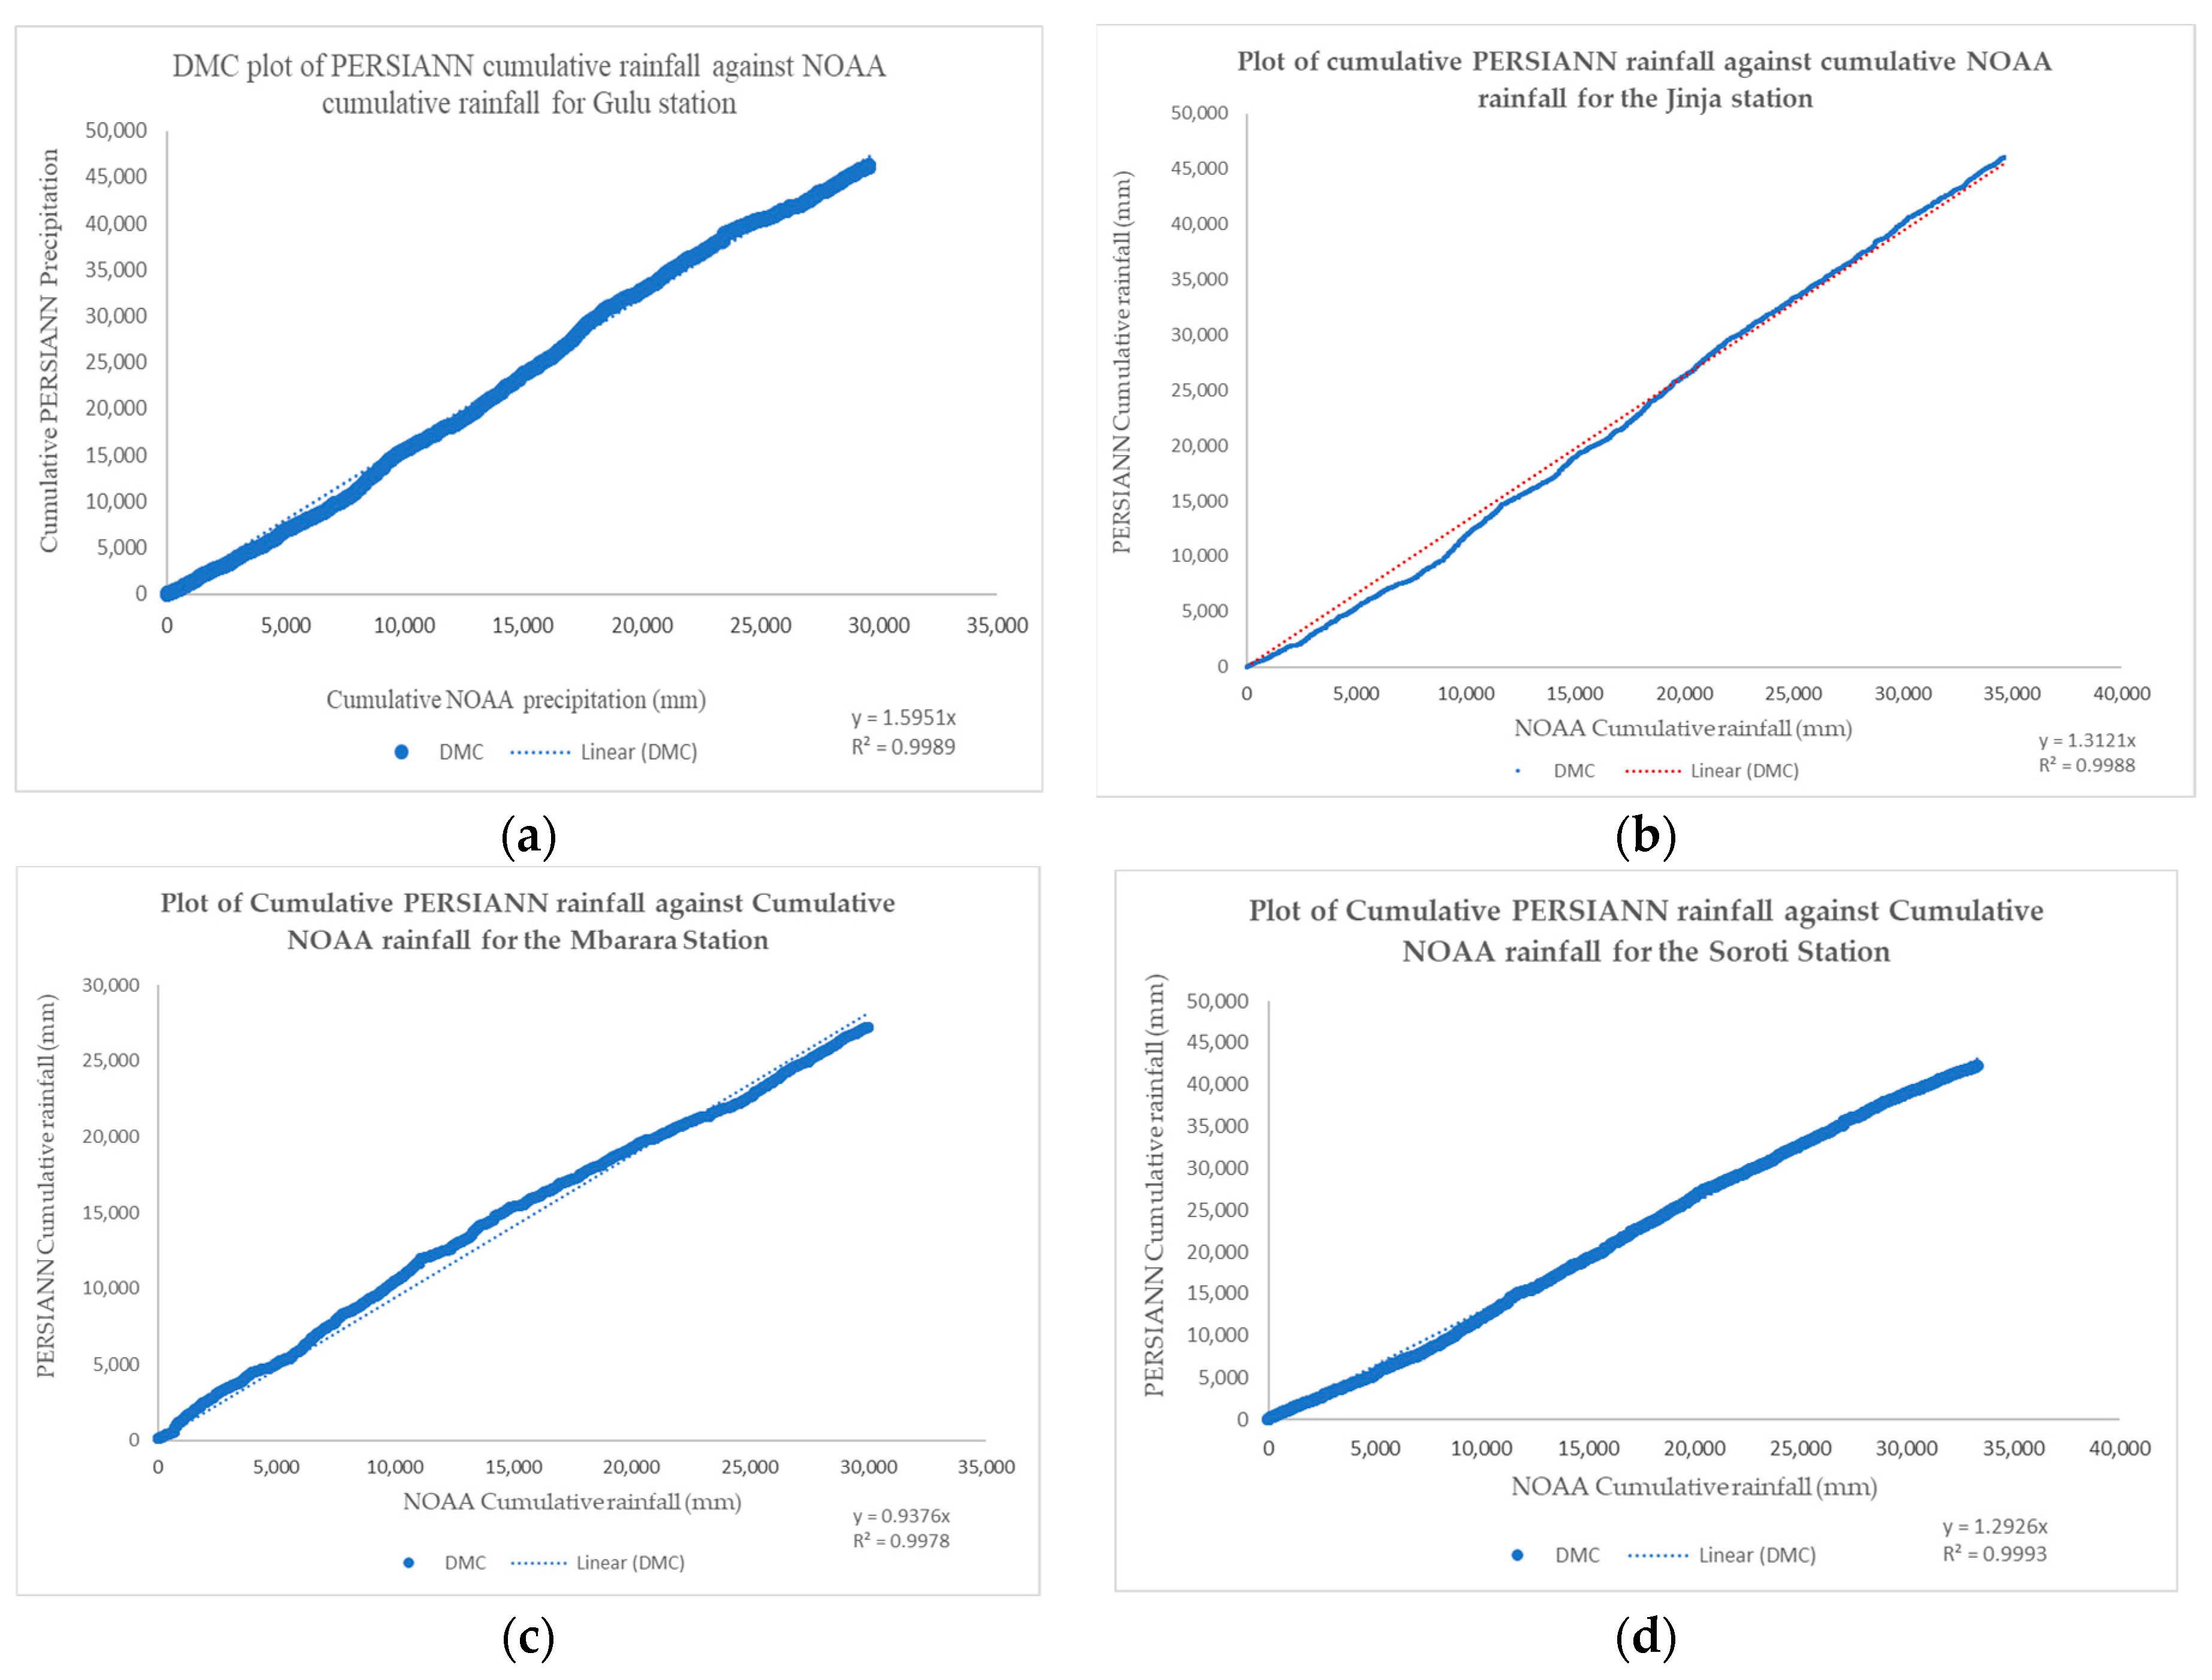
- Gap filling of RSR data products
- -
- y represents the missing PERSIANN rainfall data value;
- -
- m denotes a constant derived from the Double Mass Curve (DMC) plot;
- -
- x represents the NOAA rainfall data value.

| Rainfall Station | Correlation Coefficient | Equation | R2 Value |
|---|---|---|---|
| Jinja | 1.312 | 0.9988 | |
| Soroti | 1.2926 | 0.9993 | |
| Gulu | 1.5951 | 0.9989 | |
| Mbarara | 0.9376 | 0.9978 |
- Outlier detection
- Homogeneity test
2.3.2. Data Analysis
- Trend Analysis
- Step 1: Prepare the rainfall data
- Quality Control: The data underwent a quality control process as depicted in Figure 3.
- Data Extraction and Organization: AMS rainfall data were extracted and organized to facilitate the computation of the MK statistics, S. Additionally, for seasonal trend analysis, the rainfall totals for MAM and SON were calculated and properly organized.
- Step 2: Compute the MK statistic (S)
- Compute the differences in data points. For each data point, xi, compute the difference with all subsequent data points, xj.
- Calculate the sign function. For each pair (xi, xj), determine the sign of (xj − xi)
- Step 3: Calculate the variance of S
- Step 4: Compute the test statistic (Z)
- Step 5: Results and interpretation
- If the Zc value exceeds the critical value of 1.96, corresponding to a 95% confidence level (5% significance level), reject the null hypothesis that there is no trend.
- The negative value of Zc indicates a decreasing trend, while the positive value indicates an increasing trend.
- Sen’s slope estimator
- Seasonal rainfall trend analysis
2.3.3. Data Evaluation
- Statistical performance metrics
- Comparison of rainfall dataset distributions
3. Results
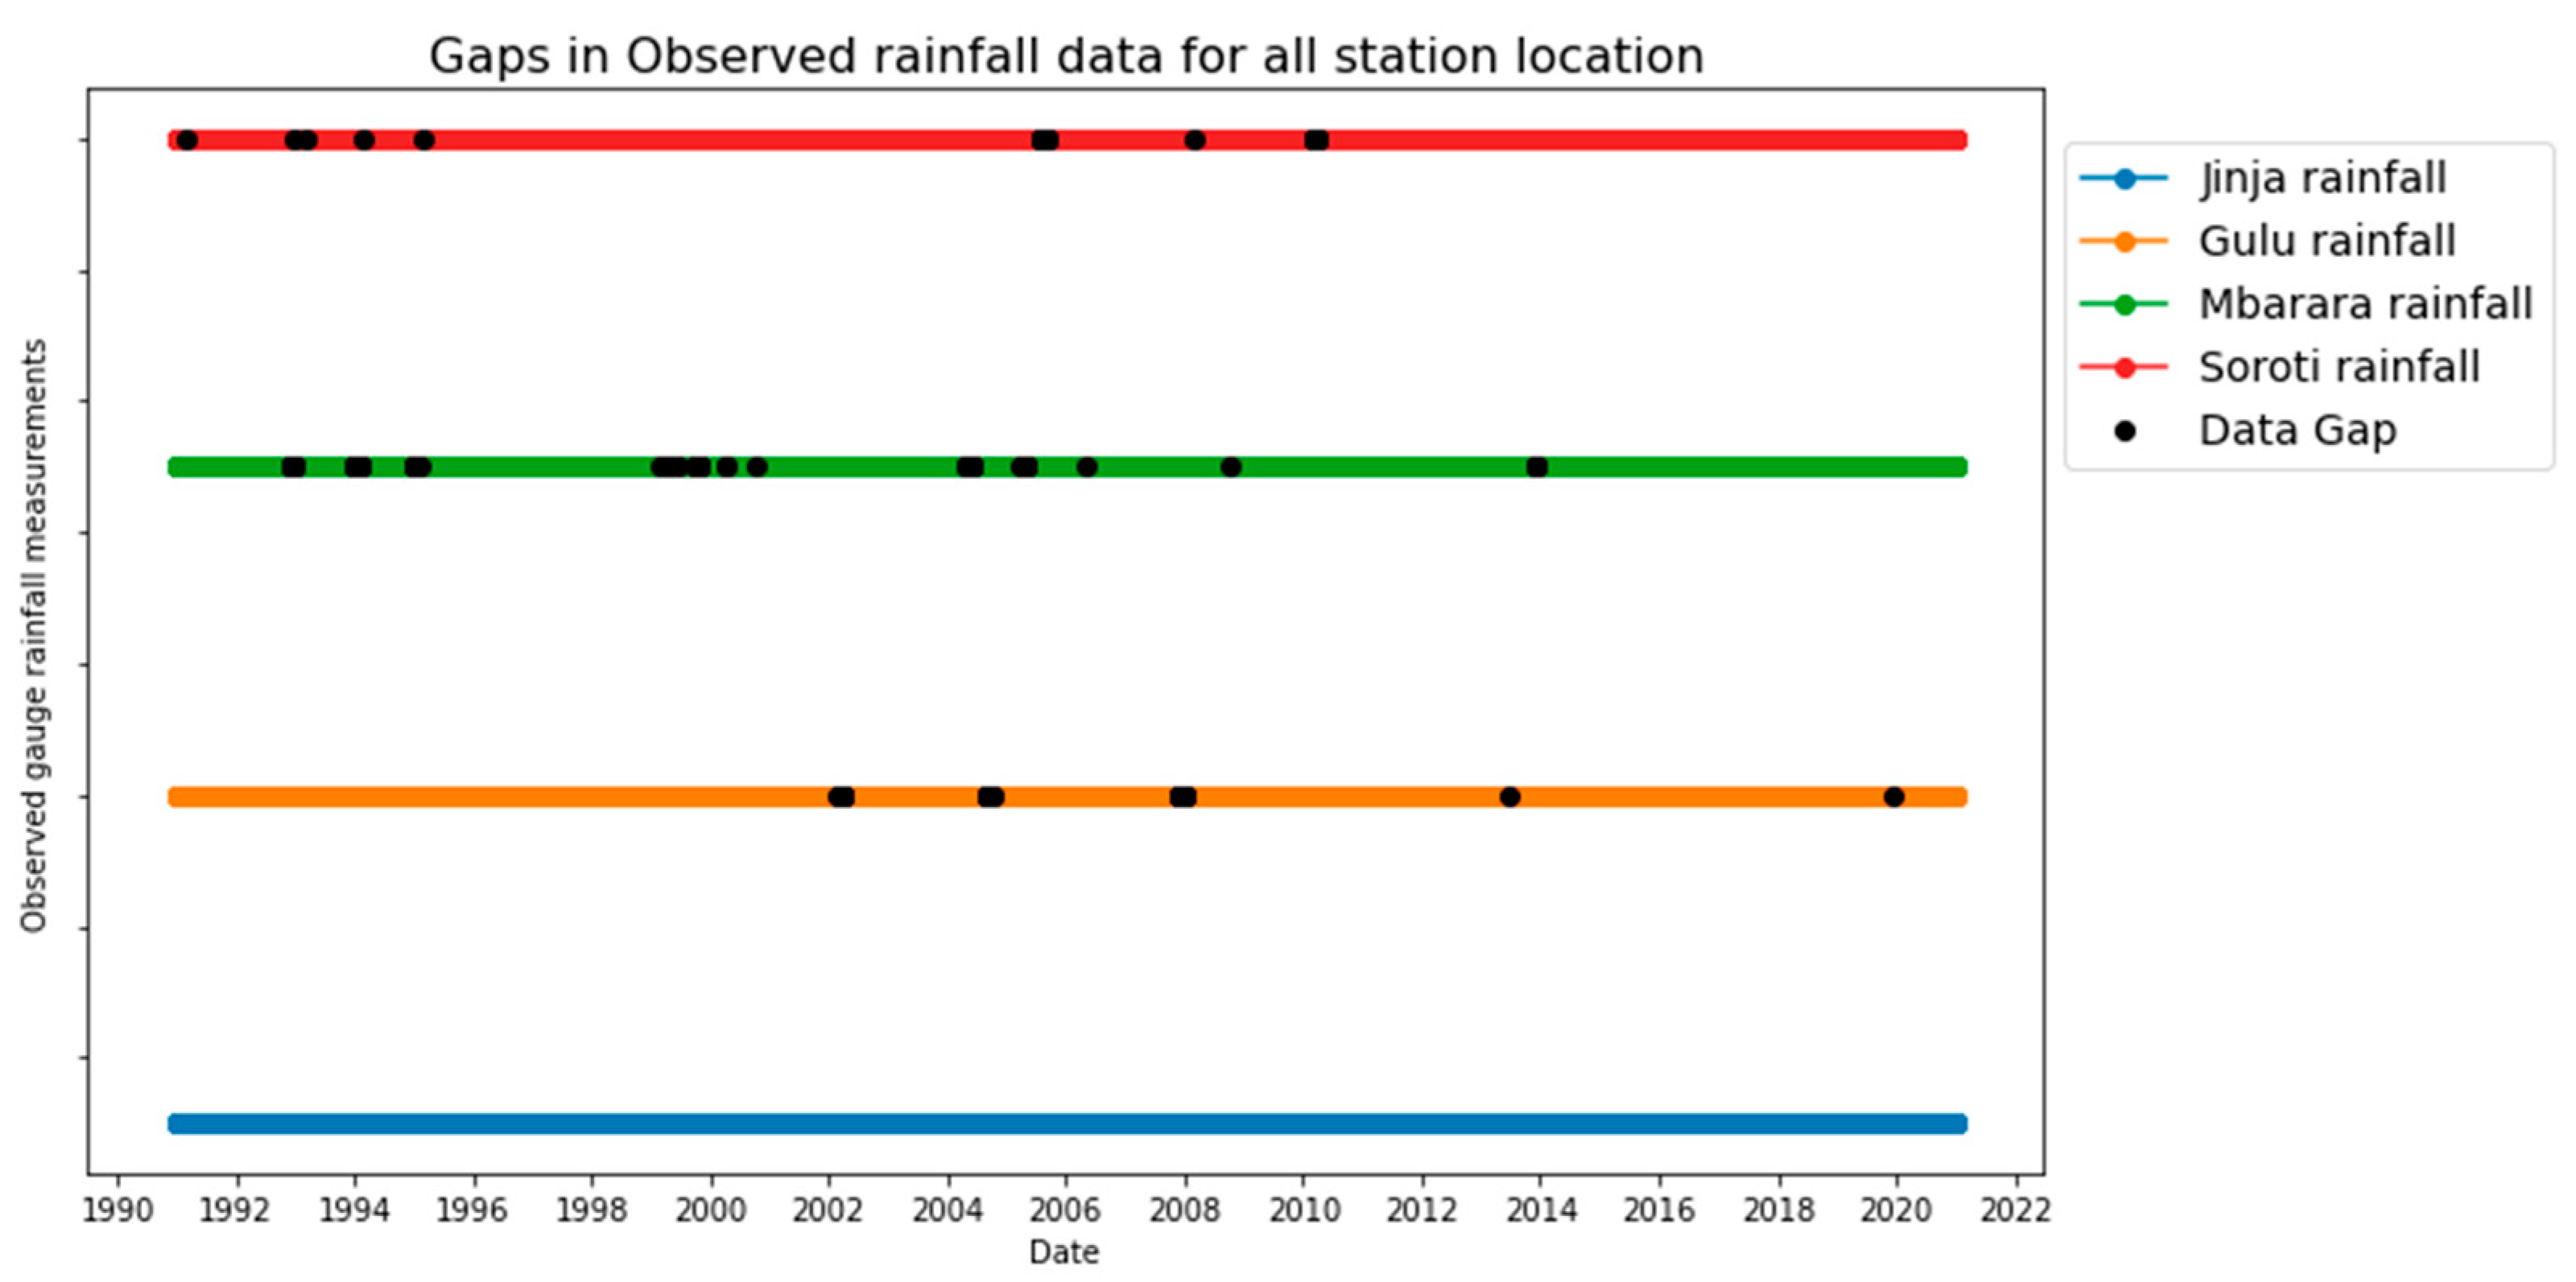
3.1. Data Pre-Processing Results
3.1.1. Gaps in Observed Rainfall Data
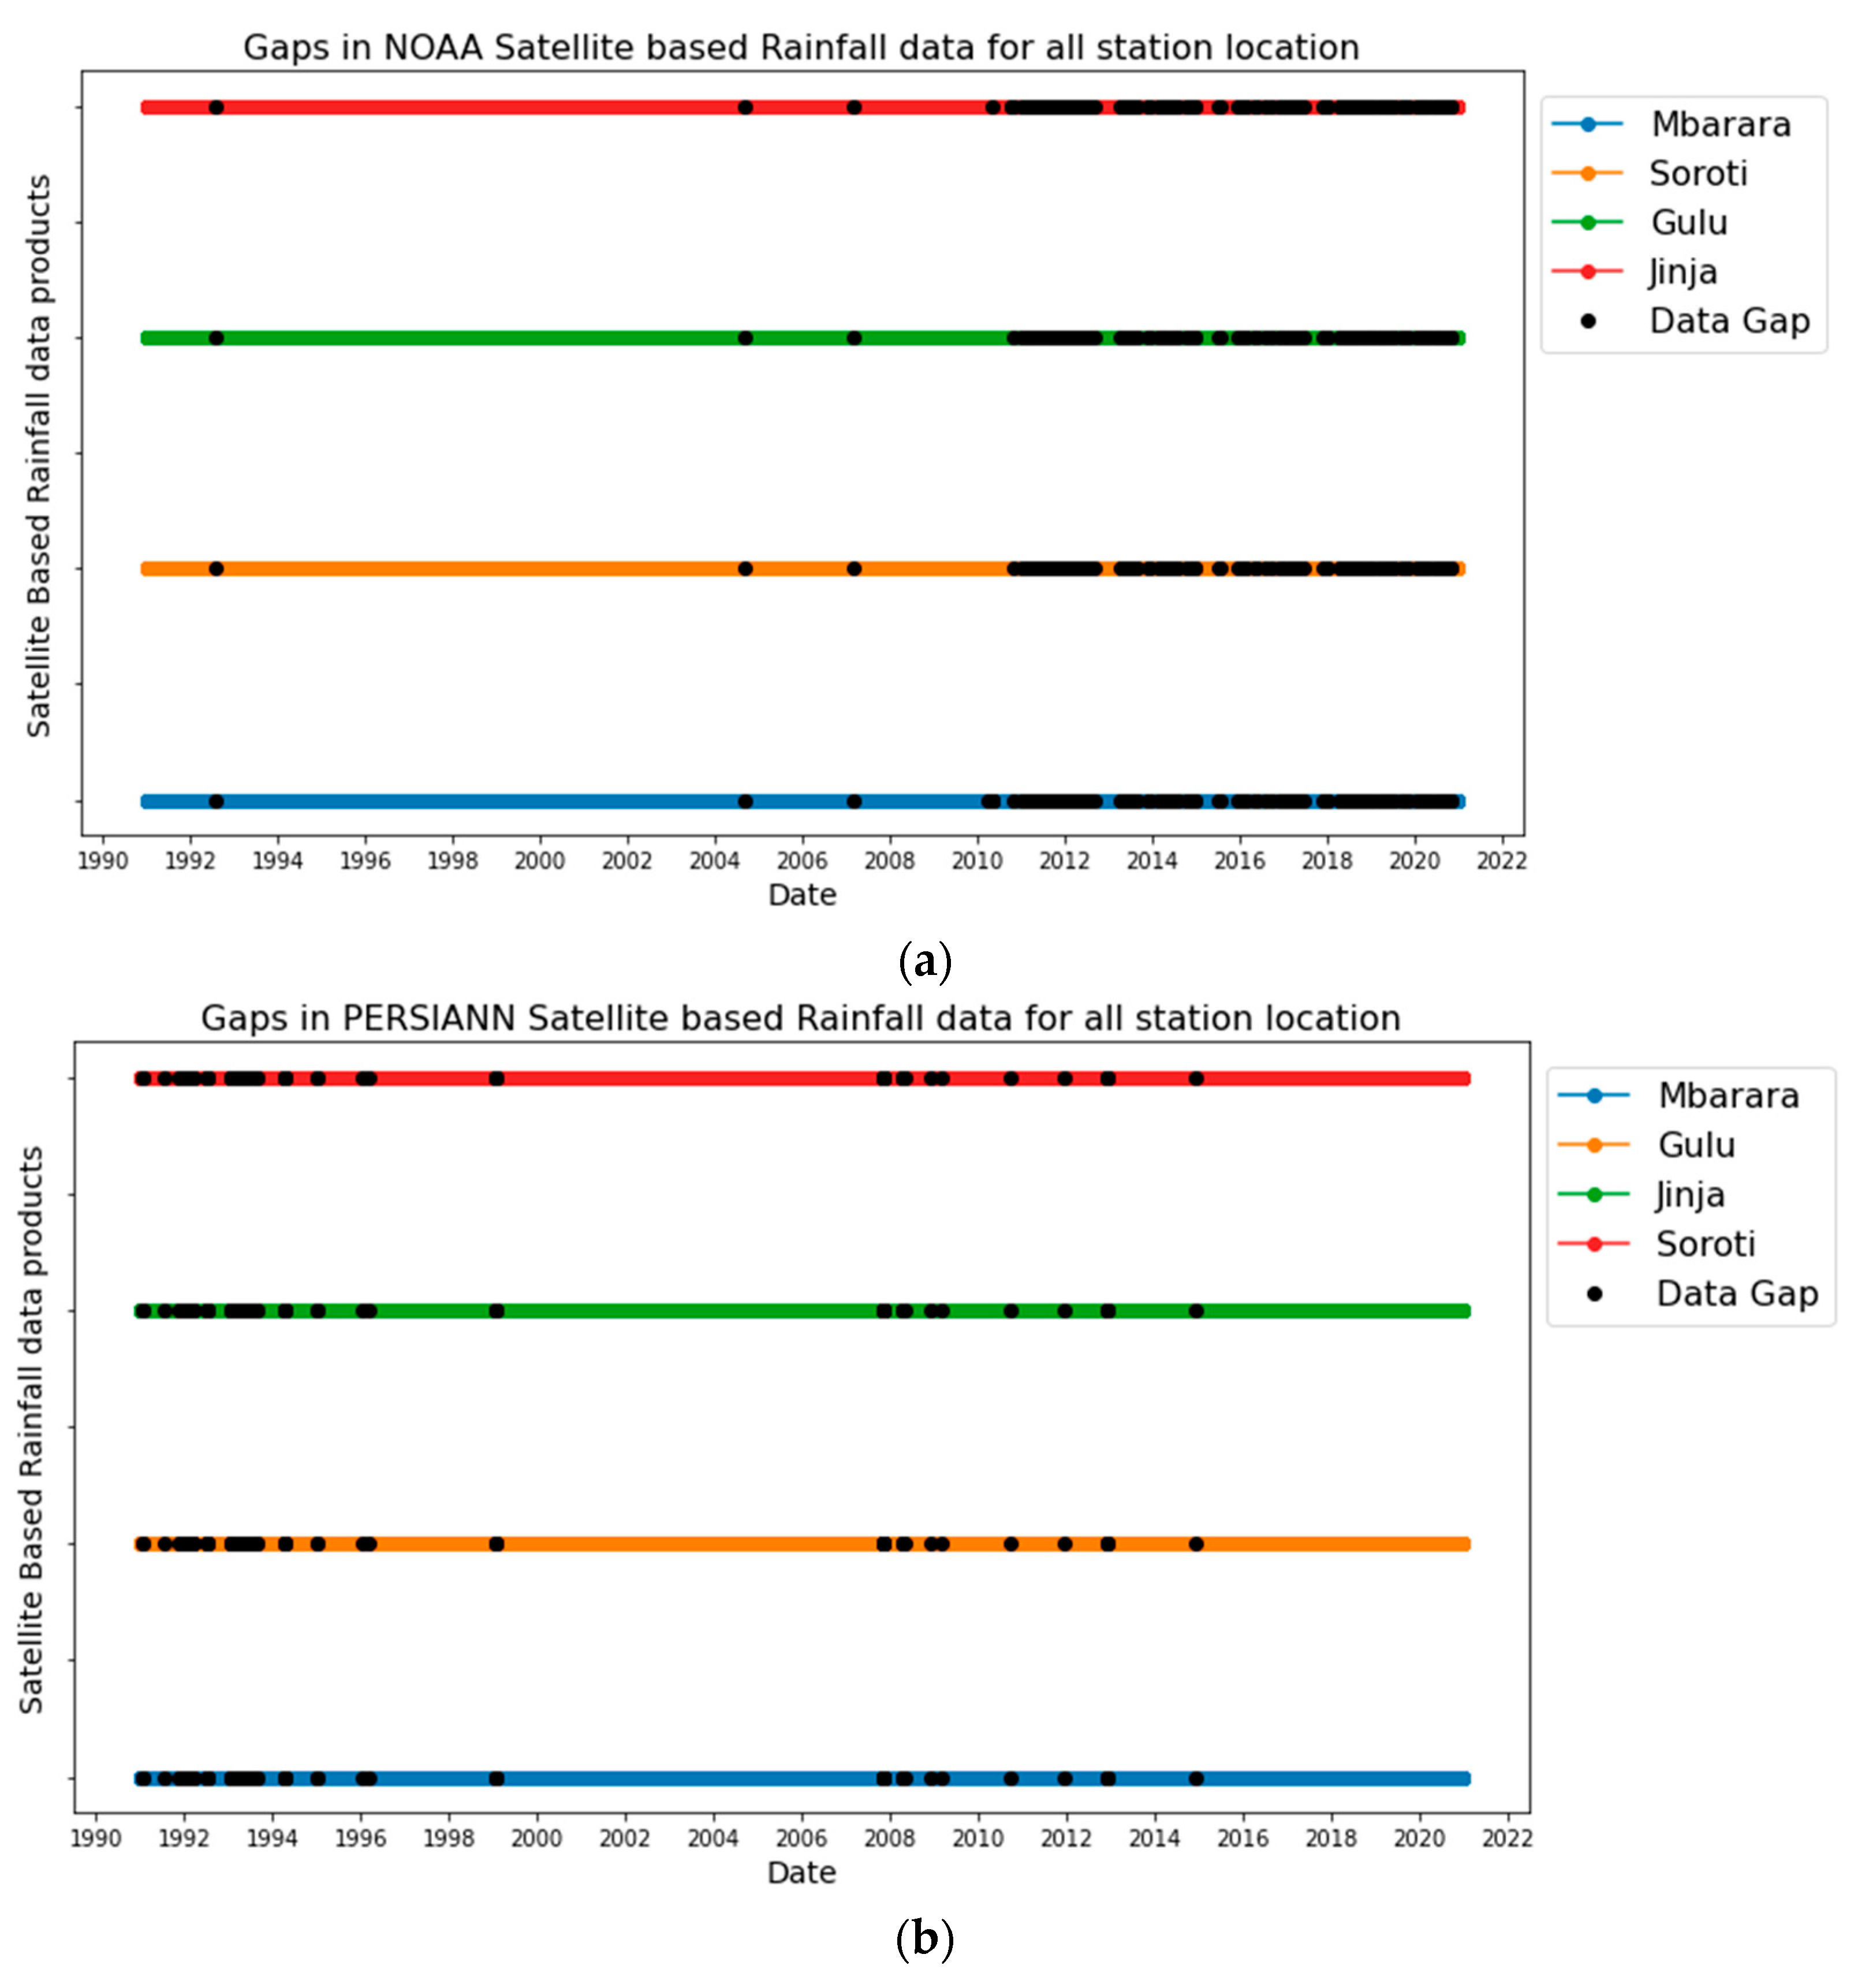
3.1.2. Gaps in Satellite-Based Rainfall Data Products
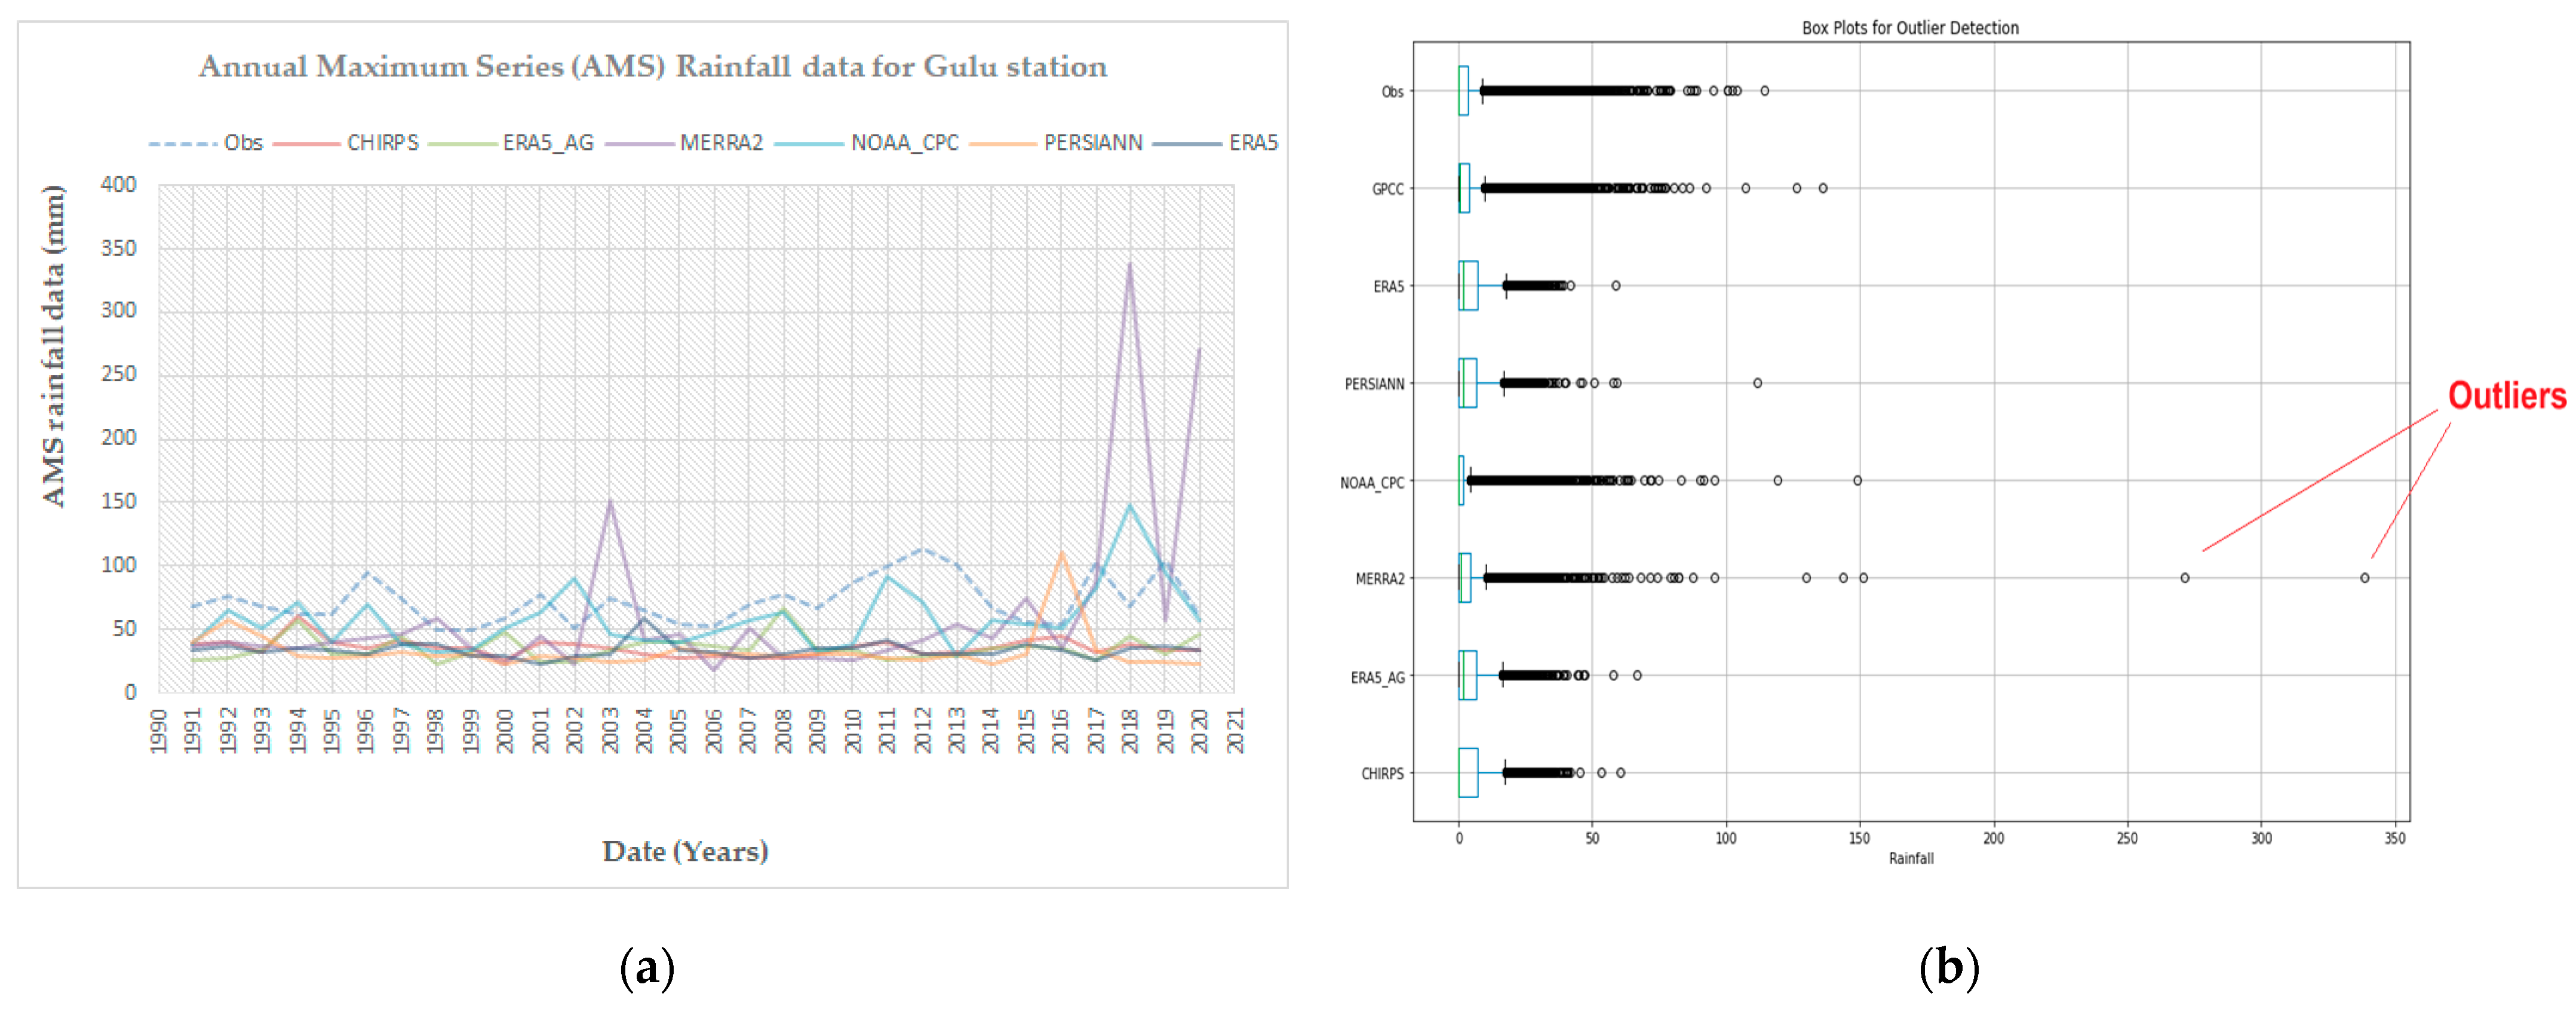
3.1.3. Outlier Test Results
3.1.4. Annual Maximum Series Rainfall Data
3.1.5. Homogeneity Test Results
- At the Jinja and Gulu rainfall stations, only the PERSIANN satellite rainfall product exhibits homogeneity, while the remaining satellite and observed rainfall data series demonstrate non-homogeneity.
- At the Mbarara rainfall station, only the CHIRPS satellite rainfall product displays homogeneity, while the other satellite and observed rainfall data series show non-homogeneity.
- At the Soroti rainfall station, only the observed rainfall data demonstrate homogeneity, while the other satellite rainfall data products exhibit non-homogeneity.
3.2. Trend Analysis Results
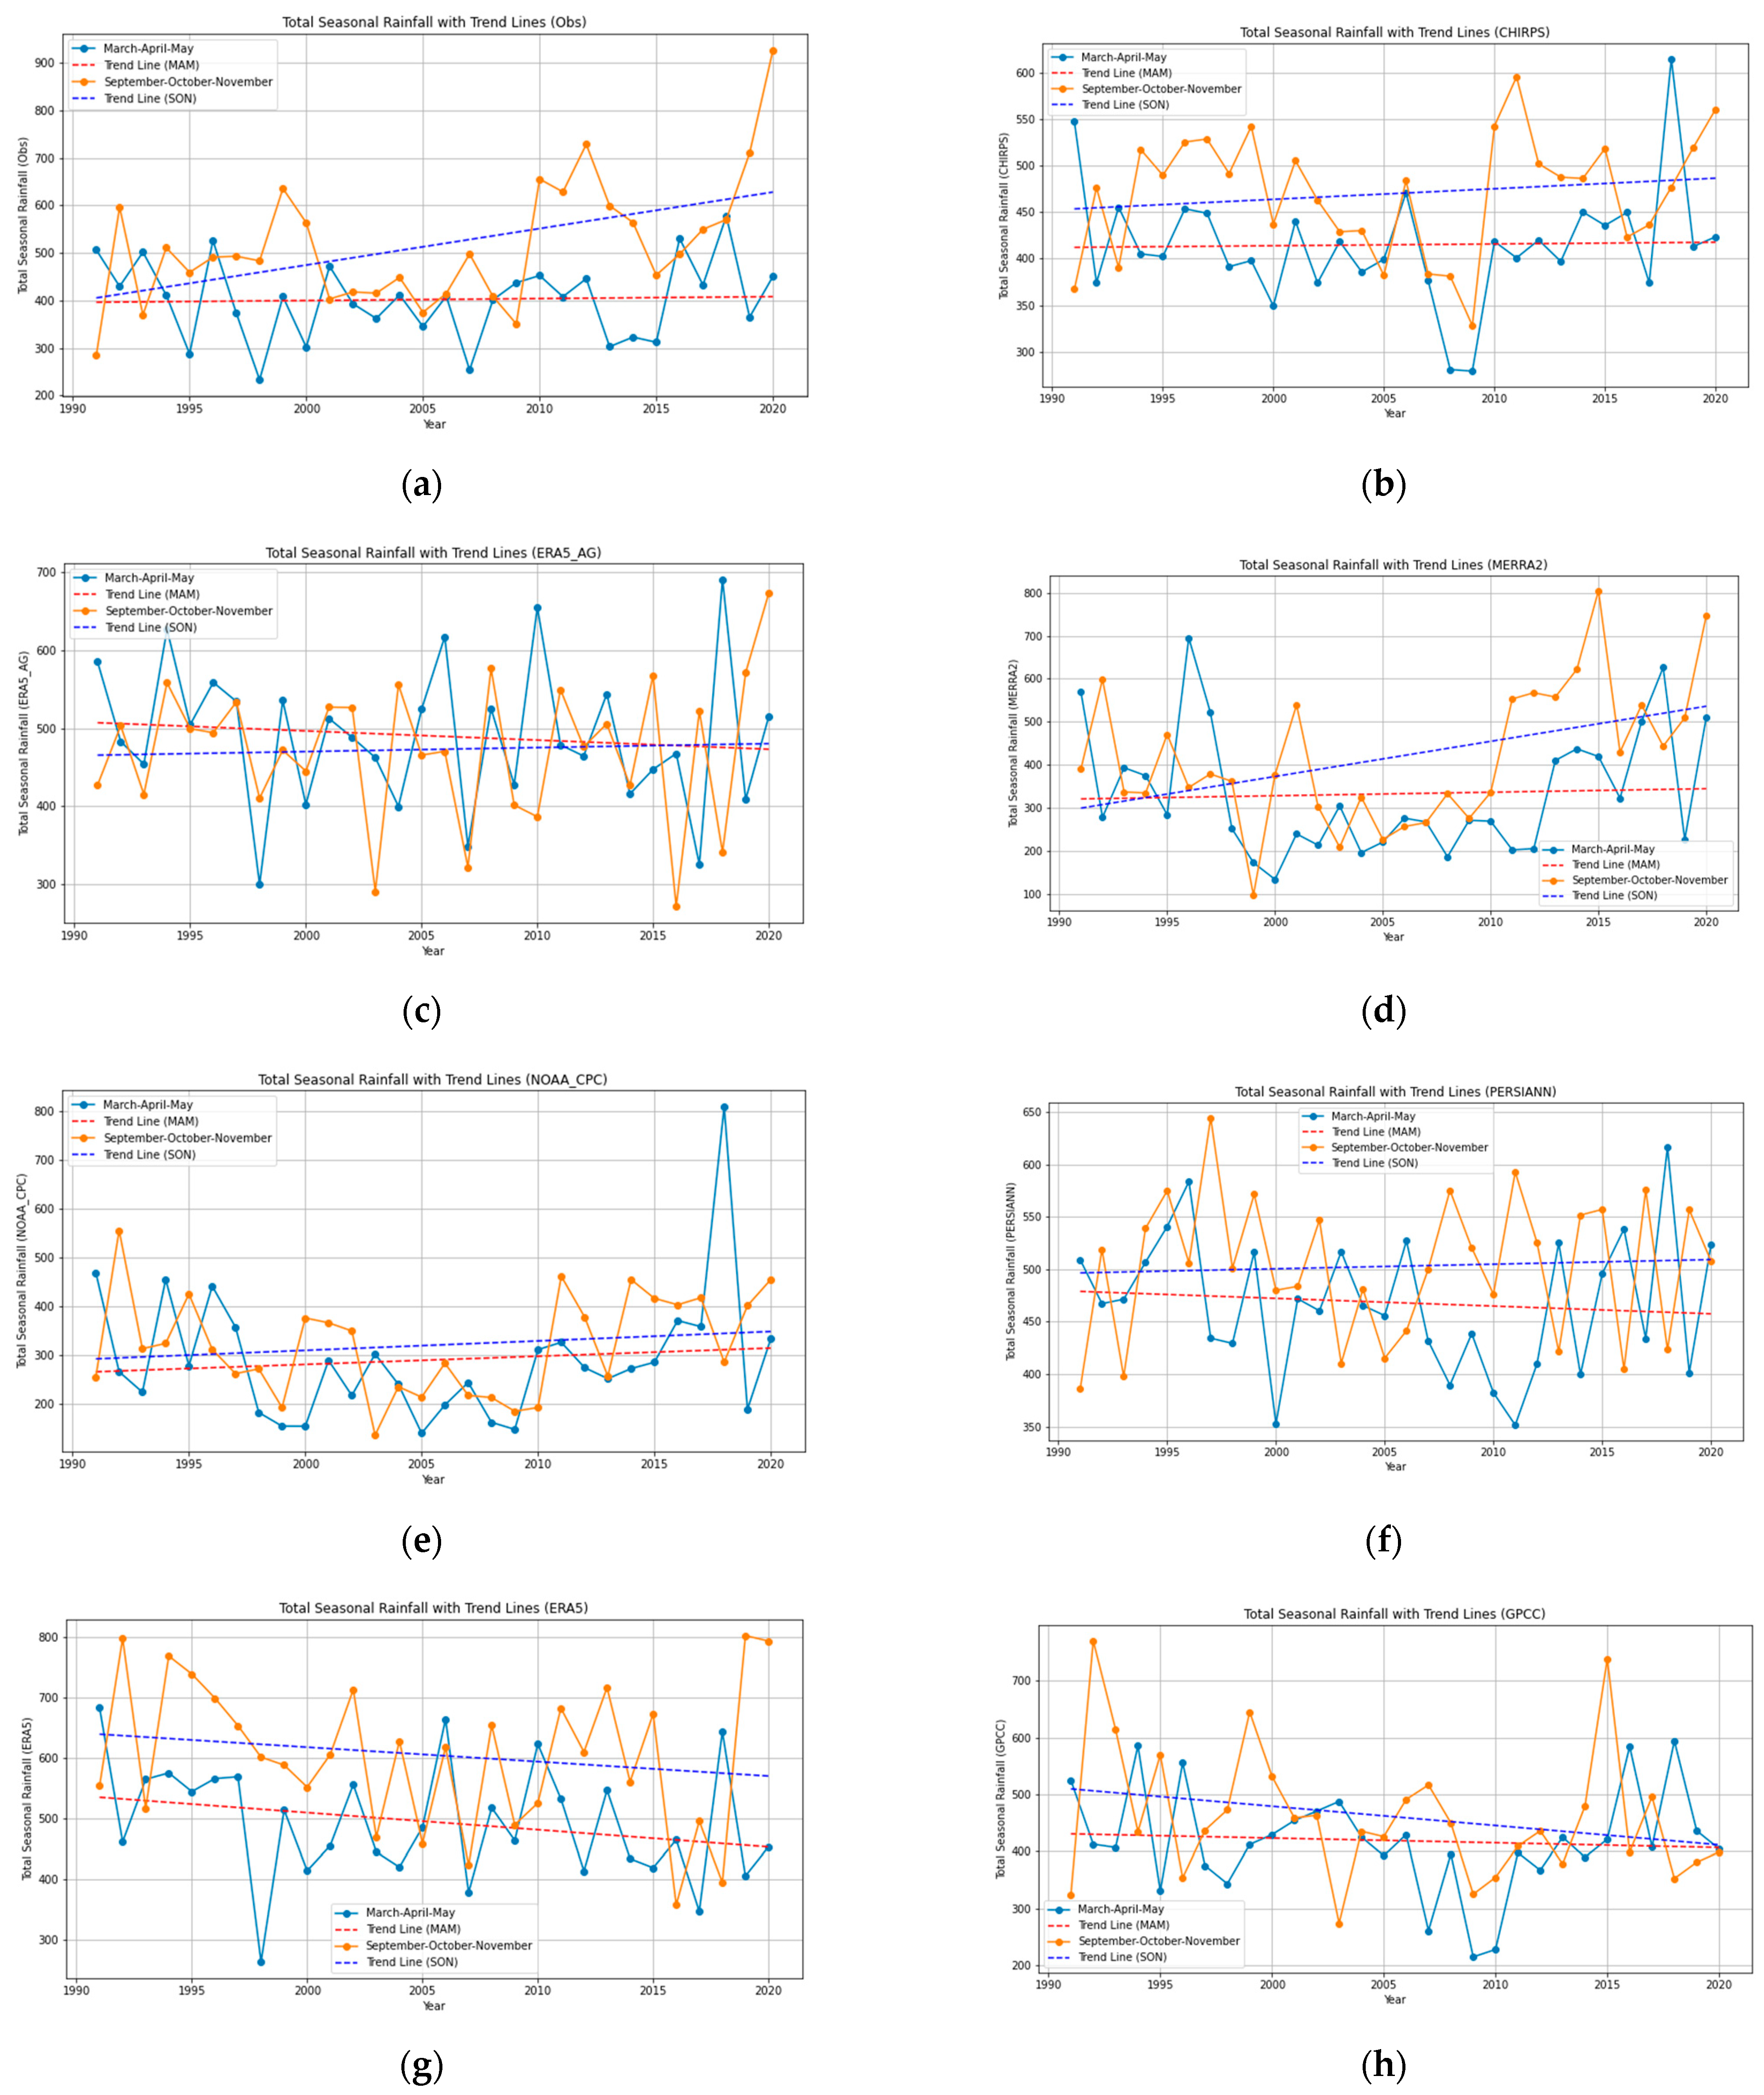
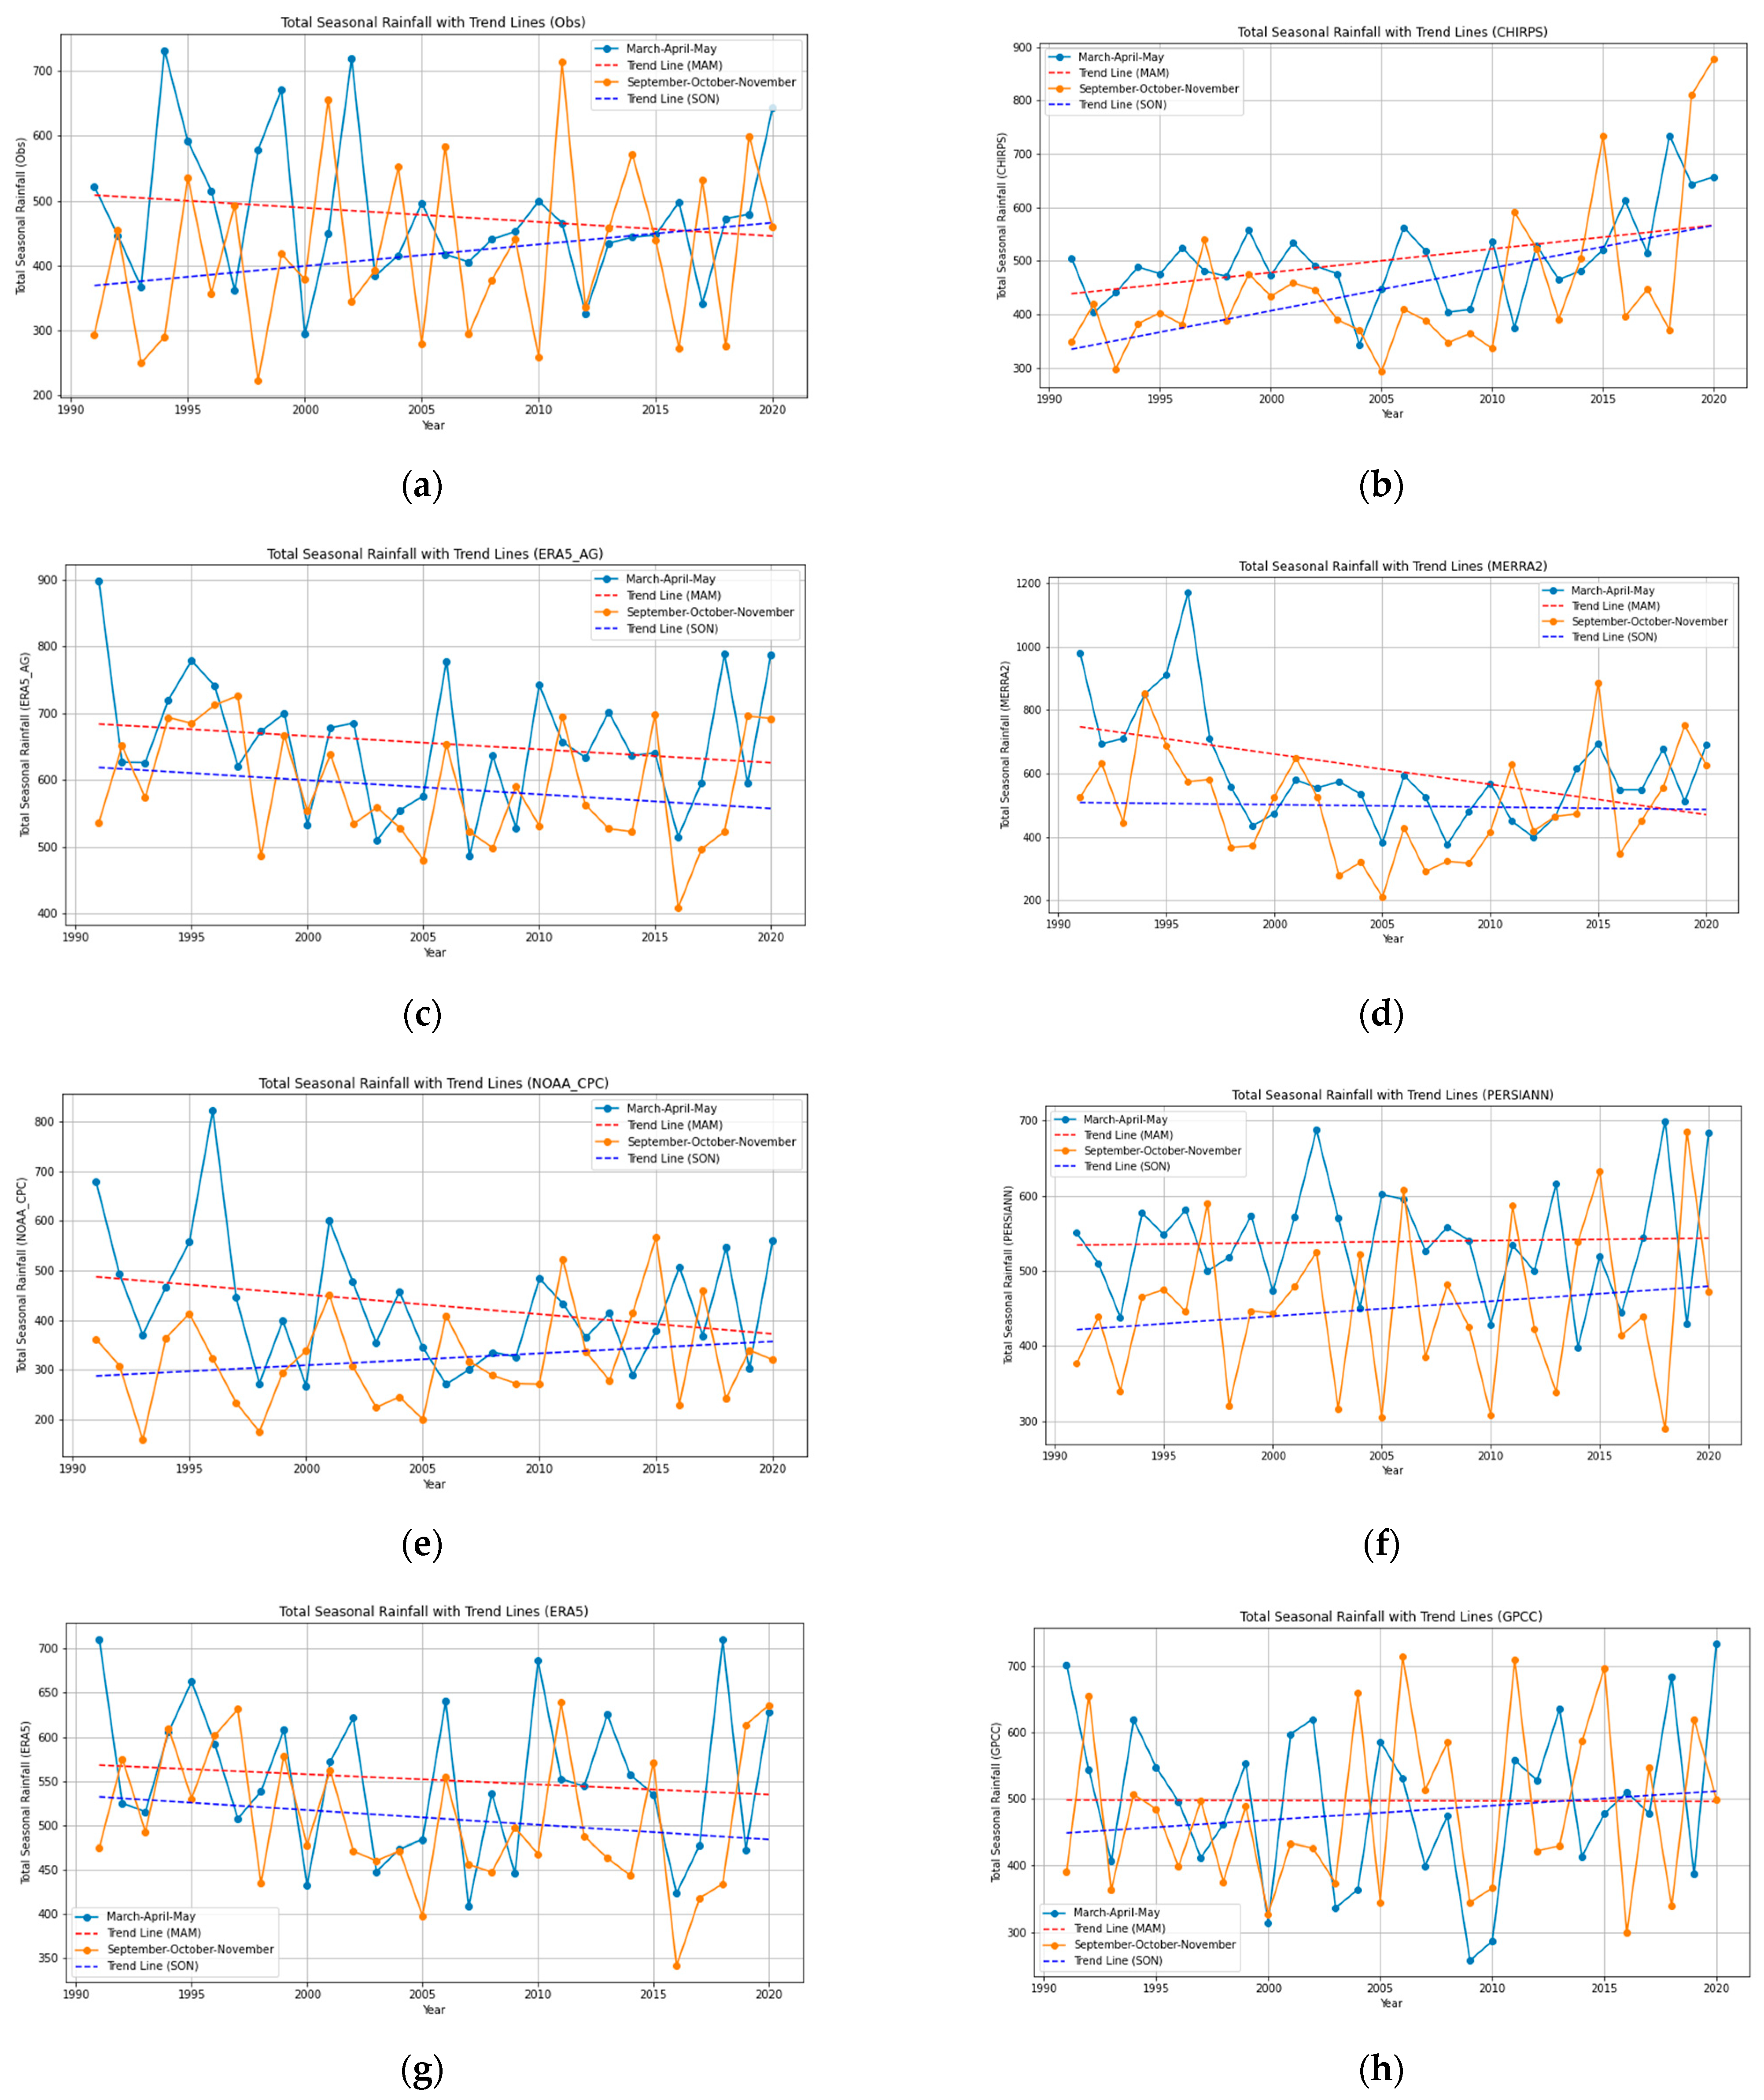
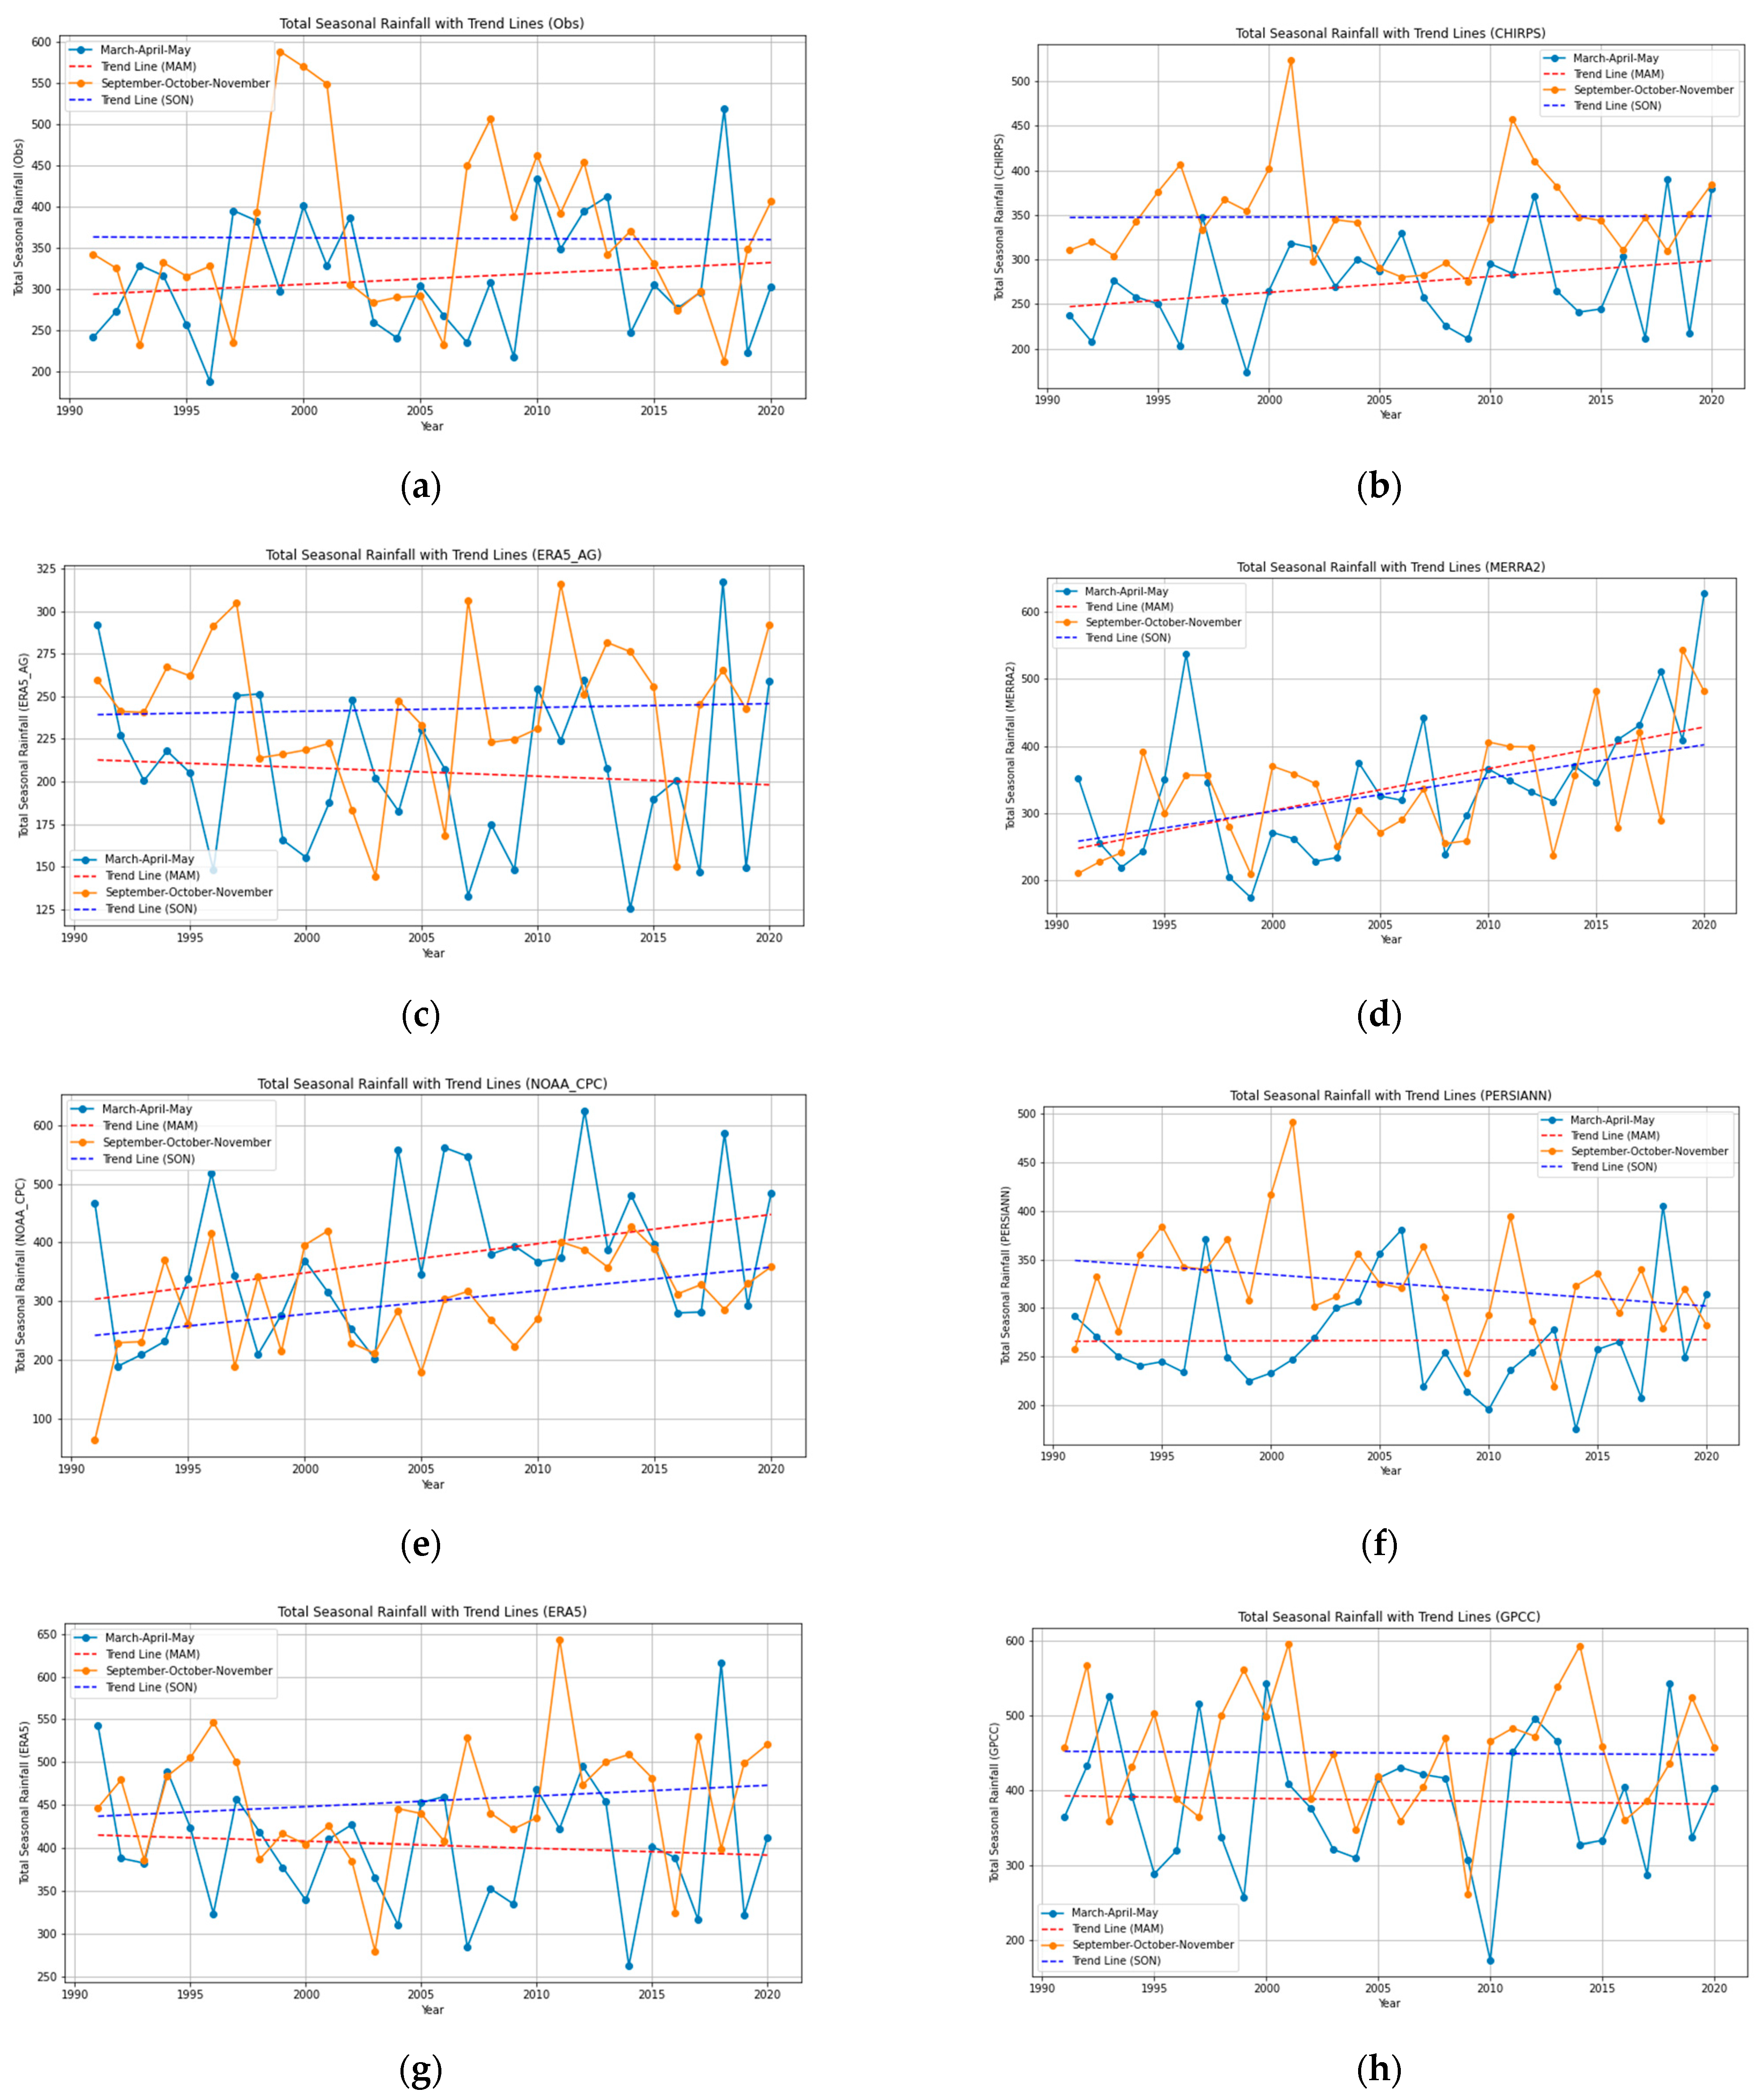
3.2.1. Trends in MAM and SON Seasonal Rainfall
- At the Gulu rainfall station, the MAM rainfall from observed data show a statistically insignificant increasing trend at a rate of 0.41 mm/year. Similarly, the RSR products, CHIRPS, MERRA2, and NOAA_CPC, show statistically insignificant increasing trends at different rates. The ERA5_AG, ERA5, GPCC, and PERSIANN RSR datasets show a decreasing trend (Table 2).
- Considering the SON seasonal trends, the observed data show a statistically significant increasing trend at a rate of 7.68 mm/year. The other RSR products that also show increasing trends at different rates are CHIRPS, ERA5_AG, MERRA2, NOAA_CPC, and PERSIANN. The other RSR products (ERA5 and GPCC) show decreasing trends for the SON season.
| Rainfall | Season | Tau | p-Value | Slope (mm/Year) | R2 Value | Trend | Statistical Significancy |
|---|---|---|---|---|---|---|---|
| Observed | MAM | 0.03 | 0.86 | 0.41 | 0 | Increasing | Not significant |
| SON | 0.29 | 0.03 | 7.68 | 0.26 | Increasing | Significant | |
| CHIRPS | MAM | 0.01 | 0.94 | 0.19 | 0 | Increasing | Not significant |
| SON | 0.08 | 0.57 | 1.14 | 0.02 | Increasing | Not significant | |
| ERA5_AG | MAM | −0.13 | 0.34 | −1.17 | 0.01 | Decreasing | Not significant |
| SON | 0.05 | 0.7 | 0.51 | 0 | Increasing | Not significant | |
| MERRA2 | MAM | 0.06 | 0.67 | 0.82 | 0 | Increasing | Not significant |
| SON | 0.25 | 0.06 | 8.17 | 0.2 | Increasing | Not significant | |
| NOAA_CPC | MAM | 0.06 | 0.67 | 1.68 | 0.01 | Increasing | Not significant |
| SON | 0.11 | 0.42 | 1.94 | 0.03 | Increasing | Not significant | |
| PERSIANN | MAM | −0.11 | 0.42 | −0.74 | 0.01 | Decreasing | Not significant |
| SON | 0.08 | 0.57 | 0.44 | 0 | Increasing | Not significant | |
| ERA5 | MAM | −0.24 | 0.07 | −2.82 | 0.07 | Decreasing | Not significant |
| SON | −0.11 | 0.4 | −2.39 | 0.03 | Decreasing | Not significant | |
| GPCC | MAM | −0.04 | 0.75 | −0.82 | 0.01 | Decreasing | Not significant |
| SON | −0.19 | 0.14 | −3.39 | 0.07 | Decreasing | Not significant |
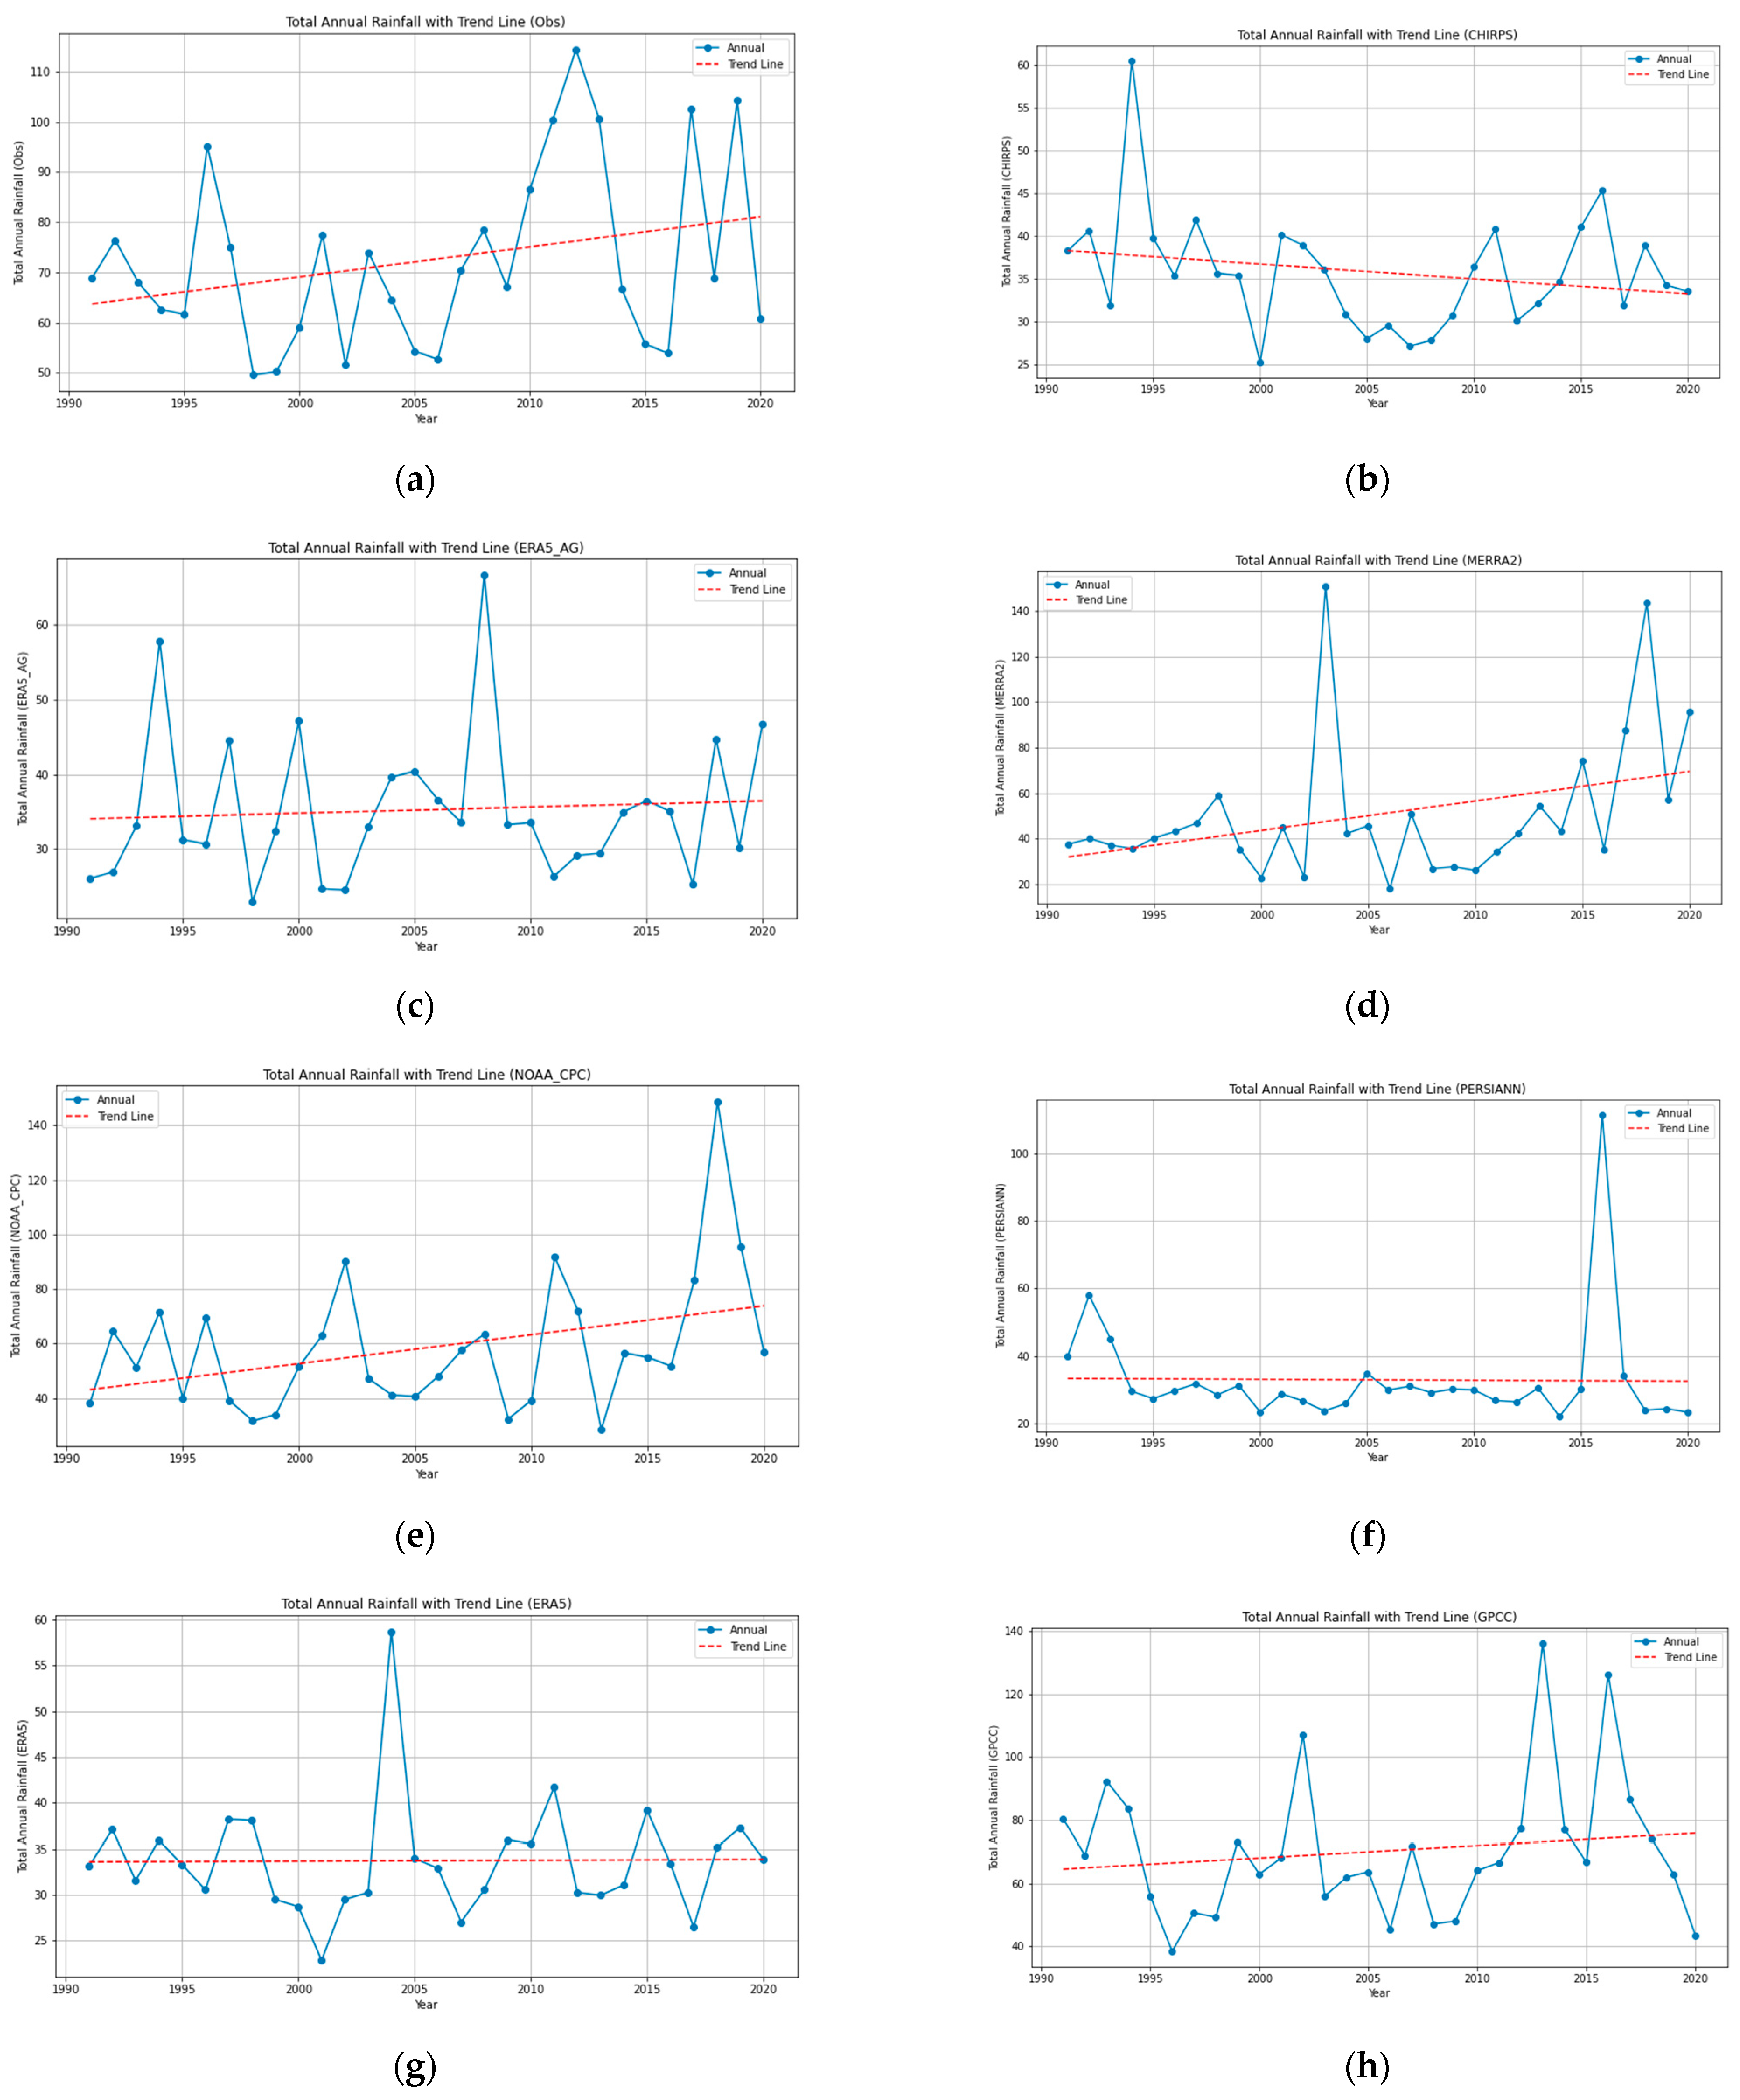
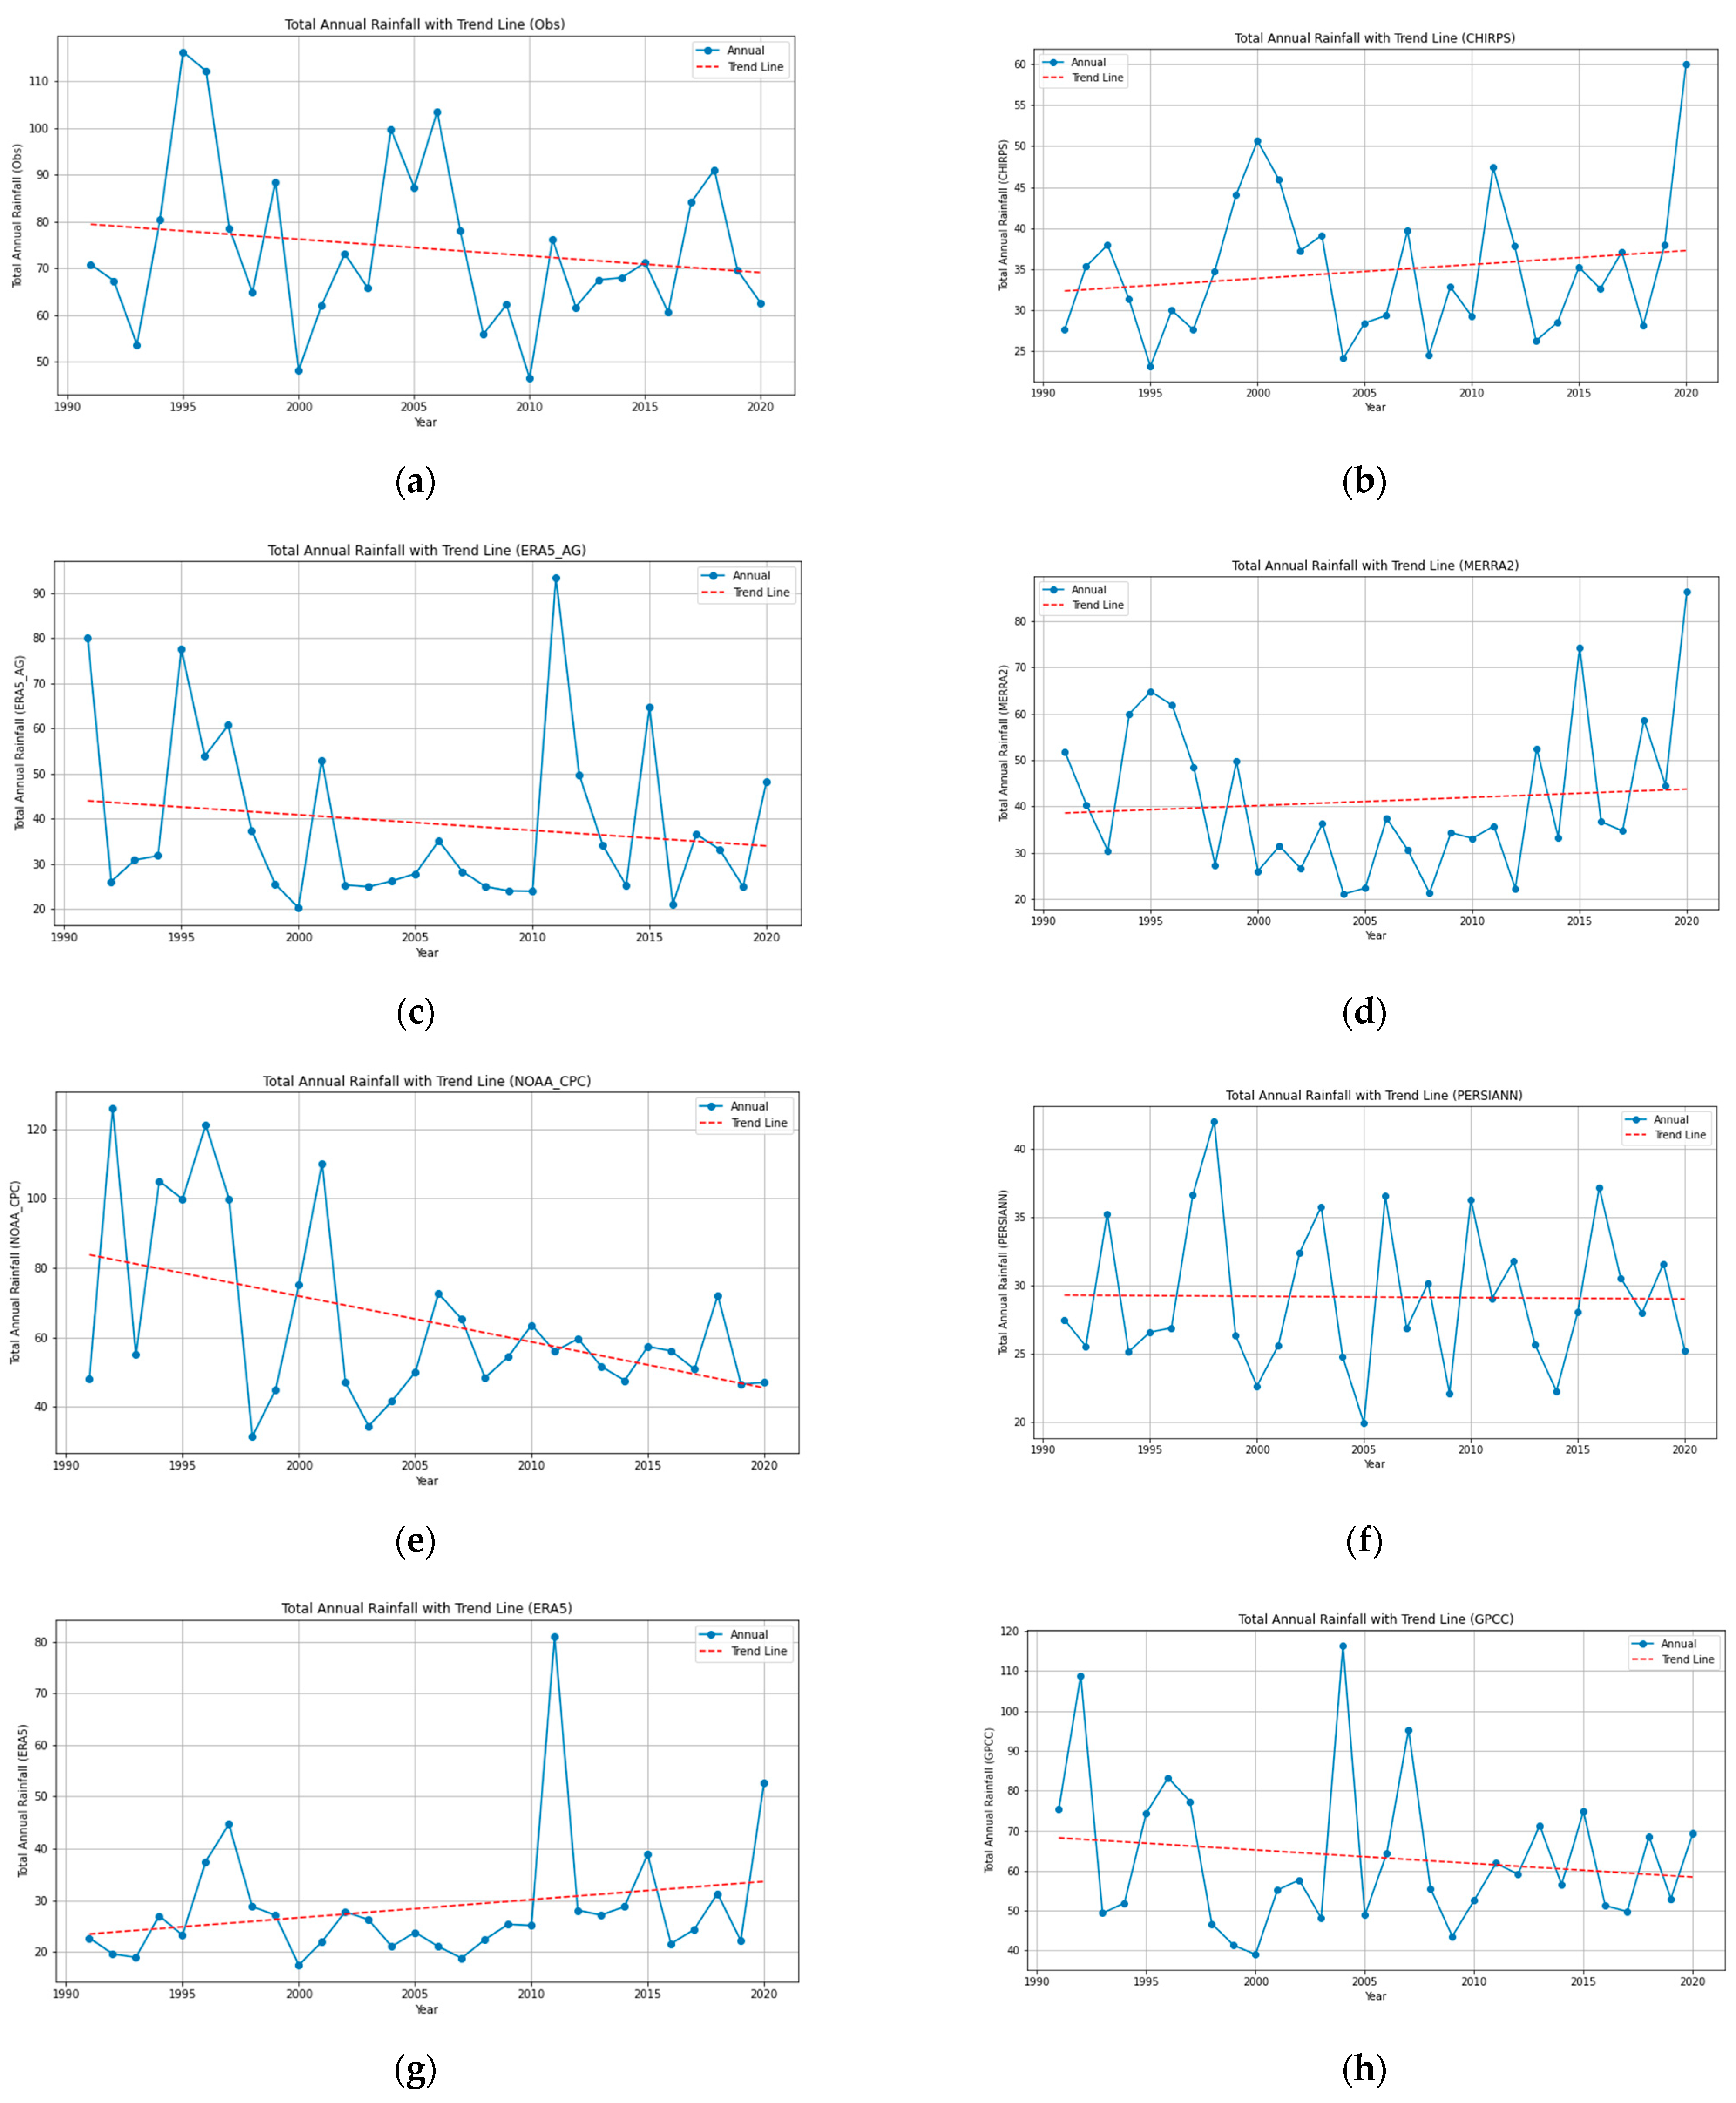
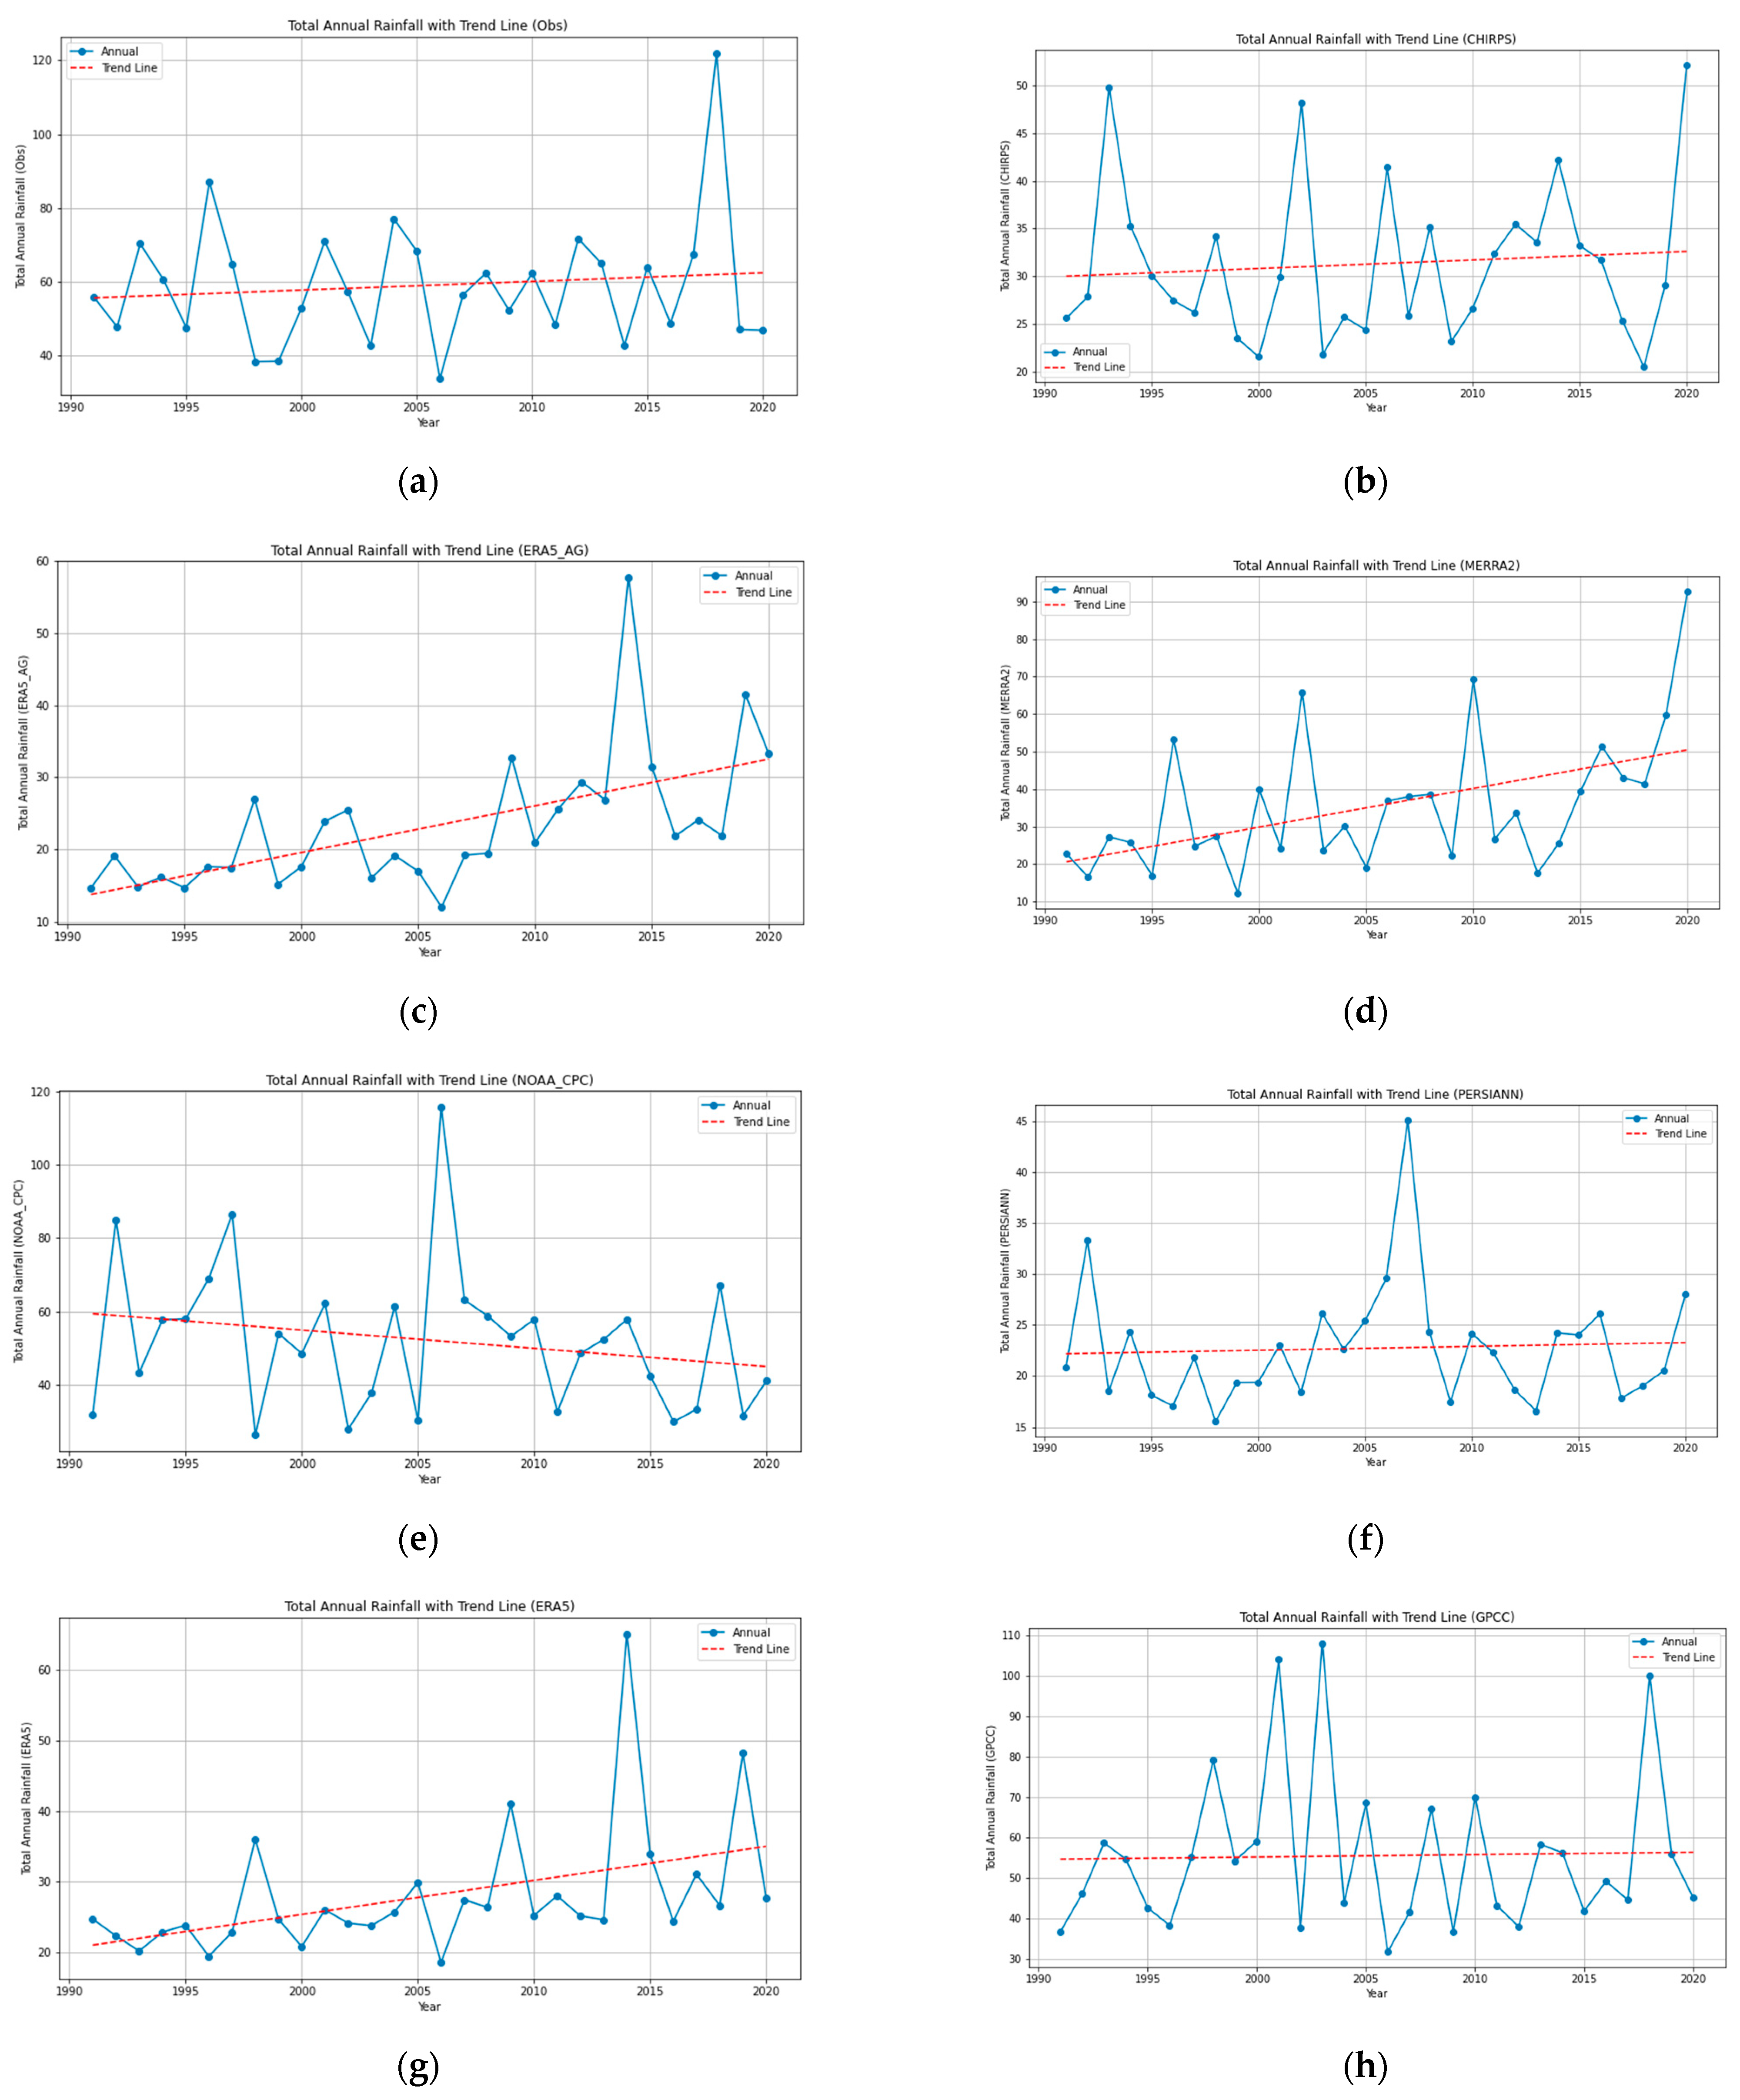
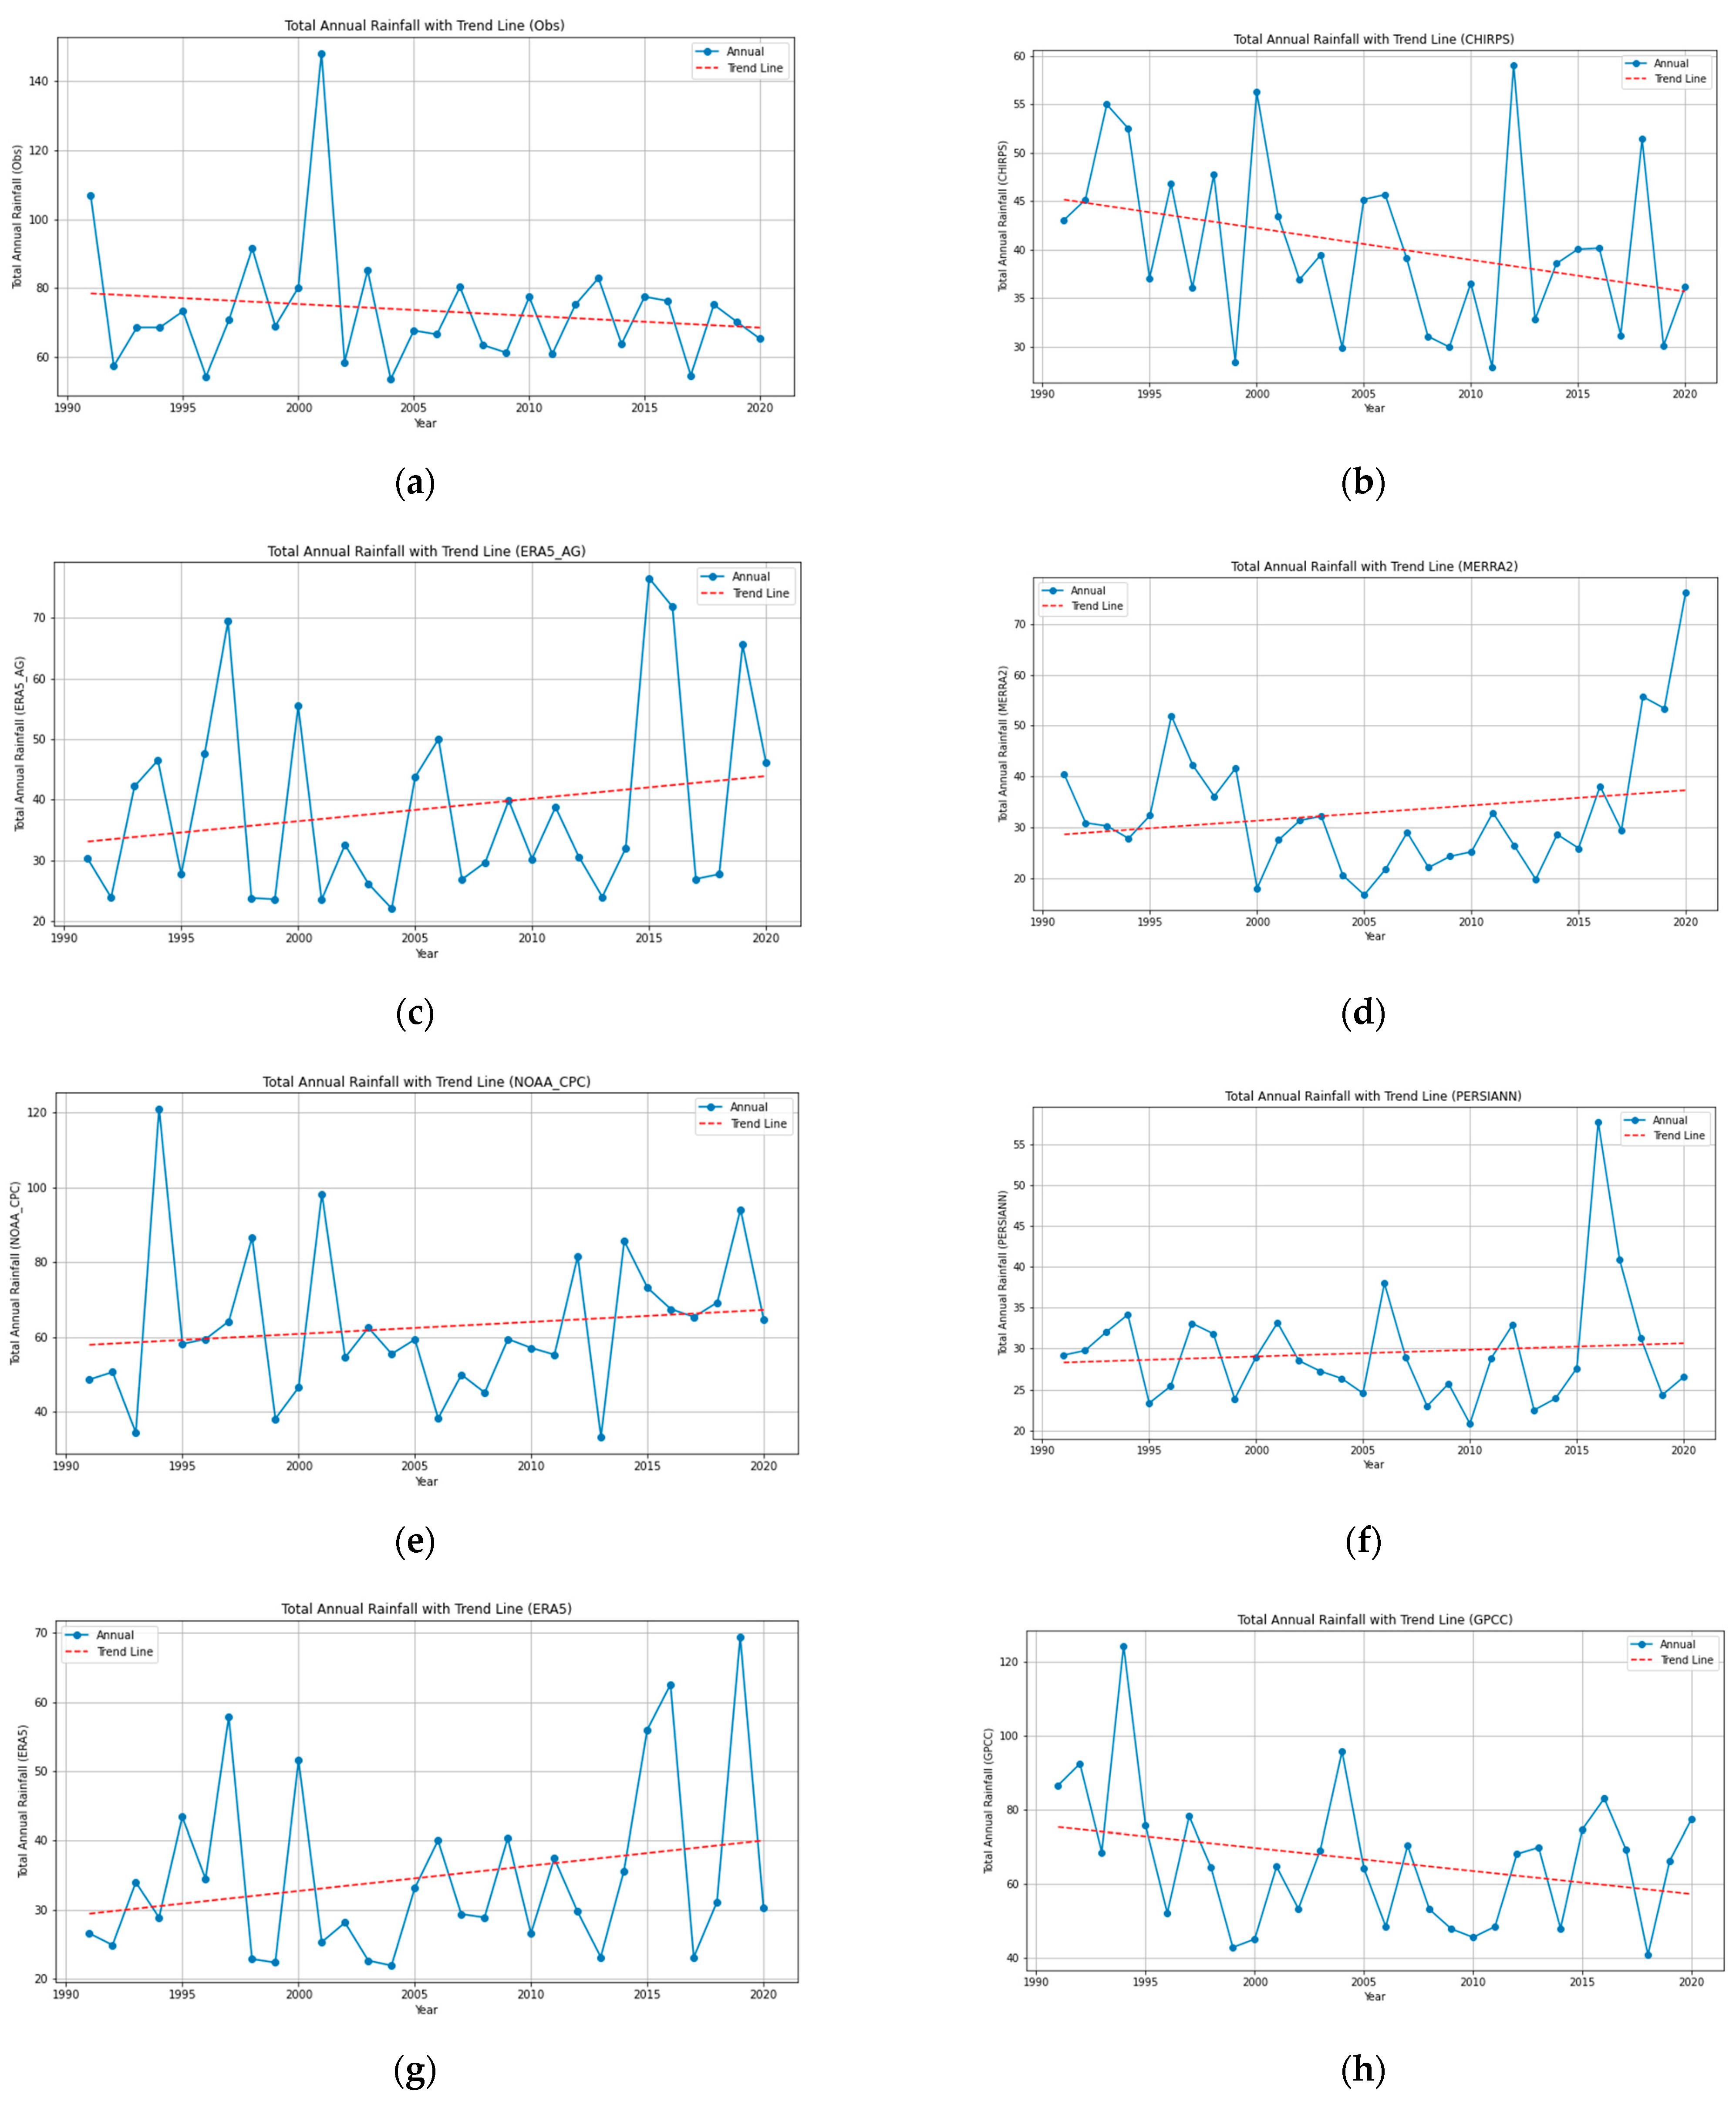
3.2.2. Trends in AMS Rainfall
- At the Mbarara station, all RSR products, except NOAA_CPC, exhibit positive increasing trends in AMS rainfall data the same as the observed rainfall.
- At the Soroti station, only CHIRPS and GPCC display negative decreasing trends in AMS rainfall data the same as the observed rainfall.
- At the Jinja station, only ERA5_AG, GPCC, and NOAA_CPC display negative decreasing trends in AMS rainfall data the same as the observed rainfall.
- At the Gulu station, all RSR products, except CHIRPS and PERSIANN, exhibit positive increasing trends the same as the observed rainfall.
3.3. Data Evaluation Results
3.3.1. Results of AMS Variability Analysis
- At the Jinja station, the results show that the GPCC dataset has the highest correlation with observed data (R = 0.41), indicating better performance compared to other datasets.
- At the Soroti station, the NOAA_CPC (with R = 0.27) performs better compared to the rest of the SRS products.
- At the Mbarara station, the GPCC dataset has the highest correlation with observed data (R = 0.26), indicating better performance compared to other RSR datasets.
- At the Gulu station, the NOAA_CPC (with R = 0.30) performed better compared to the rest of the SRS products.


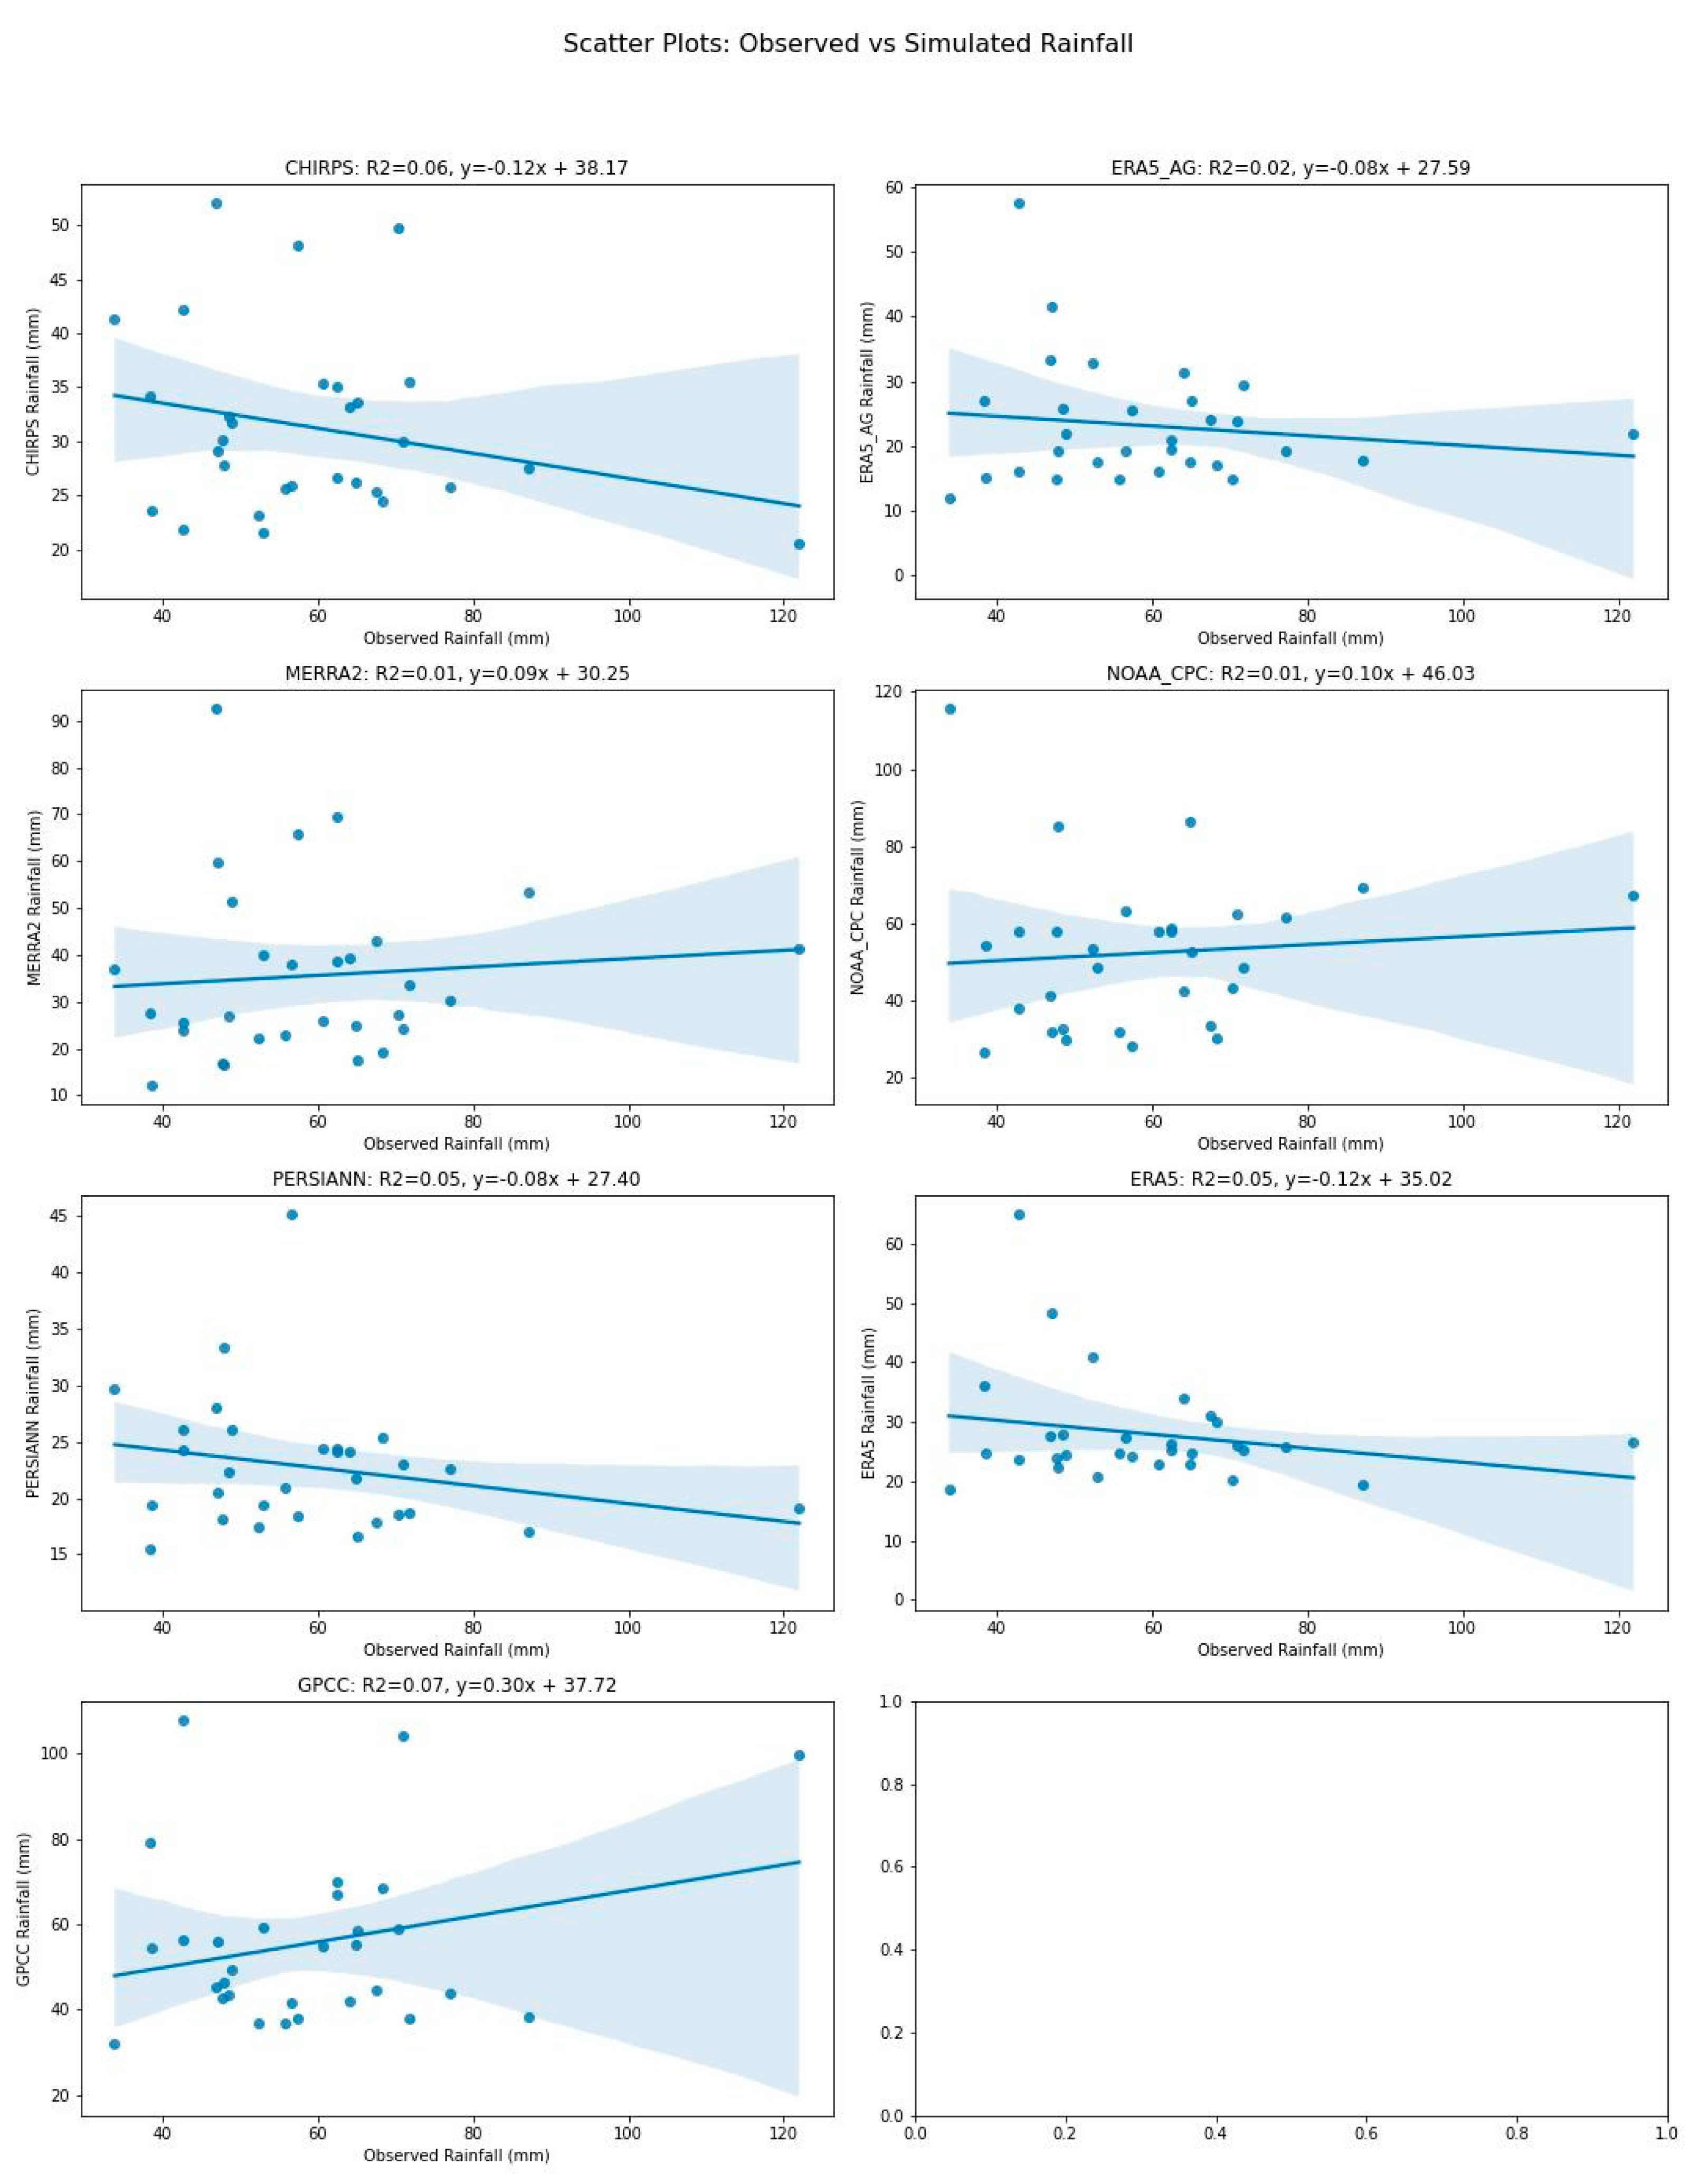

| Rainfall | RMSE | MAE | R | R2 | NRMSE | PBIAS | NSE | SD | CoV |
|---|---|---|---|---|---|---|---|---|---|
| CHIRPS | 45.09 | 39.64 | −0.38 | 0.14 | 0.61 | −53.18 | −5.90 | 8.40 | 0.24 |
| ERA5_AG | 41.30 | 37.04 | 0.30 | 0.09 | 0.56 | −47.51 | −4.79 | 19.08 | 0.49 |
| MERRA2 | 38.52 | 34.87 | 0.30 | 0.09 | 0.52 | −44.57 | −4.04 | 16.25 | 0.39 |
| NOAA_CPC | 27.63 | 23.42 | 0.30 | 0.09 | 0.37 | −12.93 | −1.59 | 25.23 | 0.39 |
| PERSIANN | 48.88 | 45.10 | −0.18 | 0.03 | 0.66 | −60.76 | −7.11 | 5.31 | 0.18 |
| ERA5 | 50.04 | 46.03 | 0.08 | 0.01 | 0.67 | −61.57 | −7.50 | 12.39 | 0.43 |
| GPCC | 22.22 | 17.56 | 0.41 | 0.17 | 0.30 | −14.64 | −0.68 | 18.54 | 0.29 |
| Rainfall | RMSE | MAE | R | R2 | NRMSE | PBIAS | NSE | SD | CoV |
|---|---|---|---|---|---|---|---|---|---|
| CHIRPS | 37.67 | 33.07 | 0.23 | 0.05 | 0.51 | −45.00 | −3.39 | 8.59 | 37.67 |
| ERA5_AG | 43.30 | 35.02 | −0.15 | 0.02 | 0.59 | −47.65 | −4.80 | 15.61 | 43.30 |
| MERRA2 | 46.41 | 41.27 | −0.06 | 0.00 | 0.63 | −55.16 | −5.67 | 12.68 | 46.41 |
| NOAA_CPC | 25.24 | 19.03 | 0.27 | 0.07 | 0.34 | −14.79 | −0.97 | 19.57 | 25.24 |
| PERSIANN | 47.80 | 44.02 | 0.10 | 0.01 | 0.65 | −59.89 | −6.07 | 6.96 | 47.80 |
| ERA5 | 45.02 | 38.76 | −0.09 | 0.01 | 0.61 | −52.74 | −5.28 | 12.62 | 45.02 |
| GPCC | 26.08 | 18.91 | 0.04 | 0.00 | 0.35 | −9.66 | −1.11 | 18.29 | 26.08 |
| Rainfall | RMSE | MAE | R | R2 | NRMSE | PBIAS | NSE | SD | CoV |
|---|---|---|---|---|---|---|---|---|---|
| CHIRPS | 34.56 | 28.61 | −0.24 | 0.06 | 0.59 | −46.99 | −3.13 | 8.23 | 0.26 |
| ERA5_AG | 41.36 | 36.94 | −0.14 | 0.02 | 0.70 | −60.85 | −4.92 | 9.27 | 0.40 |
| MERRA2 | 33.35 | 28.83 | 0.08 | 0.01 | 0.56 | −39.85 | −2.85 | 17.91 | 0.50 |
| NOAA_CPC | 25.77 | 19.51 | 0.09 | 0.01 | 0.44 | −11.63 | −1.30 | 19.70 | 0.38 |
| PERSIANN | 41.10 | 36.33 | −0.23 | 0.05 | 0.70 | −61.51 | −4.84 | 5.84 | 0.26 |
| ERA5 | 37.48 | 32.59 | −0.22 | 0.05 | 0.63 | −52.53 | −3.86 | 9.21 | 0.33 |
| GPCC | 22.62 | 16.60 | 0.26 | 0.07 | 0.38 | −5.93 | −0.77 | 19.63 | 0.35 |
| Rainfall | RMSE | MAE | R | R2 | NRMSE | PBIAS | NSE | SD | CoV |
|---|---|---|---|---|---|---|---|---|---|
| CHIRPS | 41.64 | 36.62 | −0.12 | 0.02 | 0.58 | −50.59 | −4.45 | 6.73 | 0.19 |
| ERA5_AG | 43.27 | 37.14 | −0.23 | 0.05 | 0.60 | −51.32 | −4.89 | 9.79 | 0.28 |
| MERRA2 | 40.75 | 36.06 | 0.09 | 0.01 | 0.56 | −30.01 | −4.22 | 31.14 | 0.61 |
| NOAA_CPC | 29.20 | 22.44 | 0.30 | 0.09 | 0.40 | −19.23 | −1.68 | 24.69 | 0.42 |
| PERSIANN | 47.30 | 43.28 | −0.18 | 0.03 | 0.65 | −54.50 | −6.03 | 16.18 | 0.49 |
| ERA5 | 43.29 | 38.66 | −0.11 | 0.01 | 0.60 | −53.41 | −4.89 | 6.18 | 0.18 |
| GPCC | 27.46 | 21.15 | 0.08 | 0.01 | 0.38 | −3.05 | −1.37 | 22.28 | 0.32 |
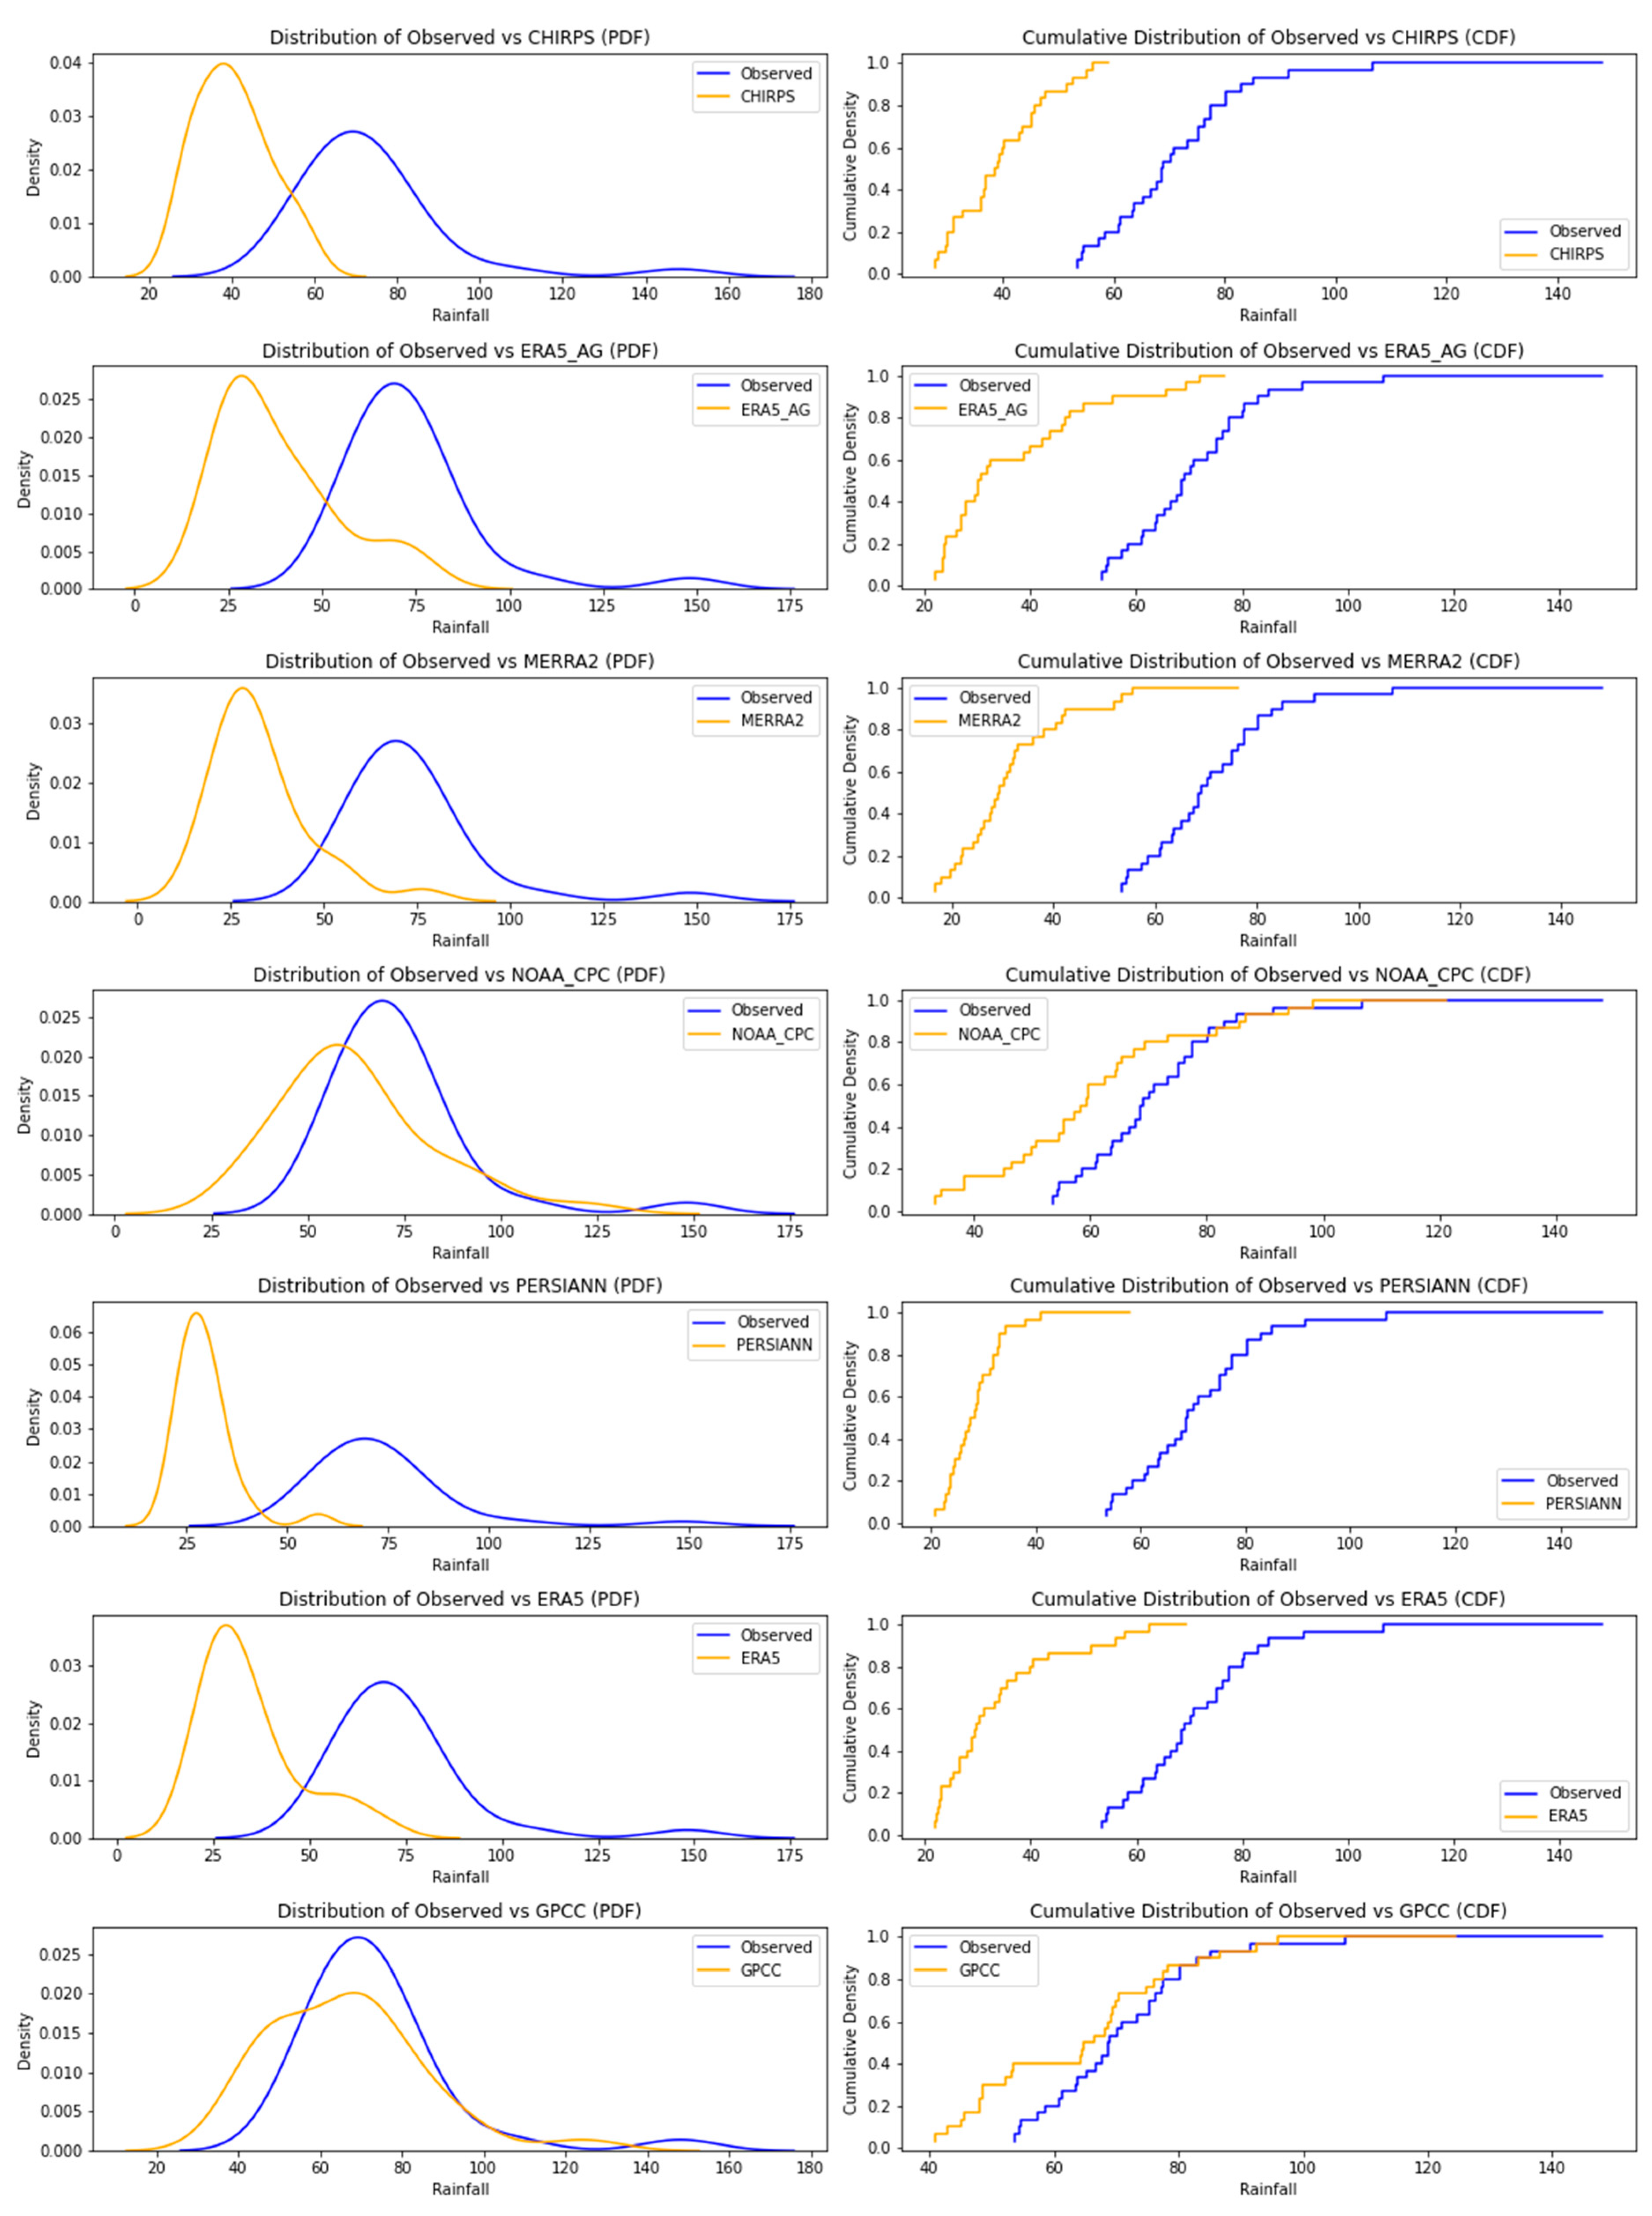
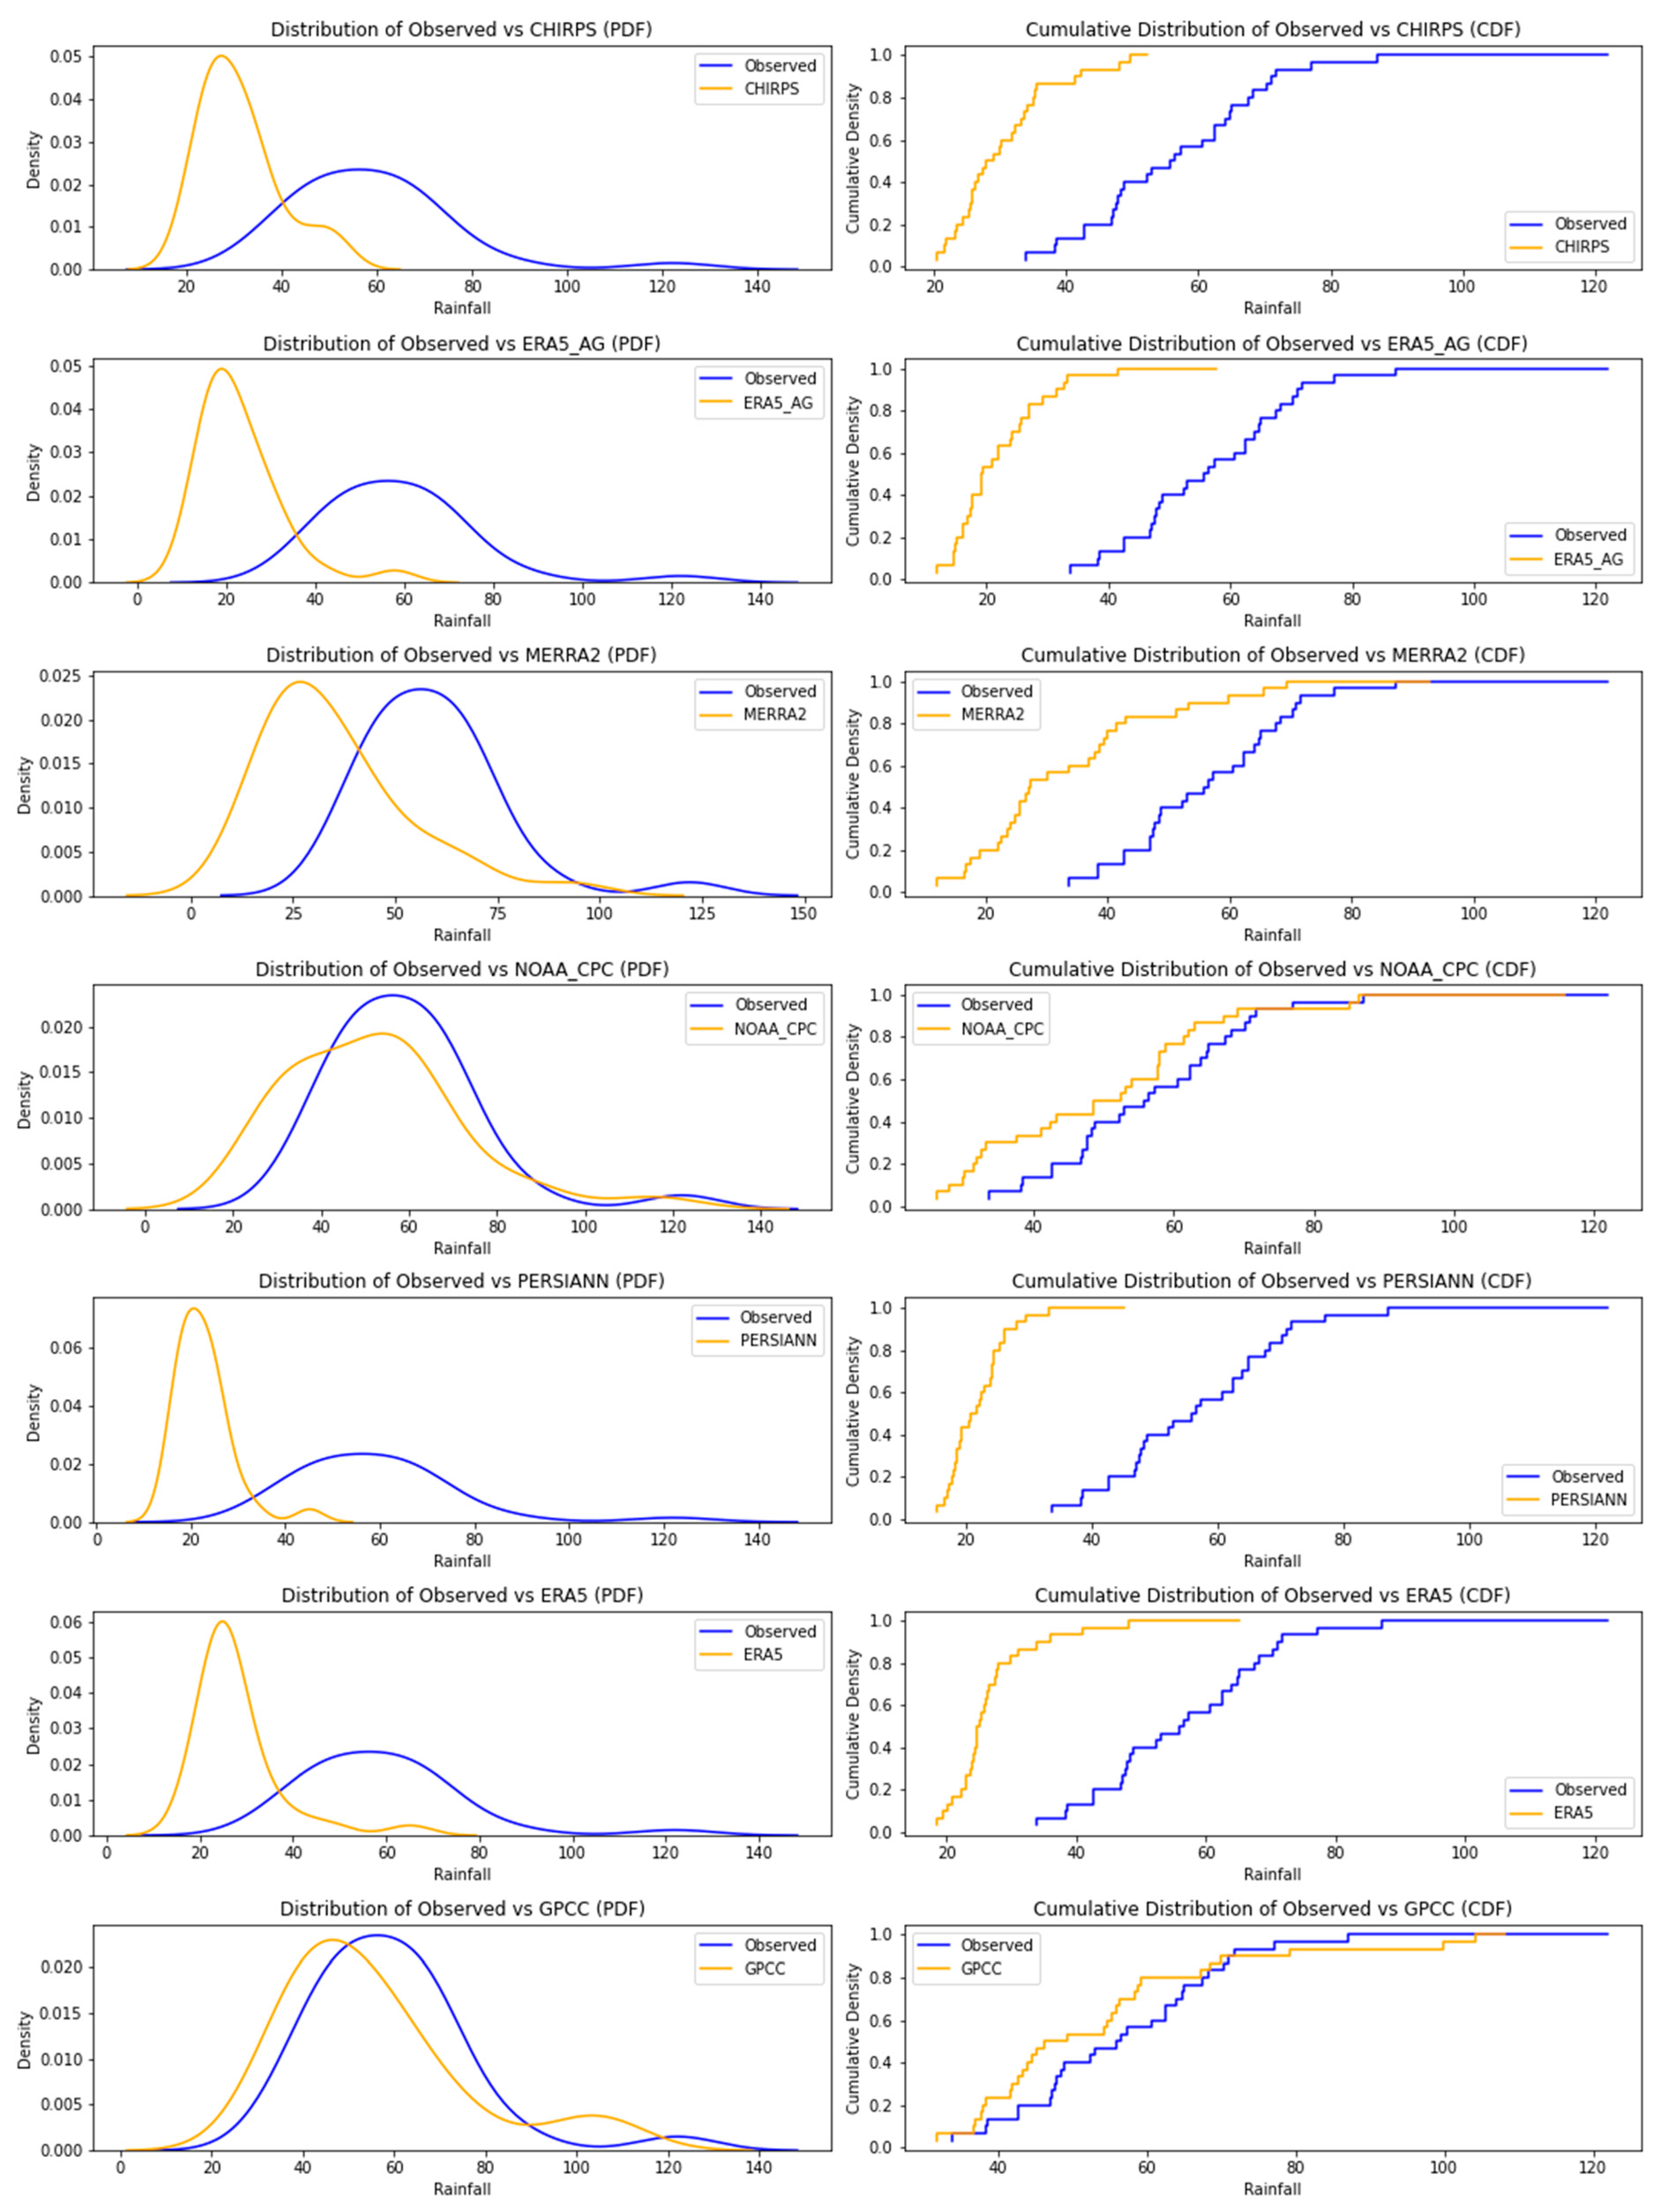
3.3.2. Goodness-of-Fit Test Results
- At the Jinja station, the goodness-of-fit test results show that the GPCC RSR data product, with a KS value of 0.43, outperforms all other products. However, the p-value is less than the 5% significance level, indicating a poor fit.
- Similarly, at the Soroti station, the fit between the observed data and the other RSR products is also poor (p-value less than 5%), although the GPCC product is relatively better with a lower KS value of 0.37.
- At the Gulu and Mbarara stations, the KS test results show a significant agreement between the GPCC dataset and the observed rainfall data, outperforming the other RSR products. The KS p-values for the GPCC distribution against the observed rainfall at the Gulu and Mbarara stations were 0.60 and 0.14, respectively. This suggests that the GPCC data are the most comparable to the observed data in terms of distribution, whereas other datasets exhibit significant biases. Another product that showed a good fit with the observed data distribution is NOAA_CPC, with a p-value of 0.24 at the Mbarara station.
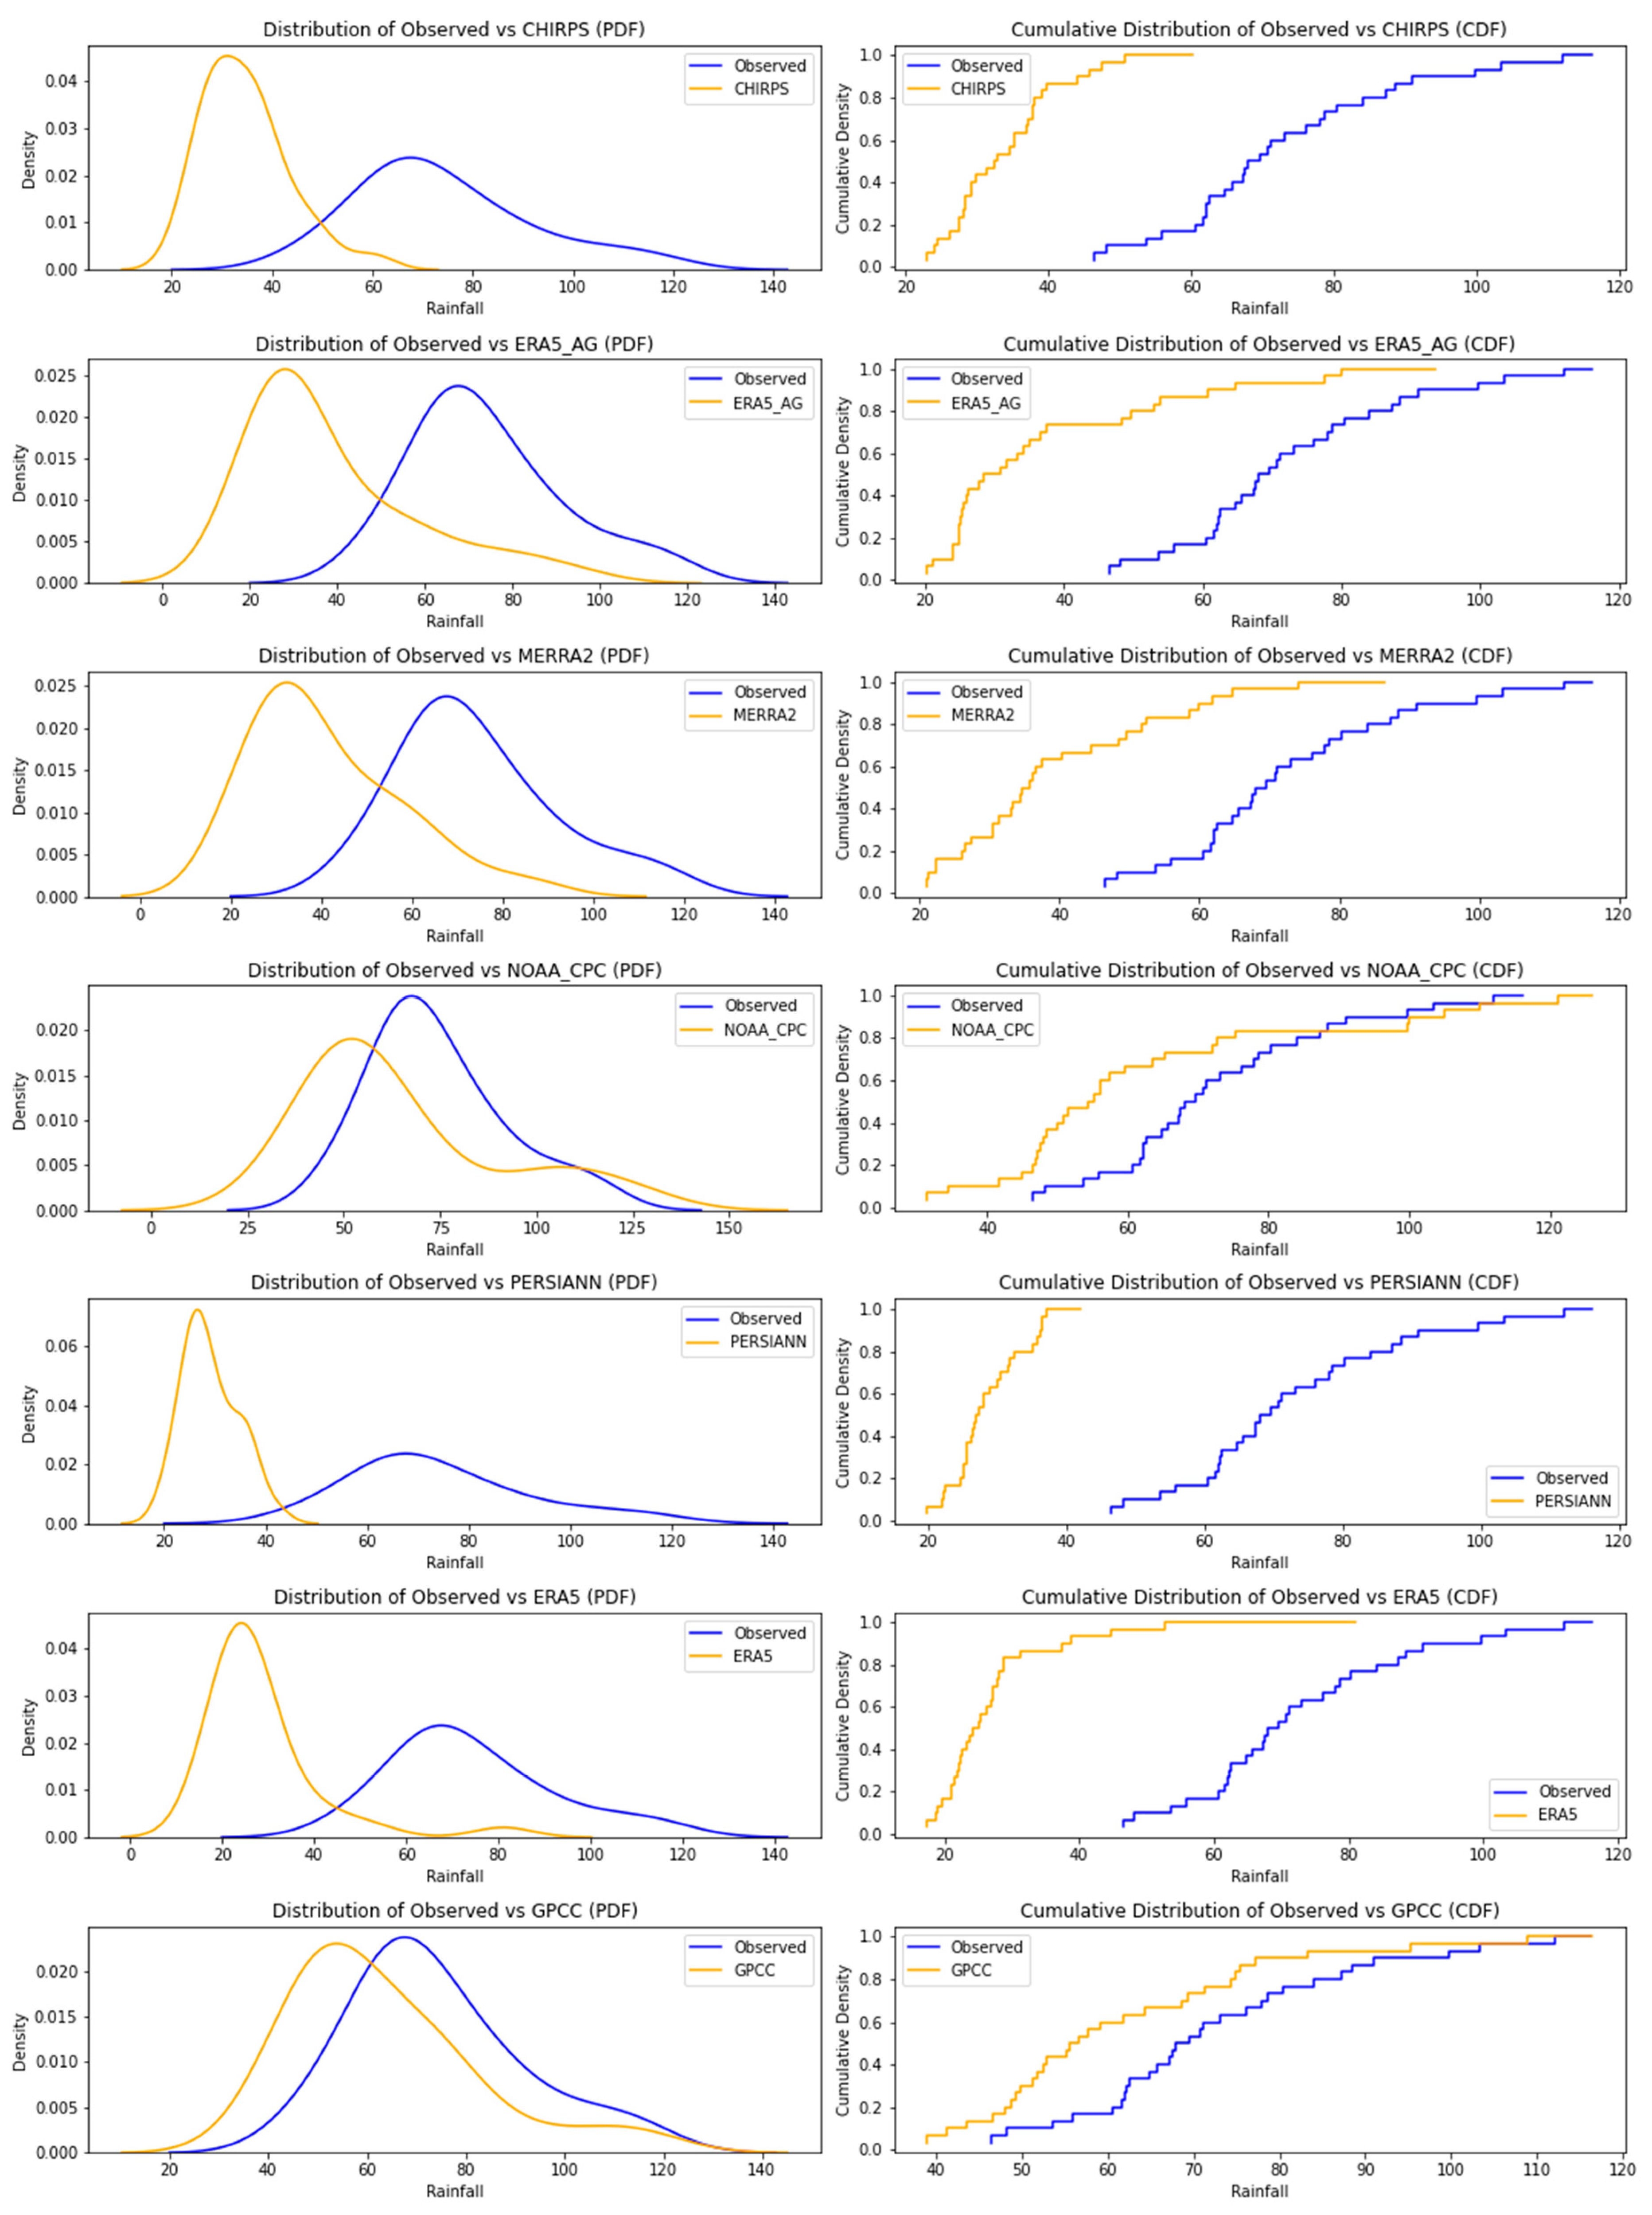
| Jinja Station | Soroti Station | Mbarara Station | Gulu Station | |||||
|---|---|---|---|---|---|---|---|---|
| Rainfall | KS | p-Value | KS | p-Value | KS | p-Value | KS | p-Value |
| CHIRPS | 0.90 | 0.00 | 0.90 | 0.00 | 0.80 | 0.00 | 0.97 | 0.00 |
| ERA5_AG | 0.73 | 0.00 | 0.83 | 0.00 | 0.93 | 0.00 | 0.93 | 0.00 |
| MERRA2 | 0.73 | 0.00 | 0.93 | 0.00 | 0.67 | 0.00 | 0.70 | 0.00 |
| NOAA_CPC | 0.50 | 0.00 | 0.40 | 0.02 | 0.27 | 0.24 | 0.40 | 0.02 |
| PERSIANN | 1.00 | 0.00 | 0.97 | 0.00 | 0.97 | 0.00 | 0.93 | 0.00 |
| ERA5 | 0.93 | 0.00 | 0.87 | 0.00 | 0.87 | 0.00 | 0.97 | 0.00 |
| GPCC | 0.43 | 0.01 | 0.37 | 0.03 | 0.30 | 0.14 | 0.20 | 0.60 |
4. Discussion
4.1. Trends in Seasonal and AMS Rainfall Data
4.2. Variability of Observed AMS and RSR Products
- At the Jinja station location (tropical rainforest climate zone), the best performing product is NOAA_CPC with a PBIAS value of −12.93%, followed by GPCC with a PBIAS value of −14.64%.
- At the Soroti station location (tropical savannah climate zone in eastern Uganda), the best performing product is GPCC with a PBIAS value of −9.66%, followed by NOAA_CPC with a PBIAS value of −14.79%.
- At the Mbarara station location (tropical savannah climate zone in southwest Uganda), the best performing product is GPCC with a PBIAS value of −5.93%, followed by NOAA_CPC with a PBIAS value of −11.63%.
- At the Gulu station location (tropical savannah climate zone in northern Uganda), the best performing product is GPCC with a PBIAS value of −3.05%, followed by NOAA_CPC with a PBIAS value of −19.23%.
4.3. Distribution of RSR Data Compared to Observed AMS Rainfall Data
5. Conclusions
5.1. Trends in Seasonal and AMS Rainfall Data
- At the Gulu station, there are statistically significant increasing trends in observed SON season rainfall.
- At the Mbarara station, MERRA2 and NOAA_CPC RSR data show statistically significant increasing trends for both MAM and SON seasons.
- At the Jinja station, CHIRPS rainfall product shows statistically significant increasing trends for the MAM season, while MERRA2 rainfall product shows statistically significant decreasing trends for the MAM season.
- Only the ERA5_AG and MERRA2 datasets exhibit statistically significant increasing trends in AMS rainfall data at the Mbarara station.
5.2. Variability in AMS Rainfall Data
- At the Jinja station (tropical rainforest climate zone), NOAA_CPC performs best with a PBIAS value of −12.93%, followed by GPCC with a PBIAS value of −14.64%.
- At the Soroti station (tropical savannah climate zone in eastern Uganda), GPCC performs best with a PBIAS value of −9.66%, followed by NOAA_CPC with a PBIAS value of −14.79%.
- At the Mbarara station (tropical savannah climate zone in southwest Uganda), GPCC performs best with a PBIAS value of −5.93%, followed by NOAA_CPC with a PBIAS value of −11.63%.
- At the Gulu station (tropical savannah climate zone in northern Uganda), GPCC performs best with a PBIAS value of −3.05%, followed by NOAA_CPC with a PBIAS value of −19.23%.
5.3. Distribution of RSR Data Compared to Observed Rainfall Data Distribution
5.4. Research Limitations
5.5. Potential Areas for Further Studies
- Investigating the frequency and intensity of extreme weather events, such as droughts and storms, and their correlation with rainfall trends can provide deeper insights into climate variability and its impact on hydrological systems.
- Assessing the long-term impacts of identified trends on water resources, agriculture, and urban infrastructure will be of great value. This could involve hydrological modeling to simulate the effects of changing rainfall patterns on river flows, groundwater recharge, and flood risks.
5.6. Principal Conclusions
Author Contributions
Funding
Institutional Review Board Statement
Informed Consent Statement
Data Availability Statement
Acknowledgments
Conflicts of Interest
Appendix A


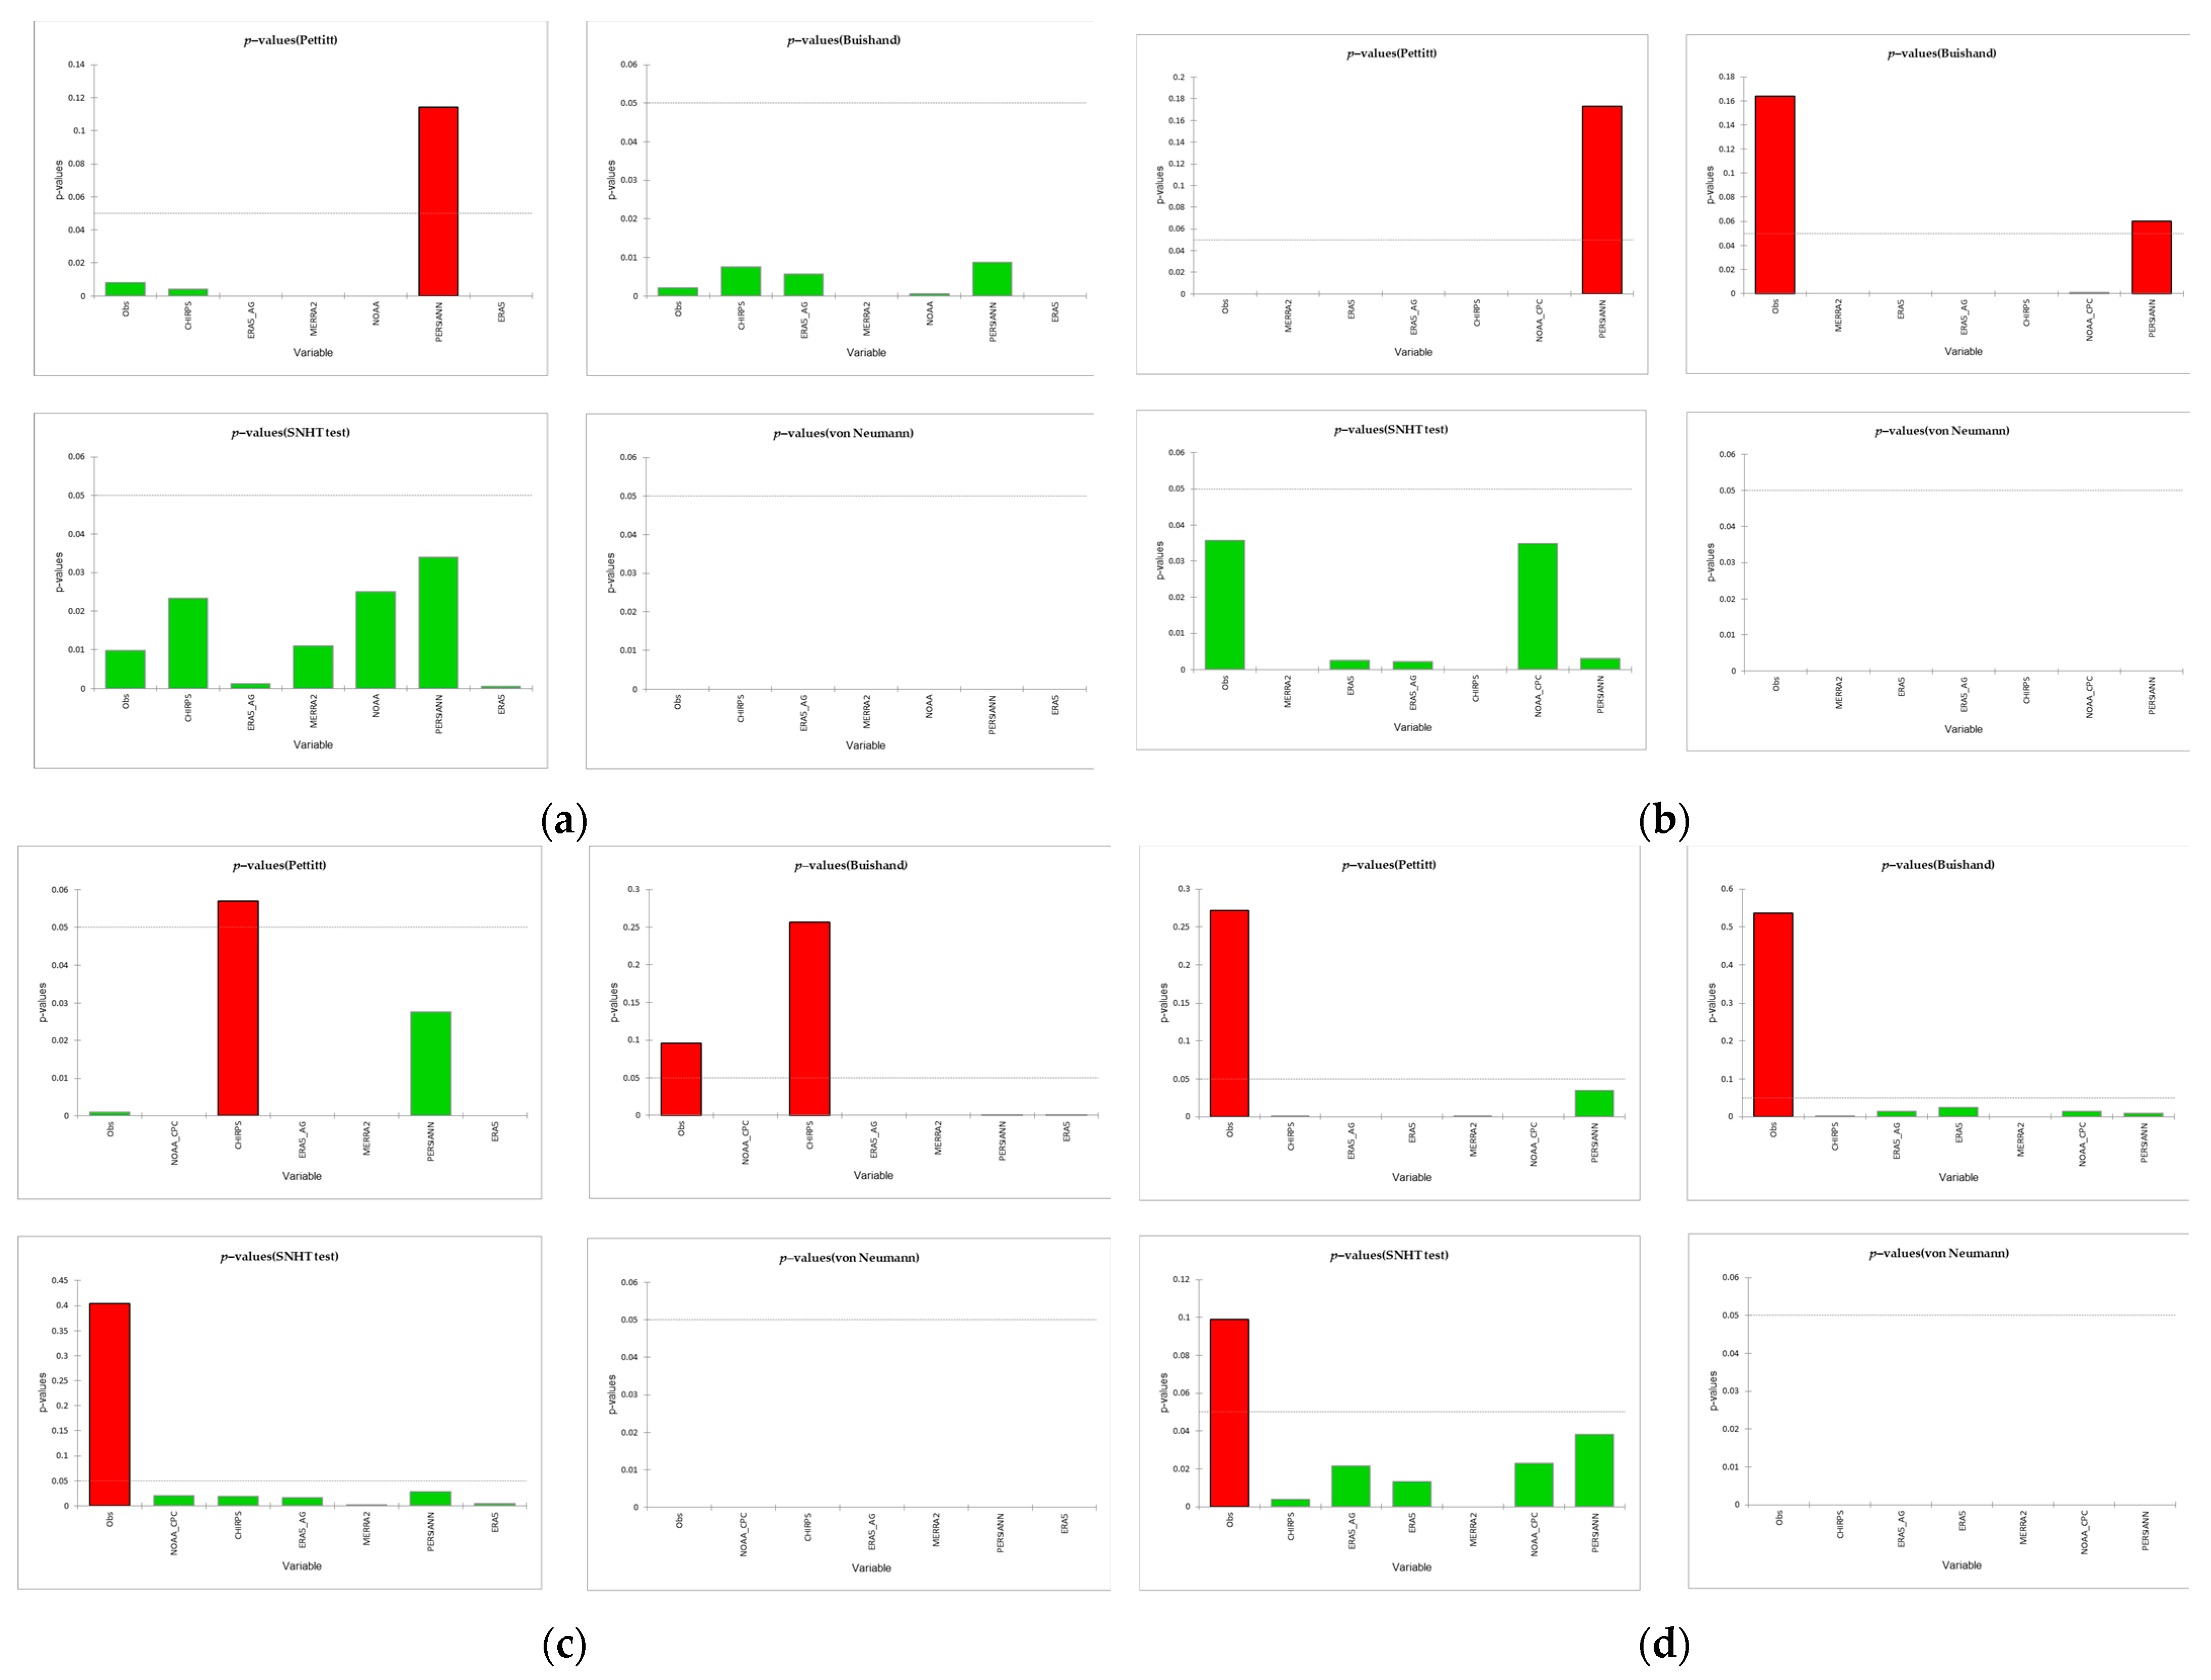
| Rainfall Products | Pettitt | SNHT Test | Buishand | von Neumann |
|---|---|---|---|---|
| Observed | 0.008 | 0.010 | 0.002 | <0.0001 |
| CHIRPS | 0.004 | 0.023 | 0.008 | <0.0001 |
| ERA5_AG | <0.0001 | 0.001 | 0.006 | <0.0001 |
| MERRA2 | <0.0001 | 0.011 | <0.0001 | <0.0001 |
| NOAA | <0.0001 | 0.025 | 0.001 | <0.0001 |
| PERSIANN | 0.114 | 0.034 | 0.009 | <0.0001 |
| ERA5 | <0.0001 | 0.001 | <0.0001 | <0.0001 |
| Rainfall Products | Pettitt | SNHT Test | Buishand | von Neumann |
|---|---|---|---|---|
| Observed | <0.0001 | 0.036 | 0.164 | <0.0001 |
| MERRA2 | <0.0001 | <0.0001 | <0.0001 | <0.0001 |
| ERA5 | <0.0001 | 0.003 | <0.0001 | <0.0001 |
| ERA5_AG | <0.0001 | 0.002 | <0.0001 | <0.0001 |
| CHIRPS | <0.0001 | <0.0001 | <0.0001 | <0.0001 |
| NOAA_CPC | <0.0001 | 0.035 | 0.001 | <0.0001 |
| PERSIANN | 0.173 | 0.003 | 0.060 | <0.0001 |
| Rainfall Products | Pettitt | SNHT Test | Buishand | von Neumann |
|---|---|---|---|---|
| Observed | 0.001 | 0.404 | 0.096 | <0.0001 |
| NOAA_CPC | <0.0001 | 0.020 | <0.0001 | <0.0001 |
| CHIRPS | 0.057 | 0.019 | 0.257 | <0.0001 |
| ERA5_AG | <0.0001 | 0.016 | <0.0001 | <0.0001 |
| MERRA2 | <0.0001 | 0.001 | <0.0001 | <0.0001 |
| PERSIANN | 0.028 | 0.029 | 0.000 | <0.0001 |
| ERA5 | <0.0001 | 0.004 | 0.000 | <0.0001 |
| Rainfall Products | Pettitt | SNHT Test | Buishand | von Neumann |
|---|---|---|---|---|
| Observed | 0.271 | 0.099 | 0.535 | <0.0001 |
| CHIRPS | 0.001 | 0.004 | 0.003 | <0.0001 |
| ERA5_AG | <0.0001 | 0.022 | 0.015 | <0.0001 |
| ERA5 | <0.0001 | 0.013 | 0.024 | <0.0001 |
| MERRA2 | 0.000 | <0.0001 | <0.0001 | <0.0001 |
| NOAA_CPC | <0.0001 | 0.023 | 0.014 | <0.0001 |
| PERSIANN | 0.035 | 0.038 | 0.009 | <0.0001 |

References
- Trewin, B. The Climates of the Tropics, and How They Are Changing. Bureau of Meteorology, 2014; pp. 39–51. Available online: https://www.jcu.edu.au/state-of-the-tropics/publications/2014-state-of-the-tropics-report/2014-essay-pdfs/Essay-1-Trewin.pdf (accessed on 9 September 2023).
- World Bank. Climate Risk Country Profile—Uganda. 2020, p. 36. Available online: https://www.worldbank.org (accessed on 16 December 2022).
- IFRC. DREF Operation MDRSV013; IFRC: Geneva, Switzerland, 2024. [Google Scholar]
- Onyutha, C. Geospatial trends and decadal anomalies in extreme rainfall over Uganda, East Africa. Adv. Meteorol. 2016, 2016, 935912. [Google Scholar] [CrossRef]
- Andre, S.; Abhishek, G.; Slobodan, P.S.; Sandink, D. Computerized Tool for the Development of Intensity-Duration- Frequency Curves Under a Changing Climate, Computerized Tool for the Development of Intensity-Duration- Frequency Curves Under a Changing Climate, Technical Manual; Version 3; The University of Western Ontario, Department of Civil and Environmental Engineering and Institute for Catastrophic Loss Reduction: London, ON, Canada, 2018; Available online: https://www.idf-cc-uwo.ca (accessed on 27 November 2022).
- Van Wageningen, A.; Plessis, J.D. Are rainfall intensities changing, could climate change be blamed and what could be the impact for hydrologists? Water SA 2007, 33, 571–574. [Google Scholar]
- Jokowinarno, D.; Banuwa, I.S.; Yuwono, S.B.; Tugiyono; Bakri, S.; Setiawan, A. IDF (intensity-duration-frequency) curve and unit hydrograph as signature of characteristic changing of Way Kuala Garuntang Watershed. IOP Conf. Ser. Earth Environ. Sci. 2021, 739, 012023. [Google Scholar] [CrossRef]
- Robinson, M.; Ward, R. Hydrology Principles and Processes; IWA Publishing: London, UK, 2017; Volume 4. [Google Scholar]
- Kilama Luwa, J.; Majaliwa, J.-G.M.; Bamutaze, Y.; Kabenge, I.; Pilesjo, P.; Oriangi, G.; Bagula Mukengere, E. Variabilities and Trends of Rainfall, Temperature, and River Flow in Sipi Sub-Catchment on the Slopes of Mt. Elgon, Uganda. Water 2021, 13, 1834. [Google Scholar] [CrossRef]
- Nsubuga, F.W.N.; Botai, O.J.; Olwoch, J.M.; Rautenbach, C.J.D.; Bevis, Y.; Adetunji, A.O. The nature of rainfall in the main drainage sub-basins of Uganda. Hydrol. Sci. J. 2014, 59, 278–299. [Google Scholar] [CrossRef]
- Majaliwa, J.G.M.; Tenywa, M.M.; Bamanya, D.; Majugu, W.; Isabirye, P.; Nandozi, C.; Nampijja, J.; Musinguzi, P.; Nimusiima, A.; Luswata, K.C.; et al. Characterization of Historical Seasonal and Annual Rainfall and Temperature Trends in Selected Climatological Homogenous Rainfall Zones of Uganda. Glob. J. Sci. Front. Res. 2015, 15, 21–40. [Google Scholar]
- Ogwang, B.A.; Ayesiga, G.; Ojara, M.; Kalema, A.; Nimusiima, A.; Tindamanyire, T.; Serwanga, M.N.; Ssebabi, F.; Gugwa, G.; Nsubuga, Y.; et al. Characteristics and changes in SON rainfall over Uganda (1901–2013). J. Environ. Agric. Sci. 2018, 8, 45–53. Available online: https://www.researchgate.net/publication/306324232 (accessed on 22 April 2024).
- Macharia, J.M.; Ngetich, F.K.; Shisanya, C.A. Comparison of satellite remote sensing derived precipitation estimates and observed data in Kenya. Agric. For. Meteorol. 2020, 284, 107875. [Google Scholar] [CrossRef]
- Egeru, A.; MacOpiyo, R.L.; Mburu, J.; Majaliwa, M.G.J.; Aleper, D. Trend in climate variation in Karamoja Sub-region, northern eastern Uganda. In Proceedings of the Fourth RUFORUM Biennial Conference, Maputo, Mozambique, 21–25 July 2014; pp. 449–456. [Google Scholar]
- Beck, H.E.; McVicar, T.R.; Vergopolan, N.; Berg, A.; Lutsko, N.J.; Dufour, A.; Zeng, Z.; Jiang, X.; van Dijk, A.I.J.M.; Miralles, D.G. High-resolution (1 km) Köppen-Geiger maps for 1901–2099 based on constrained CMIP6 projections. Sci. Data 2023, 10, 724. [Google Scholar] [CrossRef]
- WMO. WMO Guidelines on the Calculation of Climate Normals; WMO-No. 1203; WMO: Geneva, Switzerland, 2017; p. 29. Available online: https://library.wmo.int/doc_num.php?explnum_id=4166 (accessed on 25 June 2024).
- MWE. Uganda Wetlands Atlas—Volume One: Kampala City, Mukono and Wakiso Districts; Ministry of Water and Environment: Kampala, Uganda, 2015.
- Uganda National Meteorological Authority. The State of Climate of Uganda in 2019; Uganda National Meteorological Authority: Kampala, Uganda, 2020.
- Raes, D. Frequency Analysis of Rainfall Data. College on Soil Physics—30th Anniversary (1983–2013). 2013, p. 42. Available online: http://indico.ictp.it/event/a12165/session/21/contribution/16/material/0/0.pdf (accessed on 2 June 2023).
- Duan, Z.; Liu, J.; Tuo, Y.; Chiogna, G.; Disse, M. Evaluation of eight high spatial resolution gridded precipitation products in Adige Basin (Italy) at multiple temporal and spatial scales. Sci. Total Environ. 2016, 573, 1536–1553. [Google Scholar] [CrossRef]
- Plessis, J.D.; Kibii, J. Applicability of CHIRPS-based satellite rainfall estimates for South Africa. J. S. Afr. Inst. Civ. Eng. 2021, 63, 43–54. [Google Scholar] [CrossRef]
- Subramanya, K. Engineering Hydrology; Tata McGraw-Hill: New York, NY, USA, 2008. [Google Scholar]
- Zhao, C.; Yang, J. A Robust Skewed Boxplot for Detecting Outliers in Rainfall Observations in Real-Time Flood Forecasting. Adv. Meteorol. 2019, 2019, 795673. [Google Scholar] [CrossRef]
- Arikan, B.B.; Kahya, E. Homogeneity revisited: Analysis of updated precipitation series in Turkey. Theor. Appl. Climatol. 2019, 135, 211–220. [Google Scholar] [CrossRef]
- Mohammed, R.; Scholz, M. Quality Control and Homogeneity Analysis of Precipitation Time Series in the Climatic Region of Iraq. Atmosphere 2023, 14, 197. [Google Scholar] [CrossRef]
- Kocsis, T.; Kovács-Székely, I.; Anda, A. Homogeneity tests and non-parametric analyses of tendencies in precipitation time series in Keszthely, Western Hungary. Theor. Appl. Climatol. 2020, 139, 849–859. [Google Scholar] [CrossRef]
- Pohlert, T. trend: Non-Parametric Trend Tests and Change-Point Detection. 2020, pp. 1–18. Available online: http://download.nust.na/pub3/cran/web/packages/trend/vignettes/trend.pdf (accessed on 9 December 2022).
- Maity, R. Statistical Methods in Hydrology, 2nd ed.; Springer: Singapore, 2022. [Google Scholar] [CrossRef]
- Meals, D.W.; Spooner, J.; Dressing, S.A.; Jon, B.H. Statistical Analysis for Monotonic Trends; Tech Notes 6; Tetra Tech, Inc.: Fairfax, VA, USA, 2011. [Google Scholar] [CrossRef]
- Ay, M.; Kisi, O. Investigation of trend analysis of monthly total precipitation by an innovative method. Theor. Appl. Climatol. 2015, 120, 617–629. [Google Scholar] [CrossRef]
- Caloiero, T.; Coscarelli, R.; Ferrari, E. Application of the Innovative Trend Analysis Method for the Trend Analysis of Rainfall Anomalies in Southern Italy. Water Resour. Manag. 2018, 32, 4971–4983. [Google Scholar] [CrossRef]
- Ali, R.; Kuriqi, A.; Abubaker, S.; Kisi, O. Long-term trends and seasonality detection of the observed flow in Yangtze River using Mann-Kendall and Sen’s innovative trend method. Water 2019, 11, 1855. [Google Scholar] [CrossRef]
- Rathnayake, U. Comparison of Statistical Methods to Graphical Methods in Rainfall Trend Analysis: Case Studies from Tropical Catchments. Adv. Meteorol. 2019, 2019, 8603586. [Google Scholar] [CrossRef]
- Pathak, A.A.; Dodamani, B.M. Trend analysis of rainfall, rainy days and drought: A case study of Ghataprabha River Basin, India. Model. Earth Syst. Environ. 2020, 6, 1357–1372. [Google Scholar] [CrossRef]
- Saini, A.; Sahu, N.; Kumar, P.; Nayak, S.; Duan, W.; Avtar, R.; Behera, S. Advanced rainfall trend analysis of 117 years over west coast plain and hill agro-climatic region of India. Atmosphere 2020, 11, 1225. [Google Scholar] [CrossRef]
- Rahman, M.N.; Azim, S.A. Spatiotemporal evaluation of rainfall trend during 1979-2019 in seven climatic zones of Bangladesh. Geol. Ecol. Landsc. 2021, 7, 340–355. [Google Scholar] [CrossRef]
- Mirhosseini, G.; Puneet, S.; Xing, F. Developing Rainfall Intensity-Duration-Frequency Curves for Alabama under Future Climate Scenarios Using Artificial Neural Networks. J. Hydrol. Eng. 2014, 19, 04014022. [Google Scholar] [CrossRef]
- Naghettini, M. Fundamentals of Statistical Hydrology; Springer: Cham, Switzerland, 2016. [Google Scholar] [CrossRef]
- Noor, M.; Ismail, T.; Chung, E.S.; Shahid, S.; Sung, J.H. Uncertainty in rainfall intensity duration frequency curves of Peninsular Malaysia under changing climate scenarios. Water 2018, 10, 1750. [Google Scholar] [CrossRef]
- Eini, M.R.; Olyaei, M.A.; Kamyab, T.; Teymoori, J.; Brocca, L.; Piniewski, M. Evaluating three non-gauge-corrected satellite precipitation estimates by a regional gauge interpolated dataset over Iran. J. Hydrol. Reg. Stud. 2021, 38, 100942. [Google Scholar] [CrossRef]
- Legates, D.R.; McCabe, G.J. Evaluating the use of ‘goodness-of-fit’ measures in hydrologic and hydroclimatic model validation. Water Resour. Res. 1999, 35, 233–241. [Google Scholar] [CrossRef]
- Karamouz, M.; Nazif, S.; Falahi, M. Hydrology and Hydroclimatology: Principles and Applications; CRC Press: Boca Raton, FL, USA, 2012. [Google Scholar] [CrossRef]
- Zhang, J.; Xu, J.; Dai, X.; Ruan, H.; Liu, X.; Jing, W. Multi-Source Precipitation Data Merging for Heavy Rainfall Events Based on Cokriging and Machine Learning Methods. Remote Sens. 2022, 14, 1750. [Google Scholar] [CrossRef]
- Mdegela, L.; Municio, E.; De Bock, Y.; Luhanga, E.; Leo, J.; Mannens, E. Extreme Rainfall Event Classification Using Machine Learning for Kikuletwa River Floods. Water 2023, 15, 1021. [Google Scholar] [CrossRef]
- Moriasi, D.N.; Arnold, J.G.; Van Liew, M.W.; Bingner, R.L.; Harmel, R.D.; Veith, T.L. Model evaluation guidelines for systematic quantification of accuracy in watershed simulations. Am. Soc. Agric. Biol. Eng. 2007, 50, 885–900. [Google Scholar]


| Rainfall | Season | Tau | p-Value | Slope (mm/Year) | R2 Value | Trend | Statistical Significancy |
|---|---|---|---|---|---|---|---|
| Observed | MAM | 0.05 | 0.72 | 1.32 | 0.02 | Increasing | Not significant |
| SON | −0.01 | 0.95 | −0.11 | 0 | Decreasing | Not significant | |
| CHIRPS | MAM | 0.15 | 0.24 | 1.78 | 0.08 | Increasing | Not significant |
| SON | 0.03 | 0.8 | 0.06 | 0 | Increasing | Not significant | |
| ERA5_AG | MAM | −0.08 | 0.57 | −0.5 | 0.01 | Decreasing | Not significant |
| SON | 0.09 | 0.48 | 0.22 | 0 | Increasing | Not significant | |
| MERRA2 | MAM | 0.4 | 0 | 6.23 | 0.28 | Increasing | Significant |
| SON | 0.31 | 0.02 | 4.95 | 0.26 | Increasing | Significant | |
| NOAA_CPC | MAM | 0.3 | 0.02 | 4.97 | 0.12 | Increasing | Significant |
| SON | 0.26 | 0.04 | 4 | 0.17 | Increasing | Significant | |
| PERSIANN | MAM | −0.01 | 0.94 | 0.06 | 0 | Increasing | Not significant |
| SON | −0.2 | 0.13 | −1.62 | 0.07 | Decreasing | Not significant | |
| ERA5 | MAM | −0.1 | 0.46 | −0.79 | 0.01 | Decreasing | Not significant |
| SON | 0.14 | 0.3 | 1.25 | 0.02 | Increasing | Not significant | |
| GPCC | MAM | −0.001 | 1 | −0.38 | 0 | Decreasing | Not significant |
| SON | 0 | 1 | −0.15 | 0 | Decreasing | Not significant |
| Rainfall | Season | Tau | p-Value | Slope (mm/Year) | R2 Value | Trend | Statistical Significancy |
|---|---|---|---|---|---|---|---|
| Observed | MAM | 0.01 | 0.97 | −2.17 | 0.03 | Decreasing | Not significant |
| SON | −0.02 | 0.89 | 1.28 | 0.01 | Increasing | Not significant | |
| CHIRPS | MAM | 0.09 | 0.48 | 0.99 | 0.01 | Increasing | Not significant |
| SON | 0.13 | 0.32 | 3.63 | 0.11 | Increasing | Not significant | |
| ERA5_AG | MAM | −0.1 | 0.44 | −1.41 | 0.03 | Decreasing | Not significant |
| SON | 0 | 1 | 0.38 | 0 | Increasing | Not significant | |
| MERRA2 | MAM | 0.13 | 0.32 | 2.37 | 0.04 | Increasing | Not significant |
| SON | 0.17 | 0.19 | 4.73 | 0.15 | Increasing | Not significant | |
| NOAA_CPC | MAM | 0.03 | 0.86 | 0.75 | 0 | Increasing | Not significant |
| SON | 0.07 | 0.62 | 0.92 | 0.01 | Increasing | Not significant | |
| PERSIANN | MAM | −0.09 | 0.48 | −1.13 | 0.02 | Decreasing | Not significant |
| SON | −0.06 | 0.67 | −0.29 | 0 | Decreasing | Not significant | |
| ERA5 | MAM | −0.12 | 0.36 | −1.8 | 0.05 | Decreasing | Not significant |
| SON | 0.05 | 0.7 | 1.14 | 0.01 | Increasing | Not significant | |
| GPCC | MAM | 0.11 | 0.4 | 1.92 | 0.02 | Increasing | Not significant |
| SON | 0.09 | 0.5 | 1.66 | 0.02 | Increasing | Not significant |
| Rainfall | Season | Tau | p-Value | Slope (mm/Year) | R2 Value | Trend | Statistical Significancy |
|---|---|---|---|---|---|---|---|
| Observed | MAM | −0.04 | 0.75 | −2.17 | 0.03 | Decreasing | Not Significant |
| SON | 0.15 | 0.26 | 3.34 | 0.05 | Increasing | Not Significant | |
| CHIRPS | MAM | 0.28 | 0.03 | 4.41 | 0.22 | Increasing | Significant |
| SON | 0.24 | 0.06 | 7.99 | 0.25 | Increasing | Not Significant | |
| ERA5_AG | MAM | −0.09 | 0.48 | −2.00 | 0.03 | Decreasing | Not Significant |
| SON | −0.17 | 0.19 | −2.12 | 0.05 | Decreasing | Not Significant | |
| MERRA2 | MAM | −0.26 | 0.04 | −9.55 | 0.22 | Decreasing | Significant |
| SON | −0.03 | 0.83 | −0.75 | 0.00 | Decreasing | Not Significant | |
| NOAA_CPC | MAM | −0.13 | 0.34 | −3.96 | 0.07 | Decreasing | Not Significant |
| SON | 0.09 | 0.48 | 2.40 | 0.05 | Increasing | Not Significant | |
| PERSIANN | MAM | −0.03 | 0.80 | 0.31 | 0.00 | Decreasing | Not Significant |
| SON | 0.08 | 0.55 | 2.00 | 0.03 | Increasing | Not Significant | |
| ERA5 | MAM | −0.08 | 0.57 | −1.15 | 0.01 | Decreasing | Not Significant |
| SON | −0.19 | 0.14 | −1.66 | 0.03 | Decreasing | Not Significant | |
| GPCC | MAM | −0.02 | 0.92 | −0.07 | 0.00 | Decreasing | Not Significant |
| SON | 0.07 | 0.62 | 2.17 | 0.02 | Increasing | Not Significant |
| Rainfall | Tau | p-Value | Slope (mm/Year) | R2 Value | Trend | Statistical Significancy |
|---|---|---|---|---|---|---|
| Observed | −0.09 | 0.50 | −0.36 | 0.03 | Decreasing | Not Significant |
| CHIRPS | 0.09 | 0.50 | 0.17 | 0.03 | Increasing | Not Significant |
| ERA5_AG | −0.13 | 0.32 | −0.34 | 0.02 | Decreasing | Not Significant |
| MERRA2 | 0.04 | 0.78 | 0.18 | 0.01 | Increasing | Not Significant |
| NOAA_CPC | −0.20 | 0.13 | −1.32 | 0.21 | Decreasing | Not Significant |
| PERSIANN | 0.02 | 0.89 | −0.01 | 0.00 | Increasing | Not Significant |
| ERA5 | 0.19 | 0.15 | 0.35 | 0.06 | Increasing | Not Significant |
| GPCC | −0.01 | 0.94 | −0.34 | 0.03 | Decreasing | Not Significant |
| Rainfall | Tau | p-Value | Slope (mm/Year) | R2 Value | Trend | Statistical Significancy |
|---|---|---|---|---|---|---|
| Observed | −0.05 | 0.68 | −0.34 | 0.03 | Decreasing | Not Significant |
| CHIRPS | −0.22 | 0.09 | −0.33 | 0.11 | Decreasing | Not Significant |
| ERA5_AG | 0.13 | 0.34 | 0.37 | 0.04 | Increasing | Not Significant |
| MERRA2 | 0.02 | 0.92 | 0.30 | 0.04 | Increasing | Not Significant |
| NOAA_CPC | 0.21 | 0.11 | 0.32 | 0.02 | Increasing | Not Significant |
| PERSIANN | −0.10 | 0.46 | 0.08 | 0.01 | Increasing | Not Significant |
| ERA5 | 0.16 | 0.21 | 0.37 | 0.06 | Increasing | Not Significant |
| GPCC | −0.14 | 0.30 | −0.62 | 0.09 | Decreasing | Not Significant |
| Rainfall | Tau | p-Value | Slope (mm/year) | R2 Value | Trend | Statistical Significancy |
|---|---|---|---|---|---|---|
| Observed | 0.01 | 0.93 | 0.23 | 0.01 | Increasing | Not Significant |
| CHIRPS | 0.04 | 0.78 | 0.09 | 0.01 | Increasing | Not Significant |
| ERA5_AG | 0.54 | 0.00 | 0.65 | 0.37 | Increasing | Significant |
| MERRA2 | 0.37 | 0.00 | 1.03 | 0.25 | Increasing | Significant |
| NOAA_CPC | −0.15 | 0.24 | −0.50 | 0.05 | Decreasing | Not Significant |
| PERSIANN | 0.08 | 0.55 | 0.04 | 0.00 | Increasing | Not Significant |
| ERA5 | 0.43 | 0.00 | 0.48 | 0.21 | Increasing | Not Significant |
| GPCC | 0.04 | 0.78 | 0.06 | 0.00 | Increasing | Not Significant |
| Rainfall | Tau | p-Value | Slope (mm/Year) | R2 Value | Trend | Statistical Significancy |
|---|---|---|---|---|---|---|
| Observed | 0.16 | 0.21 | 0.60 | 0.08 | Increasing | Not Significant |
| CHIRPS | −0.11 | 0.42 | −0.17 | 0.05 | Decreasing | Not Significant |
| ERA5_AG | 0.13 | 0.32 | 0.08 | 0.01 | Increasing | Not Significant |
| MERRA2 | 0.25 | 0.05 | 1.30 | 0.13 | Increasing | Not Significant |
| NOAA_CPC | 0.22 | 0.09 | 1.06 | 0.14 | Increasing | Not Significant |
| PERSIANN | −0.22 | 0.09 | −0.03 | 0.00 | Decreasing | Not Significant |
| ERA5 | 0.03 | 0.83 | 0.01 | 0.00 | Increasing | Not Significant |
| GPCC | 0.05 | 0.70 | 0.39 | 0.02 | Increasing | Not Significant |
Disclaimer/Publisher’s Note: The statements, opinions and data contained in all publications are solely those of the individual author(s) and contributor(s) and not of MDPI and/or the editor(s). MDPI and/or the editor(s) disclaim responsibility for any injury to people or property resulting from any ideas, methods, instructions or products referred to in the content. |
© 2024 by the authors. Licensee MDPI, Basel, Switzerland. This article is an open access article distributed under the terms and conditions of the Creative Commons Attribution (CC BY) license (https://creativecommons.org/licenses/by/4.0/).
Share and Cite
Okirya, M.; Du Plessis, J. Trend and Variability Analysis of Annual Maximum Rainfall Using Observed and Remotely Sensed Data in the Tropical Climate Zones of Uganda. Sustainability 2024, 16, 6081. https://doi.org/10.3390/su16146081
Okirya M, Du Plessis J. Trend and Variability Analysis of Annual Maximum Rainfall Using Observed and Remotely Sensed Data in the Tropical Climate Zones of Uganda. Sustainability. 2024; 16(14):6081. https://doi.org/10.3390/su16146081
Chicago/Turabian StyleOkirya, Martin, and JA Du Plessis. 2024. "Trend and Variability Analysis of Annual Maximum Rainfall Using Observed and Remotely Sensed Data in the Tropical Climate Zones of Uganda" Sustainability 16, no. 14: 6081. https://doi.org/10.3390/su16146081
APA StyleOkirya, M., & Du Plessis, J. (2024). Trend and Variability Analysis of Annual Maximum Rainfall Using Observed and Remotely Sensed Data in the Tropical Climate Zones of Uganda. Sustainability, 16(14), 6081. https://doi.org/10.3390/su16146081