Article

Analyzing Alternatives for Managing Nitrogen in Puddled Transplanted Rice in a Semi-Arid Area of India

1
Banda University of Agriculture and Technology, Banda 210001, Uttar Pradesh, India
2
College of Post Graduate Studies in Agricultural Science, Central Agricultural University-Imphal, Umiam 793103, Meghalaya, India
*
Author to whom correspondence should be addressed.
Sustainability 2024, 16(14), 6096; https://doi.org/10.3390/su16146096
Submission received: 9 May 2024 / Revised: 20 June 2024 / Accepted: 9 July 2024 / Published: 17 July 2024
(This article belongs to the Section Sustainable Agriculture)

Abstract

:
The Bundelkhand region of India falls under a semi-arid climate and is not typical for rice cultivation. Rice cultivation has been expanding in heavy-textured soils with limited water irrigation. The experiment was carried out with a split-plot design with main factor transplanting methods (line and random transplanting) and subfactor six nitrogenmanagement options (omissionN (ON), farmers’fertilizer practice (FFP), state fertilizer recommendation (SFR), IRRI Leaf Color Chart (LCC), Panjab Agriculture University (PAU-LCC) and Rice Crop Manager (RCM) replicated thrice on heavy-textured soil at the student’s research farm, Banda University of Agriculture & Technology, Banda during the wet season of 2020 and 2021. IRRI LCC and PAU LCC also had significantly higher growth parameters and yield attributes for augmenting better farm livelihoods. The two-year average significant increases in grain yield of puddled transplanted rice by IRRI LLC (24.8% and 9.1%), PAU LCC (26.8% and 10.8%) and RCM (20.0% and 4.9%) over FFP and SFR, respectively. The two-year mean agronomic efficiency was found to be significantly better with IRRI LCC (57.5% and 39.6%), PAU LCC (52.1% and 34.8%) and RCM (57.6% and 39.7%) compared to FFP and SFR, respectively. Similarly, Kg N uptake Kg N applied−1 was significantly better with both the LCC and RCM-guided nitrogen application than FFP and SFR. Moreover, it was discovered that N management using SSNM choices reduced total GHG generation. According to our research, the farmers were applying nearly identical amounts of nitrogen, and SSNM tools allow for the efficient management of nitrogen in semi-arid regions by adjusting the timing of application and splitting.

1. Introduction

Nitrogen is regarded as an essential plant nutrient for cereal productivity. The immediate and evident reaction of nitrogenous fertilizer on cereal crops is one of the main factors behind the growth in nitrogenous fertilizer usage in India from 3.42 million tons in 1979–1980 to 19.43 million tons in 2021–2022 [1,2]. Rice is farmed on 43.79 million hectares in India, and the usage of nitrogenous fertilizer in rice crops is approximately 111.5 Kg N ha−1 [1]. Nitrogen use is growing; about half of the world’s population relies on nitrogen-containing fertilizers for food production [3].
Several studies have been conducted worldwide to create efficient nitrogen management methods in rice crops. Site-specific nutrient management (SSNM) is a nutrient management method based on plant nutrient requirements. SSNM tools such as the IRRI Leaf Color Chart (LCC), PAU LCC, and Rice Crop Manager (RCM) were created to optimize nutrient availability in soil solutions during important crop stages. SSNM tools offer the potential to improve nitrogen use efficiency, crop yield, and profitability for improved farm livelihoods as well as reduced fertilizer losses. LCC is used to calculate the N fertilizer requirements of rice crops. It features green stripes ranging in color from yellow-green to dark green, which affects the greenness of the rice leaf. The N content is determined by this. The LCC can aid in effective N management in circumstances involving variety in the field. Several studies found that LCC-guided nitrogen fertilizer application yielded similar or higher grain production than blanket N recommendations, with average nitrogen savings ranging from 25 to 50 kg ha−1 [4,5,6].
SSNM ensures the efficient use of nitrogen fertilizers, and thereby a reduction in greenhouse gases; studies reported that SSNM reduces CO2 emission and total GHG emission from the paddy field [7,8,9].
Indian soils are often low in organic carbon content, and farmers rely heavily on fertilizers to meet nitrogen demands. A major problem is the regulation of nitrogen for enhanced crop yield while maintaining soil productivity and environmental sustainability.
Rice Crop Manager (RCM) is a web-based program developed by the International Rice Research Institute (IRRI) that also recommends fertilizer application. The RCM has the potential to assure optimal fertilizer application with no yield penalty or gain in yield [10].
The semi-arid region of India has high temperatures and evaporation and is unsuitable for rice growing. The Bundelkhand region of India has a semi-arid climate condition. During the wet season, the region has a 0.5 mha uncultivated and fallow land area [11] (Shah et al., 2021). The region has black and red soils, both of which are weak in organic carbon and accessible phosphorus, resulting in low field crop productivity. Overall, the soils in the research area were found to have poor fertility for N and P, as well as low to medium soil organic carbon (SOC) and medium to high potassium [12]. Because black soils have higher clay content and retain moisture longer, farmers with inadequate irrigation facilities prefer to plant rice crops in this location. Rice is generally established by growing seedlings in a limited space under controlled conditions, then transferring 20–30-day-old seedlings into the main field. Transplanting is a traditional approach that is widely used in rainfed areas to control weeds and ensure water stagnation. Rice is transplanted in two ways: randomly or in line. According to recent research, line transplanting leads to the best rice population, whereas random transplanting leads to a slightly lower population of rice. Furthermore, cultural activities like insect pest control, weed management, and fertilizing can easily be carried out in line transplanting [13]. Despite the fact that random transplanting requires less labor and time during the transplanting process, farmers continue to employ it in general, notably in the Bundelkhand region.
Improved nitrogen management can lead to an increase in rice productivity in this region. In view of the aforementioned considerations, we designed our study to examine the efficacy of proven and easily accessible nitrogen management techniques in random and line transplanting to improve the nitrogen usage efficiency and production of rice.

2. Materials and Methods

2.1. Experimental Site
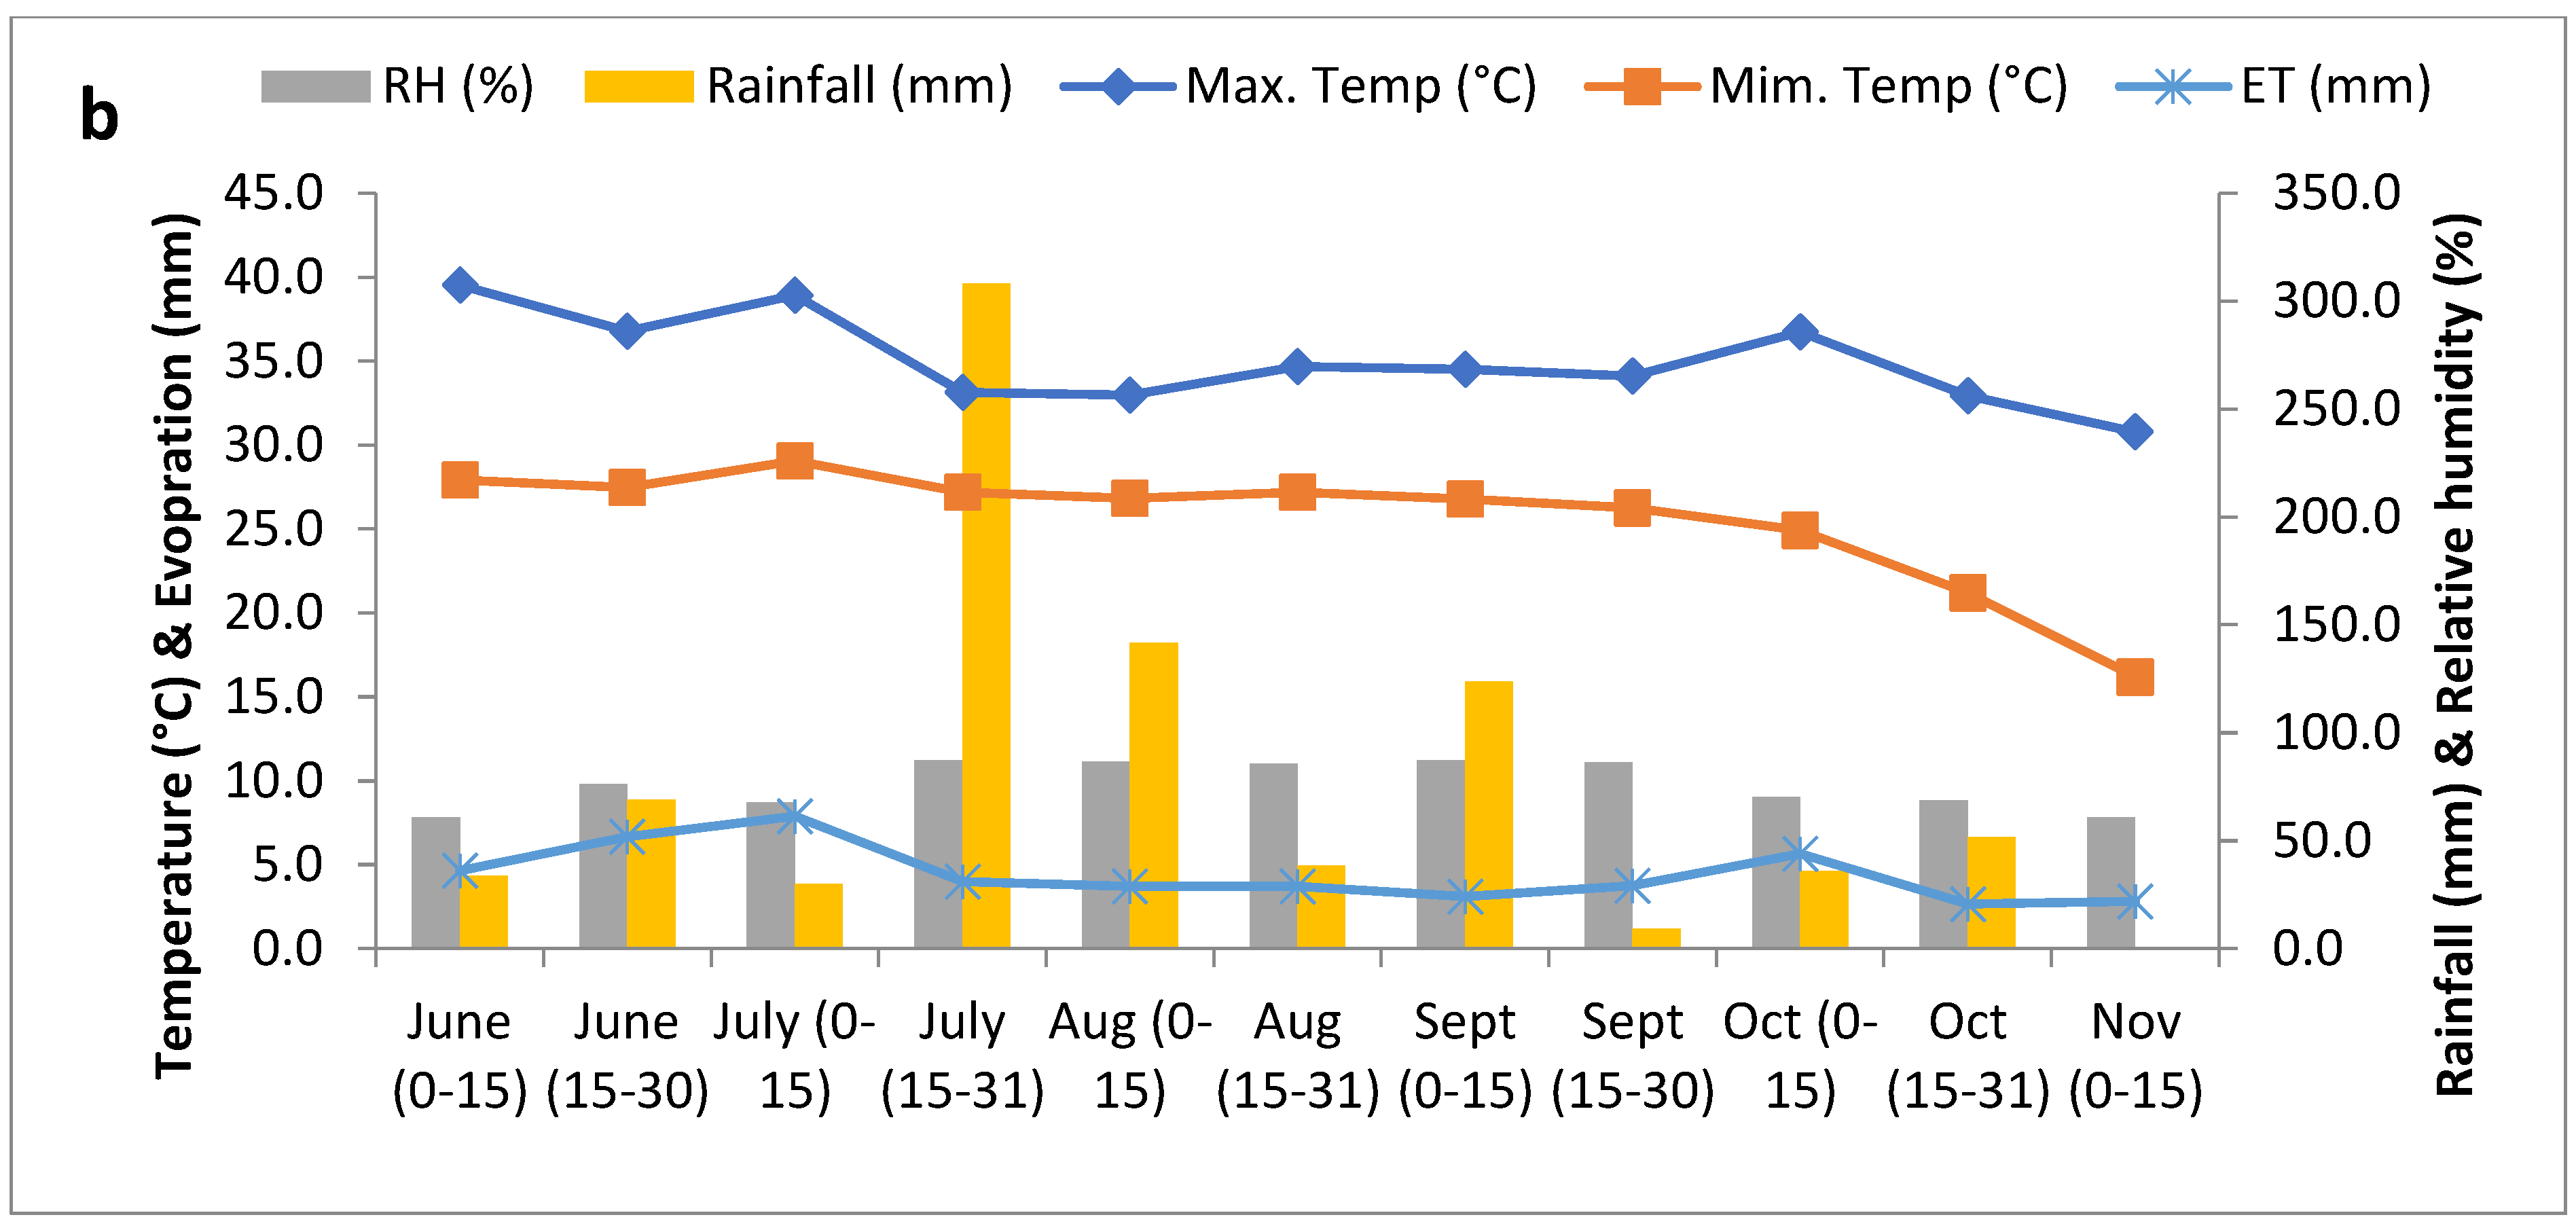
A field trial was conducted on the research farm of Banda University of Agriculture and Technology, Banda (U.P), during the wet season of 2020 and 2021. The experimental site has a latitude of 25.530922°, a longitude of 80.336732°, and an altitude of 168 m above sea level. The soil at the experimental site was clay loam with a thick texture. The soil samples were collected from adepth of 0–15 cm. The soil was somewhat saline [14], low in organic carbon [15], medium in accessible phosphorus [16] and high in available potassium [14]. The details of soil properties are given in Table 1. The soil had a water retention capacity of 51.5%. The soil was classified as part of the Inceptisols order.

2.2. Climate

The Bundelkhand region has semi-arid climatic conditions and is one of the hottest placesin thecountry during summers, where temperatures reach extremes of upto 48 °C while winters are often mild. The weather data wererecorded by the weather station situated attheexperimental station of the university. The mean maximum temperature and minimum temperature during the crop growing period was 33.0 °C and 21.4 mm °C in the year 2020 and 35.0 °C and 28.1 °C during 2021. The potential evaporation was 5.11 mm and 4.42 mm measured by an open pan evaporimeter, respectively, during 2020 and 2021. The average rainfall during crop growing season was 844.8 mm and 842.8 mm during 2020 and 2021, respectively, which was close to the average annual rainfall of the region, i.e., 850 mm (Figure 1). The high rainfall in the months of July and August was suitable for the rice crops in heavy-textured soils; therefore, less irrigation is required in this region forfarmers to grow rice.

2.3. Experimental Design and Nutrient Management

The experiment was laid out in a split-plot design with three replications; the main plots usedrandom transplanting and line transplanting, while the subplot had six nitrogen management treatments, i.e., omission nitrogen (ON), farmers’ fertilizer practice(FFP), state fertilizer recommendation (SFR), PAU LCC (Punjab Agriculture University Leaf Color Chart) (T4), IRRI LCC (International Rice Research Institute Leaf Color Chart) and RCM (Fertilizer Recommendation generated by Rice Crop Manager). ON treatments wereconsidered for the determination of soil capacity to supply the nitrogen and the calculation of the secondary parameters. FFP and SFR were taken as checks for the experiment. The rice variety used in this experiment was Pusa 1718 (130–140 days duration). The fertilizer dosesin the field were applied as per the treatment requirements. Urea (46% N), Di ammonium phosphate (DAP) (18% N and 46% P2O5) and muriate of potash (MoP) (60% K2O) were used as inorganic sources of fertilizer. The omission of anitrogen plotwas received phosphorus from single super phosphate (SSP) and potassium by muriate of potash (MoP) (60% K2O). The omission N plot received P2O5 and K2O as suggested by the state fertilizer recommendation. The FFP was decided by a short survey of paddy growers. The FFP plot received half the amount of nitrogen and a full amount of P2O5 at the time of sowing;therest of the nitrogen was applied at 30 DAT, whereas SFR ¼ amount of urea and the full amount of P2O5 and K2O were applied as a basal at time of transplanting while the remaining amount of nitrogen was supplied in two equal parts. RCM plots received nutrients as per the recommendation generated on the website (plate). The LCC plots received ¼ of nitrogen andthefull amount of P2O5 and K2O at the time of transplanting, while the remaining amount of nitrogen was provided as guided by the LCC reading (Table 2).

2.4. Crop Management

The medium duration (130–135 days) rice variety Pusa 1718 was taken for the experiment. The nursery was established on 25 June in both study years. The healthy uniform 25-day-old seedlings were usedfor the transplanting. The field was puddled one day before the transplanting. The transplanting was conductedmanually. Weeds were managed by the application of Pretillachore (500 g a.i.ha−1) after 3 DAT and manual weeding wasperformed as and when as per the requirement during both years.
Insecticide (Chlorophyrifos1 mLper litre) and fungicide (Propiconazole 25% w/w 1 g per litre) were sprayed to prevent the insect pest attack. The flood irrigation was applied to crop’s, nine irrigation (550 mm) in 2020 and eight irrigation (480 mm) in 2021. The harvesting was conducted manually.

2.5. Crop Performance

Periodic tiller density (the number of tillers m−2) was determined at 30, 60 and 90 DAT. It was estimated by counting the number of tillers from a 0.24 m2 area [0.4 m (two rows 20 cm apart) × 60 cm length] from two fixed locations of the plot. Effective tillers were determined at physiological maturity stages from the fixed spot of the tiller density. Randomly, 20 panicles were selected to determine the number of grains per panicle and filled and unfilled grains per panicle. The dry weight of the filled grain was determined by putting it in an oven at 60 °C for 72 h, and the average grain weight was calculated. Floret fertility was calculated as the percentage of filled grain to the total number of florets per panicle. Biomass yield was determined by harvesting the plant sample manually from the center of the plot from an area of 4 m2 (2 m× 2 m). The harvested bundle was manually threshed and grain yield was determined.Grain moisture content was measured for each plot using a moisture meter. The straw yield was determined by subtracting the grain yield from the total biomass. The yield is expressed as t ha−1. The harvest index was calculated by the economic yield divided by the biomass yield.

2.6. Nitrogen Analysis and Use Efficiencies

The grain and straw samples were washed through diluted hydrochloric acid followed by the deionized water to remove the residue and dust from the surface. Thereafter, samples were dried in a hot air oven at 70 °C and finelyground with the help of a Wiley mill. The total nitrogen content in the plant and straw samples was directly determined by the CHNS analyzer.
The uptake of nutrients was determined by the following formula:
N   u p t a k e   b y   g r a i n   ( kg / ha ) = N   c o n c e n t r a t i o n   i n   g r a i n   % × G r a i n   y i e l d   ( q / ha )
N   u p t a k e   b y   s t r a w n   ( kg / ha ) = N   c o n c e n t r a t i o n   i n   s t r a w   % × G r a i n   y i e l d   ( q / ha )
T o t a l   u p r a k e   ( kg / ha ) = N   u p t a k e   b y   g r a i n   ( kg / ha ) + N   u p t a k e   b y   s t r a w   ( kg / ha )
The efficiency indices of nitrogen were calculated from the primary data by adopting the following formula as given by [3].
A g r o n o m i c     e f f i c i e n c y     ( A E ) = G r a i n   y i e l d   i n   f e r t i l i z e d   p l o t G r a i n   y i e l d   i n   o m m i s i o n   p l o t ( F e r t i l i z e r   N   a p p l i e d ) × 100
R e c o v e r y   e f f i c i e n c y   ( R E ) = ( N   u p t a k e   i n   f e r t l i z e d   p l o t N   u p t a k e   i n   o m m i s i o n   p l o t ) f e r t i l i z e r   N   a p p l i e d
P a r t i a l   F a c t o r   P r o d u c t i v i t y   ( P F P ) = G r a i n   y i e l d   i n   f e r t i l i z e r   p l o t F e r t i l i z e r   N   a p p l i e d

2.7. Soil Chemical Properties

After the harvest of the second-year rice crop, soil samples (0–15 cm) were taken from each plot for the determination of pH, electrical conductivity (EC), organic carbon, available nitrogen, and potassium. The samples were dried under shade, grounded and passed through a 2 mm sieve and were analyzed for the fertility status of the soil. The pH and electrical conductivity of the experimental soil were determined in 1:2 soil/water ratios [14] after two years of experimentation. The percent of organic carbon content of the soil samples was estimated by the wet digestion method [15]. Available K was extracted with a neutral normal ammonium acetate solution and a flame photo meter [14].

2.8. Green House Gas (GHG) Emission Potential Analysis

GHG emission was calculated by considering the soil status, tillage management practices, water, herbicide, pesticide management C sequestration and soil flux of GHG. The GHG emissionwas calculated from the open source of CCAFS mitigation options. The Cool Farm Tool (CFT v2.11.0) was utilized to calculate the greenhouse gas emissions. This program calculates greenhouse gas emissions in any manufacturing system by combining numerous empirical models at the regional level. The tool takes into account a number of variables, including crop production inputs, soil properties, climate, and other management practices that affect emissions. The multivariate empirical model (MEN) is used to estimate emissions from the subfactor treatments irrespective of the years. The FAO (2001) model was used for ammonia, N2O and nitric oxide (NO) emissions (NH3).
The estimated total CO2 emissions from fertilizer urea applied in soil were computed using the IPCC methodology. The GWP of rice–rice systems under various treatments was calculated using a base Global Warming Potential (GWP) (over 100 years) of 298 for N2O and 34 for CH4 (IPCC 2013). The GW was calculated by using the following equations [17].

2.9. Statistical Analysis

Two-factor variance (ANOVA) analysis was used to examine the data for various parameters after the SPSS Statistics (version 28) were used. Using the Duncan Multiple Range Tests (DRMT) displayed in the tables, the treatment means for a two-year period of data were compared using the least significant difference (LSD) at a 0.05 level of probability. Origin Pro software (version 9.4) was utilized in the preparation of the figure.

3. Results

3.1. Tillers Density (Tillers m−2)

The interaction between transplanting methods and nitrogen management options was found to be non-significant at 30 DAT during both years. The transplanting did not influence the tiller density at 30 DAT. However, the nitrogen management statistically influenced the tiller density. Nitrogen management through PAU and IRRI LCC had higher tiller density than farmers’ fertilizer practice during both years. The effect of LCC treatments was more pronounced in 2021 than in 2020. At 60 and 90 DAT in 2020, the interaction was significant. The nitrogen management in both the LCC line transplanting methods had a significantly higher tiller density than the remaining treatments. However, the interaction between transplanting methods and nitrogen management was found to be non-significant at 60 and 90 DAT during 2021.However, the transplanting methods and nitrogen management significantly differed at 60 and 90 DAT during 2021. Both the growth stages of line transplanting had the highest tiller density compared to random transplanting. Similarly, nitrogen management through PAU and IRRI LCC had statistically the same density and was significantly higher than the other remaining treatments. The RCM treatment also had a higher tiller density than FFP at both the FFP and SFR stages during 2021 (Table 3).

3.2. Yield Attributes

The productive tillers directly contribute to the grain yield of the crop and are the best indicator of production. The data are related to the effect of transplanting methods and nutrient management on the effective tiller (tillers m−2). Likely omission plots produced the minimum number of effective tillers (180.5 tillers m−2) during both years. The statistically highest effective tillers originate from nitrogen management through IRRI LCC treatment (405.6 and 434.3 tillers m−2), followed by PAU LCC (393.8 and 420.2 tillers m−2) in 2020 and 2021; both treatments produced statistically higher effective tiller density than FFP and SFR. RCM treatment also produced more effective tillers than FFP and SFR inboth years (Table 4).
Filled grain (per panicle):
The interaction between the main, subfactor and individual effects of the main factor was found to be non-significant on the number of filled grains per panicle during 2020. However, in 2021, line transplanting had a higher level of filled grains per panicle compared to random transplanting. The yield increased by 6.03% compared to random transplanting. The highest filled grain per panicle was recorded with IRRI LCC (261.33) followed by PAU LCC with line transplanting. Both treatments had a similar number of filled grains per panicle. IRRI LCC with line transplanting wassignificantly superior over the rest of the treatments irrespective of the transplanting methods in terms of filled grain per panicle (Table 4).
Test weight was almost similar in response to all the treatments irrespective of the years (Table 4).

3.3. Yields

Grain yield (t ha−1): The interaction between the transplanting methods and nitrogen management practices was found to be non-significant in the case of grain yield, biological yield and harvest index. Further, line transplanting hada higher economic yield than random transplant in 2021. It increased yield by 3.24% over random transplanting.
The subfactors statistically influenced the grain yield of rice. As expected, the omission plots recorded minimum grain yield (2.60 and 2.55 t ha−1) during both years. A similar trend was observed during both years. Nitrogen management with the IRRI Leaf Color Chart (4.83 and 5.14 t ha−1) and PAU Leaf Color Chart (5.02 and 5.11 t ha−1) had statistically similar and the significantly highest grain yields compared to FFP and SFR, respectively, inboth years. RCM also producedastatistically higher yield than FFP.
In the case of biological yields, line transplanting recorded numerically higher grain yields than random transplanting. It increased biological yield by 2.89% over random transplanting in 2021. The data revealed that the subfactors statistically affected the biological yield during both years.Nitrogen management with the SSNM tools viz. PAU LCC (11.98 and 12.70 t ha−1) had significantly higher biological yields than FFP and SFR and statistically the same as IRRI LCC in both years of experiments. The IRRI LCC (12.27 t ha−1) recorded the statistically maximum biological yield compared to the rest of the treatments. However, the IRRI LCC produced the highest biological yield compared to FFP in 2020 and FFP and SFR in 2020 and 2021, respectively. The RCM treatments also recorded higher biological yields than FFP during both years. The trend of grain and biological yields was observed with the harvest index during both years (Table 5).

3.4. Uptake of the Nutrients

The interaction between main factors and subfactors on nitrogen uptake by rice grain was found to be significant only for 2020 on straw and total nitrogen uptake. Line transplanting along with nitrogen management through PAU and IRRI LCC had a higher uptake of N in straw as well as total N uptake by the crop as compared to FFP and SFR, respectively, in 2021. The transplanting methods did not influence the uptake of nitrogen by the crop.
In the case of subfactors in 2021, the nitrogen application, as guided by IRRI LCC, significantly influenced the nitrogen uptake of rice grains. Nitrogen management with IRRI LCC (72.37 kg ha−1) treatment hadahigher nitrogen uptake followed by PAU LCC (70.81 kg ha−1). Both treatments had a statistically similar uptake of nitrogen as FFP and SFR, respectively. IRRI LCC was 33.5%, 18.6% and 8.1% statistically greater than FFP, SFR and RCM, respectively. PAU LCC had 29.6%, 16.0% and 5.7% higher N uptake than FFP, SFR and RCM, respectively; further, RCM had 22.6% and 9.7% statistically higher nitrogen uptake and better than FFP and SFR, respectively. SFR was also better than FFP in terms of grain N uptake.Nitrogen management via treatment with PAU LCC (37.38 kg ha−1) had a higher straw nitrogen uptake than rest of the treatments, and was statistically on par with IRRI LCC (37.03 kg ha−1). PAU LCC was 60.6%, 39.5%, and 30.8%statistically higher than FFP, SFR, and RCM, respectively. Further, RCM was produced statistically onpar with SFR, and nitrogen uptake of straw was statistically on par with FFP. SFR also had higher nitrogen uptake than FFP. A similar trend was observed with total N uptake in response to nitrogenmanagement; nitrogen management with IRRI LCC (109.41 kg ha−1) treatment had the highest total nitrogen uptake followed by PAU LCC (108.19 kg ha−1). IRRI LCC was 40.5%, 24.6%, and 14.5% statistically greater than FFP, SFR, and RCM, respectively. Further, RCM produced 22.6% and 8.79% statistically higher total nitrogen uptake than FFP and SFR, respectively. SFR produced 12.7% statistically greater total nitrogen uptake than FFP (Table 6).

3.5. Efficiency Factors

3.5.1. Agronomic Efficiency (Kg Grain Kg N Applied−1)

Agronomic efficiency indicates the improvement in the economic yield of rice without a fertilized plot in response to fertilizer application. The perusal data show that line transplanting recorded superior agronomic efficiency than random transplanting. It increased agronomic efficiency by 6.57% over random transplanting. Further, the data reveal that the different SSNM tools statistically increased the agronomic efficiency of nitrogen. Nitrogen management with SSNMtreatment, tools either by IRRI LCC, PAU LCC or RCM, had a better response of grain production per kg nitrogen than the FFP and SFR in both the experimental years.

3.5.2. Recovery Efficiency (Kg N Uptake Kg N Applied−1)

Recovery efficiency exhibits how much fertilizer contributes to the uptake of the applied nitrogen fertilizer. The recovery efficiency data show that the interaction between the main factors and subfactors is non-significant and also that the main factors do not influence the recovery efficiency. However, the subfactor statistically influenced the recovery efficiency in puddled transplanted rice. A similar trend was recorded with recovery efficiency. The IRRI LCC, RCM, and PAU LCC had higher recoveries of nitrogen than the FFP and SFR, respectively. The treatment showed that SSNM tools efficiently managed nitrogen in the semi-arid region.
Partial factor productivity (PFP) showsthat economic yield increases per kg of nitrogen added. The interaction between the main factor and subfactor was found to be non-significant, while the main factor and subfactor both statistically influenced the PFP of puddled transplanted rice.
Line transplanting (45.80 kg grain per Kg N) significantly enhanced the partial factor productivity of transplanted rice in comparison to random transplanting (43.78 kg grain per Kg N). It had a 4.60% better partial factor productivity than random transplanting (Table 7).

3.5.3. Rate of Nitrogen and Grain Yield and Recovery Efficiency

The two-year pool data were used to explain the grain yield and recovery efficiency of nitrogen in response to the application of nitrogen. In our study, better recovery efficiency and yield of rice were found with nitrogen application managed through SSNM tools. Irrespective of the year, N management through plots had a 51% higher recovery efficiency than the blank application of nitrogenous fertilizers. It indicates that SSNM tools ensure the higher absorption of applied nitrogen, thereby improving the recovery of nitrogen.Similarly, it shows a 13.5% improvement in the economic yield of rice in efficient N-managed plots compared to the blanket application through SFR and FFP, respectively (Figure 2).

3.6. Soil Properties

The interaction between main factors and subfactors, as well as individual effects of treatments, was found to have a non-significant effect on soil properties. However, achange in soil properties from the initial status was observed in the properties. In the case of subfactors, the pH value varied from 8.13 to 8.21 in RCM and omission/FFP plots. The pH was almost unchanged in comparison to the initial value.
The electrical conductivity ranged from 0.825 to 0.900 dSm−1 in the state fertilizer recommendation and omission plots, respectively. Although the treatments did not alter the electrical conductivity, a −13.12 to 20.36% reduction was observed in soluble salt concentrations in comparison to the initial value (1.036 dSm−1).
The interaction between the main factor and subfactors was found to be non-significant; furthermore, both the main factor and subfactors did not influence the organic carbon and available potassium status of the soil. In the case of subfactors, the percent organic carbon value varied from 0.38 to 0.41 in omission plots and IRRI LCC, PAU LCC and RCM, whereas the available potassium ranged from 238.9 to 281.9 kg ha−1 in omission and state fertilizer recommendation treatments.
Interestingly, the percent organic carbon and available potassium status were improved from the initial status of the soil. Overall, organic carbon (%) increased the initial value by 17.6% and available potassium was 15.5% higher than the initial potassium status of soil (Table 8).

3.7. GHG Emission under Different Nitrogen Management Options

CO2 is the main contributor to GHGs. The mitigation of GHG production from rice fields can be achieved through the efficient management of fertilizer, tillage and water. The total GHG emission with respect to total CO2 was low in the omission plot—about 12.4% in comparison with the blanket application of fertilizer in FFP and SFR and 11.3% in comparison with N management through the SSNM tools. Among the N management practices, the RCM had the lowest GHG emission. However, the kg CO2 emission per kg production of grain was found to be highest inomission plots and lowest in N management through the LCC (PAU and IRRI). Both had 86.0% and 17% lower CO2 production than the omission N and blanket application of fertilizer through FFP and SFR (Figure 3).

4. Discussion

4.1. Growth Attributes and Yields Trend

As the main factor influencing the tiller density at 60 DAT and 90 DAT, line transplanting had significantly better tillering than random transplanting. This might be due to the greater space between plants and becausethe ease of cultural operation in line transplanting enhanced the production of secondary and tertiary tillers [13,18,19].
Nitrogen management with SSNM tools had significantly superior tiller density throughout the growth period compared to farmers’fertilizer practices and state fertilizer recommendations. Further, both PAU LCC and IRRI LCC produced similar values of tiller densities and were statistically superior to the remaining treatments, whereas omission treatment had the minimum value of tiller density. It could be ascribed that nitrogen is the main limiting factor, and the optimum application of nitrogen promotes tillering. Further, staggered application of nitrogen through LCC (PAU and IRRI) and RCM matched the critical growth stages of the crop, which might be influenced by the production of more secondary and tertiary tillers and thereby by better tiller density (m2) in SSNM treatments. The results were in agreement with the findings [10,20,21].
The interaction effect of transplanting methods and nitrogen management through SSNM tools did not affect the productive tillers (m2). The main factors were also not influenced by the productive tillers. The effective tillers were statistically influenced by the subfactor. The SSNM treatments had an increasing trend of effective tiller density. As expected, omission plots produced the minimum number of effective tillers (180.5 sqm). The statistically highest effective tillers originated from the nitrogen management through IRRI LCC treatment (434.3 sqm), followed by PAU LCC (420.2 sqm); both treatments produced a statistically maximum effective tiller density than the rest of the treatments. Further, PAU LCC and RCM produced a similar number of effective tillers and significantly better tillers than FFP and SFR. As noticed from the beginning of the growth stages, the tiller density was improved by the SSNM treatments irrespective of the transplanting methods. Furthermore, chlorophyll content was also higher in SSNM treatments, which is perhaps the reason for the higher number of tillers in nitrogen application guided by SSNM and suggested by RCM. Similar results were reported by [21,22,23].
Line transplanting had a significantly lower number of ineffective tillers than random transplanting. It could be ascribed that less space for tiller development in random transplanting led to a higher number of ineffective tillers [19]. As expected, the reverse trend was observed with ineffective tillers, andreal-time nitrogen management with PAU and IRRI LCC followed by RCM had fewer ineffective tillers, whereas the fixed-time application of nitrogen in farmers’ fertilizer practices and state fertilizer recommendations had a higher number of ineffective tillers.
The different nutrient management treatments did not influence test weight. The filled and unfilled grain was influenced by the treatments. The real-time nitrogen management either with IRRI or PAU LCC with line transplanting had a similar amount of filled grain and was statistically superior to the other treatments irrespective of transplanting methods. The RCM was observed as the second-best treatment with line transplanting and performed better than FFP and SFR. It might be due to the fact that the translocation of photosynthates from source to sink was better. Similarly, ref. [21] also found significant improvement in filled grain per panicle with the nitrogen application through LCC.
The trends of growth parameters and yield attributes were reflected in the yields of rice. Line transplanting had a significantly higher grain yield than random transplanting. The performance of rice was enhanced with line transplanting due to proper space and less competition for nutrients and light than in random transplanting [13,24,25]. The straw, biological and harvest index were not influenced by the transplanting methods. While subfactors influenced the grain, straw, biological and harvest index, a similar trend of growth and yield attributes was found with yields. Real-time nitrogen management through PAU and IRRI LCC had a higher grain yield than the remaining treatments. The better performance of LCC can be ascribed to the fact thatthe PAU and LCC plots received more nitrogen than FFP and RCM at the peak demand stage, leading to a higher chlorophyll content and yield attributes [4,23,26,27,28,29,30]. The RCM also performed better than the blanket application of fertilizer in treatments with FFP and SFR. It could be due to the nitrogen dose adjustment in consideration of the duration of the cultivar, peak stage of nitrogen, target yield and inclusion of zinc fertilizer in the basal dose [10,31,32].
The PAU LCC had significantly higher straw and biological yield than the other treatments. The harvest index was statistically similar in all the treatments, and all treatments were significantly higher than the omission N plot. The higher straw and biological yield in PAU LCC might be due to the slightly higher amount of nitrogen received in PAU LCC than in other SSNM treatments at peak growth demand, which sustained the higher straw and biological yield.

4.2. Nutrient Uptake and Efficiency Indices

The nitrogen application, as guided and suggested by LCC or RCM, had a greaternitrogen concentration in grain and straw and it was reflected in grain, straw and total uptake of the nitrogen. However, the RCM was comparable to both the LCC treatments, and it was also similar to SFR and FFP with respect to grain and straw concentrations. It could be ascribed to the higher chlorophyll content in LCC treatments during growth stages due to real-time nitrogen management eventually reflected in grain and straw after the harvest [33]. Similarly, the LCC treatments had a higher nitrogen uptake than the RCM treatment. In our study, the higher yields obtained under LCC (PAU and IRRI) than the RCM were reflected in the grain, straw and total uptake of nitrogen by the crop [10].
The SSNM treatments (IRRI LCC, PAU LCC and RCM) were found to be superior with respect to the agronomic efficiency of transplanted rice in comparison to FFP and SFR. The better agronomic efficiency (kg grain per kg N applied) of SSNM was probably because of real-time nitrogen management improving growth parameters such as the number of tillers, yield attributes and yield of crop, irrespective of the transplanting methods [34]. The fertilizer dose suggested by the RCM contained both macro and micro nutrients, which improved agronomic efficiency [18]. Similar results were reported by [3], indicating that the agronomic efficiency of rice varied from 18 to 25 kg grain per kg N applied depending on the management practices [35].
Similarly, the recovery efficiency of transplanted rice was better with IRRI LCC and RCM in comparison to blanket fertilizer application through FFP and SFR. The PAU LCC also performed better in terms of uptake of nitrogen per kg nitrogen application than FFP and SFR. It could improve the timing and splitting of the nitrogen, leading to higher chlorophyll content and thereby better yield. The better performance of RCM can be ascribed to macro and micro nutrients augmenting the uptake of nitrogen [10]. Similarly, ref. [35] reported that poor fertilizer use efficiency of nitrogen in blanket recommendation is dueto thehigher amount of nitrogen application at the early vegetative stage.
The physiological efficiency was found to be better with FFP and SFR than with SSNM treatments; this is likely due to the lower amount of nitrogen application in FFP and, in the case of SFR, higher straw yield reflected in physiological efficiency.
The partial factor productivity was higher with line transplanting than random transplanting. It might be due to the fact that more space and light available for line transplanting helped with the utilization of nitrogen. The SSNM treatments also had better partial factor productivity than the blanket recommendation [36].

4.3. Soil Properties

The pH, EC, organic carbon and available potassium were not influenced by the application of the different treatments. However, the initial samples were collected two years before the experiment; the improvement in all the above properties except pH was observed from the initial values irrespective of the treatments. It might be due to the submerged condition of rice, better biomass of rice in SSNM treatments, and thereby better root biomass, and success of chickpea crops supported by improvements in soil properties [26].

4.4. Effect of Nitrogen Management Option on GHG Production

The GHG production from the rice field depends on fertilizer management, tillage, and water management. The lower production of GHG from the omission plots could be because the agronomic management practices were the same in all the plots, and there was no application of nitrogen fertilizers [17]. The highest was in SFR due to the higher application of nitrogen not matching the improvement in production. However, kg CO2 production the per grain yield was lower in the LCC management field, which might be because the splitting of nitrogen improved the agronomic and recovery efficiency, resulting in a higher grain yield than other treatments;moreover, agronomic practices such as irrigation and tillage operation were similar in all the treatments.

5. Conclusions

Our study revealed that line transplanting of rice outperformed random transplanting in terms of growth and yield. Further, our research shows that farmers were applying an approximately optimum amount of nitrogen as the recommended N by SSNM tools, while IRRI and PAU LLC recommend a slightly higher amount of nitrogen viz. 3 kg ha−1 and 10 kg ha−1, respectively, than FFP.In comparison to SFR, IRRI LCC applied 17 kg ha−1 less N and PAU LCC applied 10 kg N ha−1. The SSNM treatments had a positive effect on the growth, yield attributes, and yields of rice irrespective of the transplanting methods over blanket application of fertilizer through SFR and FFP. Further, the agronomic efficiency and recovery efficiency of nitrogen werehigher with SSNM treatments, revealing judicious use of nitrogen fertilizer results in a less loss of fertilizer than the blanket recommendation. Therefore, it can be inferred from the study that the timing and splitting of nitrogen through LCC (IRRI and PAU) and RCM had an impact on soil characteristics, greenhouse gas emissions, and yield maximization. Furthermore, SSNM treatments demonstrated a greater agronomic efficiency and nitrogen recovery efficiency, indicating that prudent application of nitrogen fertilizer minimizes the loss of nitrogen compared to blanket application of N through FFP and SFR.
Overall, this study recommends nitrogen application according tothe Leaf Color Chart and RCM to farmers of the regionfor better utilization of nitrogen fertilizer in heavy-textured soils with proper irrigation facilities. Further, evaluation can be carried out with different types of soils and rice varieties of the region.

Author Contributions

Conceptualization, A.M.; methodology, A.S.S., A.M. and D.S.; validation, J.P.; A.K.C., B.P.M. and G.P.; formal analysis, G.S. and U.C.; investigation, A.M., A.S.S., A.K.C., and D.S., data curation, A.M., B.P.M. and G.S.; writing—original draft preparation, A.M. and A.S.S.; writing—review and editing, J.P., D.S., and G.P.; visualization, A.M.; supervision, G.P. and J.P. All authors have read and agreed to the published version of the manuscript.

Funding

The research was Funded by the Banda University of Agriculture & Technology, Banda, as a part of student research.

Institutional Review Board Statement

Not applicable.

Informed Consent Statement

Not applicable.

Data Availability Statement

The data presented in this study are available in the article and raw data and supplementary data will be provided as and when as per the demand.

Conflicts of Interest

The authors declare no conflicts of interest.

References

  1. Fertilizer Statistics, Fertilizer Association of India, 69th ed.; FAI House 10: New Delhi, India, 2022.
  2. Moring, A.; Hooda, S.; Raghuram, N.; Adhya, T.K.; Ahmad, A.; Bandyopadhyay, S.K.; Barsby, T.; Beig, G.; Bentley, A.R.; Bhatia, A.; et al. Nitrogen Challenges and Opportunities for Agricultural and Environmental Science in India. Front. Sustain. Food Ecosyst. 2021, 5, 505347. [Google Scholar] [CrossRef]
  3. Ladha, J.K.; Pathak, H.; Krupnik, T.J.; Kessel, C.V. Efficiency of fertilizer nitrogen in cereal production: Retrospects and Prospects. Adv. Agron. 2005, 87, 85–156. [Google Scholar] [CrossRef]
  4. Shukla, A.K.; Ladha, J.K.; Singh, V.K.; Dwivedi, B.S.; Gupta, R.K.; Sharma, S.K.; Balasubramanian, V.; Singh, Y.; Padre, A.T.; Yadav, R.L. Calibrating the leaf color chart for N management in different genotypes of rice and wheat in a system perspective. Agron. J. 2004, 96, 1606–1621. [Google Scholar] [CrossRef]
  5. Singh, V.; Singh, B.; Thind, H.S.; Singh, Y.; Gupta, R.K.; Singh, S.; Singh, M.; Kaur, S.; Singh, M.; Brar, J.S.; et al. Evaluation of Leaf Colour Chart for Need-Based Nitrogen Management in Rice, Maize and Wheat in North-Western India. J. Res. Punjab Agric. Univ. 2014, 51, 239–245. [Google Scholar]
  6. Singh, V.; Singh, B.; Singh, Y.; Thind, H.S.; Gupta, R.K. Need based nitrogen management using the chlorophyll meter and leaf colour chart in rice and wheat in South Asia: A Review. Nutr. Cycl. Agroecosyst. 2010, 88, 361–380. [Google Scholar] [CrossRef]
  7. Shcherbak, I.; Millar, N.; Robertson, G.P. Global metaanalysis of the nonlinear response of soil nitrous oxide (N2O) emissions to fertilizer nitrogen. Proc. Natl. Acad. Sci. USA 2014, 111, 9199–9204. [Google Scholar] [CrossRef] [PubMed]
  8. Bellarby, J.; Stirling, C.; Vetter, S.H.; Kassie, M.; Kanampiu, F.; Sonder, K.; Smith, P.; Hillier, J. Identifying secure and low carbon food production practices: A case study in Kenya and Ethiopia. Agric. Ecosyst. Environ. 2014, 197, 137–146. [Google Scholar] [CrossRef]
  9. Richards, M.B.; Butterbach-Bahl, K.; Jat, M.L.; Ortiz Monasterio, I.; Sapkota, T.B.; Lipinski, B. Site-Specific Nutrient Management: Implementation guidance for policymakers and investors. Pract. Brief CSA 2016, 1–10. [Google Scholar] [CrossRef]
  10. Sharma, S.; Rout, R.K.; Khanda, C.M.; Tripathi, R.; Shahid, M.; Nayak, A.; Sathpathy, S.; Banik, N.C.; Iftikar, W.; Parida, N.; et al. Field-specific nutrient management using Rice Crop Manager. Field Crop Res. 2021, 241, 107578. [Google Scholar] [CrossRef]
  11. Sah, U.; Dixit, G.P.; Kumar, N.; Pal, J.; Singh, N.P. Status and strategies for the development of Pulses in Bundelkhand region of India–A Review. Legume Res. 2021, 47, 335. [Google Scholar] [CrossRef]
  12. Prasad, M.; Mahawer, S.K.; Govindswamy, P.; Kumar, S. Assessment of Soil Fertility Attributes in Selected Districts of Bundelkhand Region of Central India. Curr. J. Appl. Sci. Technol. 2020, 39, 326–334. [Google Scholar] [CrossRef]
  13. Awan, T.H.; Ahmad, M.; Ashraf, M.M.; Ali, I. Effect of different transplanting methods on paddy yield and its components at farmer’s field in rice zone Punjab. J. Anim. Plant Sci. 2011, 21, 498–502. [Google Scholar]
  14. Jackson, M.L. Soil Chemical Analysis; Prentice Hall of India, Private Limited: New Delhi, India, 1973; 498p. [Google Scholar]
  15. Walkley, A.; Black, I.A. An examination of the Degtjareff method for determining soil organic matter, and a proposed modification of the chromic acid titration method. Soil Sci. 1934, 37, 29–38. [Google Scholar] [CrossRef]
  16. Olsen, S.R.; Cole, C.V.; Watanabe, F.S.; Dean, L.A. Estimation of Available Phosphorus in Soils by Extraction with Sodium Bicarbonate; Circular No. 939; United States Department of Agriculture: Washington, DC, USA, 1954.
  17. Mohapatra, S.; Rout, K.K.; Khanda, C.; Mishra, A.; Yadav, S.; Padbhushan, R.; Mishra, A.K.; Sharma, S. Evaluation of Different Potassium Management Options under Prevailing Dry and Wet Seasons in Puddled, Transplanted Rice. Sustainability 2023, 15, 5819. [Google Scholar] [CrossRef]
  18. Anbumani, S.; Chandrasekharan, B.; Kuppuswamy, G. Evaluation of establishment methods and NPK levels in rice and their impact on succeeding crops. Agric. Sci. Dig. 2004, 24, 190–193. [Google Scholar]
  19. Ali, Q.M.; Ahmad, A.; Ahmed, M.; Arain, M.A.; Abbas, M. Evaluation of Planting Methods for Growth and Yield of Paddy (Oryza sativa L.) under Agro Ecological Conditions of District Shikarpur. Am.-Eurasian J. Agric. Environ. Sci. 2013, 13, 1503–1508. [Google Scholar]
  20. Sen, A.; Srivastava, V.K.; Singh, M.K.; Singh, R.K.; Kumar, S. Leaf Color Chart vis-à-vis Nitrogen Management in Different Rice Genotypes. Am. J. Plant Sci. 2011, 2, 223–236. [Google Scholar] [CrossRef]
  21. Mohanta, S.; Banerjee, M.; Malik, G.C.; Shankar, T.; Maitra, S.; Ismail, I.A.; Dessoky, E.S.; Attia, O.; Hossain, A. Productivity and Profitability of Kharif Rice are influenced by Crop Establishment Methods and Nitrogen Management in the Lateritic Belt of the Subtropical Region. Agronomy 2021, 11, 1280. [Google Scholar] [CrossRef]
  22. Peng, S.; Garcia, F.V.; Laza, R.C.; Sanico, A.L.; Visperas, R.M.; Cassman, K.G. Increased N-use efficiency using a chlorophyll meter on high-yielding irrigated rice. Field Crops Res. 1996, 47, 243–252. [Google Scholar] [CrossRef]
  23. Marahatta, S. Increasing Productivity of an intensive rice-based system through site specific nutrient management in Western Terai of Nepal. J. Agric. Environ. 2018, 18, 140–150. [Google Scholar] [CrossRef]
  24. Khan, I.M.; Tiwari, K.L. Potential grain index among primary and secondary tillers of short duration rice. JNKVV Res. J. 2000, 28–29, 85–86. [Google Scholar]
  25. Kon, K.; Kaneta, Y.; Sato, A.; Shabita, S.; Sato, K.; Miura, C. Development period, number of tillers and percentage of productive culm within nodal position of tillers in rice cultivar Akitakomachi. Tohoko J. Crop Sci. 2003, 46, 47–49. [Google Scholar]
  26. Singh, V.K.; Shukla, A.K.; Singh, M.P.; Majumdar, K.; Mishra, R.P.; Rani, M.; Singh, S.K. Effect of site-specific nutrient management on yield, profit and apparent nutrient balance under pre-dominant cropping systems of Upper Gangetic Plains. Indian J. Agric. Sci. 2015, 85, 335–343. [Google Scholar] [CrossRef]
  27. Singh, B.; Singh, Y.; Ladha, J.K.; Bronson, K.F.; Balasubramanian, V.; Singh, J.; Khind, C.S. Chlorophyll Meter– and Leaf Color Chart–Based Nitrogen Management for Rice and Wheat in North Western India. Agron. J. 2002, 94, 821–829. [Google Scholar] [CrossRef]
  28. Vethaiya, B.; Ladha, J.K.; Gupta, R.K.; Naresh, R.K.; Mehla, R.S.; Bijay-Singh; Yadvinder-Singh. Technology options for rice in the rice–wheat system in South Asia. In Improving the Productivity and Sustainability of Rice—Wheat Systems: Issues and Impact; Ladha, J.K., Hill, J.E., Duxbury, J.M., Gupta, R.K., Buresh, R.J., Eds.; ASA Spec Publ. 65; ASA, CSSA, and SSSA: Madison, WI, USA, 2003; pp. 115–118. [Google Scholar]
  29. Alam, M.M.; Ladha, J.K.; Foyjunnessa; Rahman, Z.; Khan, S.R.; Rashid, H.; Khan, A.H.; Buresh, R.J. Nutrient management for increased productivity of rice–wheat cropping system in Bangladesh. Field Crops Res. 2006, 96, 374–386. [Google Scholar] [CrossRef]
  30. Singh, Y.; Singh, B.; Ladha, J.K.; Bains, J.S.; Gupta, R.K.; Jagmohan, S.; Balasubramanian, V. On-farm evaluation of leaf color chart for need-based nitrogen management in irrigated transplanted rice in northwestern India. Nutr. Cycl. Agroecosyst. 2007, 78, 167–176. [Google Scholar] [CrossRef]
  31. Neue, H.U.; Quijano, C.; Senadhira, D.; Setter, T. Strategies for dealing with micronutrient disorders and salinity in lowland rice systems. Field Crops Res. 1998, 56, 139–155. [Google Scholar] [CrossRef]
  32. Impa, S.M.; Johnson-Beebout, S.E. Mitigating zinc deficiency and achieving high grain Zn in rice through integration of soil chemistry and plant physiology research. Plant Soil 2012, 361, 3–41. [Google Scholar] [CrossRef]
  33. Parihar, R.K.; Devedee, A.K.; Verma, S. Leaf Colour Chart: A Resource Conservation Technology. Agrobios Newsl. 2018, 17, 28. [Google Scholar]
  34. Khurana, S.H.; Phillips, B.S.; Singh, B.; Dobermann, A.; Sidhu, S.A.; Singh, Y.; Peng, S. Performance of Site-Specific Nutrient Management for Irrigated, Transplanted Rice in Northwest India. Agron. J. 2007, 99, 1436–1447. [Google Scholar] [CrossRef]
  35. Peng, S.; Buresh, J.R.; Huang, J.; Zhong, X.; Zou, Y.; Yang, J.; Wang, G.; Liu, Y.; Hu, R.; Tang, Q.; et al. Improving nitrogen fertilization in rice by site-specific N management. A review. Agron. Sustain. Dev. 2010, 30, 649–656. [Google Scholar] [CrossRef]
  36. Pampolino, M.F.; Manguiat, I.J.; Ramanathan, S.; Gines, H.C.; Tan, P.S.; Chi, T.T.N.; Rajendran, R.; Buresh, R.J. Environmental impact and economic benefits of site-specific nutrient management (SSNM) in irrigated rice systems. Agric. Syst. 2007, 93, 1–24. [Google Scholar] [CrossRef]
Figure 1. Mean maximum and minimum temperature, relative humidity, rainfall and potential evaporation (mm) during crop growth period in 2020 (a) and 2021 (b).
Sustainability 16 06096 g001aSustainability 16 06096 g001b
Figure 2. Rice yield (t ha−1) and recovery efficiency of nitrogen under different amounts of nitrogen application.
Sustainability 16 06096 g002
Figure 3. Effect of N management strategies on total GHG (000′kg CO2 eq ha−1) and kg CO2 emission for per kg rice production across the years.
Sustainability 16 06096 g003
Table 1. Initial soil properties of the experimental site.
S. No.Soil PropertiesValues
1pH8.23
2electrical conductivity (dSm−1)1.036
3Organic carbon (%)0.34%
4Olsen Phosphors (kg ha−1) 20.5
5Available potassium (kg ha−1)244
Table 2. Amount of nutrient (kg ha−1) added and time applied in different N management strategies.
TreatmentAmount of Nutrient (kg ha−1)
NP2O5K2OZn
ON06040
FFP1006060
SFR1206060
PAU LCC1106060
IRRI LCC1036060
RCM94.3606010
Time of fertilizer N Application
ON(DAT −1) *
FFP (2 splits)(DAT −1)(39 DAT)
SFR (3 splits)(DAT −1)(29 DAT)(45 DAT)
PAU LCC (4 splits)(DAT −1)(15 DAT)(29 DAT)(54 DAT)
IRRI LCC (4 splits)(DAT −1)(15 DAT)(31 DAT)(59 DAT)
RCM (3 splits)(DAT −1)(35 DAT)(58 DAT)
(DAT −1) * Basal dose of phosphorus and potassium was applied on the day before transplanting.
Table 3. Effect of transplanting methods and N management strategies on tiller density (m2) at various growth stages of rice.
TreatmentsTiller Density (m2)
30 DAT60 DAT90 DAT
202020212020202120202021
Main Factors
LT210.0 a220.4 a286.1 a298.5 a345.6 a350.7 a
RT196.8 a210.6 a249.2 b271.0 b294.2 b330.5 b
Subfactors
Omission Nitrogen152.1 b142.5 d170.8 d166.5 d188.2 d212.4 e
FFP168.1 b209.0 c229.8 c262.3 c290.3 c309.3 d
SFR215.6219.7 bc279.9 b286.1 bc321.2 bc334.7 c
IRRI LCC229.5 a252.2 a319.8 a349.3 a393.1 a416.8 a
PAU LCC233.5 a246.0 ab325.3 a345.9 a385.8 a406.3 a
Rice Crop Manager221.3 a223.5 abc280.2 b298.6 b341.0 b363.8 b
Values denoted with the same letter are not significantly different at p < 0.05 using Duncan’s Multiple Range Test.
Table 4. Effect of transplanting methods and N management strategies on the yield attributes of the rice crop.
TreatmentsEffective Tillers (m2)Filled Grain per PanicleTest Weight (g)
202020212020202120202021
Main Factors
LT332.2 a357.1 a193.9 a212.06 a24.2 a23.13 a
RT318.3 a346.2 a179.6 a201.11 b24.0 a22.19 a
Subfactors
Omission Nitrogen184.7 c180.5 c133.5 c149.00 d24.48 a24.02 a
FFP289.6 b330.2 b167.6 b171.33 c24.45 a24.13 a
SFR304.9 b347.3 b179.5 b188.83 c23.88 a22.05 a
IRRI LCC405.6 a434.3 a219.0 a257.17 a24.25 a23.30 a
PAU LCC393.8 a420.2 a215.4 a252.83 a24.25 a23.58 a
Rice Crop Manager372.9 a396.0 a205.6 a220.33 b24.80 a21.08 a
Values denoted with the same letter are not significantly different at p < 0.05 using Duncan’s Multiple Range Test.
Table 5. Effect of transplanting methods and N management strategies on yields.
TreatmentsGrain Yield
(t ha−1)
Biological Yield
(t ha−1)
Harvest Index
202020212020202120202021
Main Factors
LT4.26 a4.45 a10.27 a10.86 a0.42 a0.40 a
RT4.24 a4.31 b10.17 a10.55 a0.41 a0.39 a
Subfactors
Omission Nitrogen2.44 e2.55 d7.38 b6.80 e0.33 b0.35 b
FFP3.97 d4.02 c10.09 a9.77 d0.40 ab0.40 a
SFR4.56 c4.58 b10.30 a11.02 c0.44 a0.41 a
IRRI LCC4.83 ab5.14 a11.36 a12.27 ab0.43 a0.41 a
PAU LCC5.02 a5.11 a11.51 a12.70 a0.44 a0.39 a
Rice Crop Manager4.69 bc4.90 ab10.66 a11.66 bc0.44 a0.41 a
Values denoted with the same letter are not significantly different at p < 0.05 using Duncan’s Multiple Range Test.
Table 6. Effect of transplanting methods and N management strategies on the nitrogen uptake (kg ha−1) by plants at harvest.
TreatmentsGrain N Uptake
(kg ha−1)
Straw N Uptake
(kg ha−1)
Total Uptake
(kg ha−1)
202020212020202120202021
Main Factors
LT50.0 a61.75 a29.1 a29.35 a79.05 a91.10 a
RT50.1 a57.53 a28.3 a27.55 a78.34 a85.08 a
Subfactors
Omission Nitrogen27.8 d32.08 e20.0 b17.67 d47.8 d49.75 e
FFP47.2 c54.60 d28.6 a23.26 c75.8 c77.87 d
SFR53.5 b61.01 c28.1 a26.79 bc81.7 bc87.80 c
IRRI LCC56.6 ab72.37 a32.4 a37.03 a89.0 ab109.41 a
PAU LCC59.5 a70.81 ab32.2 a37.38 a91.7 a108.19 a
Rice Crop Manager55.5 ab66.95 b30.7 a28.57 b86.3 ab95.52 b
Values denoted with the same letter are not significantly different at p < 0.05 using Duncan’s Multiple Range Test.
Table 7. Effect of transplanting methods and N management strategies on agronomic efficiency, recovery efficiency and partial factor productivity.
TreatmentsAgronomic Efficiency
(kg Grain kg−1 N) Applied N
Recovery Efficiency (kg N Uptake kg−1 N Applied)Partial Factor Productivity
(kg Grain kg−1 N)
202020212020202120202021
Main Factor
LT20.21 a22.38 a24.97 a32.32 a44.04 a45.80 a
RT21.20 a20.99 b25.92 a30.84 a43.88 a43.78 b
Subfactor
Omission Nitrogen
FFP15.37 c15.80 b19.34 b22.52 b39.73 c40.00 d
SFR17.65 b17.51 b21.44 b24.10 b37.96 d37.38 d
IRRI LCC23.22 a25.87 a27.95 a39.11 a46.88 b49.37 b
PAU LCC23.50 a23.91 a29.16 a35.20 a45.65 b45.91 c
Rice Crop Manager23.79 a25.33 a29.33 a36.97 a49.58 a50.99 a
Values denoted with the same letter are not significantly different at p < 0.05 using Duncan’s Multiple Range Test.
Table 8. Effect of transplanting methods and N management strategies on pH, electrical conductivity (dSm−1), soil organic carbon (SOC) and available potassium of soil after the two years.
TreatmentspH% Change over InitialEC (dSm−1)% Change over InitialSOC (%)% Change over InitialAvailable K
(kg ha−1)
% Change over Initial
Initial8.23 1.036 0.34 244.0
Main Factor
Line transplanting8.16 a 0.881 a 0.41 a 268.2 a
Random transplanting8.17 a 0.867 a 0.39 a 254.5 a
Subfactor
Omission N8.21 a−0.240.900 a−13.10.38 a11.7238.9 a−2.09
FFP8.21 a−0.240.840 a−18.90.39 a14.7255.7 a4.7
SFR8.15 a−0.970.825 a−20.30.40 a17.6281.9 a15.5
IRRI LCC8.15 a−0.970.890 a−14.090.41 a20.5268.8 a10.1
PAU LCC8.16 a−0.850.896 a−13.50.41 a20.5270.7 a10.9
RCM8.13 a−1.210.855 a−17.40.41 a20.5252.0 a3.27
Values denoted with the same letter are not significantly different at p < 0.05 using Duncan’s Multiple Range Test.
Disclaimer/Publisher’s Note: The statements, opinions and data contained in all publications are solely those of the individual author(s) and contributor(s) and not of MDPI and/or the editor(s). MDPI and/or the editor(s) disclaim responsibility for any injury to people or property resulting from any ideas, methods, instructions or products referred to in the content.

