

Comparative Life Cycle Assessment of Four Municipal Water Disinfection Methods
 , , and
Abstract
:1. Introduction
2. Materials and Methods
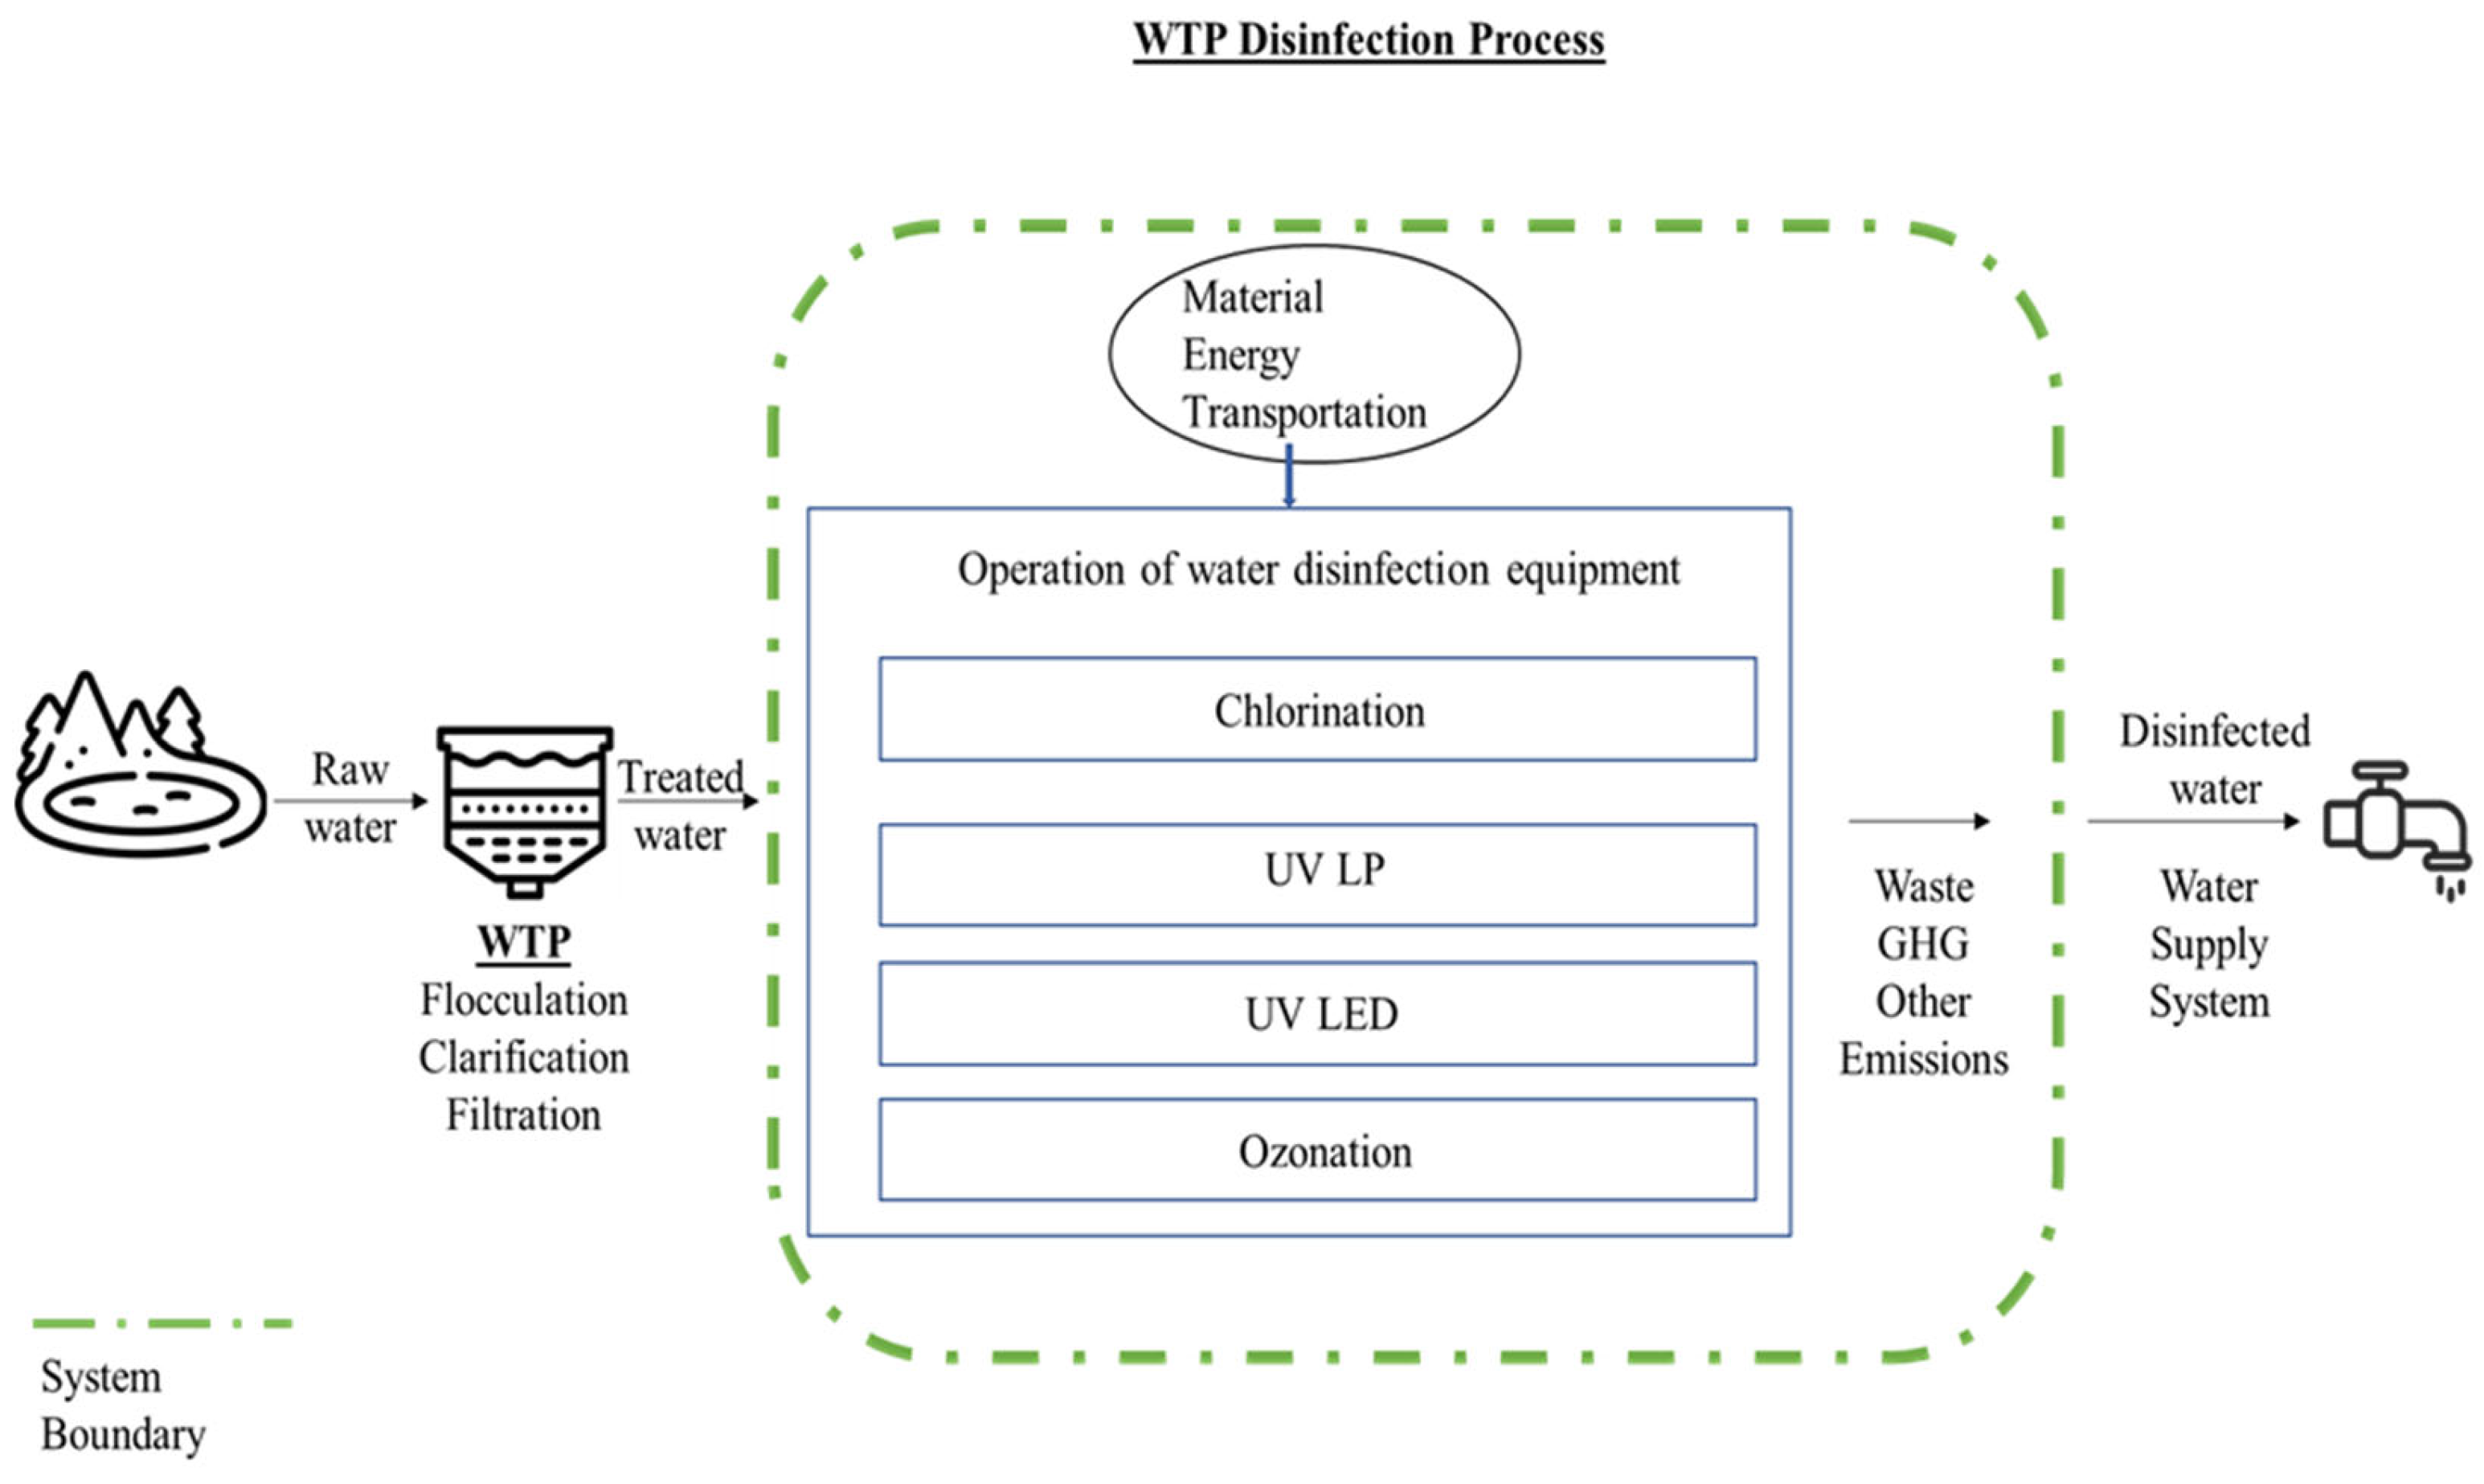
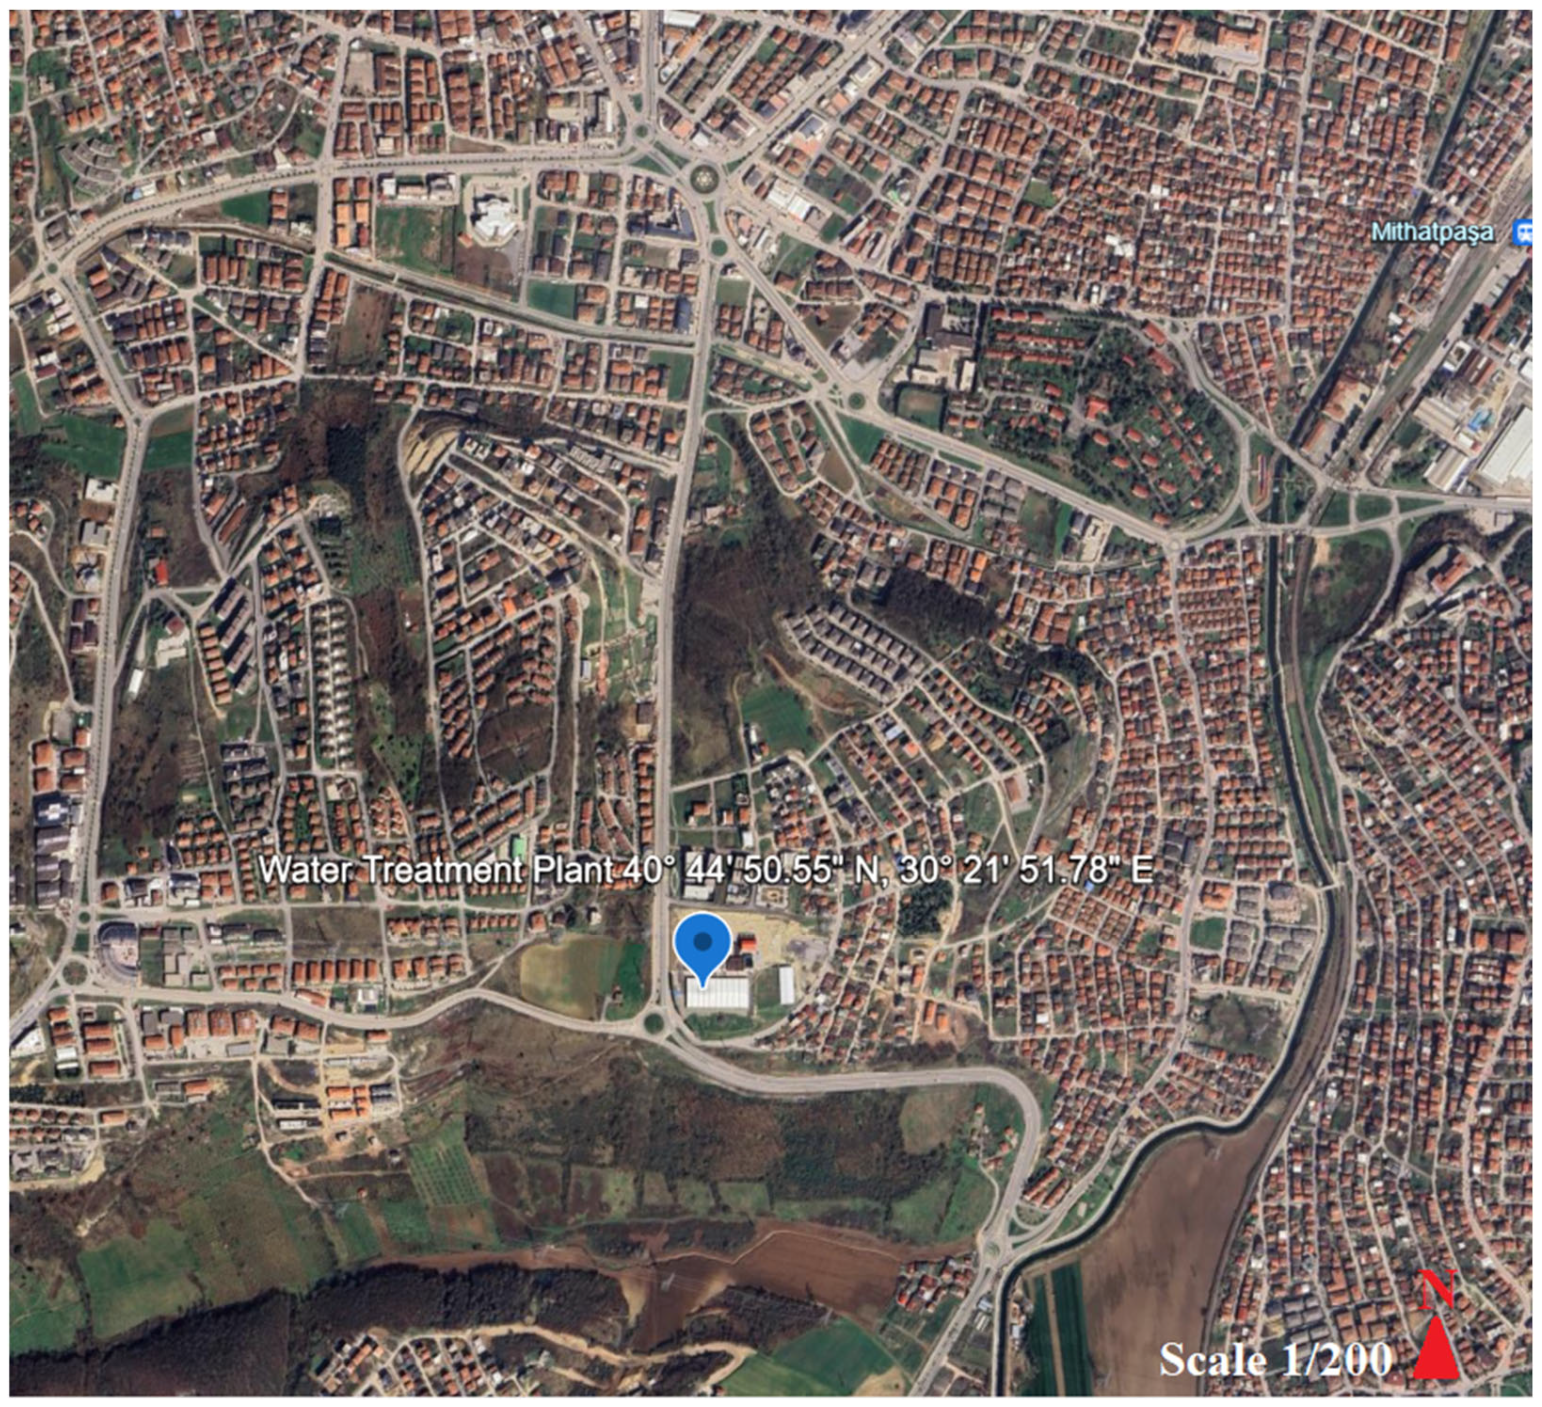
2.1. Goal and Scope
2.2. LCI
2.3. LCIA
2.4. Interpretation
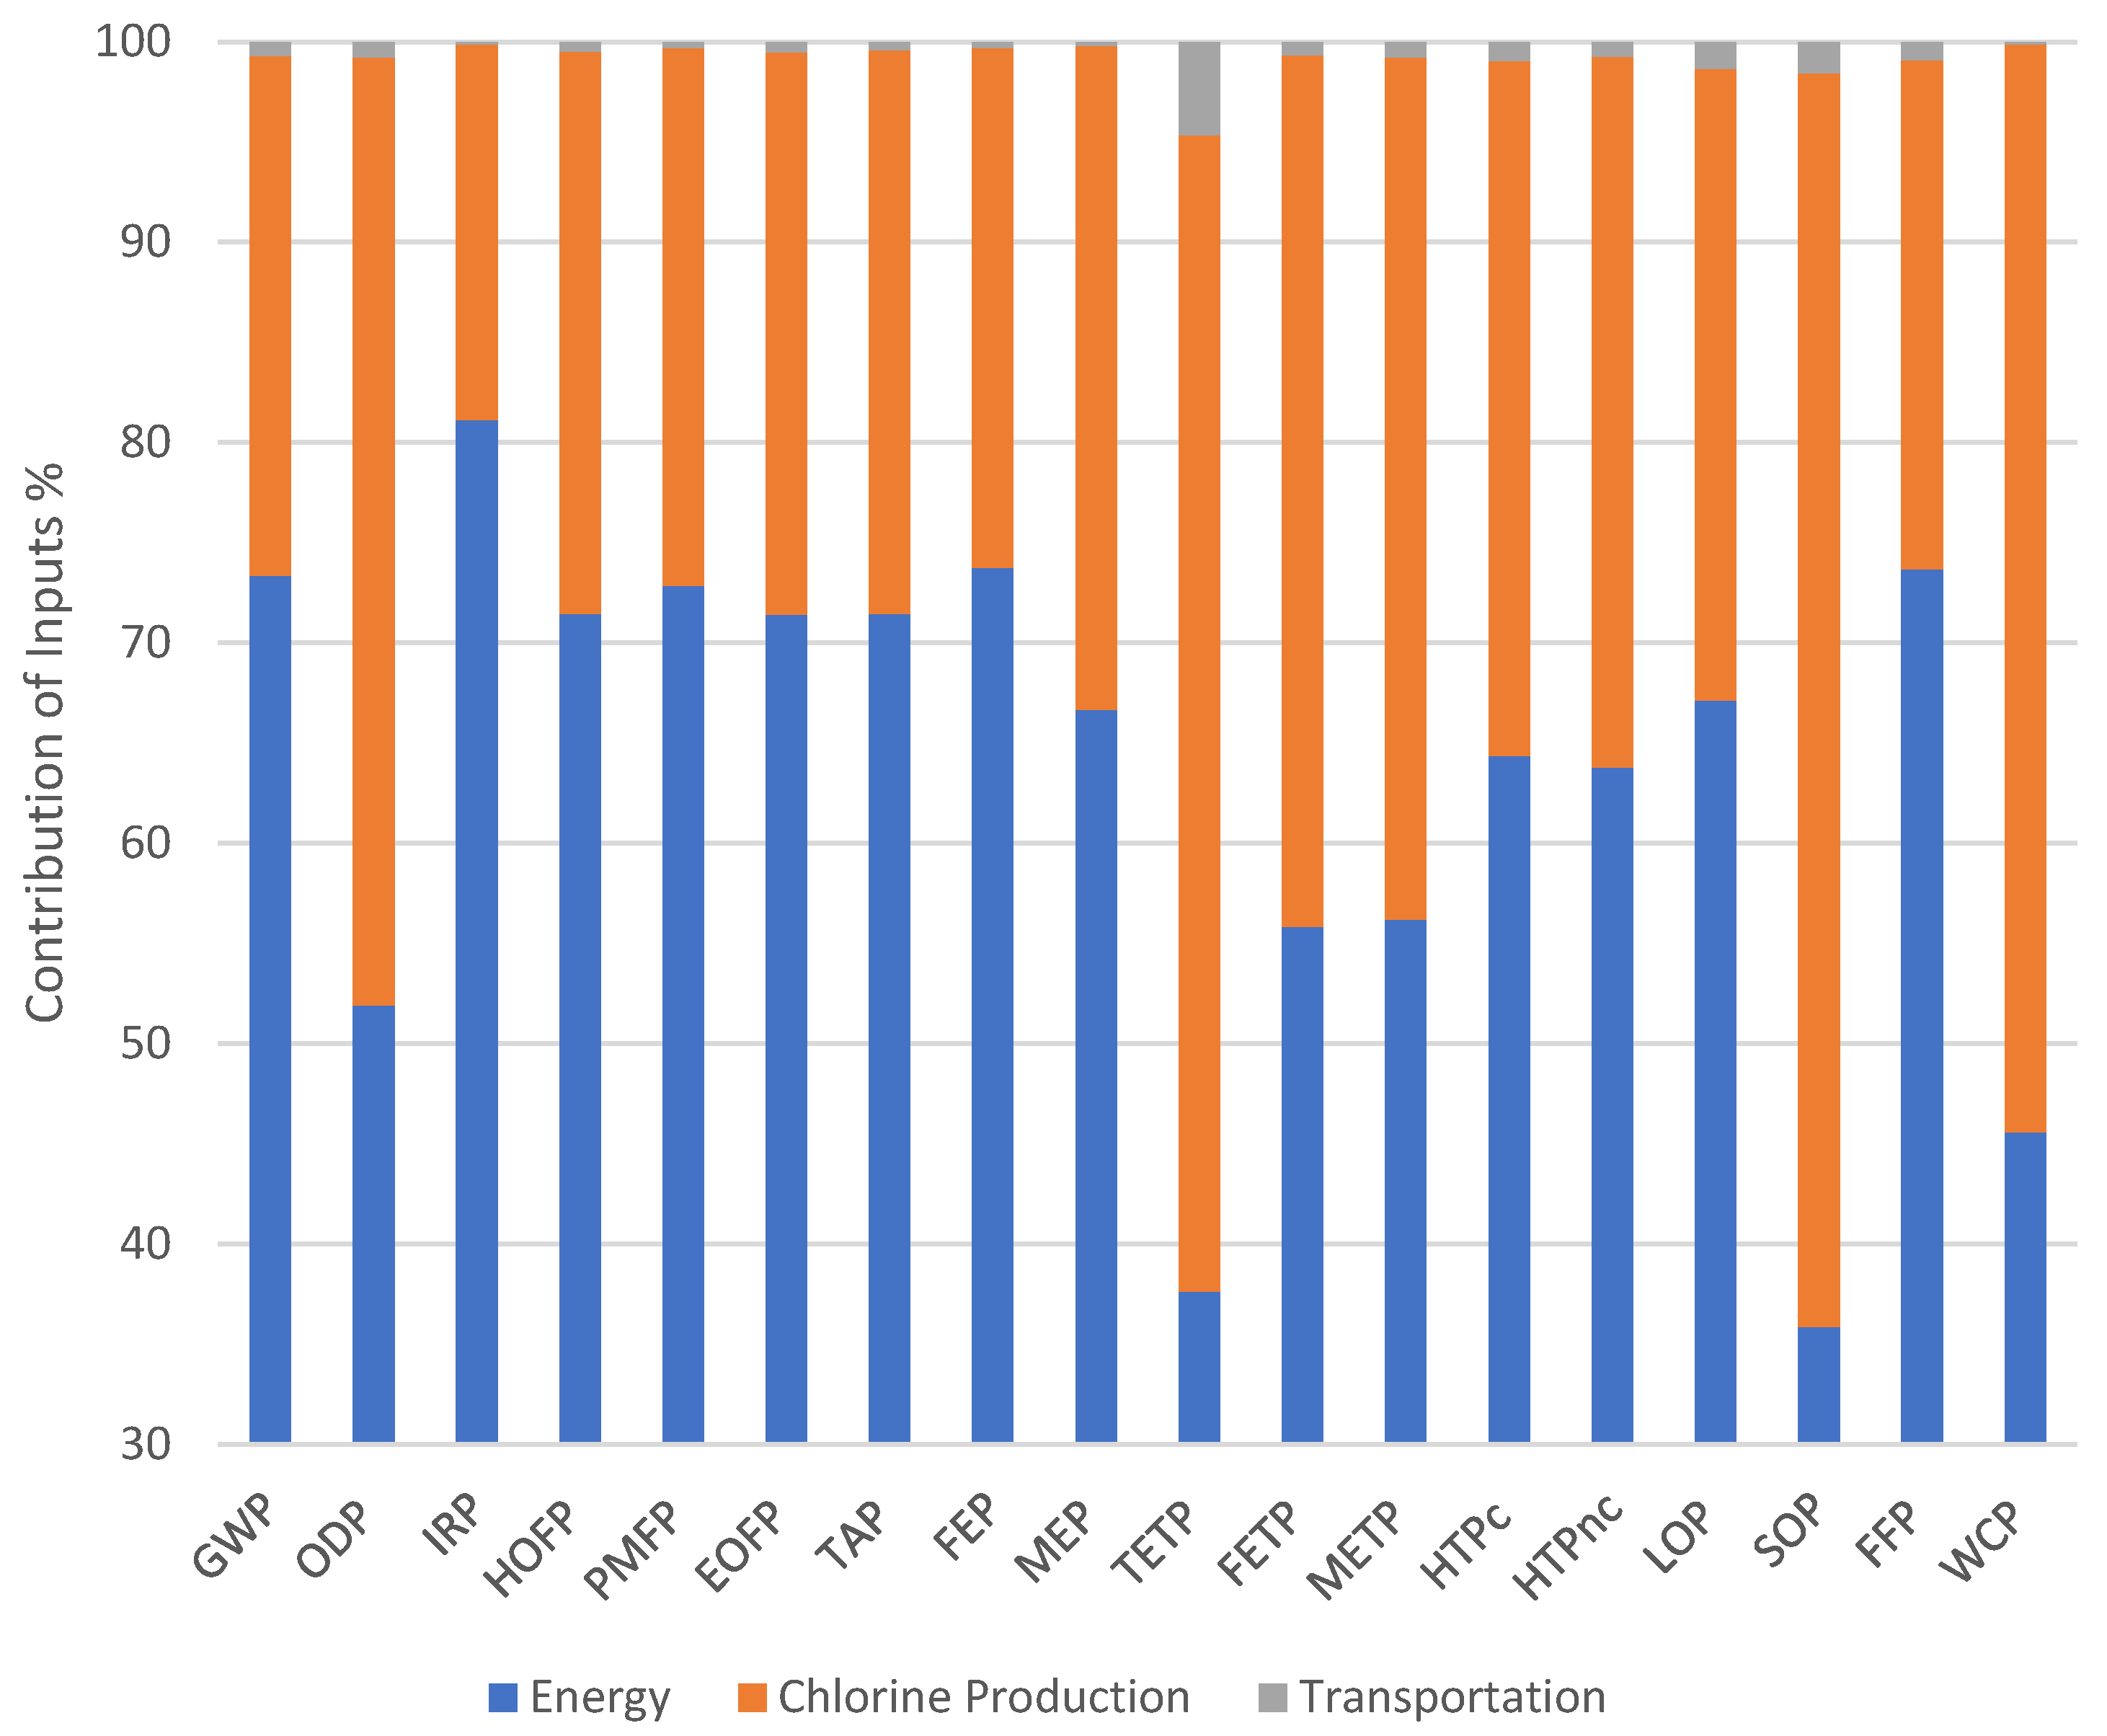
3. Results
4. Conclusions
Author Contributions
Funding
Institutional Review Board Statement
Informed Consent Statement
Data Availability Statement
Conflicts of Interest
References
- The History of Drinking Water Treatment (EPA-816-F-00-006). Available online: https://archive.epa.gov/water/archive/web/pdf/2001_11_15_consumer_hist.pdf (accessed on 3 January 2023).
- Symons, G.E. Water treatment through the ages. J. Am. Water Works Assn. 2006, 98, 87–98. [Google Scholar] [CrossRef]
- Smith, K.A. Louis Pasteur, the Father of Immunology? Front. Immunol. 2012, 3, 68. [Google Scholar] [CrossRef] [PubMed]
- Griffiths, J.K. International Encyclopedia of Public Health, 2nd ed.; Academic Press: London, UK, 2017; pp. 388–401. [Google Scholar]
- Triple Threat. Available online: https://www.unicef.org/reports/triple-threat-wash-disease-climate (accessed on 3 January 2024).
- Hundreds of Children Die Each Day from Poor Sanitation, Secretary-General Says on World Toilet Day, Urging Action to Deliver Safe Conditions Worldwide. Available online: https://press.un.org/en/2022/sgsm21577.doc.htm (accessed on 6 January 2023).
- The Direct Medical Costs of Healthcare-Associated Infections in U.S. Hospitals and the Benefits of Prevention. Available online: https://stacks.cdc.gov/view/cdc/11550 (accessed on 13 September 2023).
- Outbreaks of Waterborne Diseases. Available online: https://iris.who.int/handle/10665/366437 (accessed on 13 December 2023).
- Collier, S.A.; Deng, L.; Adam, E.A.; Benedict, K.M.; Beshearse, E.M.; Blackstock, A.J.; Bruce, B.B.; Derado, G.; Edens, C.; Fullerton, K.E.; et al. Estimate of Burden and Direct Healthcare Cost of Infectious Waterborne Disease in the United States. Emerg. Infect. Dis. 2021, 27, 140–149. [Google Scholar] [CrossRef] [PubMed]
- Marquardt, H.; Schäfer, S.G.; McClellan, R.O.; Welsch, F. Toxicology; Academic Press: Waltham, MA, USA, 1999; pp. 1041–1050. [Google Scholar]
- Wade Miller, G. An Assessment of Ozone and Chlorine Dioxide Technologies for Treatment of Municipal Water Supplies; U.S. Environmental Protection Agency: Washington, DC, USA, 1978. [Google Scholar]
- Water Treatment Plants—Fact Sheet. Available online: https://www.sandiego.gov/sites/default/files/water_treatment_plants_fact_sheet.pdf (accessed on 11 June 2024).
- Tokyo Water News. Available online: https://www.waterworks.metro.tokyo.lg.jp/eng/news/archive-48/ (accessed on 11 June 2024).
- Drinking Water. Available online: https://ethz.ch/content/dam/ethz/special-interest/chab/organic-chemistry/zenobi-groupdam/documents/Education/LecturesExercises/Analytical%20Strategy%202018/Kaiser%20Description.pdf (accessed on 11 June 2024).
- Bolton, J.R.; Anne, C. The Ultraviolet Disinfection Handbook, 1st ed.; American Water Works Association: Denver, CO, USA, 2008. [Google Scholar]
- Croton Water Treatment Plant Final Supplemental Environmental Impact Statement Executive Summary. Available online: https://www.nyc.gov/assets/dep/downloads/pdf/environmental-reviews/croton-water-filtration-plant-project/execsumm.pdf (accessed on 11 June 2024).
- Use Cases. Available online: https://lit-uv.de/use-cases/ (accessed on 11 June 2024).
- Water Disinfection, Sewage Disinfection, Ultrasound, Ultraviolet, Pure Water. Available online: https://svarog-uv.ru/English/index.htm (accessed on 11 June 2024).
- Case Studies. Available online: https://aquisense-newzealand.co.nz/remote-rural/ (accessed on 11 June 2024).
- He, Z.; Fan, X.; Jin, W.; Gao, S.; Yan, B.; Chen, C.; Ding, W.; Yin, S.; Zhou, X.; Liu, H.; et al. Chlorine-Resistant Bacteria in Drinking Water: Generation, Identification and Inactivation Using Ozone-Based Technologies. J. Water Process Eng. 2023, 53, 103772. [Google Scholar] [CrossRef]
- Mazhar, M.A.; Khan, N.A.; Ahmed, S.; Khan, A.H.; Hussain, A.; Rahisuddin; Changani, F.; Yousefi, M.; Ahmadi, S.; Vambol, V. Chlorination Disinfection By-Products in Municipal Drinking Water—A Review. J. Clean. Prod. 2020, 273, 123159. [Google Scholar] [CrossRef]
- Drinking Water Protection Fact Sheets. Available online: https://www.health.state.mn.us/communities/environment/water/factsheet (accessed on 17 March 2023).
- Guidelines for the Design, Construction and Operation of Water and Sewerage Systems. Available online: https://www.gov.nl.ca/ecc/waterres/waste/groundwater/report/ (accessed on 1 April 2023).
- Wang, C.-P.; Lin, W.-C. Combination of Ultraviolet-C Light-Emitting Diodes and a Spiral-Channel Configuration in a Water Disinfection Reactor. J. Water Process Eng. 2021, 42, 102160. [Google Scholar] [CrossRef]
- Ultraviolet Disinfection Guidance Manual for The Final Long Term 2 Enhanced Surface Water Treatment Rule. Available online: https://www.epa.gov/system/files/documents/2022-10/ultraviolet-disinfection-guidance-manual-2006.pdf (accessed on 19 April 2023).
- Fitzhenry, K.; Clifford, E.; Rowan, N.; Val del Rio, A. Bacterial Inactivation, Photoreactivation and Dark Repair Post Flow-through Pulsed UV Disinfection. J. Water Process Eng. 2021, 41, 102070. [Google Scholar] [CrossRef]
- Li, G.-Q.; Wang, W.-L.; Huo, Z.-Y.; Lu, Y.; Hu, H.-Y. Comparison of UV-LED and Low-Pressure UV for Water Disinfection: Photoreactivation and Dark Repair of Escherichia Coli. Water Res. 2017, 126, 134–143. [Google Scholar] [CrossRef] [PubMed]
- Gelete, G.; Gokcekus, H.; Ozsahin, D.U.; Uzun, B.; Gichamo, T. Evaluating Disinfection Techniques of Water Treatment. Desalination Water Treat 2020, 177, 408–415. [Google Scholar] [CrossRef]
- Sabet, H.; Moghaddam, S.S.; Ehteshami, M. A Comparative Life Cycle Assessment (LCA) Analysis of Innovative Methods Employing Cutting-Edge Technology to Improve Sludge Reduction Directly in Wastewater Handling Units. J. Water Process Eng. 2023, 51, 103354. [Google Scholar] [CrossRef]
- ISO 14040:2006. Available online: https://www.iso.org/standard/37456.html (accessed on 7 January 2023).
- Foglia, A.; Andreola, C.; Cipolletta, G.; Radini, S.; Akyol, Ç.; Eusebi, A.L.; Stanchev, P.; Katsou, E.; Fatone, F. Comparative Life Cycle Environmental and Economic Assessment of Anaerobic Membrane Bioreactor and Disinfection for Reclaimed Water Reuse in Agricultural Irrigation: A Case Study in Italy. J. Clean. Prod. 2021, 293, 126201. [Google Scholar] [CrossRef]
- Maryam, B.; Büyükgüngör, H. Wastewater Reclamation and Reuse Trends in Turkey: Opportunities and Challenges. J. Water Process Eng. 2019, 30, 100501. [Google Scholar] [CrossRef]
- Jachimowski, A.; Nitkiewicz, T. Comparative Analysis of Selected Water Disinfection Technologies with the Use of Life Cycle Assessment. Arch. Environ. Prot. 2019, 45, 3–10. [Google Scholar] [CrossRef]
- Mo, W.; Cornejo, P.K.; Malley, J.P.; Kane, T.E.; Collins, M.R. Life Cycle Environmental and Economic Implications of Small Drinking Water System Upgrades to Reduce Disinfection Byproducts. Water Res. 2018, 143, 155–164. [Google Scholar] [CrossRef] [PubMed]
- Romanovski, V.; Claesson, P.M.; Hedberg, Y.S. Comparison of Different Surface Disinfection Treatments of Drinking Water Facilities from a Corrosion and Environmental Perspective. Environ. Sci. Pollut. Res. 2020, 27, 12704–12716. [Google Scholar] [CrossRef] [PubMed]
- Busse, M.M.; Hawes, J.K.; Blatchley, E.R. Comparative Life Cycle Assessment of Water Disinfection Processes Applicable in Low-Income Settings. Environ. Sci. Technol. 2022, 56, 16336–16346. [Google Scholar] [CrossRef] [PubMed]
- Linden, K.G.; Hull, N.; Speight, V. Thinking Outside the Treatment Plant: UV for Water Distribution System Disinfection. Acc. Chem. Res. 2019, 52, 1226–1233. [Google Scholar] [CrossRef]
- Fish, K.E.; Reeves-McLaren, N.; Husband, S.; Boxall, J. Unchartered Waters: The Unintended Impacts of Residual Chlorine on Water Quality and Biofilms. NPJ Biofilms Microbiomes 2020, 6, 34. [Google Scholar] [CrossRef] [PubMed]
- Smeets, P.W.M.H.; Medema, G.J.; van Dijk, J.C. The Dutch Secret: How to Provide Safe Drinking Water without Chlorine in the Netherlands. Drink. Water Eng. Sci. 2009, 2, 1–14. [Google Scholar] [CrossRef]
- Hambsch, B.; Böckle, K.; van Lieverloo, J.H.M. Incidence of Faecal Contaminations in Chlorinated and Non-Chlorinated Distribution Systems of Neighbouring European Countries. J. Water Health. 2007, 5, 119–130. [Google Scholar] [CrossRef]
- DIRECTIVE (EU) 2020/2184 of the EUROPEAN PARLIAMENT and of the COUNCIL of 16 December 2020 on the Quality of Water Intended for Human Consumption (Recast) (Text with EEA Relevance). Available online: https://eur-lex.europa.eu/legal-content/EN/TXT/PDF/?uri=CELEX:32020L2184 (accessed on 3 December 2023).
- Tarnacki, K.; Meneses, M.; Melin, T.; van Medevoort, J.; Jansen, A. Environmental Assessment of Desalination Processes: Reverse Osmosis and Memstill®. Desalination 2012, 296, 69–80. [Google Scholar] [CrossRef]
- Cashman, S.; Gaglione, A.; Mosley, J.; Weiss, L.; Hawkins, T.R.; Ashbolt, N.J.; Cashdollar, J.; Xue, X.; Ma, C.; Arden, S. Environmental and Cost Life Cycle Assessment of Disinfection Options for Municipal Drinking Water Treatment; Report No. EPA 600/R-14/376; U.S. Environmental Protection Agency: Washington, DC, USA, 2014. [Google Scholar]
- Huijbregts, M.A.J.; Steinmann, Z.J.N.; Elshout, P.M.F.; Stam, G.; Verones, F.; Vieira, M.; Zijp, M.; Hollander, A.; van Zelm, R. ReCiPe2016: A Harmonised Life Cycle Impact Assessment Method at Midpoint and Endpoint Level. Int. J. Life Cycle Assess. 2017, 22, 138–147. [Google Scholar] [CrossRef]
- ISO 14044. Available online: https://www.iso.org/standard/38498.html (accessed on 29 January 2023).
- Jones, C.H.; Shilling, E.G.; Linden, K.G.; Cook, S.M. Life Cycle Environmental Impacts of Disinfection Technologies Used in Small Drinking Water Systems. Environ. Sci. Technol. 2018, 52, 2998–3007. [Google Scholar] [CrossRef] [PubMed]
- Sousa Filho, J.W.; Lenza, G.A.; Tonhela, M.A.; Araújo, K.S.; Fernandes, D.M.; Malpass, G.R.P. Full-Scale Application of an Electrochemical Disinfection Solution in a Municipal Drinking Water Treatment Plant. Water Environ. J. 2021, 36, 86–95. [Google Scholar] [CrossRef]
- Chaplin, B.P. The Prospect of Electrochemical Technologies Advancing Worldwide Water Treatment. Acc. Chem. Res. 2019, 52, 596–604. [Google Scholar] [CrossRef] [PubMed]
- Zhang, C.; Li, Y.; Shuai, D.; Shen, Y.; Xiong, W.; Wang, L. Graphitic Carbon Nitride (G-C3N4)-Based Photocatalysts for Water Disinfection and Microbial Control: A Review. Chemosphere 2019, 214, 462–479. [Google Scholar] [CrossRef] [PubMed]
- Wang, J.; Chen, H. Catalytic Ozonation for Water and Wastewater Treatment: Recent Advances and Perspective. Sci. Total Environ. 2020, 704, 135249. [Google Scholar] [CrossRef] [PubMed]
- Fetyan, N.A.H.; Salem Attia, T.M. Water Purification Using Ultrasound Waves: Application and Challenges. J. Basic Appl. Sci. 2020, 27, 194–207. [Google Scholar] [CrossRef]
- Seridou, P.; Kalogerakis, N. Disinfection Applications of Ozone Micro- and Nanobubbles. Environ. Sci. Nano 2021, 8, 3493–3510. [Google Scholar] [CrossRef]
- Third Edition in Water Science, Research and Management a Compendium of Hot Topics and Features from IWA Specialist Groups Global Trends & Challenges. Available online: https://iwa-network.org/wp-content/uploads/2022/09/IWA_2022_Global_Trend_SG_WEB.pdf (accessed on 4 April 2023).
- Naunovic, Z.; Lim, S.; Blatchley, E.R. Investigation of Microbial Inactivation Efficiency of a UV Disinfection System Employing an Excimer Lamp. Water Res. 2008, 42, 4838–4846. [Google Scholar] [CrossRef]
- You, J.; Guo, Y.; Guo, R.; Liu, X. A Review of Visible Light-Active Photocatalysts for Water Disinfection: Features and Prospects. Chem. Eng. J. 2019, 373, 624–641. [Google Scholar] [CrossRef]


| Impact Category Indicator | Unit/Midpoint | Impact Category Indicator | Unit/Midpoint | Impact Category Indicator | Unit/Midpoint |
|---|---|---|---|---|---|
| Global warming | kg CO2 eq | Terrestrial acidification | kg SO2 eq | Human carcinogenic toxicity | kg 1.4-DCB |
| Stratospheric ozone depletion | kg CFC-11 eq | Freshwater eutrophication | kg P eq | Human non-carcinogenic toxicity | kg 1.4-DCB |
| Ionizing radiation | kBq Co-60 eq | Marine eutrophication | kg N eq | Land use | m2a crop eq |
| Ozone formation, Human health | kg NOx eq | Terrestrial ecotoxicity | kg 1.4-DCB | Mineral resources | kg Cu eq |
| Fine particulate matter formation | kg PM2.5 eq | Freshwater ecotoxicity | kg 1.4-DCB | Fossil resource scarcity | kg oil eq |
| Ozone formation, Terrestrial ecosystems | kg NOx eq | Marine ecotoxicity | kg 1.4-DCB | Water consumption | m3 |
| Impact Category | Chlorine Disinfection | Ozone Disinfection | UV LED Disinfection | UV LP Disinfection |
|---|---|---|---|---|
| Global warming | +8.24 | +11.42 | +11.51 | +11.39 |
| Stratospheric ozone depletion | +19.82 | +45.88 | +46.36 | +38.03 |
| Ionizing radiation | +333.54 | +1579.96 | +1699.56 | +1652.80 |
| Ozone formation, Human health | +3.97 | +5.54 | +5.61 | +5.13 |
| Fine particulate matter formation | −61.46 | −68.18 | −68.50 | −68.09 |
| Ozone formation, Terrestrial ecosystems | +4.05 | +5.65 | +5.72 | +5.24 |
| Terrestrial acidification | −12.83 | −16.62 | −16.98 | −16.50 |
| Freshwater eutrophication | −39.29 | −45.99 | −46.56 | −46.27 |
| Marine eutrophication | −31.12 | −39.93 | −40.15 | −40.10 |
| Terrestrial ecotoxicity | +12.93 | +20.84 | +41.25 | +32.00 |
| Freshwater ecotoxicity | −19.38 | −24.36 | −29.60 | −27.45 |
| Marine ecotoxicity | −19.67 | −24.78 | −29.87 | −27.72 |
| Human carcinogenic toxicity | −19.93 | −23.66 | −27.56 | −25.68 |
| Human non-carcinogenic toxicity | −22.21 | −28.04 | −30.62 | −29.47 |
| Land use | +61.88 | +118.55 | +130.01 | +12,614 |
| Mineral resource scarcity | +16.38 | +24.83 | +56.37 | +31.12 |
| Fossil resource scarcity | +8.22 | +11.35 | +11.42 | +11.30 |
| Water consumption | +3.07 | +6.74 | +6.94 | +6.87 |
Disclaimer/Publisher’s Note: The statements, opinions and data contained in all publications are solely those of the individual author(s) and contributor(s) and not of MDPI and/or the editor(s). MDPI and/or the editor(s) disclaim responsibility for any injury to people or property resulting from any ideas, methods, instructions or products referred to in the content. |
© 2024 by the authors. Licensee MDPI, Basel, Switzerland. This article is an open access article distributed under the terms and conditions of the Creative Commons Attribution (CC BY) license (https://creativecommons.org/licenses/by/4.0/).
Share and Cite
Demir, M.Z.; Guven, H.; Ersahin, M.E.; Ozgun, H.; Pasaoglu, M.E.; Koyuncu, I. Comparative Life Cycle Assessment of Four Municipal Water Disinfection Methods. Sustainability 2024, 16, 6104. https://doi.org/10.3390/su16146104
Demir MZ, Guven H, Ersahin ME, Ozgun H, Pasaoglu ME, Koyuncu I. Comparative Life Cycle Assessment of Four Municipal Water Disinfection Methods. Sustainability. 2024; 16(14):6104. https://doi.org/10.3390/su16146104
Chicago/Turabian StyleDemir, Mehmet Zahid, Huseyin Guven, Mustafa Evren Ersahin, Hale Ozgun, Mehmet Emin Pasaoglu, and Ismail Koyuncu. 2024. "Comparative Life Cycle Assessment of Four Municipal Water Disinfection Methods" Sustainability 16, no. 14: 6104. https://doi.org/10.3390/su16146104