Article

Mapping the Sustainability of Waste-to-Energy Processes for Food Loss and Waste in Mexico—Part 1: Energy Feasibility Study

by
Alonso Albalate-Ramírez
1,2,
Alejandro Padilla-Rivera
3,
Juan Felipe Rueda-Avellaneda
4,
Brenda Nelly López-Hernández
1,2,
José Julián Cano-Gómez
1 and
Pasiano Rivas-García
1,2,*
1
Departamento de Ingenieria Quimica, Facultad de Ciencias Quimicas, Universidad Autonoma de Nuevo Leon, Av. Universidad S/N, Cd. Universitaria, San Nicolas de los Garza 64451, NL, Mexico
2
Centro de Investigacion en Biotecnologia y Nanotecnologia, Facultad de Ciencias Quimicas, Universidad Autonoma de Nuevo Leon, Parque de Investigacion e Innovacion Tecnologica, km 10 Highway to the International Airport Mariano Escobedo, Apodaca 66629, NL, Mexico
3
School of Architecture, Planning, and Landscape, University of Calgary, 2500 University Drive NW, Calgary, AB T2N 1N4, Canada
4
Universidad Politecnica de Apodaca, Av. Politecnica No. 2331, Col. El Barretal, Apodaca 66600, NL, Mexico
*
Author to whom correspondence should be addressed.
Sustainability 2024, 16(14), 6111; https://doi.org/10.3390/su16146111
Submission received: 18 June 2024 / Revised: 6 July 2024 / Accepted: 15 July 2024 / Published: 17 July 2024

Abstract

:
Mexico generated 8.9 Mt of food loss and waste (FLW) at food distribution and retail centers in the year 2022. Traditional management methods in Latin America primarily involve final disposal sites, contributing to national greenhouse gas emissions of 0.22 Mt CO2 eq y−1. This creates an urgent need for sustainable valorization strategies for FLW to mitigate environmental impacts. This comprehensive study analyzes the geographical distribution of FLW generation and proposes a valorization approach using WtE-AD plants. Geographic information systems were employed for geographical analysis, life cycle assessment was used for environmental evaluation, and circular economy business models were applied for sustainability assessment. The primary objective of this first part of the contribution is to evaluate the technical feasibility of implementing waste-to-energy anaerobic digestion (WtE-AD) plants for FLW management in Mexico considering their geographical locations. The results demonstrate that WtE-AD plants with treatment capacities exceeding 8 t d−1 can achieve positive energy balances and significantly reduce greenhouse gas emissions. Specific findings indicate that these plants are viable for large-scale implementation, with larger plants showing resilience to increased transport distances while maintaining energy efficiency. The results highlight the critical influence of methane yields and transport distances on plant energy performance. This study underscores the importance of strategically placing and scaling WtE-AD plants to optimize resource efficiency and environmental sustainability. These findings provide essential insights for policymakers and stakeholders advocating for the transition of Mexico’s food supply chain toward a circular economy. Future parts of this study will explore detailed economic analyses and the policy frameworks necessary for the large-scale implementation of WtE-AD plants in Mexico. Further research should continue to develop innovative strategies to enhance the techno-economic and environmental performance of WtE-AD processes, ensuring sustainable FLW management and energy recovery.

1. Introduction

In Mexico, the food industry is a significant economic contributor, employing over two million people [1]. The distribution and retail segment alone holds an economic value of USD 137 billion, which is 1.86 times greater than that of Canada’s equivalent stage [2]. This economic value is derived from the operations conducted by supply centers. Given the substantial activity within the food sector, Mexico grapples with the considerable generation of food loss and waste (FLW) across all food supply chain (FSC) stages [3].
Due to its elevated moisture content and rapid biodegradability, FLW is unsuitable for management at final disposal sites (FDSs) [4,5,6,7], as stipulated by the European Union Directive 2008/98/EC [8]. Nevertheless, FDSs remain the predominant method for FLW management in Mexico, spawning multiple environmental challenges attributed to collection, transportation, and disposal activities. Despite the critical need for data on food waste generation in Mexico, there is a significant lack of information, with the only known comprehensive study being that of Albalate-Ramírez et al. [9]. This study reported the first national atlas of FLW generated during the distribution and retail stages of the food supply chain in Mexico and quantified the environmental impact of managing these wastes in FDSs across the country. The authors found that Mexico generates 8.95 Mt y−1 of FLW, resulting in 0.22 Mt CO2 eq y−1 due to FLW decomposition in FDSs. According to the First National Census of Supply Centers, 89 supply centers with physical and operational infrastructure are distributed throughout Mexico [10]. These supply centers are areas of high centralization for food wholesale and retail activities. Mexico City hosts the largest supply center in the world, covering an area of 3.27 km2, where more than 330,000 tons of merchandise is processed annually, and about 28% of food becomes FLW due to operational negligence and decomposition [11]. Addressing the economic and environmental concerns in Mexico requires the adoption of novel FLW valorization strategies, aligning with the principles of waste reduction and the circular economy [12].
Biological waste-to-energy processes are widely studied for FLW valorization, for which the anaerobic digestion (AD) process has been highlighted as one of the main strategies [13,14,15,16,17,18,19,20,21,22]. AD is a microbiological process of organic matter decomposition, where the main value-added product is methane [23]. AD could contribute to the transition toward clean electric power generation systems and a reduction in greenhouse gas (GHG) emissions [24]. Waste-to-energy anaerobic digestion (WtE-AD) processes have the capacity to provide environmental benefits of up to −0.61 kg CO2 eq kWh−1 of produced energy due to conventional electrical energy substitution [25]. Integrating WtE-AD processes into the food supply chain represents a crucial shift toward transitioning from a linear to a circular economy model, addressing both environmental sustainability and resource efficiency challenges [26].
Although they are few, some works have been reported that seek to apply WtE-AD processes in Mexico for FLW valorization. Miramontes-Martínez et al. [27] conducted a techno-economic and environmental study for the implementation of a WtE-AD plant in Mexico for the energy recovery of waste from supply centers. The authors found that these processes require a treatment capacity of at least 72,000 t y−1 of FLW to be economically profitable and, therefore, require government funding. The authors concluded that a determining factor in the success of the processes is the transport distance. It is noteworthy that transport logistics’ impact may vary between regions. While localized studies provide valuable insights into the feasibility of WtE-AD processes for FLW valorization, there is a pressing need for more comprehensive research initiatives that encompass the diverse geographical and sociodemographic characteristics of Mexico. Such studies would not only facilitate the identification of region-specific challenges and opportunities but also enable the development of tailored strategies to foster the transition toward a circular economy model at a national scale [28,29].
Specialized tools are needed to perform a detailed analysis of the implementation of WtE-AD processes considering the amount of FLW generated in different regions of Mexico. Geographic information systems (GISs) are presented as an option used to acquire more detailed geographic location data and statistics, especially in the evaluation of strategies for waste management [30,31,32,33,34,35,36,37]. Using a GIS scheme, Rueda-Avellaneda et al. [38] conducted a spatial–temporal evaluation of the current and prospective municipal solid waste management system in Mexico. The authors were able to geographically locate 1782 FDSs of MSW and quantify the biogas generation at each of them. Through spatial analysis, the authors determined that only 4.6% of the sites generated more than 5 Mm3 of biogas per year, which is a technical restriction for the implementation of electric power generation technologies. The spatial capabilities of GISs facilitate the identification of areas with high FLW generation [28], thus supporting the development of tailored strategies that align with the principles of a circular economy and environmental sustainability. Consequently, the application of GISs in FLW valorization not only enhances resource efficiency but also contributes to the broader goal of transitioning Mexico’s food supply chain toward a sustainable, circular economy model.
The critical necessity to transition to advanced valorization schemes for FLW has driven the development of an extensive national framework for their energetic recovery. This study involves the meticulous geographical location of FLW generated across 720,606 food distribution and retail centers, coupled with a robust valorization strategy proposal through WtE-AD plants. The plants were evaluated using a comprehensive techno-economic and environmental approach. Utilizing sophisticated GIS tools, this research intricately analyzes the spatial distribution of each valorization site and integrates life cycle assessment methodologies and circular economy business models to ensure a holistic evaluation. In this first part, the study rigorously examines the technical feasibility via a detailed energy balance, accounting for the logistics of FLW transport and employing a sophisticated scale-up mathematical model for all WtE-AD plants. These plants were designed to generate both clean electricity and biofertilizer, showcasing their dual functionality. The findings of this research provide crucial insights for strategic decision-making, facilitating the implementation of energy recovery strategies that align with circular economy principles and promote the production of high-value products from FLW. The complexity and depth of the tools and data utilized underscore the significant scope and impact of this work.

2. Methodology

This work considers the valorization of FLW generated in food distribution and retail centers in Mexico through WtE-AD processes as an alternative scheme to final disposal sites. The energetic feasibility of the application of WtE-AD plants in Mexico was evaluated following a three-part methodology: Section 2.1: the location of each WtE-AD plant and the identification of the amount of FLW that reaches each site; Section 2.2: the formulation of a mathematical model that allows each WtE-AD plant to be simulated in terms of its treatment capacity; Section 2.3: an energetic feasibility analysis based on the average methane yields of the different food categories; and Section 2.4: a sensitivity analysis to improve the energetic competitiveness of these plants in Mexico.

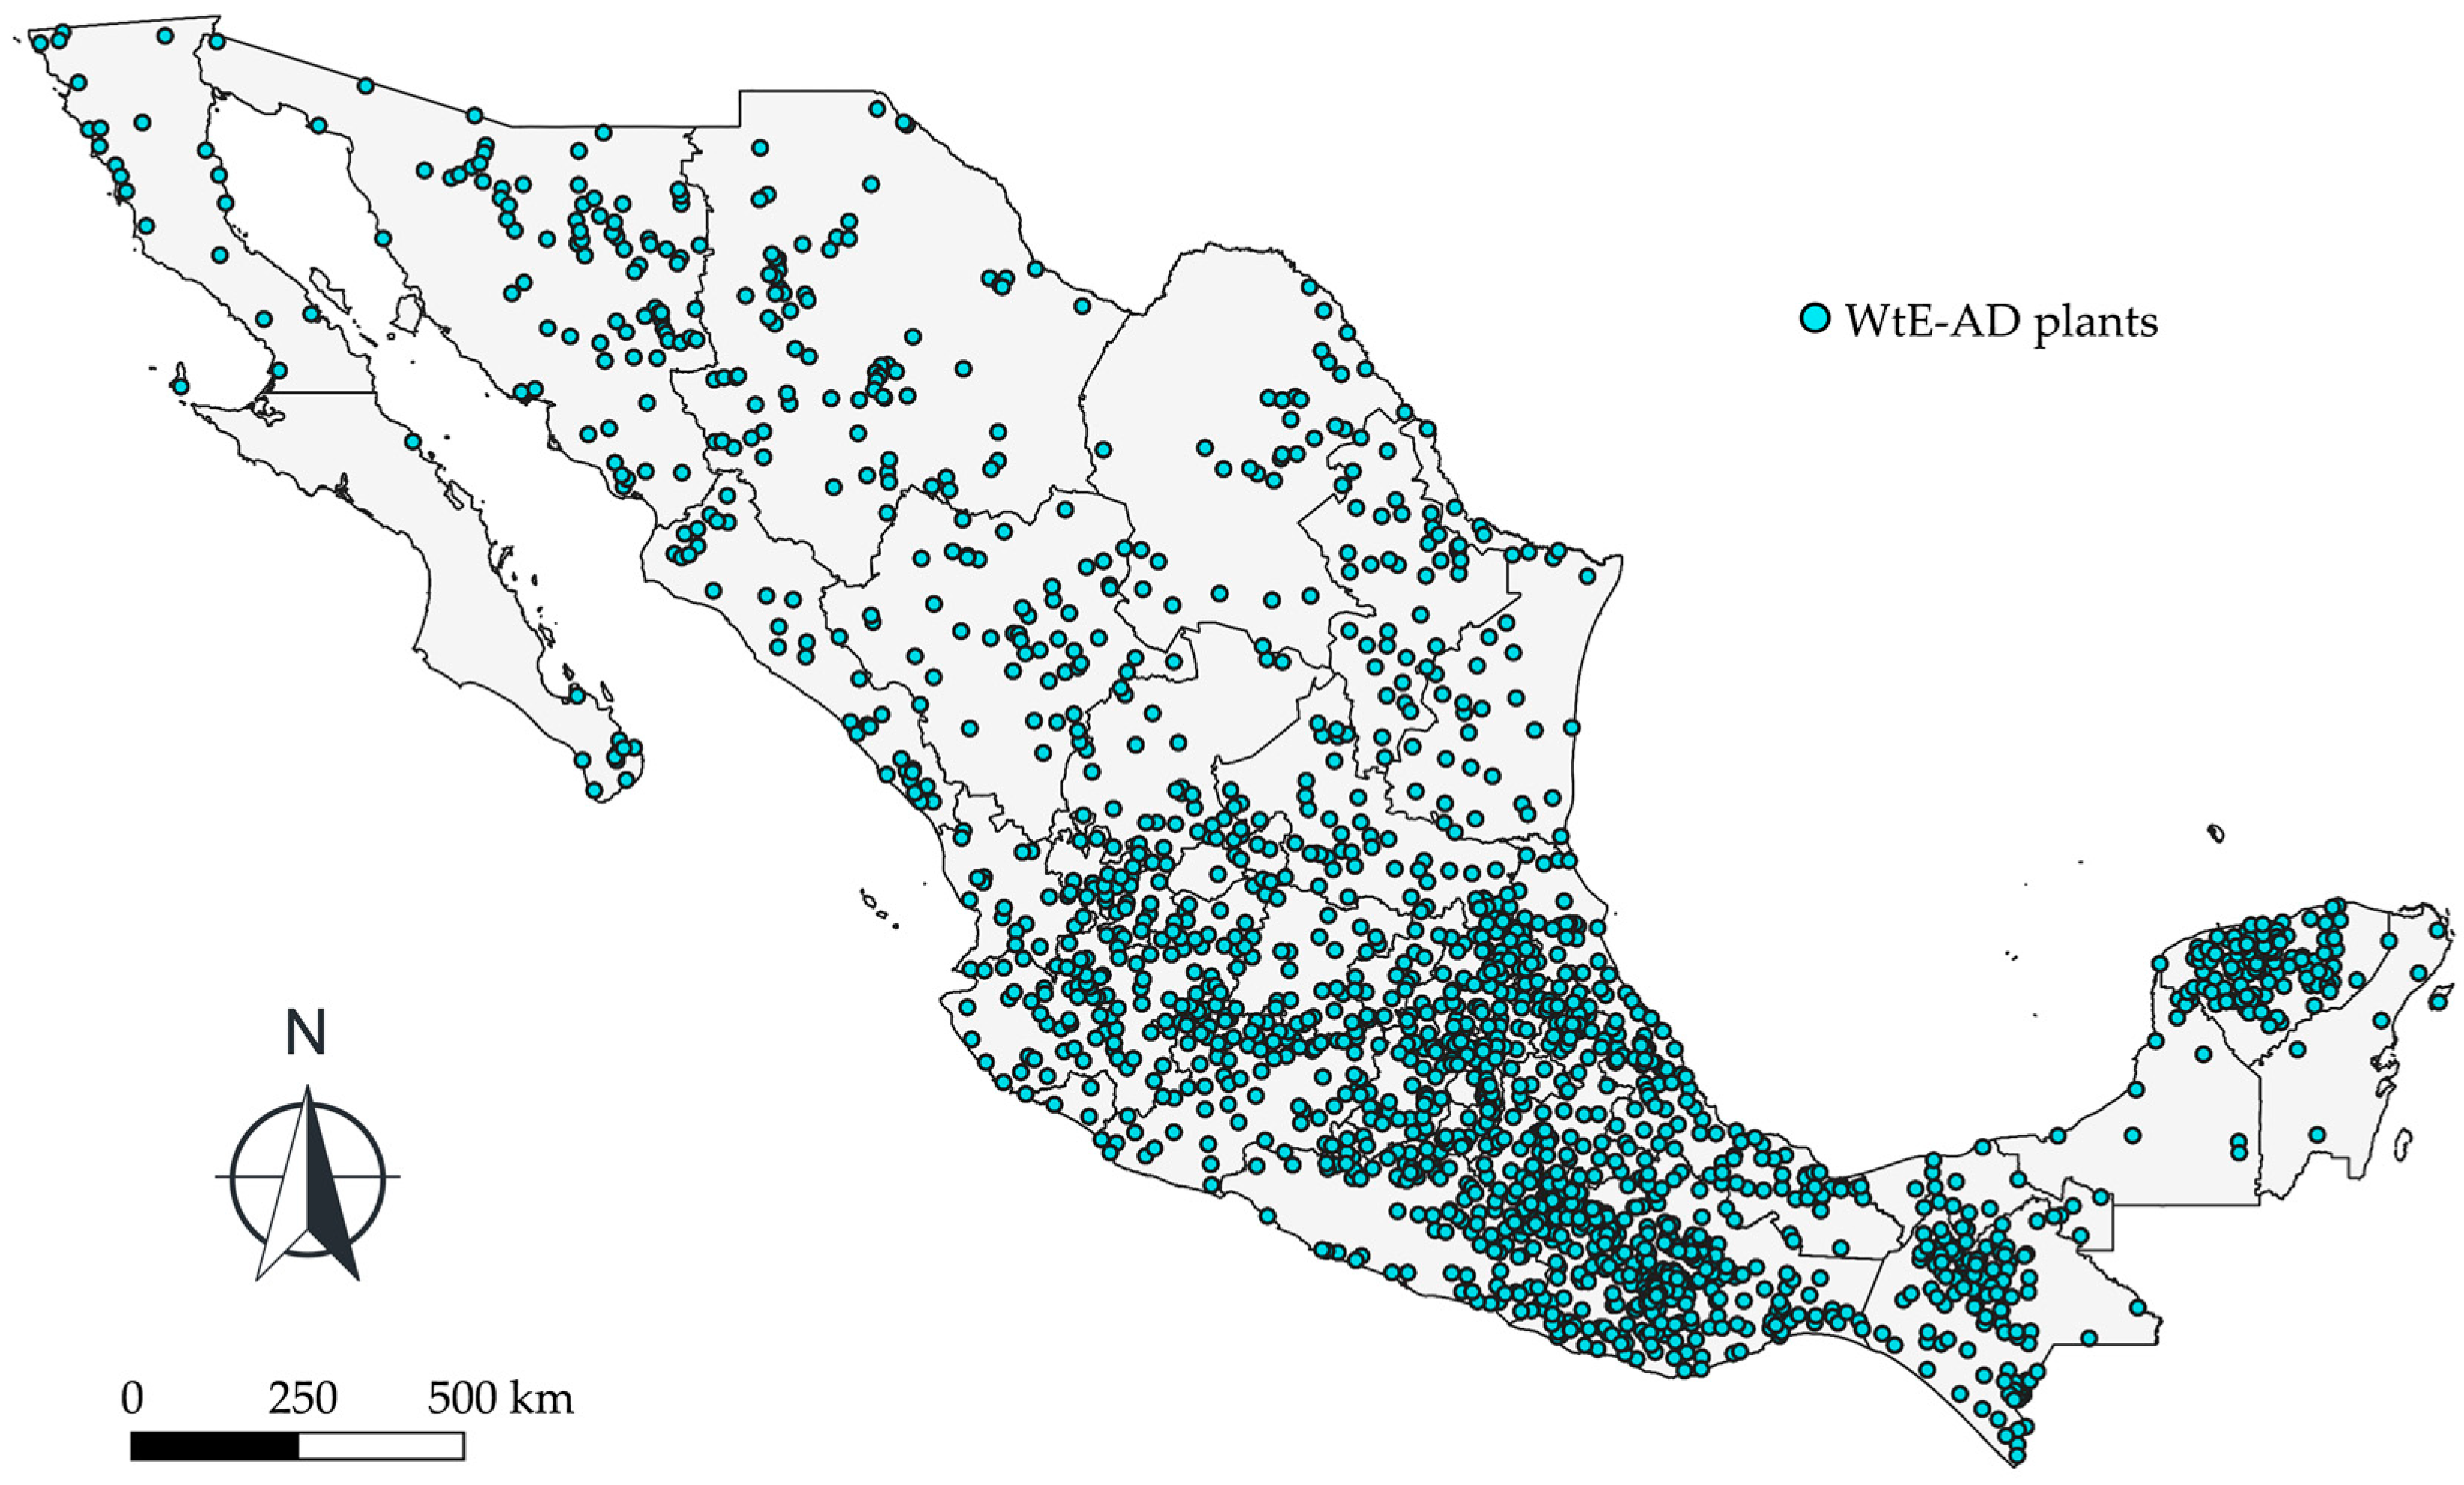
2.1. Geographic Localization of WtE-AD Plants and FLW Generation

To geographically locate all WtE-AD plants in Mexico, the information reported by Rueda-Avellaneda et al. [9] was used. This work assumes that the energy valorization plants will be situated at the same geographical locations as the current final disposal sites. This assumption is valid as a preliminary approach, as it will provide insight into how the environmental impacts associated with the current infrastructure in the FLW management system would shift.
The identification of the amount of waste that will be managed in each WtE-AD plant was taken from the national inventory of FLW generation, derived from all food distribution and retail centers in Mexico reported by Albalate-Ramírez et al. [9]. This inventory considers the proportions of different food categories [2] that are generated as waste (fruits and vegetables, meat, milk and dairy products, fish and seafood, seeds and pulses, and bread and pasta) and the transport distances between all the centers and their nearest FDS (WtE-AD, in this case). Additionally, the inventory quantifies the total GHG emissions derived from FLW disposal at the final disposal sites. The geographic location and quantification of WtE-AD (Figure 1) and municipal FLW generation were mapped using QGIS 3.38.0 software.

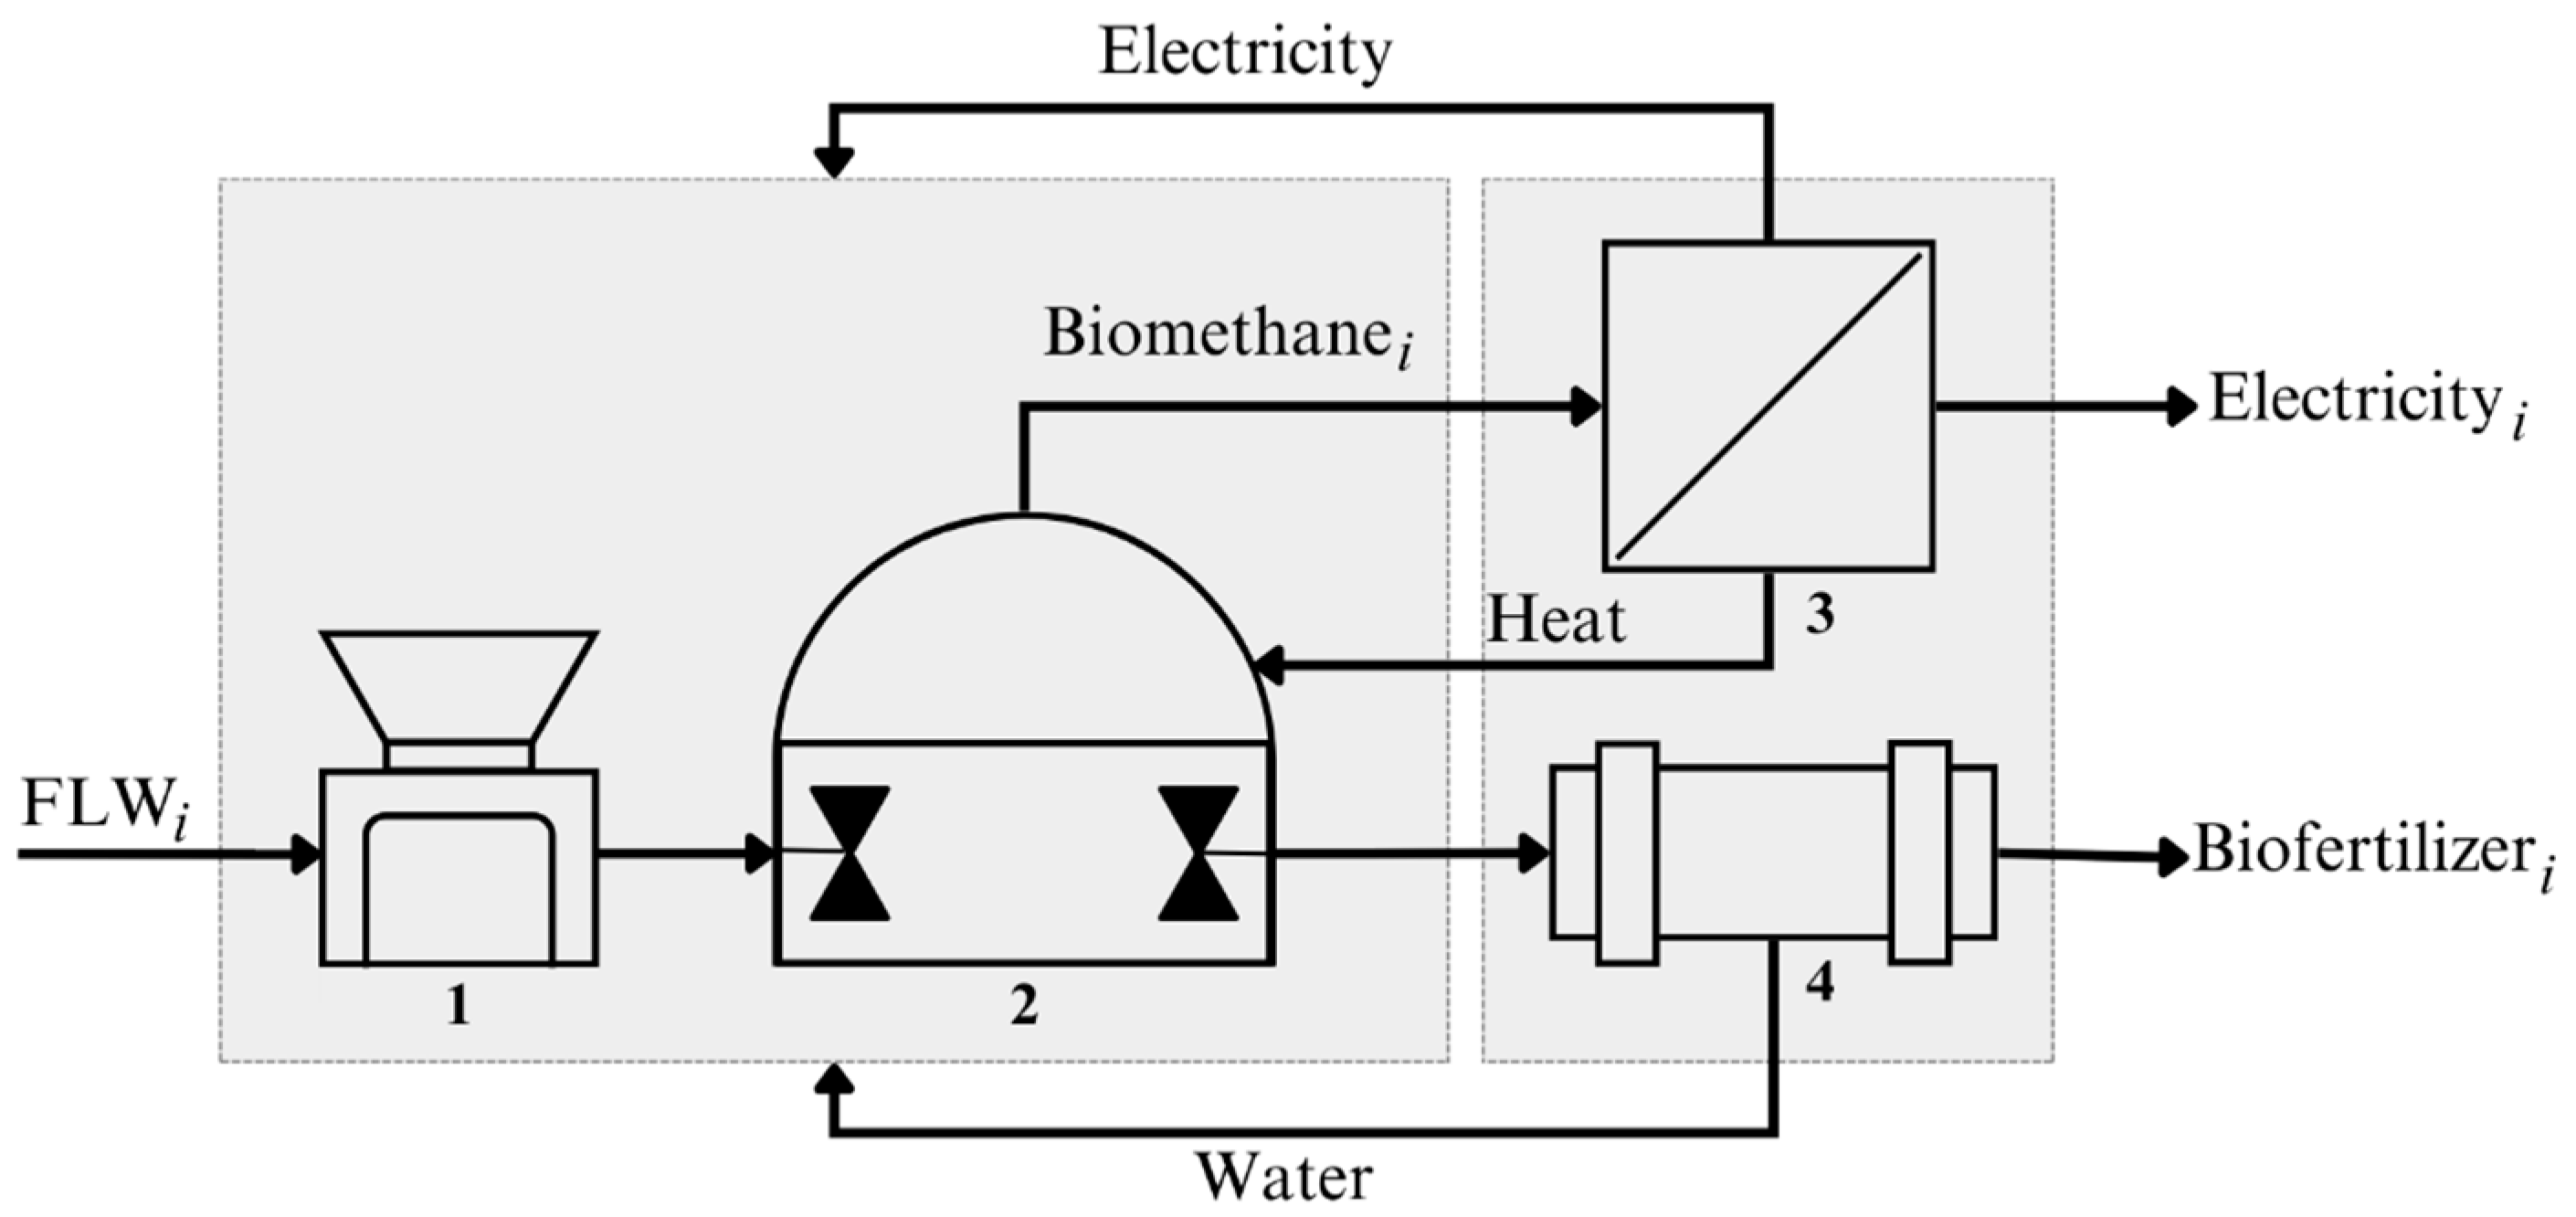
2.2. Energy Consumption Model for WtE-AD Plants

The WtE-AD plants were designed based on the following operations and unit processes: (1) an industrial food shredder, (2) an anaerobic digester with agitation and heating system, (3) a cogeneration system for electricity and heat from methane combustion, and (4) a rotary drum sludge dryer. The simulation of each operation (Figure 2) was conducted by modeling the energy consumption of the unit operations involved in the process (Equations (1)–(4)) and the amount of net energy produced by each anaerobic digester proposed in each WtE-AD plant in the Mexican territory (Equation (5)).
Equations (1) and (2) represent the energy consumption of the heating and stirring operations of the anaerobic digesters of plant i in kWh [39], Eheat,i and Estirr,i, respectively. In Equation (1), Cp,mix and ρmix are the heat capacity and density of the input mix to the digesters, ka/s represents the overall heat transfer coefficient, ηheat is the heat transfer efficiency, and the parameters (Tr − T0) and (Tr − Tout) are the differences between the digester operating temperature (Tr) and the operating and surrounding temperatures, (T0 and Tout), respectively. In Equation (2), Np represents a dimensionless number that ensures turbulence conditions during agitation and was set at a value of 0.72, as recommended by Piccino et al. [10]. ρmix is the density of the reactive medium, Ni and di are the angular velocity and diameter of the digester agitator i, and t is the operating time of plant i. The values and units for the parameters used can be found in Tables S1 and S2 of the Supplementary Material Section.
E h e a t , i = C p , m i x   ρ m i x T r T 0 + A i   k a s T r T o u t η h e a t   ,     i
E s t i r r , i = N p   ρ m i x   N i 3 d i 5 t η s t i r r   ,     i
Equations (3) and (4) represent the energy consumption derived from FLW grinding and digestate drying, considering an industrial knife food shredder and a rotary drum sludge dryer, Eshredder,i and Edryer,i, respectively. For these unit operations, a robust review of technical data sheets from various suppliers was carried out, with which the energy consumption of these pieces of equipment (kWh) was obtained according to their treatment capacity (t d−1). From the data obtained, regression models for the modeling of these unit operations were constructed. The graphs corresponding to the regression models for the shredder and dryer are found in Figures S1 and S2 of the Supplementary Material.
E s h r e d d e r , i = 152.01 l n T C i + 37.46   ,     i
E d r y e r , i = 38.52 T C i 0.804   ,     i

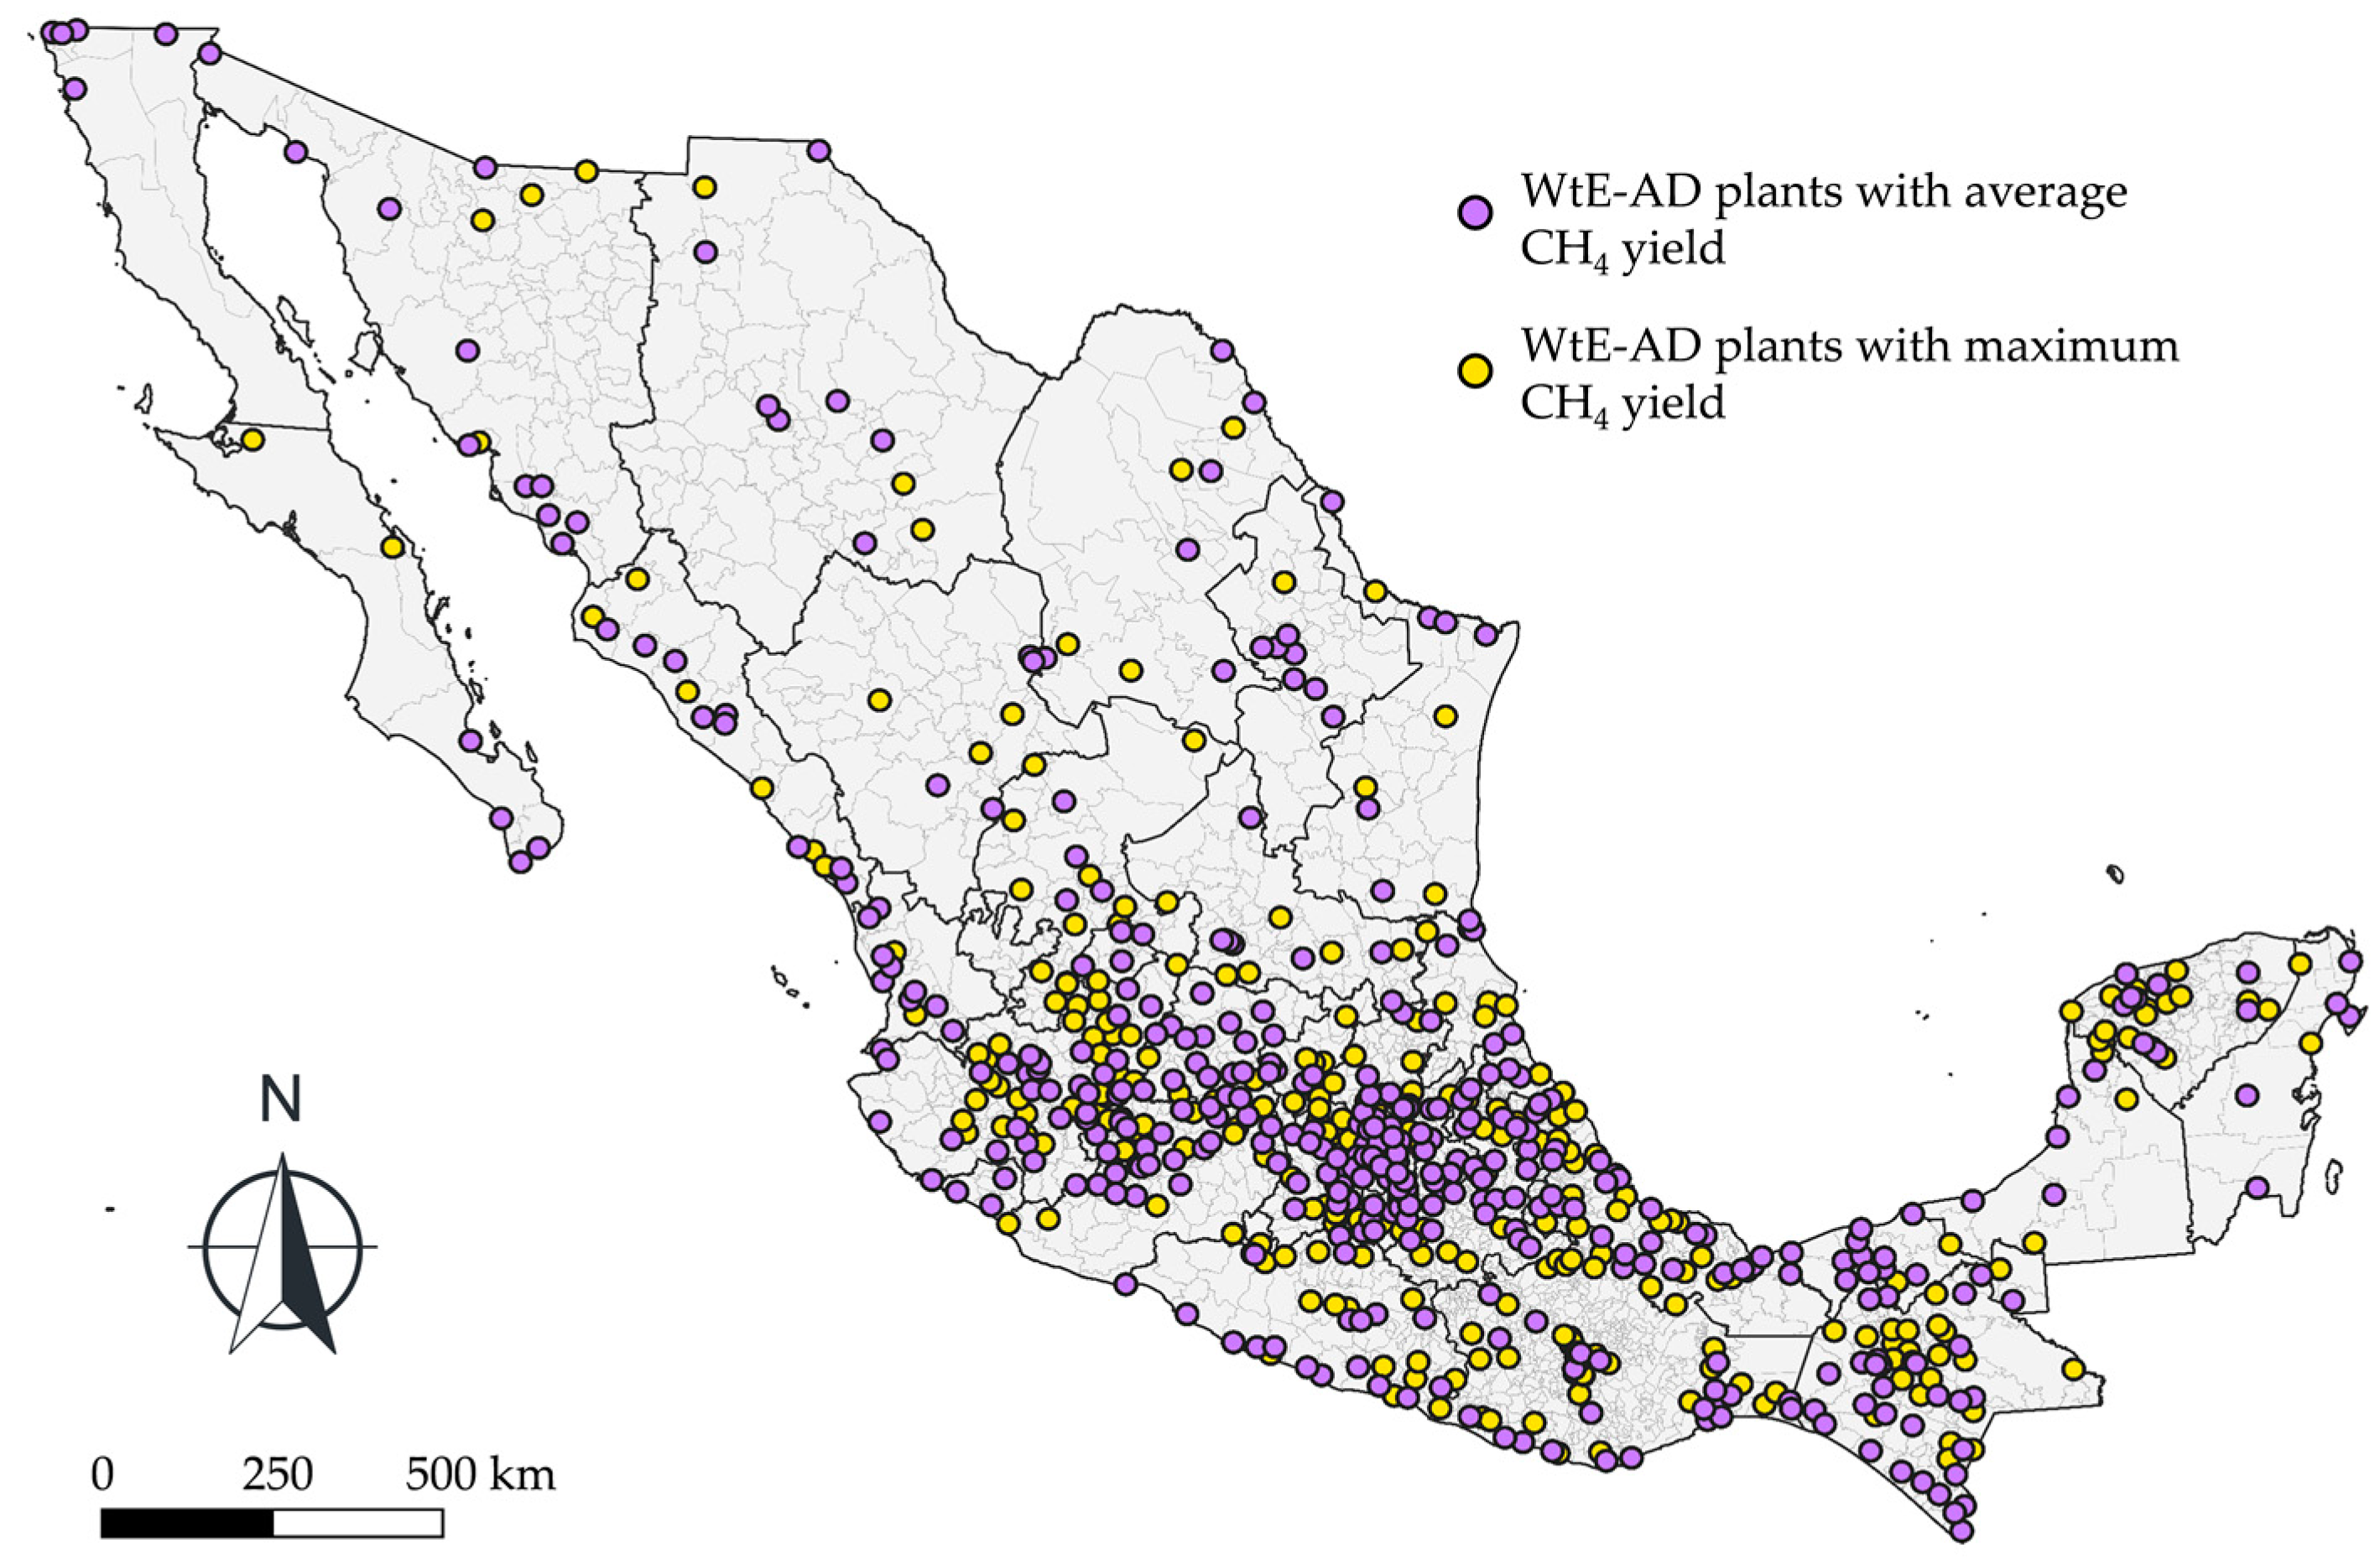
2.3. Methane Production and Energetic Feasibility Analysis

An extensive and robust literature review was conducted, compiling more than 70 scientific papers, to obtain the methane yields reported in the scientific literature for seven food categories: (i) fruits and vegetables, (ii) meats, (iii) milk and dairy products, (iv) fish and seafood, (v) eggs, (vi) seeds and pulses, and (vii) bread and pasta. Once the database was constructed, a statistical analysis was carried out by means of box-and-whisker graphs to analyze the results.
The net amount of energy produced by each WtE-AD plant in Mexico was quantified using Equation (5), where Eout,i corresponds to the amount of energy produced by WtE-AD plant i in kWh d−1 and is the product of its volumetric methane production in m3 d−1 (inside the parenthesis), the low heat value of methane in kWh m−3 (LHVCH4), and a heat and power cogeneration system efficiency (ηCHP) of 0.46 [25,27]. Mi corresponds to the FLW mass flow to plant i in t d−1, fi,j is the fraction of the food category “j” present in plant “i”, and YCH4i,j is the methane yield of food category “j” in m3 t−1 of volatile solids (VS).
E o u t , i = M i   j = 1 7 f i , j Y C H 4 , j L H V C H 4 η C H P   ,     i
To carry out an energetic feasibility analysis for the operation of WtE-AD plants in Mexico, the energy required for FLW transport operations to the plant was calculated. From the data from the national inventory of FLW generation in Mexico obtained by Albalate-Ramírez et al. [3], the total distance traveled (km) for the transport of waste was calculated for each WtE-AD plant.
Transportation distance quantification was conducted by calculating a geographical centroid for all food distribution and retail centers associated with WtE-AD plant “i”. Subsequently, based on the distance between the centroids and their respective plants, the total distance required by a waste collection truck with a capacity of 9 t of waste per trip was quantified. The considered truck has a diesel consumption rate of 0.26 L km−1 when fully loaded and 0.22 L km−1 when empty [40]. From this information, the total distance and diesel consumption necessary to transport the FLW to its respective WtE-AD plant were quantified. From Equation (6), the transport energy (Etransport,i) was calculated in kWh d−1, where Vdiesel,i is the total volume of diesel needed to transport the FLW, in m3, going to plant i, and LHVdiesel is the low heat value of diesel in kWh m−3.
E t r a n s p o r t , i = V d i e s e l ,   i L H V d i e s e l   ,     i
From Equations (1)–(4) and (6), the total amount of energy required for the operation of the WtE-AD plants (Ein,i) was obtained, which is the sum of all the energy requirements of the plants (Equation (7)). Subsequently, an energy quotient (Equotient,i) was quantified to obtain the energy profile of WtE-AD plants in Mexico, where values above unity represent plants with positive energy balances and lower values represent negative energy balances.
E i n ,   i = E t r a n s p o r t ,   i + E g r i n d e r ,   i + E h e a t ,   i + E s t i r r ,   i + E d r y e r ,   i   ,     i
E q u o t i e n t ,   i = E o u t ,   i E i n ,   i   ,     i

2.4. Sensitivity Analysis

The following sections will discuss how the energetic feasibility of WtE-AD processes is closely tied to the plant’s treatment capacity (TC). To ensure that FLW valorization processes are energetically competitive, two sensitivity analyses were conducted to comprehensively evaluate the impact of key variables on the energy balance and feasibility of WtE-AD plants.
The first analysis focused on assessing the effect of varying FLW methane yields on the plant’s energy balance (Equotient). This involved utilizing maximum and minimum methane yield values obtained from each food category, sourced from the comprehensive literature review (Section 2.2). Given the geographical and temporal variability in FLW characteristics, this analysis was crucial for understanding how these variations influence energy production and overall plant efficiency.
The second analysis addressed the impact of transportation distances on the energy profile of the WtE-AD process. Four plants demonstrating the highest energy performance were selected for this analysis. We systematically varied the average distances traveled by waste collection trucks to simulate different logistical scenarios. This investigation aimed to elucidate how transportation distances affect the energy efficiency of the plants, identifying critical thresholds that impact operational feasibility and energy output.
The results of these sensitivity analyses highlighted significant findings regarding the robustness of the WtE-AD system under diverse conditions. Variations in methane yields demonstrated pronounced effects on energy balances, with higher yields contributing to enhanced energy recovery. Similarly, changes in transportation distances revealed that shorter distances generally improve energy efficiency, whereas longer distances can diminish the overall plant performance due to increased logistical costs and energy consumption. These insights underscore the importance of optimizing both feedstock characteristics and logistical operations to maximize the sustainability and economic viability of WtE-AD plants.

3. Results and Discussion

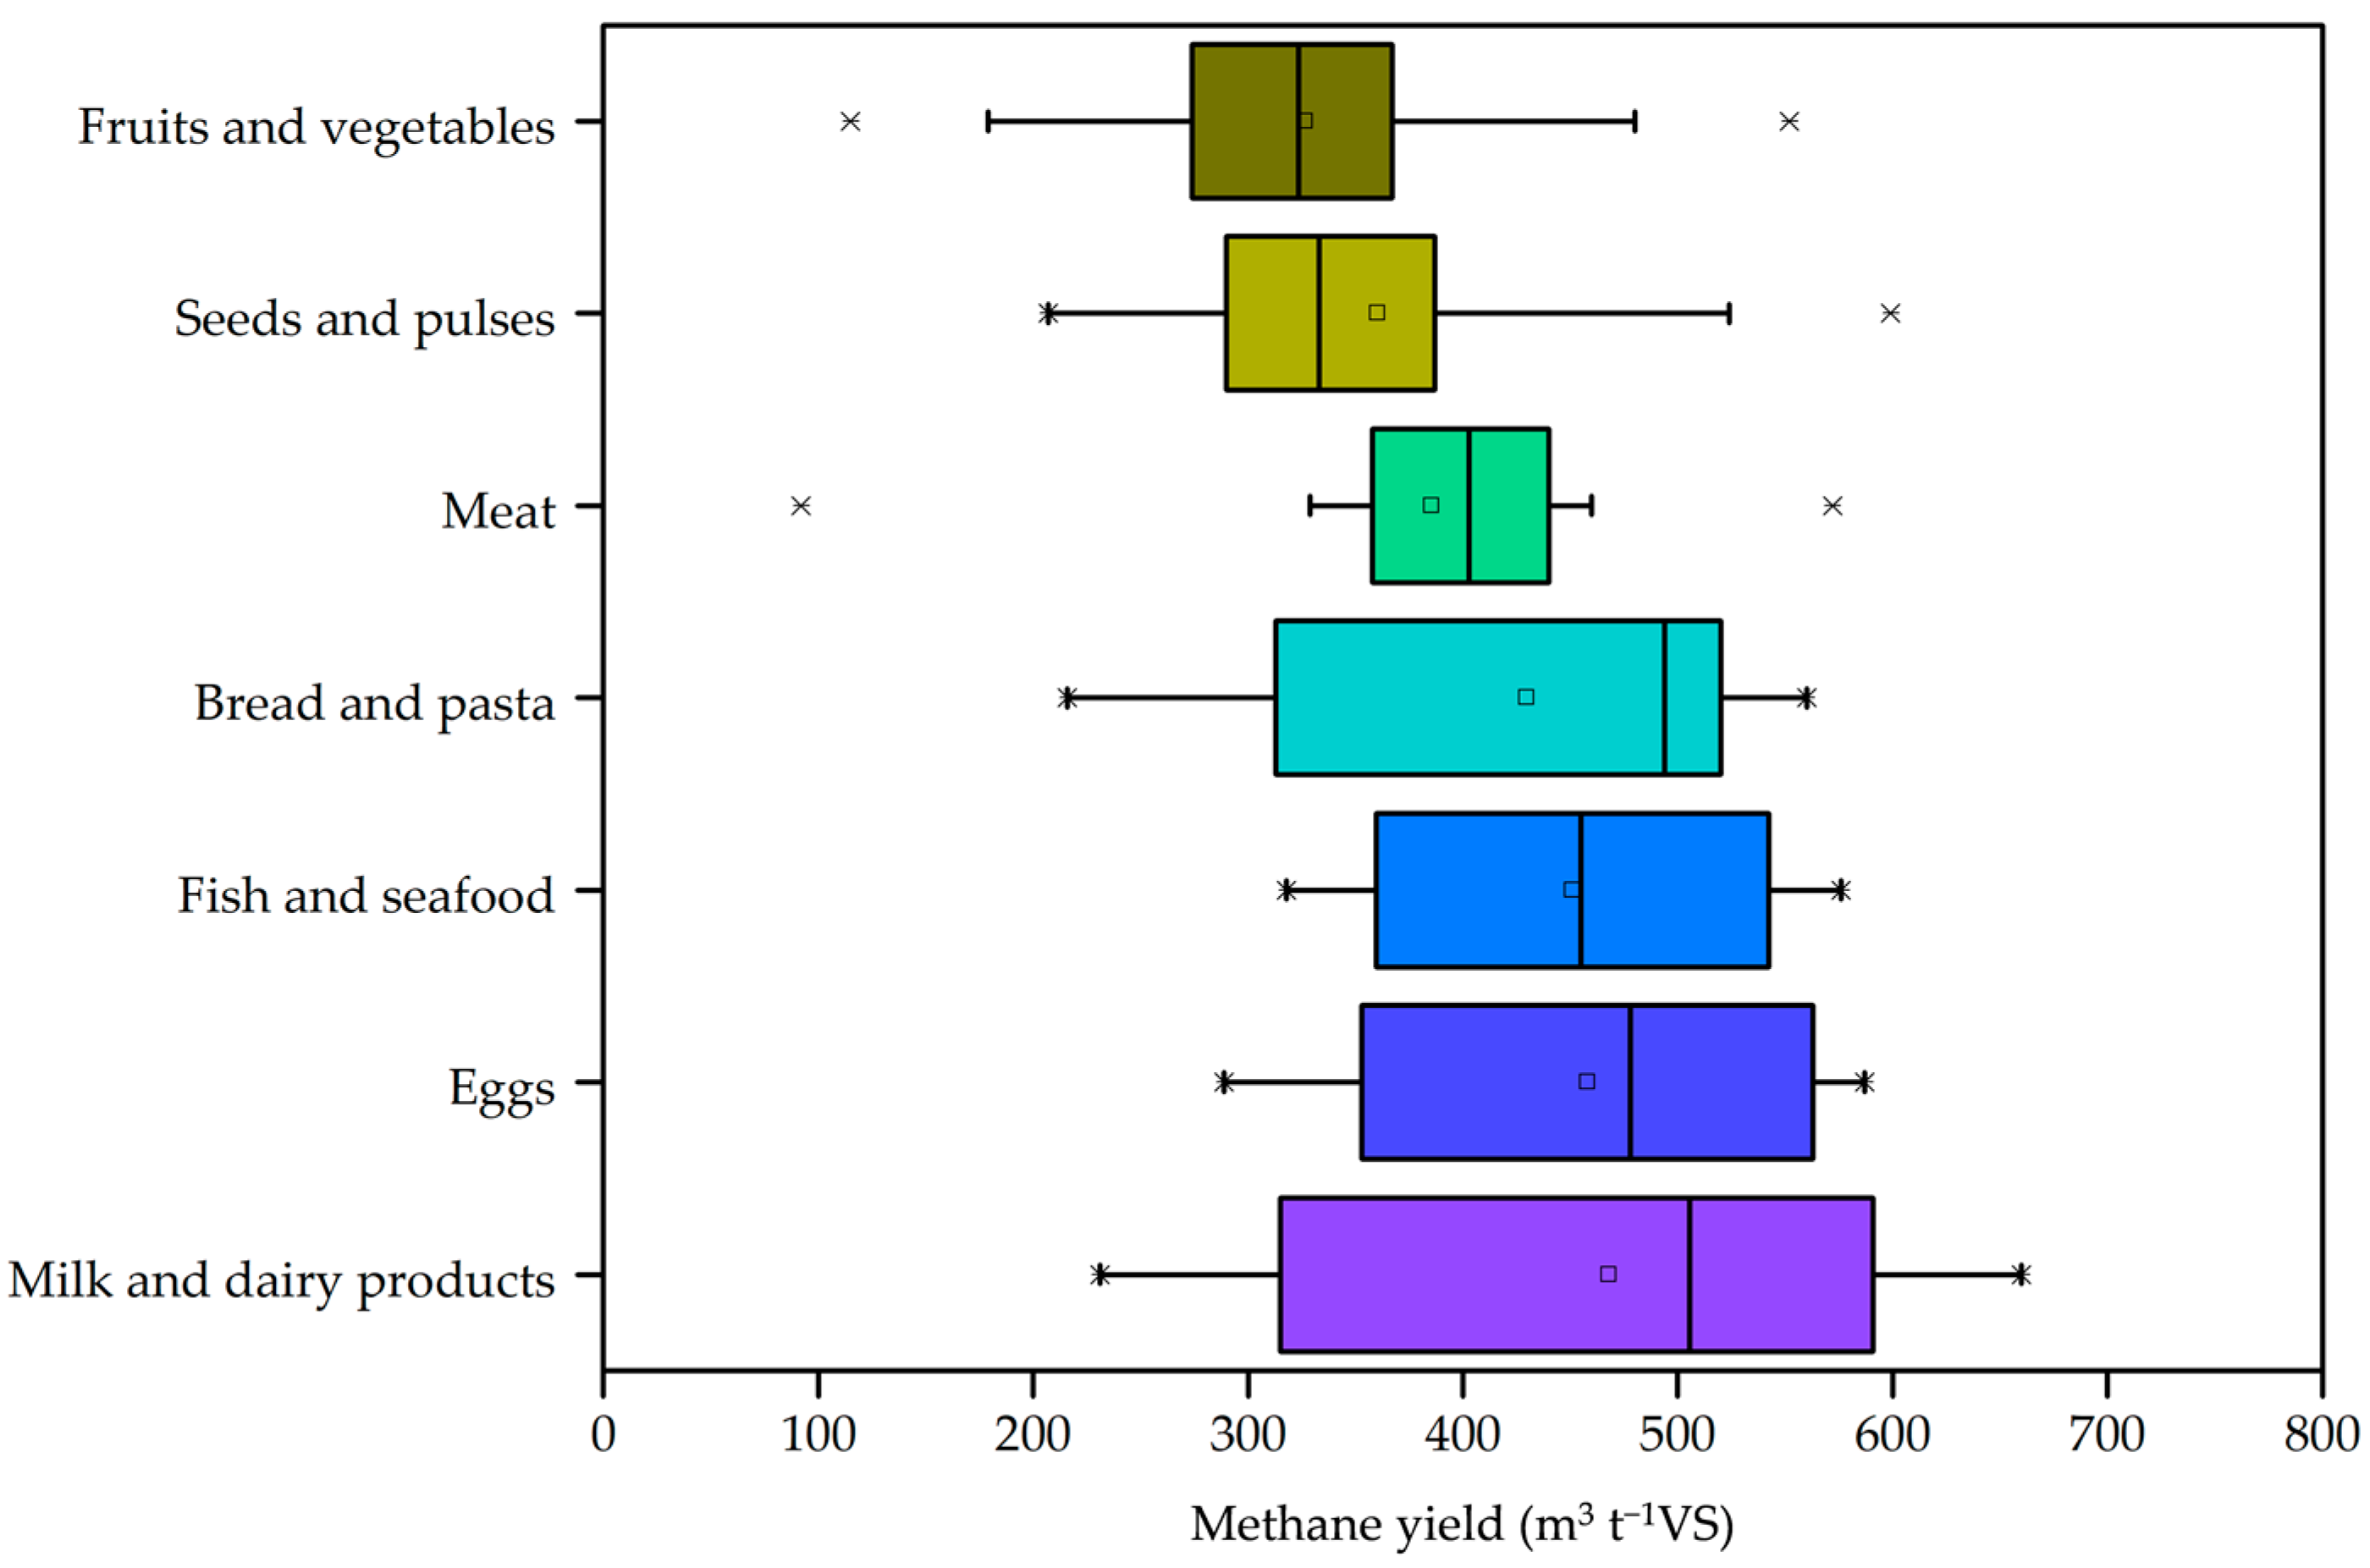
3.1. Statistical Analysis of Methane Yield of Food Categories

Figure 3 shows the results ranked from highest to lowest based on the average methane yields of the seven FLW categories. The highest methane yields occur with milk and dairy products, eggs, and fish and seafood wastes with 468, 458, and 452 m3 t−1 VS. This may be due to their large proportions of proteins and lipids. Miramontes-Martínez et al. [41] analyzed various substrate formulations in anaerobic digestion processes and found that the highest methane yields occur with formulations that have a balanced composition of carbohydrates, proteins, and lipids. Albalate-Ramírez et al. [42] analyzed the effect of the proportions of these macromolecules on methane yield and possible synergistic interactions in the substrate degradation process. The authors found that substrate formulations with higher ratios of protein to carbohydrates (~500 m3 t−1 VS) and protein to lipids (~470 m3 t−1 VS) generate the highest methane yields, as well as the strongest synergistic interactions in the substrate.
The lowest methane yields were found in fruit and vegetable and seed and pulse wastes, with 360 and 326 m3 t−1 VS. This may be due to their high contents of readily hydrolyzable carbohydrates [43], which leads to the rapid generation of volatile fatty acids and the possible acidification of the medium. Another important fact is that seed and pulse wastes contain high amounts of lipids, which leads to long-chain fatty acid accumulation in their anaerobic degradation, resulting in the inhibition of methane production [21].
The availability and composition of FLW substrates can fluctuate seasonally and geographically, affecting the consistency of methane yields. This variability necessitates adaptive management strategies in anaerobic digestion facilities, such as co-digestion with complementary substrates to maintain an optimal balance of carbohydrates, proteins, and lipids. Additionally, pre-treatment methods can be employed to enhance the biodegradability of substrates with lower methane potential.
Understanding and managing these variations is vital for maintaining high efficiency in methane production. By optimizing the substrate composition and employing adaptive strategies, biogas plants can ensure a more stable and competitive energy output, contributing significantly to sustainable energy goals and reducing reliance on fossil fuels. Thus, the study of methane yield variability not only informs better process management but also underpins the broader objective of achieving energy competitiveness through renewable resources.

3.2. Anaerobic Digestion Waste-to-Energy Process Simulation and Sensitivity Analysis for Energetic Improvement

The simulation results for the energy required to operate the WtE-AD plants per ton of FLW managed for five representative plants are shown in Figure 4. The results reveal that maintaining isothermal operating conditions in the process entails the highest energy expenditure per ton of waste, from 40 to 533 kWh t−1 of FLW in plants with TCs of 2536 t d−1 and 1 t d−1, respectively. In addition, plants with a TC less than 10 t d−1 have considerable energy expenditures in the agitation of the digester. Larger TC plants require a larger anaerobic digester, which means that the angular speed of agitators must be lower to ensure the same stirring conditions as smaller digesters. The energy expenditure in sludge drying and waste shredding unit operations also decreases with an increase in TC, from 42 to 13 kWh t−1 for sludge drying and 15 to 4 kWh t−1 for FLW shredding.
From the energy balances, the Equotient (Equation (8)) was quantified to evaluate the energetic feasibility of the WtE-AD plants. Figure 4 (secondary axis) shows that the plants follow an upward trend in the Equotient with an increase in the TC, meeting economy-of-scale criteria, which describes a reduction in energy costs per unit of production/treatment as the TC of a process increases [44]. The results indicate that WtE-AD plants that have a TC greater than 8 t FLW d−1 present an Equotient greater than or equal to the unit. This is of great relevance since it demonstrates that, in Mexico, only 476 WtE-AD plants have a favorable Equotient, and 69% present values lower than the unit due to a TC lower than 8 t FLW d−1. Table 1 provides a summary of the operating conditions and efficiencies of industrial methane production plants. The efficiencies reported for industrial technologies range between 170 and 580 m3 t−1 VS, which translates into 153–522 kWh t−1 of FLW. In Section 3.2, it is shown that the yields of WtE-AD plants proposed in this work have an efficiency between 280 and 390 kWh t−1, depending on the size of the plant and its respective mixture of FLW, demonstrating that they are competitive with existing technologies. One of the factors that can affect the energy efficiency of WtE-AD plants is the seasonal variation in FLW or a change in their availability. Exploring this area requires robust research for the models and statistical information, a venture that extends beyond the immediate scope of this work.
The implementation of WtE-AD plants may present several technological challenges and limitations. While small-scale plants may be easier to manage, scaling up to larger operations can introduce complexities related to ensuring a consistent feedstock supply and maintaining optimal anaerobic digestion conditions. Maintenance requirements are another critical factor, as WtE-AD systems necessitate regular upkeep to prevent downtime and ensure efficient operation. This includes monitoring and adjusting biological processes, handling mechanical wear and tear, and managing potential blockages or leaks. Technological robustness is also crucial, as the reliability and durability of the technology can vary under different operating conditions. Extreme temperatures, variations in feedstock composition, and fluctuations in biogas production can all impact system performance. Moreover, the availability of technical expertise for operation and maintenance is vital; skilled personnel are required to manage the intricate biological and mechanical processes involved in anaerobic digestion. Without adequate technical support, the risk of system failures and inefficiencies increases, potentially jeopardizing the sustainability and economic viability of WtE-AD plants. Addressing these technological challenges is essential for the successful and widespread adoption of WtE-AD technology.
In contrast to WtE-AD processes, one of the main recovery strategies for FLW that stands out in the scientific literature as a process with low energy requirements is composting. Both WtE-AD and composting are biological waste management methods that are plausible approaches to addressing this challenge by reusing organic waste and generating value-added products. AD can be economically more advantageous than composting, depending on the plant scale and the valorization of end products. AD may be favored for centralized treatment, whereas composting may be preferred for decentralized treatment, such as for on-farm animal manure. Environmentally, AD is favorable in terms of lower GHG emissions due to the production of biogas as a renewable energy source.
The results of the sensitivity analysis (Section 2.4) of the Equotient are presented in Figure 5, where the effect of the methane yields of the different food categories on the energy balance of WtE-AD plants can be observed. The results show that, by using the maximum values for the methane yields of the FLW categories, the Equotient of the processes increases to 157%. This increase in methane yield leads to a considerable increase in the number of plants in Mexico with an Equotient higher than the unit, from 476 to 698. The sensitivity analysis shows that this increase in methane yield decreases the minimum TC required to 3 t FLW d−1 for plants to have an Equotient higher than the unit. These results are of great relevance because they show the importance of the biochemical potential of the substrates in the management and valorization processes of FLW, as well as the urgent need to design systems with efficient methane production to ensure the energy competitiveness of plants.
Figure 6 illustrates the geographical distribution of WtE-AD plants with positive energy balances in Mexico, considering both the average and maximum methane yields from the statistical analysis. The south-central region of Mexico exhibits a higher density of plants with positive energy balances. In contrast, in the northern region, only plants located near large urban areas achieve energy competitiveness. This pattern can be attributed to the availability of FLW, as reported by Albalate-Ramírez et al. [9], who found that the south-central and west-central economic regions generate 66% of Mexico’s FLW, while the north and northeast contribute only 16%. The results further indicate that an increase in methane yield (a 157% increase in Equotient) enables the establishment of new WtE-AD plants with positive energy balances in the northern region of Mexico. This highlights the critical role of the methane yield in determining the feasibility and sustainability of WtE-AD plants. Efficient anaerobic digester operation is essential for ensuring energy competitiveness, especially in regions with limited FLW availability. Figure S3 in the Supplementary Material provides a map detailing the locations of the different economic regions of Mexico.
An aspect that may affect competitiveness is the transport distance, as it may compromise the overall feasibility of WtE-AD plants. Longer transport distances can diminish energy efficiency, making it challenging for plants in remote areas to maintain positive energy balances. Higher methane yields enhance energy recovery, while greater FLW availability ensures a consistent feedstock supply for the digesters. Under conditions of low methane yields or extensive transport distances, WtE-AD plants may become unfeasible due to reduced energy efficiency and increased operational costs. Therefore, the strategic placement and optimization of digester operations are crucial for maintaining the feasibility and sustainability of WtE-AD plants.
As mentioned in Section 2.4, a sensitivity analysis was performed to determine the effect of transportation distances on the energy profile of the WtE-AD plants. The results for the four plants with the highest TC are shown in Figure 7. An increase in the average distance between the FLW generation site and the WtE-AD plant significantly affects its energy balance. Plants with a large TC (e.g., 2537 t d−1) are less vulnerable to increased average transportation distances, maintaining positive energy balances up to average distances of ~320 km trip−1. Plants processing 537 t d−1 show negative energy balances at distances exceeding ~150 km trip−1. In contrast, some studies have used average transportation distances between 19 and 25 km per trip as a basis for life cycle analysis, which does not adequately reflect the geographical realities of waste generation and plant locations. For instance, Poliafico and Murphy [46] determined that an average transportation distance of 25 km for a centralized WtE-AD is crucial for positive economic revenue. On the other hand, Miramontes-Martínez et al. [27] and Lyng et al. [47] employed 20 and 19 km per trip for FLW valorization, respectively, as a base. These distances are practical assumptions but do not account for the variability in actual transportation logistics, particularly in regions with disparate urban and rural distributions, such as Mexico.
Our research underscores the importance of incorporating realistic transportation distances into energy models of WtE-AD plants. This approach not only provides a more accurate representation of the energy balance but also informs policymakers and stakeholders about the optimal placement and scaling of such facilities. By minimizing transportation distances and optimizing TC, it is possible to enhance the energy competitiveness of WtE-AD plants, thereby supporting a sustainable transition to a circular economy where FLW is efficiently converted into valuable energy resources. This can significantly reduce environmental impacts and improve resource efficiency, fostering a more sustainable food supply chain.
The implementation and success of WtE-AD plants are significantly influenced by regional policies, climate conditions, and socioeconomic factors. Regional policies that promote renewable energy, waste management, and environmental sustainability can provide essential support through subsidies, incentives, and regulatory frameworks, facilitating the establishment and operation of WtE-AD plants. Climate conditions also play a crucial role, as regions with warmer climates may enhance the anaerobic digestion process, leading to higher methane yields and more efficient energy recovery. Conversely, extreme weather conditions or seasonal variations might pose challenges to consistent plant operation. Socioeconomic factors, such as local economic development, community engagement, and public awareness, are equally important. Higher levels of economic development can ensure better infrastructure and technological support, while strong community engagement and awareness can drive effective waste segregation and collection practices, ensuring a steady supply of feedstock for the digesters. Additionally, socioeconomic disparities can impact the availability of financial resources and skilled labor, affecting the overall feasibility and sustainability of WtE-AD projects. Therefore, future studies that consider these regional policies, climate conditions, and socioeconomic factors are essential for the successful implementation of WtE-AD plants.
Given the significant impact of transportation distances and methane yields on the energy and economic feasibility of WtE-AD plants, the following recommendations are proposed for their implementation:
  • Prioritize the location of WtE-AD plants in proximity to sites with high FLW generation. The geographic distribution of FLW should guide the siting of new plants to minimize transportation distances and associated energy costs.
  • Encourage the development of larger WtE-AD plants with higher TCs, as these plants demonstrate better resilience to increased transportation distances and variability in methane yields. Provide subsidies, grants, or favorable policies to promote the scaling up of plant capacities.
  • Invest in infrastructure that supports efficient transportation logistics, such as improved road networks and centralized collection points, to reduce travel times and energy consumption in the transportation of FLW.
  • Implement regulatory frameworks and incentives that promote the efficient operation of WtE-AD plants, including requirements for energy-efficient technologies and processes that optimize methane yield and reduce energy consumption.
  • Develop regional strategies for waste management that consider the specific FLW generation profiles, transportation logistics, and methane yield potentials of different areas. This ensures a balanced and efficient network of WtE-AD plants across the country.
  • Support research and development initiatives focused on enhancing methane yields from various FLW categories through pre-treatment technologies or co-digestion strategies.

3.3. Prospects and Limitations

The analysis of WtE-AD plants in Mexico for the valorization of FLW presents notable prospects alongside several limitations. A significant challenge is the inherent uncertainty in the geographic analysis, which can impact the precision of plant localization and waste quantification. GIS tools provide valuable insights, but the accuracy of input data, such as FLW generation rates and transportation distances, is crucial. Inaccurate or outdated data can lead to suboptimal plant locations and the misestimation of energy production capacities. Additionally, regional variations in data availability and quality further complicate the reliability of geographic analyses. Addressing these uncertainties requires continuous data updating and validation efforts to enhance the robustness of the geographic component of WtE-AD feasibility studies.
Temporal variations in FLW availability are another critical factor influencing the performance and sustainability of WtE-AD plants. Seasonal fluctuations in food production, consumption, and waste generation patterns can lead to inconsistent feedstock supply, impacting the continuous operation of anaerobic digesters. Variability in the composition of FLW, driven by seasonal changes, can also affect the methane yield and overall energy efficiency of the plants. Understanding and managing these temporal dynamics is essential for optimizing the operational stability and energy output of WtE-AD systems. Future research should focus on developing predictive models that account for seasonal variations and implementing flexible operational strategies to mitigate the effects of feedstock variability.
An additional consideration is the utilization of the by-products of the WtE-AD process, particularly the digestate. The digestate can be commercialized as a biofertilizer, providing a valuable nutrient-rich product for agricultural applications. Its market value lies in its ability to enhance soil fertility and structure, offering an eco-friendly alternative to chemical fertilizers. However, the quality and safety of the digestate must be rigorously analyzed to ensure that it meets regulatory standards and does not pose environmental or health risks. Potential markets for biofertilizers include organic farming and sustainable agriculture sectors, which are increasingly seeking sustainable inputs. To capitalize on these opportunities, it is crucial to navigate regulatory and certification requirements, ensuring the digestate is certified for use as a biofertilizer. Promoting the use of the digestate not only adds economic value to the WtE-AD process but also contributes to sustainable agricultural practices and closes the nutrient loop, reinforcing the circular economy.
Public perception and acceptance of WtE-AD technologies are also critical factors for the successful implementation of these projects. Social factors, including public awareness and attitudes toward renewable energy and waste management, can significantly influence the adoption of and support for WtE-AD plants. To enhance public acceptance, it is essential to implement comprehensive public awareness and education campaigns that highlight the environmental and economic benefits of WtE-AD technologies. Engaging with communities through transparent communication, public consultations, and participatory decision-making processes can build trust and support for these initiatives. Addressing any concerns and misconceptions about the safety, odor, and environmental impact of WtE-AD plants is crucial. Community engagement strategies that involve local stakeholders in the planning and operation of WtE-AD projects can foster a sense of ownership and positive perception, thereby increasing the likelihood of successful implementation.
The policy implications of these findings are significant and warrant thorough consideration. The results of this study can inform both national and local waste management policies, promoting the adoption of WtE-AD technologies. Specific policies that could support the implementation of WtE-AD plants include renewable energy credits, which would incentivize the production of biogas as a renewable energy source. Waste disposal regulations can be tailored to encourage the diversion of FLW from landfills to anaerobic digestion facilities, thereby reducing methane emissions from landfills and promoting sustainable waste management practices. Additionally, financial incentives and subsidies for sustainable waste management practices can lower the economic barriers to establishing and operating WtE-AD plants. By integrating these policies, governments can facilitate the transition to a more sustainable and circular economy, leveraging the benefits of anaerobic digestion to address both energy and waste management challenges.
To further improve the feasibility and efficiency of WtE-AD plants, future work should focus on several key areas. Enhanced data collection and integration techniques, including real-time monitoring and advanced data analytics, can improve the accuracy of geographic and temporal assessments. Additionally, exploring the potential of co-digestion with other organic waste streams, such as agricultural residues or municipal solid waste, can increase feedstock availability and improve biogas production. Technological advancements in anaerobic digestion processes, such as improved reactor designs and novel microbial consortia, can enhance methane yields and energy recovery. Comprehensive life cycle assessments and economic analyses are necessary to evaluate the long-term sustainability and financial viability of WtE-AD plants. These efforts will contribute to the development of robust, efficient, and economically competitive waste-to-energy solutions in Mexico and Latin America.

4. Conclusions

This study offers a detailed examination of the energetic feasibility of implementing waste-to-energy anaerobic digestion (WtE-AD) plants for the valorization of food loss and waste (FLW) in Mexico. Through a rigorous technical and methodological approach, the potential transition from final disposal sites to WtE-AD plants, focusing on energy production and consumption at each stage of the process, was studied. The results demonstrate that WtE-AD plants can significantly contribute to clean energy production. Notably, the study revealed that an increase in treatment capacity (TC) from 50 to 200 t FLW d−1 could reduce energy costs per ton of processed FLW by 40%. Additionally, methane generation reached an average of 400 m3 t−1 FLW, translating into substantial energy outputs. Despite the energy costs associated with transportation, our findings indicate that plants with larger TC maintain a positive energy balance, even over distances exceeding 50 km. This highlights the importance of optimizing treatment capacity and transportation logistics to enhance energy efficiency.
The findings underscore the critical role of TC and transportation logistics in the energy efficiency of WtE-AD plants for FLW valorization. By maximizing TC and minimizing transportation distances, it is possible to achieve a sustainable transformation of Mexico’s food supply chain toward a circular economy. This shift can effectively convert FLW into valuable energy resources, thereby reducing greenhouse gas emissions, improving energy efficiency, and providing economic benefits through energy production and by-product utilization. Policymakers and stakeholders should consider these insights when developing strategies and policies for FLW management and energy production.
Future research should focus on optimizing the WtE-AD process and assessing its long-term sustainability. Specific areas needing further investigation include the integration of life cycle approaches and cost engineering methodologies to provide a comprehensive evaluation of these technologies. Additionally, exploring regional variations in FLW generation and management could yield valuable insights for tailoring WtE-AD implementations to specific local contexts. Continued research is essential to refine and improve WtE-AD technologies and understand their broader environmental, economic, and social impacts.
The authors embrace the limitations of this study and acknowledge that they should be addressed in future research. The accuracy of data, the scalability of pilot plant results to full-scale operations, and the generalizability of findings to other regions are key areas of concern. These limitations may have impacted our results, and future studies should aim to mitigate these uncertainties. For instance, improving data accuracy through more extensive field measurements and pilot projects could enhance the reliability of results. Additionally, assessing the scalability of WtE-AD processes and their applicability in diverse geographical regions will be crucial for broader implementation.
This initial scientific paper of a “two-part” study provides a foundation for exploring the conditions necessary for WtE-AD processes to achieve sustainability in techno-economic and environmental terms. The insights gained from this study are crucial for informing policies and practices related to FLW management and the transition to a circular economy in Mexico. By addressing the identified research gaps and building on our findings, future studies can further advance the field, ultimately contributing to more sustainable and efficient FLW valorization strategies.

Supplementary Materials

The following supporting information can be downloaded at https://www.mdpi.com/article/10.3390/su16146111/s1, Table S1: Parameters used for mathematical modeling of digesters’ heating operation. Table S2: Parameters used for the mathematical modeling of digesters’ stirring operation. Equation S1: Agitation scale-up. Figure S1: Regression model for food loss and waste shredding, considering an industrial blade food shredder. Data obtained from technical sheets of equipment providers. Figure S2: Regression model for sludge drying, considering an industrial rotatory drum-type sludge dryer. Data obtained from technical sheets of equipment providers. Figure S3: An illustrative map of the eight Mexican economic regions. References [48,49,50,51,52,53,54] are cited in Supplementary Materials.

Author Contributions

Conceptualization: A.A.-R. and P.R.-G.; methodology: A.A.-R., B.N.L.-H. and P.R.-G.; software: A.A.-R. and P.R.-G.; validation: P.R.-G., J.F.R.-A., A.P.-R. and J.J.C.-G.; formal analysis: A.A.-R., P.R.-G. and A.P.-R.; writing: A.A.-R., A.P.-R. and P.R.-G.; review and editing: A.P.-R. and B.N.L.-H.; visualization: A.A.-R. and B.N.L.-H. All authors have read and agreed to the published version of the manuscript.

Funding

This research received no external funding.

Institutional Review Board Statement

This is not applicable to this study; no ethical approval was required to carry out this research.

Informed Consent Statement

Not applicable.

Data Availability Statement

All information is included in the paper or Supplementary Materials.

Conflicts of Interest

The authors declare no conflicts of interest.

Nomenclature

Acronyms
ADAnaerobic digestion
CHPHeat and power cogeneration system
FDSFinal disposal site
FLWFood loss and waste
FSCFood supply chain
GHGGreenhouse gas
GISGeographic information system
LHVLow heating value
TCTreatment capacity
VSVolatile solids
WtE-ADWaste-to-energy anaerobic digestion
Equation variables and parameters
CpmixSpecific heat capacity
EiEnergy expense of unit operation “i
Ein,iTotal energy expense in plant “i
Eout,iEnergy production of WtE-AD plant “i
Equotient,iEnergy quotient of plant “i
Etransport,iTransportation energy needed in plant “i
fiFraction of food category “j” present in plant “i
MiFood loss and waste mass flow to plant “i
T0Initial temperature
ToutAmbient temperature
TrOperating temperature
Vdiesel,iDiesel consumption for plant “i
YCH4i,jMethane yield of food category “j

References

  1. Economía, S. De Data México—Industria Alimentaria. Available online: https://www.economia.gob.mx/datamexico/es/profile/industry/branches-grouped-by-the-principle-of-confidentiality-212C?redirect=true (accessed on 17 June 2024).
  2. Commission for Environmental Cooperation. Characterization and Management of Food Loss and Waste in North America; CEC: Montreal, QC, Canada, 2017; ISBN 978-2-89700-230-5. [Google Scholar]
  3. López-Sánchez, A.; Luque-Badillo, A.C.; Orozco-Nunnelly, D.; Alencastro-Larios, N.S.; Ruiz-Gómez, J.A.; García-Cayuela, T.; Gradilla-Hernández, M.S. Food Loss in the Agricultural Sector of a Developing Country: Transitioning to a More Sustainable Approach. The Case of Jalisco, Mexico. Environ. Chall. 2021, 5, 100327. [Google Scholar] [CrossRef]
  4. Kim, M.H.; Song, H.B.; Song, Y.; Jeong, I.T.; Kim, J.W. Evaluation of Food Waste Disposal Options in Terms of Global Warming and Energy Recovery: Korea. Int. J. Energy Environ. Eng. 2013, 4, 1. [Google Scholar] [CrossRef]
  5. Kim, M.H.; Kim, J.W. Comparison through a LCA Evaluation Analysis of Food Waste Disposal Options from the Perspective of Global Warming and Resource Recovery. Sci. Total Environ. 2010, 408, 3998–4006. [Google Scholar] [CrossRef]
  6. Moult, J.A.; Allan, S.R.; Hewitt, C.N.; Berners-Lee, M. Greenhouse Gas Emissions of Food Waste Disposal Options for UK Retailers. Food Policy 2018, 77, 50–58. [Google Scholar] [CrossRef]
  7. Levis, J.W.; Barlaz, M.A. What Is the Most Environmentally Beneficial Way to Treat Commercial Food Waste? Environ. Sci. Technol. 2011, 45, 7438–7444. [Google Scholar] [CrossRef] [PubMed]
  8. Tsydenova, N.; Morillas, A.V.; Hernández, Á.M.; Soria, D.R.; Wilches, C.; Pehlken, A. Feasibility and Barriers for Anaerobic Digestion in Mexico City. Sustainability 2019, 11, 4114. [Google Scholar] [CrossRef]
  9. Albalate-Ramírez, A.; Rueda-Avellaneda, J.F.; López-Hernández, B.N.; Alcalá-Rodríguez, M.M.; García-Balandrán, E.E.; Evrard, D.; Rivas-García, P. Geographic Life Cycle Assessment of Food Loss and Waste Management in Mexico: The Reality of Distribution and Retail Centers. Sustain. Prod. Consum. 2024, 48, 289–300. [Google Scholar] [CrossRef]
  10. Secretaría de Economía. Primer Censo Nacional de Centrales de Abasto En México. 2012. Available online: http://www.protlcuem.gob.mx/work/models/Prologyca/Resource/2/1/images/DirectorioNacionaldeCentralesdeAbasto.pdf (accessed on 17 June 2024).
  11. CCA. Central de Abasto de La Ciudad de México (CEDA): Comprensión de La Pérdida y El Desperdicio de Alimentos En El Mercado Más Grande Del Mundo; CCA: Ciudad de México, Mexico, 2021. [Google Scholar]
  12. Velenturf, A.P.M.; Purnell, P. Principles for a Sustainable Circular Economy. Sustain. Prod. Consum. 2021, 27, 1437–1457. [Google Scholar] [CrossRef]
  13. Moset, V.; Poulsen, M.; Wahid, R.; Højberg, O.; Møller, H.B. Mesophilic versus Thermophilic Anaerobic Digestion of Cattle Manure: Methane Productivity and Microbial Ecology. Microb. Biotechnol. 2015, 8, 787–800. [Google Scholar] [CrossRef]
  14. Montecchio, D.; Gallipoli, A.; Gianico, A.; Mininni, G.; Pagliaccia, P.; Braguglia, C.M. Biomethane Potential of Food Waste: Modeling the Effects of Mild Thermal Pretreatment and Digestion Temperature. Environ. Technol. 2017, 38, 1452–1464. [Google Scholar] [CrossRef]
  15. Xue, S.; Wang, Y.; Lyu, X.; Zhao, N.; Song, J.; Wang, X.; Yang, G. Interactive Effects of Carbohydrate, Lipid, Protein Composition and Carbon/Nitrogen Ratio on Biogas Production of Different Food Wastes. Bioresour. Technol. 2020, 312, 123566. [Google Scholar] [CrossRef] [PubMed]
  16. David, A.; Govil, T.; Tripathi, A.K.; McGeary, J.; Farrar, K.; Sani, R.K. Thermophilic Anaerobic Digestion: Enhanced and Sustainable Methane Production from Co-Digestion of Food and Lignocellulosic Wastes. Energies 2018, 11, 2058. [Google Scholar] [CrossRef]
  17. Capson-Tojo, G.; Rouez, M.; Crest, M.; Steyer, J.P.; Delgenès, J.P.; Escudié, R. Food Waste Valorization via Anaerobic Processes: A Review. Rev. Environ. Sci. Biotechnol. 2016, 15, 499–547. [Google Scholar] [CrossRef]
  18. Marañón, E.; Negral, L.; Suárez-Peña, B.; Fernández-Nava, Y.; Ormaechea, P.; Díaz-Caneja, P.; Castrillón, L. Evaluation of the Methane Potential and Kinetics of Supermarket Food Waste. Waste Biomass Valorization 2021, 12, 1829–1843. [Google Scholar] [CrossRef]
  19. de Jonge, N.; Davidsson, Å.; la Cour Jansen, J.; Nielsen, J.L. Characterisation of Microbial Communities for Improved Management of Anaerobic Digestion of Food Waste. Waste Manag. 2020, 117, 124–135. [Google Scholar] [CrossRef]
  20. Komemoto, K.; Lim, Y.G.; Nagao, N.; Onoue, Y.; Niwa, C.; Toda, T. Effect of Temperature on VFA’s and Biogas Production in Anaerobic Solubilization of Food Waste. Waste Manag. 2009, 29, 2950–2955. [Google Scholar] [CrossRef] [PubMed]
  21. Ebner, J.H.; Labatut, R.A.; Lodge, J.S.; Williamson, A.A.; Trabold, T.A. Anaerobic Co-Digestion of Commercial Food Waste and Dairy Manure: Characterizing Biochemical Parameters and Synergistic Effects. Waste Manag. 2016, 52, 286–294. [Google Scholar] [CrossRef] [PubMed]
  22. Carlsson, M.; Naroznova, I.; Moller, J.; Scheutz, C.; Lagerkvist, A. Importance of Food Waste Pre-Treatment Efficiency for Global Warming Potential in Life Cycle Assessment of Anaerobic Digestion Systems. Resour. Conserv. Recycl. 2015, 102, 58–66. [Google Scholar] [CrossRef]
  23. Batstone, D.; Keller, J.; Angelidaki, I.; Kalyuzhnyi, S.V.; Pavlostathis, S.G.; Rozzi, A.; Sanders, W.T.M.; Siegrist, H.; Vavilin, V.A. The IWA Anaerobic Digestion Model No 1(ADM1). Water Sci. Technol. 2002, 45, 65–73. [Google Scholar] [CrossRef]
  24. Jin, Y.; Chen, T.; Chen, X.; Yu, Z. Life-Cycle Assessment of Energy Consumption and Environmental Impact of an Integrated Food Waste-Based Biogas Plant. Appl. Energy 2015, 151, 227–236. [Google Scholar] [CrossRef]
  25. Albalate-Ramírez, A.; Alcalá-Rodríguez, M.M.; Miramontes-Martínez, L.R.; Padilla-Rivera, A.; Estrada-Baltazar, A.; López-Hernández, B.N.; Rivas-García, P. Energy Production from Cattle Manure within a Life Cycle Assessment Framework: Statistical Optimization of Co-Digestion, Pretreatment, and Thermal Conditions. Sustainability 2022, 14, 16945. [Google Scholar] [CrossRef]
  26. Brenes-Peralta, L.; Jiménez-Morales, M.F.; Campos-Rodríguez, R.; De Menna, F.; Vittuari, M. Decision-Making Process in the Circular Economy: A Case Study on University Food Waste-to-Energy Actions in Latin America. Energies 2020, 13, 2291. [Google Scholar] [CrossRef]
  27. Miramontes-Martínez, L.R.; Rivas-García, P.; Briones-Cristerna, R.A.; Abel-Seabra, J.E.; Padilla-Rivera, A.; Botello-Álvarez, J.E.; Alcalá-Rodríguez, M.M.; Levasseur, A. Potential of Electricity Generation by Organic Wastes in Latin America: A Techno-Economic-Environmental Analysis. Biomass Convers. Biorefinery 2022. [Google Scholar] [CrossRef]
  28. Selvaggi, R.; Valenti, F.; Pecorino, B.; Porto, S.M.C. Assessment of Tomato Peels Suitable for Producing Biomethane within the Context of Circular Economy: A Gis-Based Model Analysis. Sustainability 2021, 13, 5559. [Google Scholar] [CrossRef]
  29. Quintero-Herrera, S.; Zwolinski, P.; Evrard, D.; Cano-Gómez, J.J.; Rivas-García, P. Turning Food Loss and Waste into Animal Feed: A Mexican Spatial Inventory of Potential Generation of Agro-Industrial Wastes for Livestock Feed. Sustain. Prod. Consum. 2023, 41, 36–48. [Google Scholar] [CrossRef]
  30. Faustine, L.; Thierry, B.; Fabrice, B.; Lynda, A. Systemic Approach of Collective Biogas Plants on a Territory Using Geographic Information Systems (GIS) to Move towards an Environmental Assessment. Network on Recycling of Agricultural Municipal and Industrial Residues in Agriculture. 2013. Available online: http://ramiran.uvlf.sk/doc13/Proceeding_2013/documents/S10.09..pdf (accessed on 17 June 2024).
  31. Roostaei, J.; Zhang, Y. Spatially Explicit Life Cycle Assessment: Opportunities and Challenges of Wastewater-Based Algal Biofuels in the United States. Algal Res. 2017, 24, 395–402. [Google Scholar] [CrossRef]
  32. Liu, K.F.-R.; Hung, M.-J.; Yeh, P.-C.; Kuo, J.-Y. GIS-Based Regionalization of LCA. J. Geosci. Environ. Prot. 2014, 2, 1–8. [Google Scholar] [CrossRef]
  33. García-Pérez, S.; Sierra-Pérez, J.; Boschmonart-Rives, J.; Lladó Morales, G.; Romero Calix, A. A Characterisation and Evaluation of Urban Areas from an Energy Efficiency Approach, Using Geographic Information Systems in Combination with Life Cycle Assessment Methodology. Int. J. Sustain. Dev. Plan. 2017, 12, 294–303. [Google Scholar] [CrossRef]
  34. Senán-Salinas, J.; Blanco, A.; García-Pacheco, R.; Landaburu-Aguirre, J.; García-Calvo, E. Prospective Life Cycle Assessment and Economic Analysis of Direct Recycling of End-of-Life Reverse Osmosis Membranes Based on Geographic Information Systems. J. Clean. Prod. 2021, 282, 124400. [Google Scholar] [CrossRef]
  35. Zea Escamilla, E.; Habert, G. Method and Application of Characterisation of Life Cycle Impact Data of Construction Materials Using Geographic Information Systems. Int. J. Life Cycle Assess. 2017, 22, 1210–1219. [Google Scholar] [CrossRef]
  36. Loiseau, E.; Aissani, L.; Le Féon, S.; Laurent, F.; Cerceau, J.; Sala, S.; Roux, P. Territorial Life Cycle Assessment (LCA): What Exactly Is It about? A Proposal towards Using a Common Terminology and a Research Agenda. J. Clean. Prod. 2018, 176, 474–485. [Google Scholar] [CrossRef]
  37. Abotalib, M.; Zhao, F.; Clarens, A. Deployment of a Geographical Information System Life Cycle Assessment Integrated Framework for Exploring the Opportunities and Challenges of Enhanced Oil Recovery Using Industrial CO2 Supply in the United States. ACS Sustain. Chem. Eng. 2016, 4, 4743–4751. [Google Scholar] [CrossRef]
  38. Rueda-Avellaneda, J.F.; Rivas-García, P.; Gomez-Gonzalez, R.; Benitez-Bravo, R.; Botello-Álvarez, J.E.; Tututi-Avila, S. Current and Prospective Situation of Municipal Solid Waste Final Disposal in Mexico: A Spatio-Temporal Evaluation. Renew. Sustain. Energy Transit. 2021, 1, 100007. [Google Scholar] [CrossRef]
  39. Piccinno, F.; Hischier, R.; Seeger, S.; Som, C. Predicting the Environmental Impact of a Future Nanocellulose Production at Industrial Scale: Application of the Life Cycle Assessment Scale-up Framework. J. Clean. Prod. 2018, 174, 283–295. [Google Scholar] [CrossRef]
  40. Benitez-Bravo, R.; Gomez-González, R.; Rivas-García, P.; Botello-Álvarez, J.E.; Huerta-Guevara, O.F.; García-León, A.M.; Rueda-Avellaneda, J.F. Optimization of Municipal Solid Waste Collection Routes in a Latin-American Context. J. Air Waste Manag. Assoc. 2021, 71, 1415–1427. [Google Scholar] [CrossRef]
  41. Miramontes-Martínez, L.R.; Rivas-García, P.; Albalate-Ramírez, A.; Botello-Álvarez, J.E.; Escamilla-Alvarado, C.; Gomez-Gonzalez, R.; Alcalá-Rodríguez, M.M.; Valencia-Vázquez, R.; Santos-López, I.A. Anaerobic Co-Digestion of Fruit and Vegetable Waste: Synergy and Process Stability Analysis. J. Air Waste Manag. Assoc. 2021, 00, 1–13. [Google Scholar] [CrossRef]
  42. Albalate-Ramírez, A.; Alcalá-Rodríguez, M.M.; Miramontes-Martínez, L.R.; Galván-Arzola, U.; López-Hernández, B.N.; Morones-Ramírez, J.R.; Rivas-García, P. The Importance of Substrate Formulation on the Hydrolysis Process in Anaerobic Digestion: A Numerical and Experimental Study. Rev. Mex. Ing. Química 2023, 22, 1–10. [Google Scholar] [CrossRef]
  43. Astals, S.; Batstone, D.J.; Mata-Alvarez, J.; Jensen, P.D. Identification of Synergistic Impacts during Anaerobic Co-Digestion of Organic Wastes. Bioresour. Technol. 2014, 169, 421–427. [Google Scholar] [CrossRef] [PubMed]
  44. Angulo, N.R.; Lagarda, A.M.; Urquidy, M.R.; Flores, M.T. Economías de Escala y Rendimientos Crecientes Una Aplicación En Microempresas Mexicanas. Econ. Mex. 2009, 19, 213–230. [Google Scholar]
  45. Le Pera, A.; Sellaro, M.; Migliori, M.; Bianco, M.; Zanardi, G. Dry Mesophilic Anaerobic Digestion of Separately Collected Organic Fraction of Municipal Solid Waste: Two-Year Experience in an Industrial-Scale Plant. Processes 2021, 9, 213. [Google Scholar] [CrossRef]
  46. Poliafico, M.; Murphy, J.D. Anaerobic Digestion in Ireland: Decision Support System, Department of Civil, Structural and Environmental Engineering; Cork Institute of Technology: Cork, Ireland, 2007. [Google Scholar]
  47. Lyng, K.-A.; Modahl, I.S.; Møller, H.; Saxegård, S. Comparison of Results from Life Cycle Assessment When Using Predicted and Real-Life Data for an Anaerobic Digestion Plant. J. Sustain. Dev. Energy Water Environ. Syst. 2021, 9, 1–14. [Google Scholar] [CrossRef]
  48. Li, Z.; Lu, H.; Zhang, Z.; Liu, B. Study on Scale-Up of Anaerobic Fermentation Mixing with Different Solid Content. Fermentation 2023, 9, 375. [Google Scholar] [CrossRef]
  49. Available online: https://www.alibaba.com/product-detail/Twin-Shaft-Shredding-Machine-Industrial-Cardboard_1600958572715.html?spm=a2700.galleryofferlist.p_offer.d_title.b2467f0cCgx3aG&s=p (accessed on 17 June 2024).
  50. Available online: https://www.alibaba.com/product-detail/Double-Shaft-Waste-Shredder-Blade-Shredder_1600987906528.html?spm=a2700.galleryofferlist.p_offer.d_title.b2467f0cCgx3aG&s=p (accessed on 17 June 2024).
  51. Available online: https://www.alibaba.com/product-detail/Metal-Shredder-Mini-Double-Shaft-Shredder_1600520129917.html?spm=a2700.galleryofferlist.p_offer.d_title.b2467f0cCgx3aG&s=p (accessed on 17 June 2024).
  52. Available online: https://www.alibaba.com/product-detail/8-tons-hour-industrial-twin-shaft_1600858896447.html?spm=a2700.galleryofferlist.normal_offer.d_title.b2467f0cCgx3aG (accessed on 17 June 2024).
  53. Available online: https://www.alibaba.com/product-detail/Industrial-vegetable-cutter-electric-vegetable-slicer_1600095330756.html?spm=a2700.galleryofferlist.normal_offer.d_title.b2467f0cCgx3aG (accessed on 17 June 2024).
  54. Available online: https://www.alibaba.com/product-detail/High-efficiency-metal-shredder-machine-for_1601038401804.html?spm=a2700.galleryofferlist.normal_offer.d_title.b2467f0cCgx3aG (accessed on 17 June 2024).
Figure 1. Geographical locations of WtE-AD in Mexico, considering the substitution of final disposal sites. Information provided by [38].
Sustainability 16 06111 g001
Figure 2. Process flow diagram for waste-to-energy plant i. (1) Industrial food shredder, (2) anaerobic digester with heat and agitation systems, (3) heat and power cogeneration system, (4) rotatory drum sludge dryer.
Sustainability 16 06111 g002
Figure 3. Box-and-whisker plot for the methane yields of the seven food categories found in Mexican FLW from food distribution and retail centers. VS: volatile solids. X-dots represent atypical values.
Sustainability 16 06111 g003
Figure 4. Anaerobic digestion waste-to-energy plant simulation results. Principal axis (left): energy expenditure and energy production per ton of FLW managed in five representative plants. Secondary axis (right): energy quotient of all the anaerobic digestion waste-to-energy plants in Mexico.
Sustainability 16 06111 g004
Figure 5. The energy quotient of anaerobic digestion waste-to-energy plants in Mexico. The middle profile corresponds to anaerobic digesters with average methane yields of the seven food categories considered. Light- and dark-purple lines show the sensitivity analysis for the energy balance regarding maximum and minimum methane yields in the digesters, respectively.
Sustainability 16 06111 g005
Figure 6. Geographical locations of WtE-AD plants in Mexico. Purple markers represent the locations of the 476 plants with Equotient > 1 from the energetic feasibility analysis with the average methane yield. Yellow markers represent the locations of the new WtE-AD plants with Equotient > 1 from the sensitivity analysis for Equotient improvement with the maximum methane yield.
Sustainability 16 06111 g006
Figure 7. Sensitivity analysis to determine the effect of transportation on the energy quotient of the top four anaerobic digestion waste-to-energy plants.
Sustainability 16 06111 g007
Table 1. Characteristics of industrial commercial mesophilic (35 °C) anaerobic digestion technologies for organic wastes [45].
Process TypeProcess Efficiency
BTA ©332 m3 t−1 VS
Sebac ©220–530 m3 t−1 VS
Kompogas ©390–580 m3 t−1 VS
Valorga ©220–300 m3 t−1 VS
Waasa ©170–320 m3 t−1 VS
Disclaimer/Publisher’s Note: The statements, opinions and data contained in all publications are solely those of the individual author(s) and contributor(s) and not of MDPI and/or the editor(s). MDPI and/or the editor(s) disclaim responsibility for any injury to people or property resulting from any ideas, methods, instructions or products referred to in the content.

