Article

Surface Deformation Time-Series Monitoring and Stability Analysis of Elevated Bridge Sites in a Coal Resource-Based City

by
Hongjia Li
,
Huaizhan Li
*,
Yu Chen
,
Yafei Yuan
,
Yandong Gao
,
Shijin Li
and
Guangli Guo
School of Environment and Spatial Informatics, China University of Mining and Technology, Xuzhou 221116, China
*
Author to whom correspondence should be addressed.
Sustainability 2024, 16(14), 6115; https://doi.org/10.3390/su16146115
Submission received: 6 June 2024 / Revised: 12 July 2024 / Accepted: 15 July 2024 / Published: 17 July 2024

Abstract

:
The viaduct is an important infrastructure for urban sustainable development, but it will inevitably pass through a coal mining subsidence area in coal resource-based cities, which poses a threat to the construction and operation of the viaduct. However, there is a lack of research on long time-series monitoring and assessing the safety of elevated bridges above subsidence areas, both domestically and internationally. In this study, a resource-based city viaduct in Shandong, China, was selected as the research object, utilizing SBAS-InSAR technology for deformation monitoring during bridge construction and post-opening phases. The viaduct based on the goaf was analyzed by the key settlement subsection. Before completing construction (March 2019 to December 2020), research revealed that the cumulative maximum deformation in the bridge area was 44mm and the maximum uplift was 22 mm, with overall stability in the underlying subsidence area. After completion (January 2021 to July 2023), the cumulative maximum deformation value in the elevated bridge area was 10mm and the maximum uplift was 6 mm, indicating minimal fluctuations over three years, maintaining overall stability. This stable condition ensures the safety of construction and operation of regional elevated bridges. These findings not only support the safe operation of bridges in underlying subsidence areas but also provide a new approach to sustainable areas globally, especially in coal resource-based urban areas.

1. Introduction

There are hundreds of coal-dependent cities globally, accounting for approximately one-twentieth of the world’s population, making a significant contribution to global economic sustainable development. Simultaneously, these cities have given rise to extensive coal mining subsidence areas [1,2]. Despite the prolonged natural compaction, fractures, delamination, and voids persist within the overlying strata of mined-out areas. Under various internal and external loads, the ground surface remains susceptible to secondary subsidence, posing safety risks to surface structures and constructions [3,4]. This research aims to ensure the secure operation of elevated bridges overlying subsidence areas, especially with the transformation and development of coal-dependent areas. Due to the heightened sensitivity of elevated bridges to site deformations, residual deformations in mining subsidence areas pose a significant threat to the safety of foundational infrastructure, including elevated bridges [5,6]. Hence, InSAR is used to monitor the small-range deformation of elevated bridges. However, there are very few cases of elevated bridge constructions domestically and internationally. Meanwhile, bridges are detected in a more time-consuming and laborious way. This shortage has led to a situation where elevated bridges in coal-dependent cities are often rerouted or not constructed, significantly impeding the progress of urban transformation and development. Therefore, it is imperative to conduct research on deformation monitoring and safety assessment methods for elevated bridges above mining subsidence areas.
With the development of InSAR technology, it has provided a new remote sensing monitoring method for monitoring deformations in elevated bridge sites above underlying mining subsidence areas [7,8]. In comparison to traditional sensor-based urban infrastructure health monitoring, InSAR technology offers the following advantages: (1) large-scale, high-density measurements, (2) continuous spatial coverage over a wide area, and (3) non-contact remote sensing [9,10,11]. InSAR has high monitoring accuracy and is suitable for deformation monitoring in medium range, such as urban subsidence [12,13]. D-InSAR requires highly repeatable SAR data and the sensitivity is low, which is not suitable for surface deformation with non-linear changes. The data processing of PS-InSAR is complex and requires a large number of SAR images. In addition, the stability of ground objects is required to be high.
Due to the speckle noise, temporal, and geometric discorrelation inherent in SAR imaging and interference processing, the generated interferogram contains a lot of noise. The specific performance is phase discontinuity and dim, and periodicity is not obvious. By filtering, the noise is reduced, the phase is more continuous, and finally the purpose of correct unwrapping and accurate interpretation is achieved. In particular, time-series SBAS-InSAR technology can address the issue of interferometry between images caused by long baselines, allowing for long-term, high-precision monitoring. This technology has been widely applied in long-term surface deformation monitoring in coal mining areas [14], such as Li, which explored the relationship between surface subsidence and its inducing factors [15]. Ou confirmed the feasibility and practical value of GF-3 satellite and microwave remote sensing technology in the field of geological hazard deformation monitoring in power transmission corridors [16]. However, at present, both domestic and international scholars primarily use InSAR technology to monitor surface deformations caused by coal mining [17,18,19], with very little focus on monitoring deformations above mining subsidence areas, especially in the context of elevated bridges.
Some researchers have also employed InSAR technology for bridge health monitoring. For instance, Cusson et al. used InSAR methods in bridge deformation analysis research, finding that satellite-based techniques are useful for remote monitoring of road and railway bridges to alert engineers to excessive bridge movements [20]. However, they are almost all based on natural settlement of the bridge foundations and ignore the connection between bridges and surface. Zhang et al. conducted a study using time-series interferometric measurements to retrieve and analyze the structural and deformation characteristics of a bridge (QTR) using Sentinel-1A and TerraSAR-X images [21]. Wang et al. used continuous scatterer InSAR to obtain deformation rates along a canal and identified 20 deforming canal sections and 20 potentially deforming canal sections [22]. Nevertheless, they focused on bridges based on rivers. Qin et al. combined InSAR time-series displacement analysis to assess the mechanical performance degradation of different bridge components, increasing the reliability of InSAR-based structural risk identification [23]. They used mechanical performance as the key research point, ignoring geographical factors. Tao et al. conducted a study on the stability of the subsidence area site of the Xuhuaifu Expressway’s Huainan section using SBAS-InSAR technology [24]. Kinoshita et al. used SAR to detect anomaly bridge deflections [25]. However, current InSAR monitoring related to bridge deformations has not addressed mining subsidence areas, resulting in a lack of scientific basis for the construction and safe operation of elevated bridges over mining subsidence areas.
Therefore, this paper focuses on the case of an urban viaduct across the city above an underlying mining subsidence area in a coal-dependent city in China. It utilizes SBAS-InSAR technology to monitor site deformations during both the construction and operational phases of the elevated bridge. Additionally, it combines safety defense indicators for the elevated bridge to analyze the safety and stability of the site construction, providing technical support for the safe operation of elevated bridges over mining subsidence areas in the research region. The safety of the viaduct is crucial to the sustainable development of cities.

2. Materials and Methods

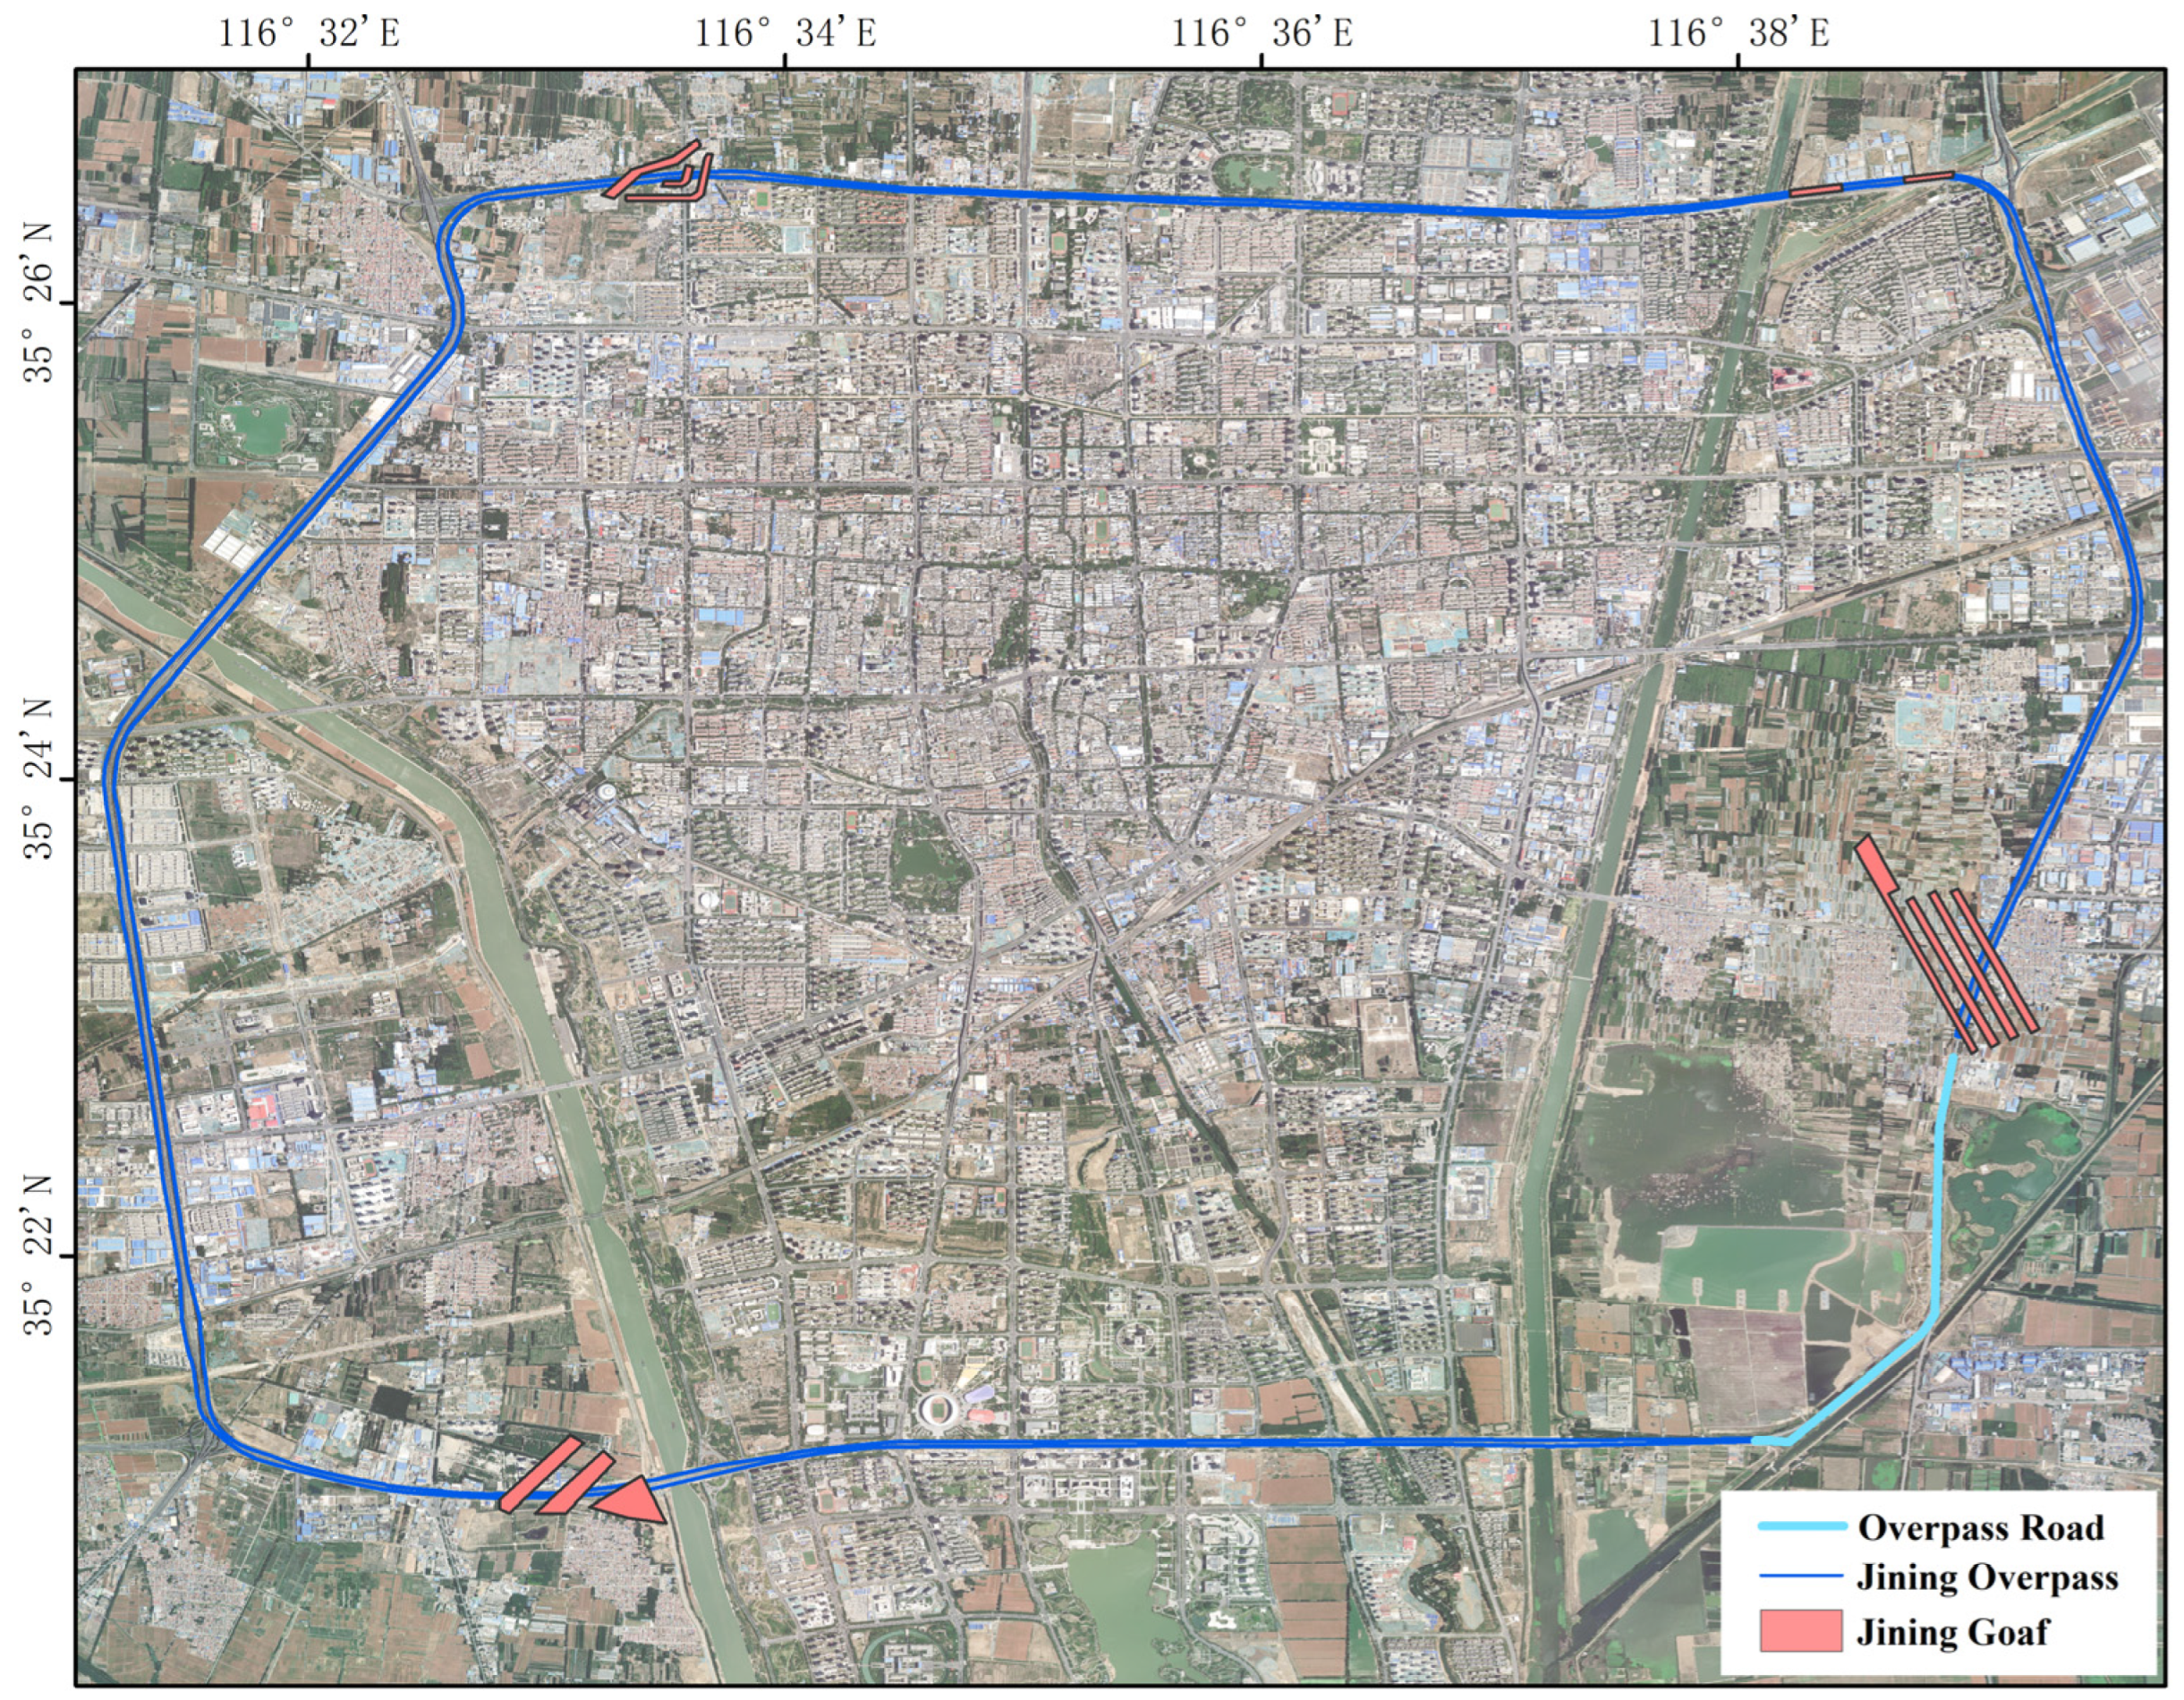
2.1. Overview of the Study Area
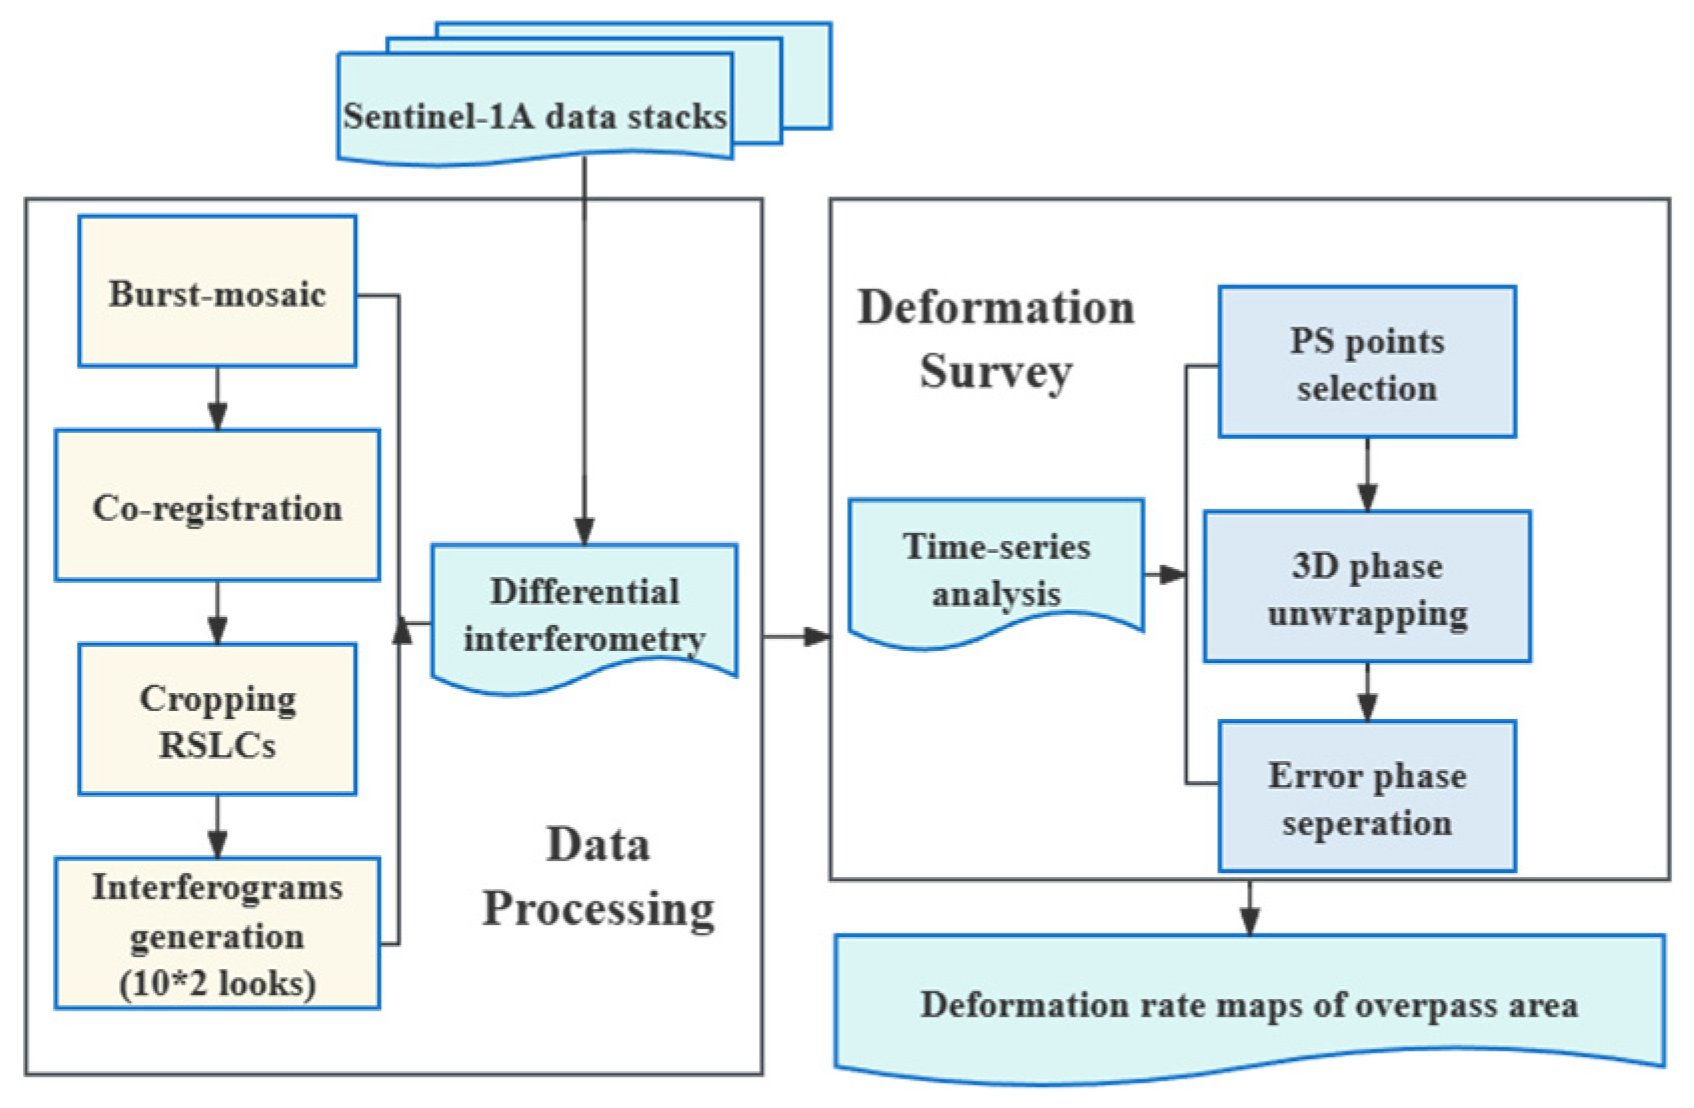
The inner overpass road area is located in the southwest of Shandong Province, at the northern end of South Sihu, positioned at approximately 35°08′ to 35°32′ N latitude and 116°26′ to 116°44′ E longitude. It is situated at the confluence of the inclined plains of the central Taiyi, Mengshan Mountains, and Huangfan Plains in the southwest of Shandong, with predominantly flat topography. The soil composition consists mainly of clayey soil, with some loam and sandy soil. The region falls within the East Asian monsoon climate zone, characterized by a warm temperate continental monsoon climate [26]. The city’s water supply primarily relies on the extraction of groundwater from unconsolidated aquifers. The fourth series of unconfined and semi-confined aquifers are widespread, with thickness ranging from 8.10 to 83.68 m and high water-bearing capacity. The fourth-series aquifer serves as the primary source of water supply, located at the topmost geological layer. The geological structure is relatively loose, and extensive groundwater extraction can lead to compression and consolidation of the strata, resulting in significant ground subsidence.
The stability of urban transportation can, to a certain extent, impact the local resource advantages. However, in the case of a certain road in Shandong Province, the presence of undevelopable land due to factors such as coal mining poses a barrier. In order to overcome these geographical limitations and enhance urban transportation, a study on the stability of a certain city’s expressway is being conducted. This research aims to address the challenges posed by the non-developable land resulting from activities like coal mining, with the ultimate goal of improving the overall stability and functionality of the city’s transportation infrastructure.
The viaduct is located in a city in Shandong Province (Figure 1), comprising the eastern Ning’an Avenue, southern Jining Avenue, western Jishui Avenue, and northern Rencheng Avenue. The first section was completed and opened to traffic on 28 July 2020, and the mainline was fully opened on 31 December 2020. The monitoring area for the elevated bridge project was divided into 13 sections for construction, with a total route length of 41 km, including 36 km of elevated road and 5 km of ground expressway. The design includes a six-lane dual carriageway for the elevated road and a six-lane dual carriageway for the ground-level auxiliary road. The project also includes the construction of four interchange bridges, twenty-six entrance and exit ramps, and one lateral junction tunnel, along with supplementary facilities such as lighting and traffic markings.
The study area passes through multiple mining subsidence areas and the geological environment is complex. There are four mining areas underground through the study region: Jin Yu West Road (2345, 2349, 2344), Jin Yu Road (5309, 5313), South Ning’an Avenue (6306, 6310, 6311, 6312), Jishui Avenue (1304, 1306), and a portion of non-elevated bridge areas that passes through mining subsidence areas (4301, 4302), as shown in Figure 2.

2.2. Method

The Small Baselines Subset Interferometry InSAR (SBAS-InSAR) technique is a method for extracting relatively stable backscatter points or highly coherent target points within a given observation period [27,28]. It utilizes the weighted phase and intensity of observed targets within a resolution cell as the measurement for that cell. By analyzing and processing multiple interferograms of the bridge area, it calculates deformation information relative to the initial moment for each image acquisition time. Compared to the single master image differential interferometry mode, SBAS-InSAR allows for control of temporal and spatial baselines by freely combining SAR images, resulting in a series of short baseline differential interferometric image sets. This approach further mitigates decorrelation effects and increases the precision of filtering and phase unwrapping [29,30]. Additionally, due to the utilization of redundant observations, SBAS-InSAR can also separate the terrain residual phase from the atmospheric noise phase, enhancing the accuracy and reliability of deformation monitoring results.
The steps for monitoring deformation in the inner elevated bridge area using InSAR include data processing, overall deformation assessment, and detailed monitoring of key bridge segments. Data processing involves differential interferometric measurements and time-series InSAR analysis. The implementation of the GAMMA ISP (Interferometric SAR Processor) program is used to perform differential interferometric measurements [30]. In InSAR technology, when acquiring surface geometry information, it assumes that no surface deformation occurs between the imaging intervals. In the actual scenario, if there is surface deformation, the interferometric phase in the interferogram can be expressed as follows:
Φ i n t = Φ d e f + Φ f l a t + Φ a t m + Φ o r b + Φ t o p o + Φ n o i s e
In the equation, Φ d e f represents the surface deformation phase, Φ f l a t represents the flat-earth phase, Φ a t m atmospheric represents the atmospheric phase, Φ o r b represents the orbital phase, Φ t o p o represents the topographic phase, and Φ n o i s e noise represents the noise phase.
In the SBAS technique, interferometric pairs of images are formed through free combinations of images, without being limited to the single master image as in the Persistent Scatter (PS) technique. This is achieved by setting temporal and spatial baseline thresholds and selecting short baseline interferometric pairs for analysis, thereby reducing the impact of temporal and spatial decorrelation.
Assuming that there are N + 1 SAR images, following the principles of permutation and combination, a maximum of N·(N + 1)/2 interferometric pairs can be generated [31]. By setting time and space baseline thresholds, high-quality interferometric pairs are selected from these pairs, ensuring that each interferometric pair forms a complete network without isolated islands in the temporal connections.
Subsequently, open-source StaMPS_v3.3 software is used for SBAS-InSAR analysis [32,33]. Initially, high-coherence targets are selected based on a certain amplitude dispersion index threshold, and potential Persistent Scatter (PS) points are further identified by analyzing the stability of their phases. After three-dimensional phase unwrapping and spatiotemporal filtering, the deformation phase is separated from other phase components. Finally, deformation rates and displacement time series for Sentinel-1A paths are derived.
The process begins by selecting candidate points based on the Amplitude Deviation Index (DA), with a threshold usually set at 0.6. Subsequently, SDFP (Small Deformation Phase) pixels are identified in a manner similar to the selection of PS points among the candidate pixels. The spatially correlated phase of pixel interference is estimated by band-pass filtering the surrounding pixels. The spatially uncorrelated viewing geometry error terms, including contributions from spatially uncorrelated elevation errors and deviations between the pixel phase center and its physical center, are estimated by their correlation with the vertical baseline. Subtracting these two estimates yields an estimate of pixel-specific noise, which is characterized using coherence:
γ x = 1 N i = 1 N exp 1 ψ x , i ψ ˜ x , i Δ Φ ^ t o p o , x , i u
In the equation above, ψ x , i represents the wrapped phase of pixel x in the i-th interferogram, ψ ˜ x , i represents the spatially correlated estimation term, Δ Φ ^ t o p o , x , i u represents the spatially uncorrelated line-of-sight error estimation term, and N represents the number of interferograms. The mentioned processing can correct the interferometric phases and estimated phases of these PSs due to spatially correlated line-of-sight (LOS) errors, main image atmospheric delay, and orbit errors. By removing these phase components, the phase associated with LOS deformation Φ d e f can be retrieved. Using the aforementioned method, deformation in the elevated bridge area was monitored from Sentinel-1 images through StaMPS_v3.3, with the specific steps outlined in Figure 3.

3. Results

The safety of the elevated bridge is influenced by specific geological mining conditions and geological structures in the mining subsidence area. The results of various factors ultimately manifest as macroscopic surface deformations. Monitoring surface deformations accurately assesses the impact of residual subsidence deformations on the safety and stability of the elevated bridge site. SBAS-InSAR technology offers advantages such as high accuracy, strong feasibility, and good reliability for monitoring surface deformations, providing effective technical support for monitoring the surface stability of mining subsidence areas.

3.1. Data Selection

Data selection needs to consider timelines, as more recent data provide more accurate results. Large datasets require cropping, and the finer the cropping, the more precise the results. Considering the specific situation of the study area, Sentinel-1A IW SLC pairs with VV + VH polarization are selected as the research data (Table 1 and Table 2).

3.2. Interferogram Generation

To obtain as many interferometric pairs as possible and reduce the influence of temporal and spatial baselines on image coherence, vertical baselines within the range of 150 m and temporal baselines of 60 days were set for the period from March 2019 to December 2020. In addition, vertical baselines were set within the range of 200 m and temporal baselines were 60 days from January 2021 to July 2023. Good interferometric pairs were eventually obtained to ensure the quality of interferometric processing, as seen in the temporal–spatial baseline figure (Figure 4).

3.3. Phase Unwrapping and Filtering

The wrapped phase of selected high-coherence pixels is subjected to phase unwrapping, and the phase relative to the original master image is obtained through a least squares inversion.
The residual phase after the process of decoherence is subjected to Goldstein filtering for the removal of the residual phase, obtaining deformation phase and spatial decorrelation errors. The spatial decorrelation error modelled as noise was removed, resulting in the deformation phase values for the study area [34]. From an overall perspective of the study area, numerous observation points are distributed throughout the urban area, with most of the SBAS monitoring points concentrated around buildings and roads, which is related to the high level of urbanization and dense man-made structures [35]. In the northwest, the standard of urbanization is lower. There is extensive agricultural land with sparse buildings, and only a small number of observation points can be obtained. Overall, the selected monitoring points can cover the bridge area.

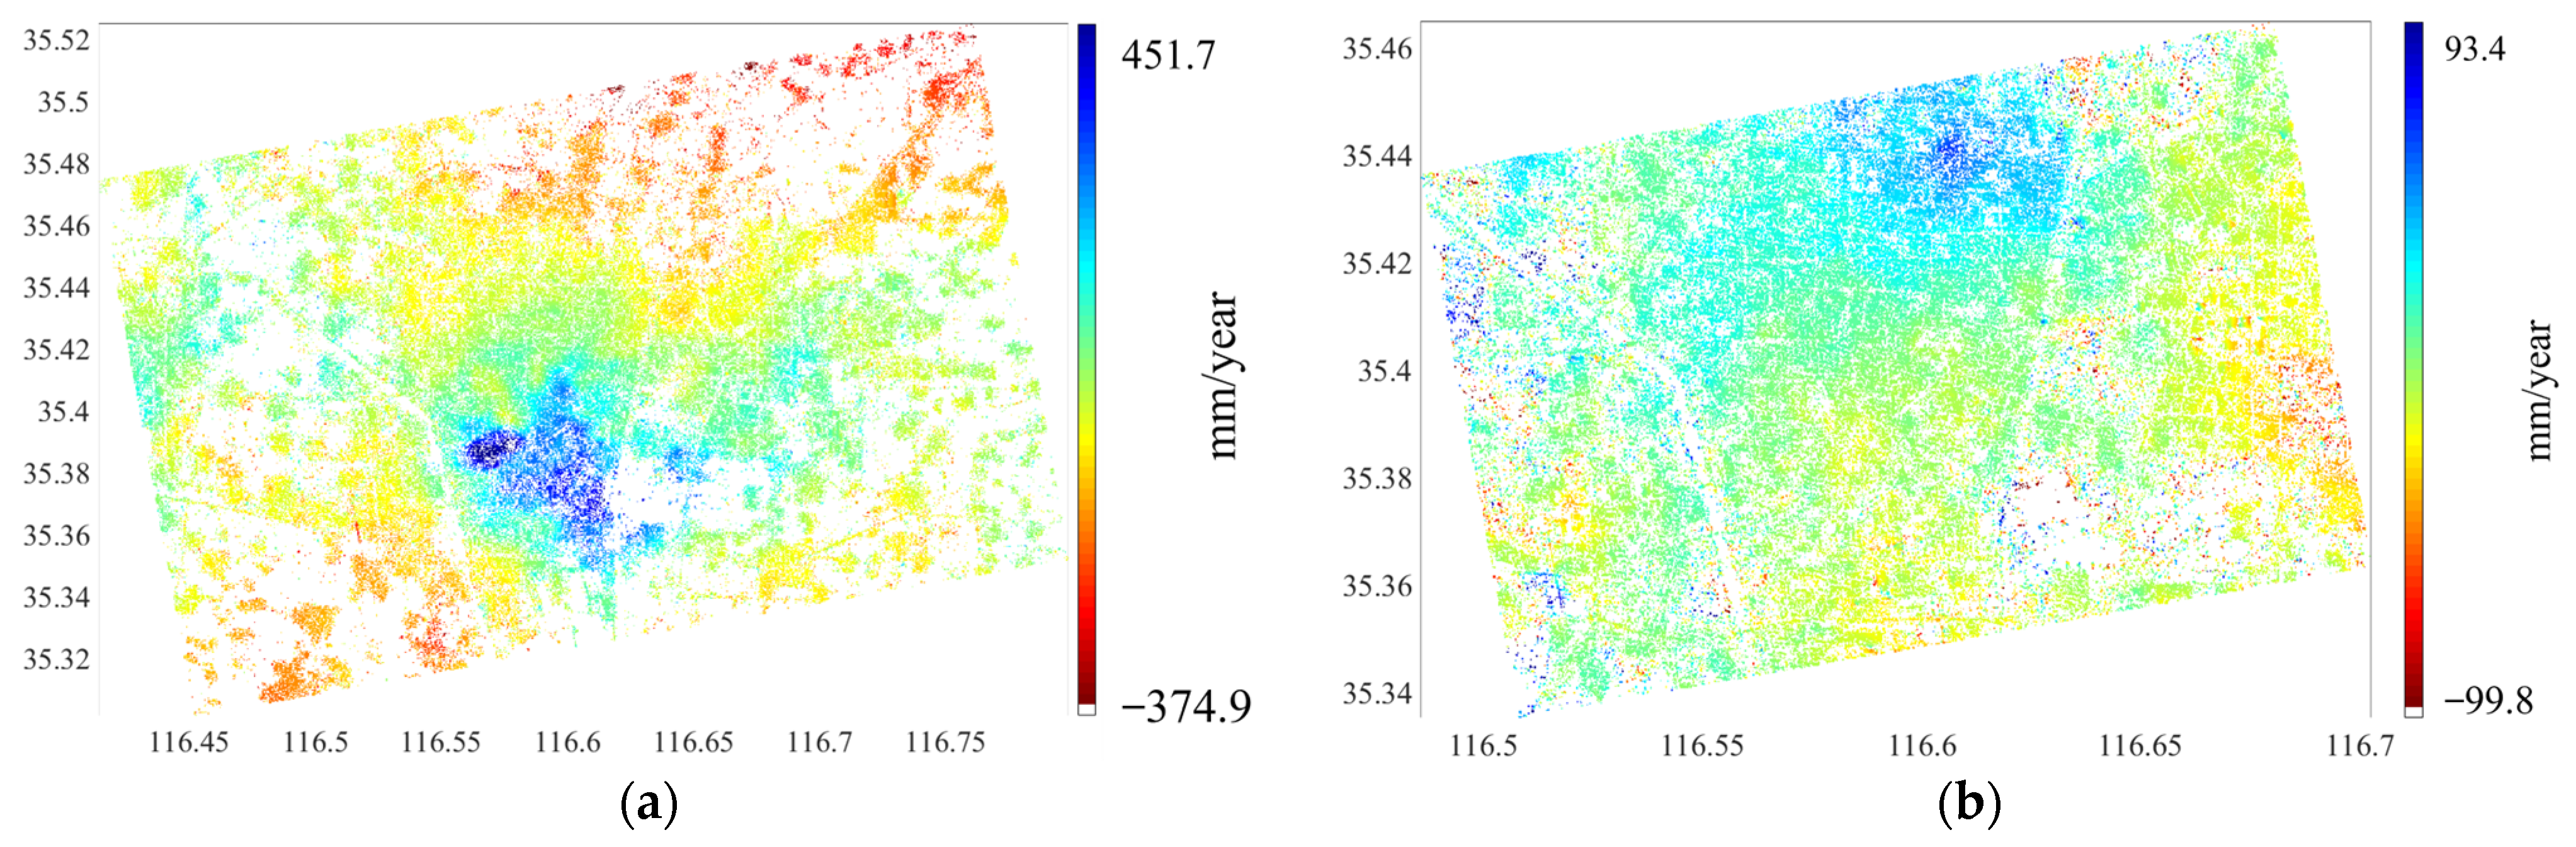
3.4. Time-Series Deformation Rate

The actual elevation range of the elevated bridge was taken into account. With the aforementioned series of processing steps, the SBAS technique was employed to obtain the average subsidence rate and the temporal variations in subsidence for the study area [29].
In urban areas, artificial structures are intensive, and the acquired points exhibit a relatively high density. However, the points become significantly sparse between June and September each year during the rainy season. This is primarily due to the soft and expansive nature of the soil in forested areas, high soil expansion coefficients, and heavy rainfall in the urban area, leading to significant subsidence–uplift fluctuations in most observation points. This leads to the determination of the LOS average velocity (Figure 5).
It can be determined from the above LOS average rate deformation graph that the annual average maximum uplift rate reaches 451.7 mm/year and the maximum subsidence rate reaches −374.9 mm/year from March 2019 to December 2020. The urban and viaduct areas were in the planning and construction stage during this period, the observation points that could be collected were sparse, and the surface deformation was large. After the completion of the construction, the annual average maximum uplift rate reaches 93.4 mm/year from January 2021 to July 2023 and the maximum subsidence rate reaches −99.8mm/year. The overall shape of the urban and viaduct area becomes stable and the pixels collected are uniformly dense.

4. Discussion

At present, the monitoring technology based on the viaduct has been very mature [6,24]. However, the stability evaluation of the viaduct in the urban area of the underlying goaf site still needs to be carried out. In view of the above results, the regional stability of the viaduct was evaluated and specific planning suggestions were put forward. In order to comprehensively assess the safety of the elevated bridge, SBAS-InSAR technology was used to monitor site deformations during the construction period of the elevated bridge in the mining subsidence area from March 2019 to December 2020. Afterward, the typical deformation of each mining position was analyzed by combining the subsidence of bridges and urban factors. The same technology was employed to monitor site deformations after the elevated bridge became operational from January 2021 to July 2023. Similarly, the key deformation areas in the urban and viaduct were analyzed by using visual geological maps and the relationship between the goaf and the bridge was explored.

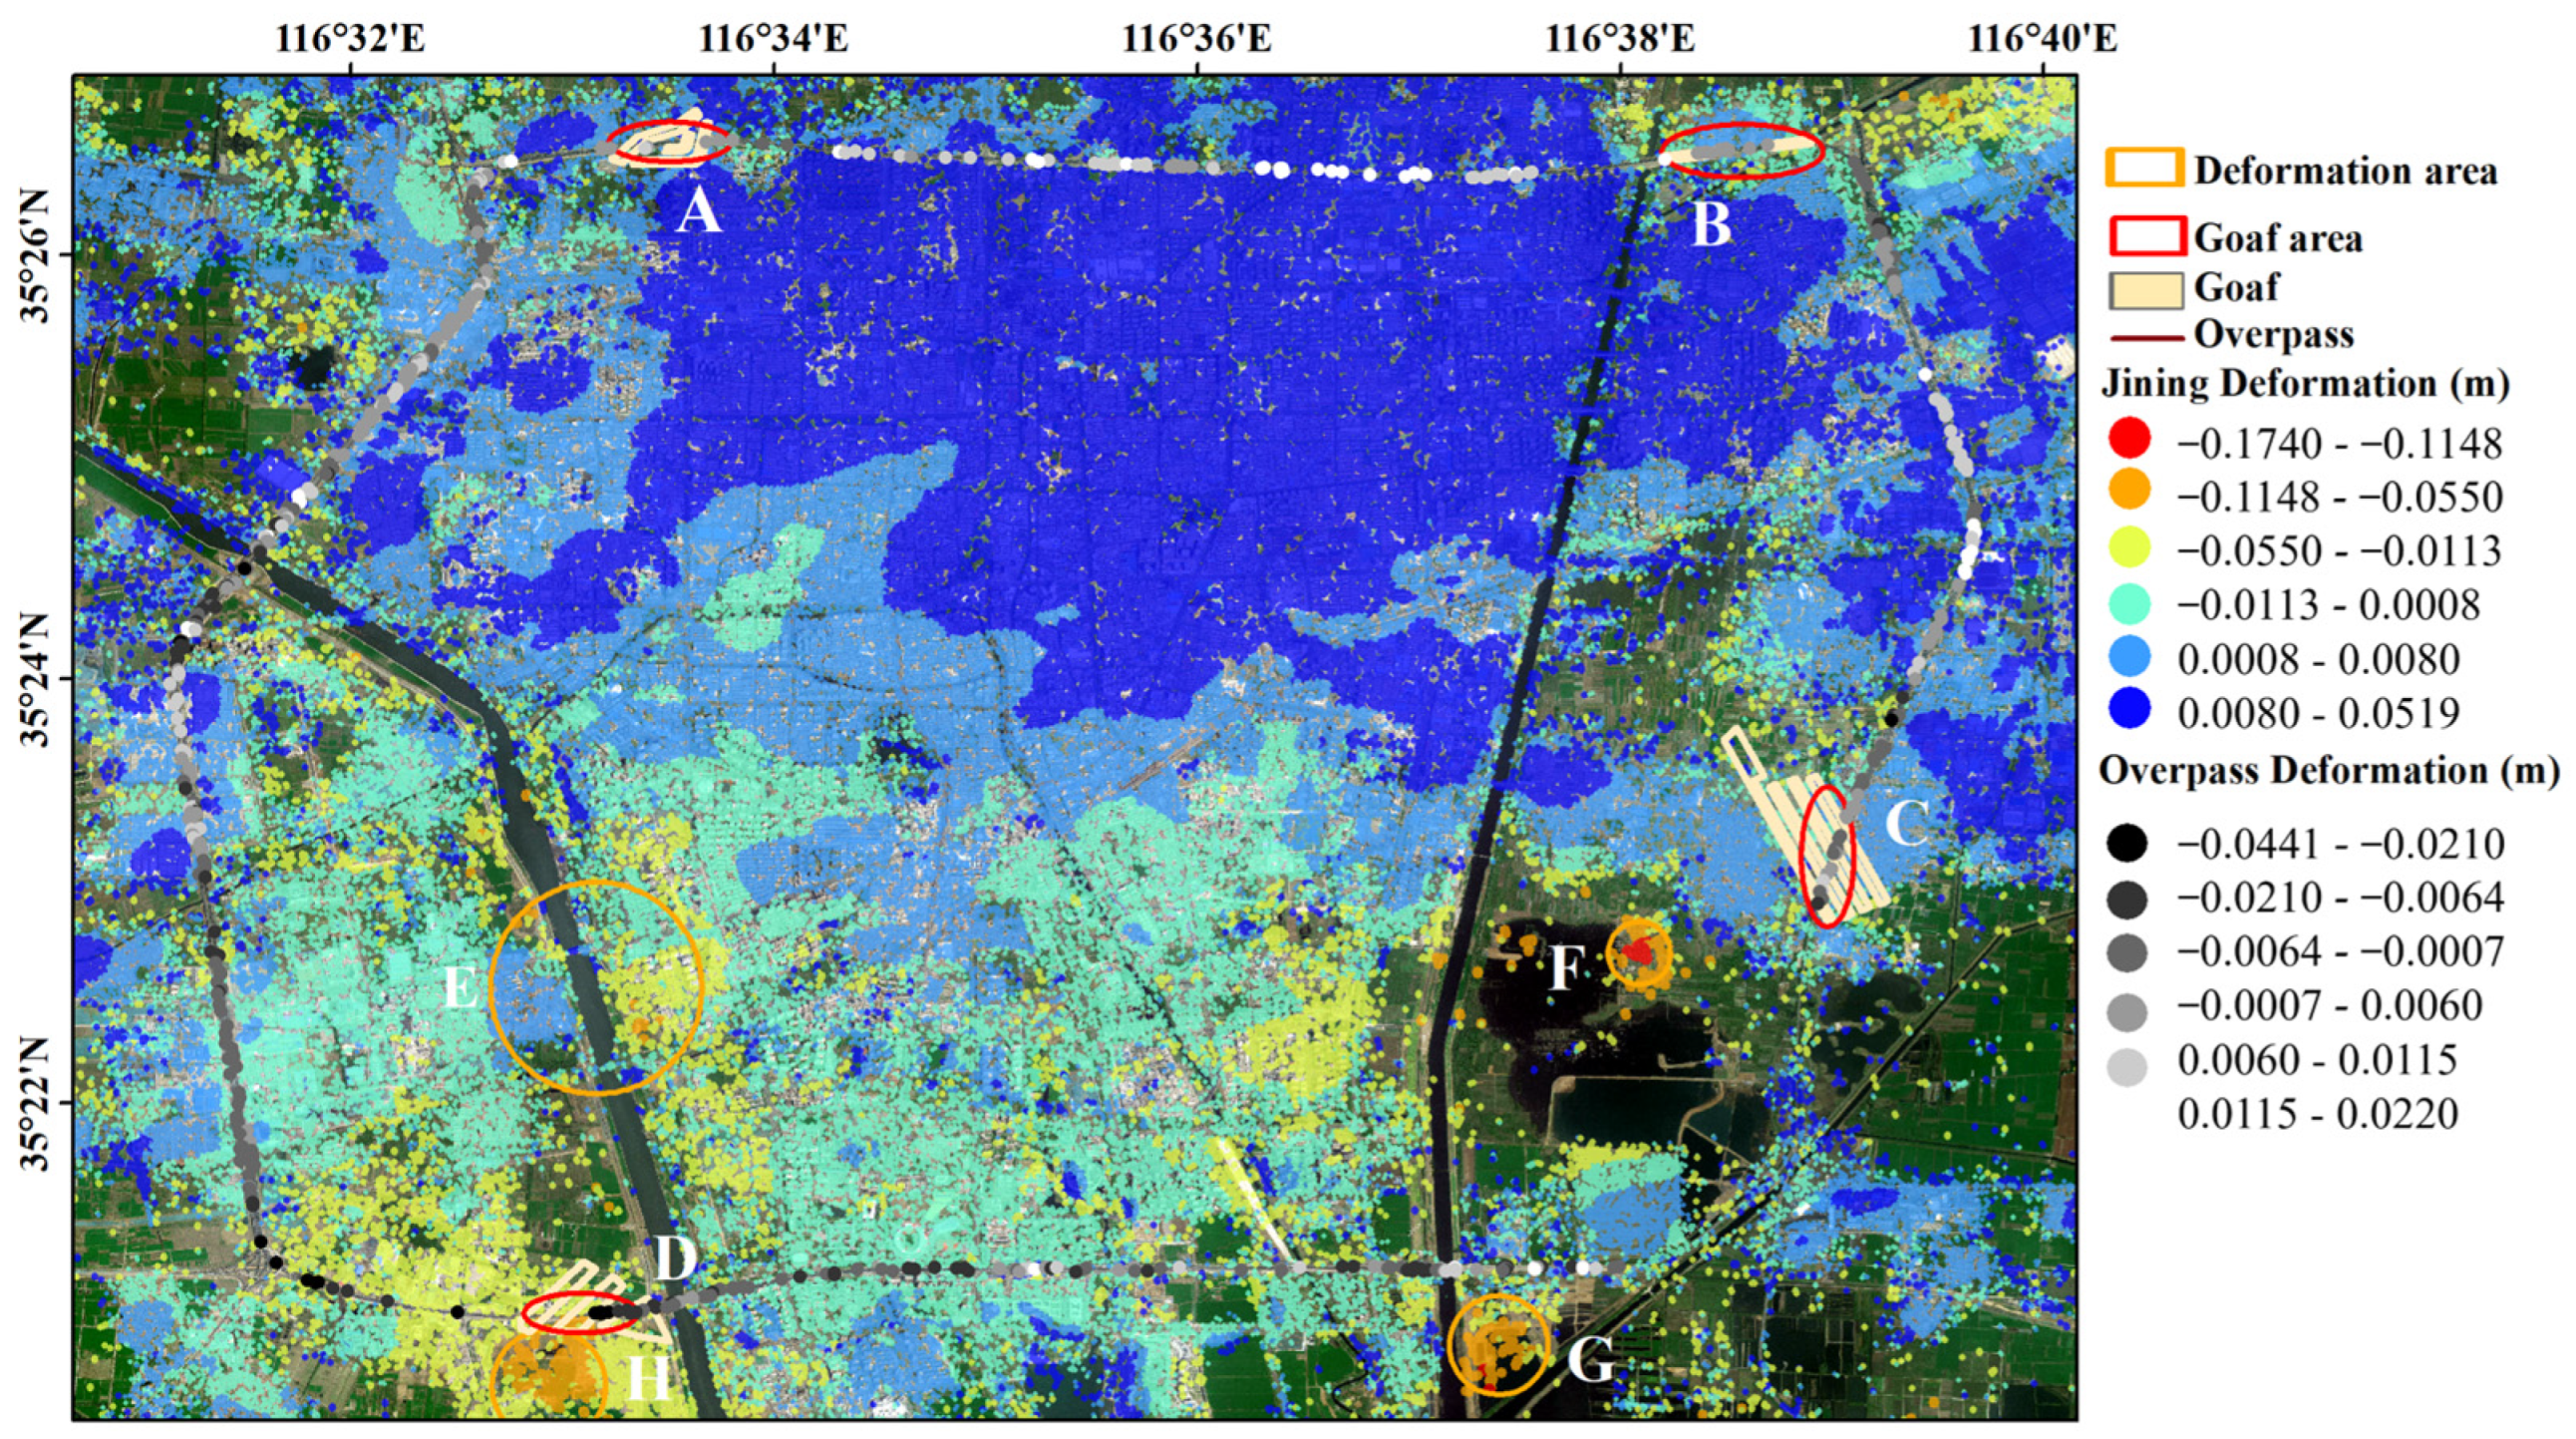
4.1. March 2019–December 2020 Monitoring Results and Analysis

During the period from March 2019 to December 2020, SBAS-InSAR technology was applied to process data from 22 satellite images, resulting in a time-series deformation map for the region (Figure 6). Negative deformation values indicate subsidence, while positive values indicate uplift.
Rapid urbanization can accelerate the progress of land subsidence and uplift. Therefore, spatial-temporal analysis of land displacement can provide a guarantee for rapid urbanization progress [11]. Since the period from March 2019 to December 2020 corresponds to the construction phase of the elevated bridge, there were residual deformations around the mining subsidence area. Therefore, the subsidence areas around the elevated bridge were divided into four regions, labelled as ABCD, and the interior area was divided into four more regions, labelled as EFGH. It can be observed that the northern part of the city, from 2019 to 2020, was mainly in an uplift state during its construction phase, while the southern part showed an overall sinking trend.
The study area exhibited uneven surface deformations, with both overall uplift and subsidence. The northern part of the study area carried out three years of new urban infrastructure construction from 2021 to 2023. The majority of this area showed an uplift trend, with a cumulative maximum uplift of 519 mm. Conversely, the southern large part of the study area experienced minor subsidence, with a maximum value of −113 mm. Some areas exhibited moderate subsidence with a maximum value of −115 mm, which was far below the urban foundation deformation control standard of 200 mm specified in the “General Norms for Urban and Municipal Ground Foundations”. There were also localized instances of severe subsidence, with a maximum subsidence of −174 mm. Importantly, the subsidence of the bridge deck area did not exceed −44.1mm (Figure 7). According to the “Technical Specification for Geotechnical Engineering Investigation in Mining Subsidence Areas”, the ground engineering construction stability assessment in the mining subsidence area was considered suitable.
Region A is located in the west of Rencheng Avenue and passes through mining subsidence areas with working faces 2345, 2349, and 2344. Region A showed an overall uplift trend with a maximum uplift of 6 mm.
Region B is situated in the eastern part of Rencheng Avenue and passes through mining subsidence areas with working faces 5309 and 5313. This area corresponds to the same direction as the elevated bridge and is considered a key monitoring area. Region B exhibited a combination of subsidence and uplift, with a maximum cumulative uplift of 22 mm.
Region C is located in the southern part of Ning’an Avenue, intersecting with the adjacent existing road, and passes through comprehensive mining work areas with working faces 6312, 6311, 6310, and 6306. Most of the area in Region C exhibited an uplift trend, with a minor subsidence in some parts that was similar to the trend in the mining subsidence areas. The maximum cumulative subsidence in Region C was −21 mm, while the other uplift areas matched the overall uplift trend in the northern part of the city, with a maximum cumulative uplift of 11.5 mm.
Region D is situated in the western part of Jinan Road and passes through mining subsidence areas with working faces 1304 and 1306. Region D exhibited an overall subsidence trend with a cumulative subsidence rate of 44.1 mm, which can be attributed to the residual deformations in the mining subsidence areas.
In Figure 8a, the deformation Area E, moderate deformation points are shown primarily on both sides of the river, with a maximum cumulative subsidence of −114.8 mm. The subsidence on both the left and right sides of the Lu Canal is due to the conversion of farmland to land from 2019 to March 2020.
In Figure 8b, the deformation Area F, the deformation points are concentrated mainly in the central areas of residential buildings. Behind this area lies the Shili Lake, which has experienced severe flooding due to coal mining subsidence. The subsidence in the residential areas has led to ground cracks and land subsidence, primarily caused by coal mining subsidence. The mining working face now turned into Shili Lake has experienced more serious land subsidence than the surrounding area circled in Figure 8b, which indicates that the mining of underground mineral resources is an important inducing factor of land subsidence [15].
In Figure 8c, the subsidence phenomenon mainly occurred on the land. As shown, in March 2019, the land alternated between semi-green and semi-aquatic conditions. By December 2020, the land was submerged in water, and this subsidence is primarily due to the location of this area above seven mined-out sections. The geological conditions in this area are complex, with a high groundwater content, which accelerates the formation and size of underground cavities. The subsidence is mainly caused by residual deformation, resulting in water accumulation. It is evident that by March 2022, by using World Imagery Wayback (Figure 9), the entire area had become completely submerged.
In Figure 8d, the area is located above mined-out sections, leading to surface subsidence caused by residual deformation in the mined-out sections. In March 2019, the entire area was land, which gradually transformed into small water bodies by December 2020. Parts of the village have also experienced surface subsidence following the trends in the mined-out sections.

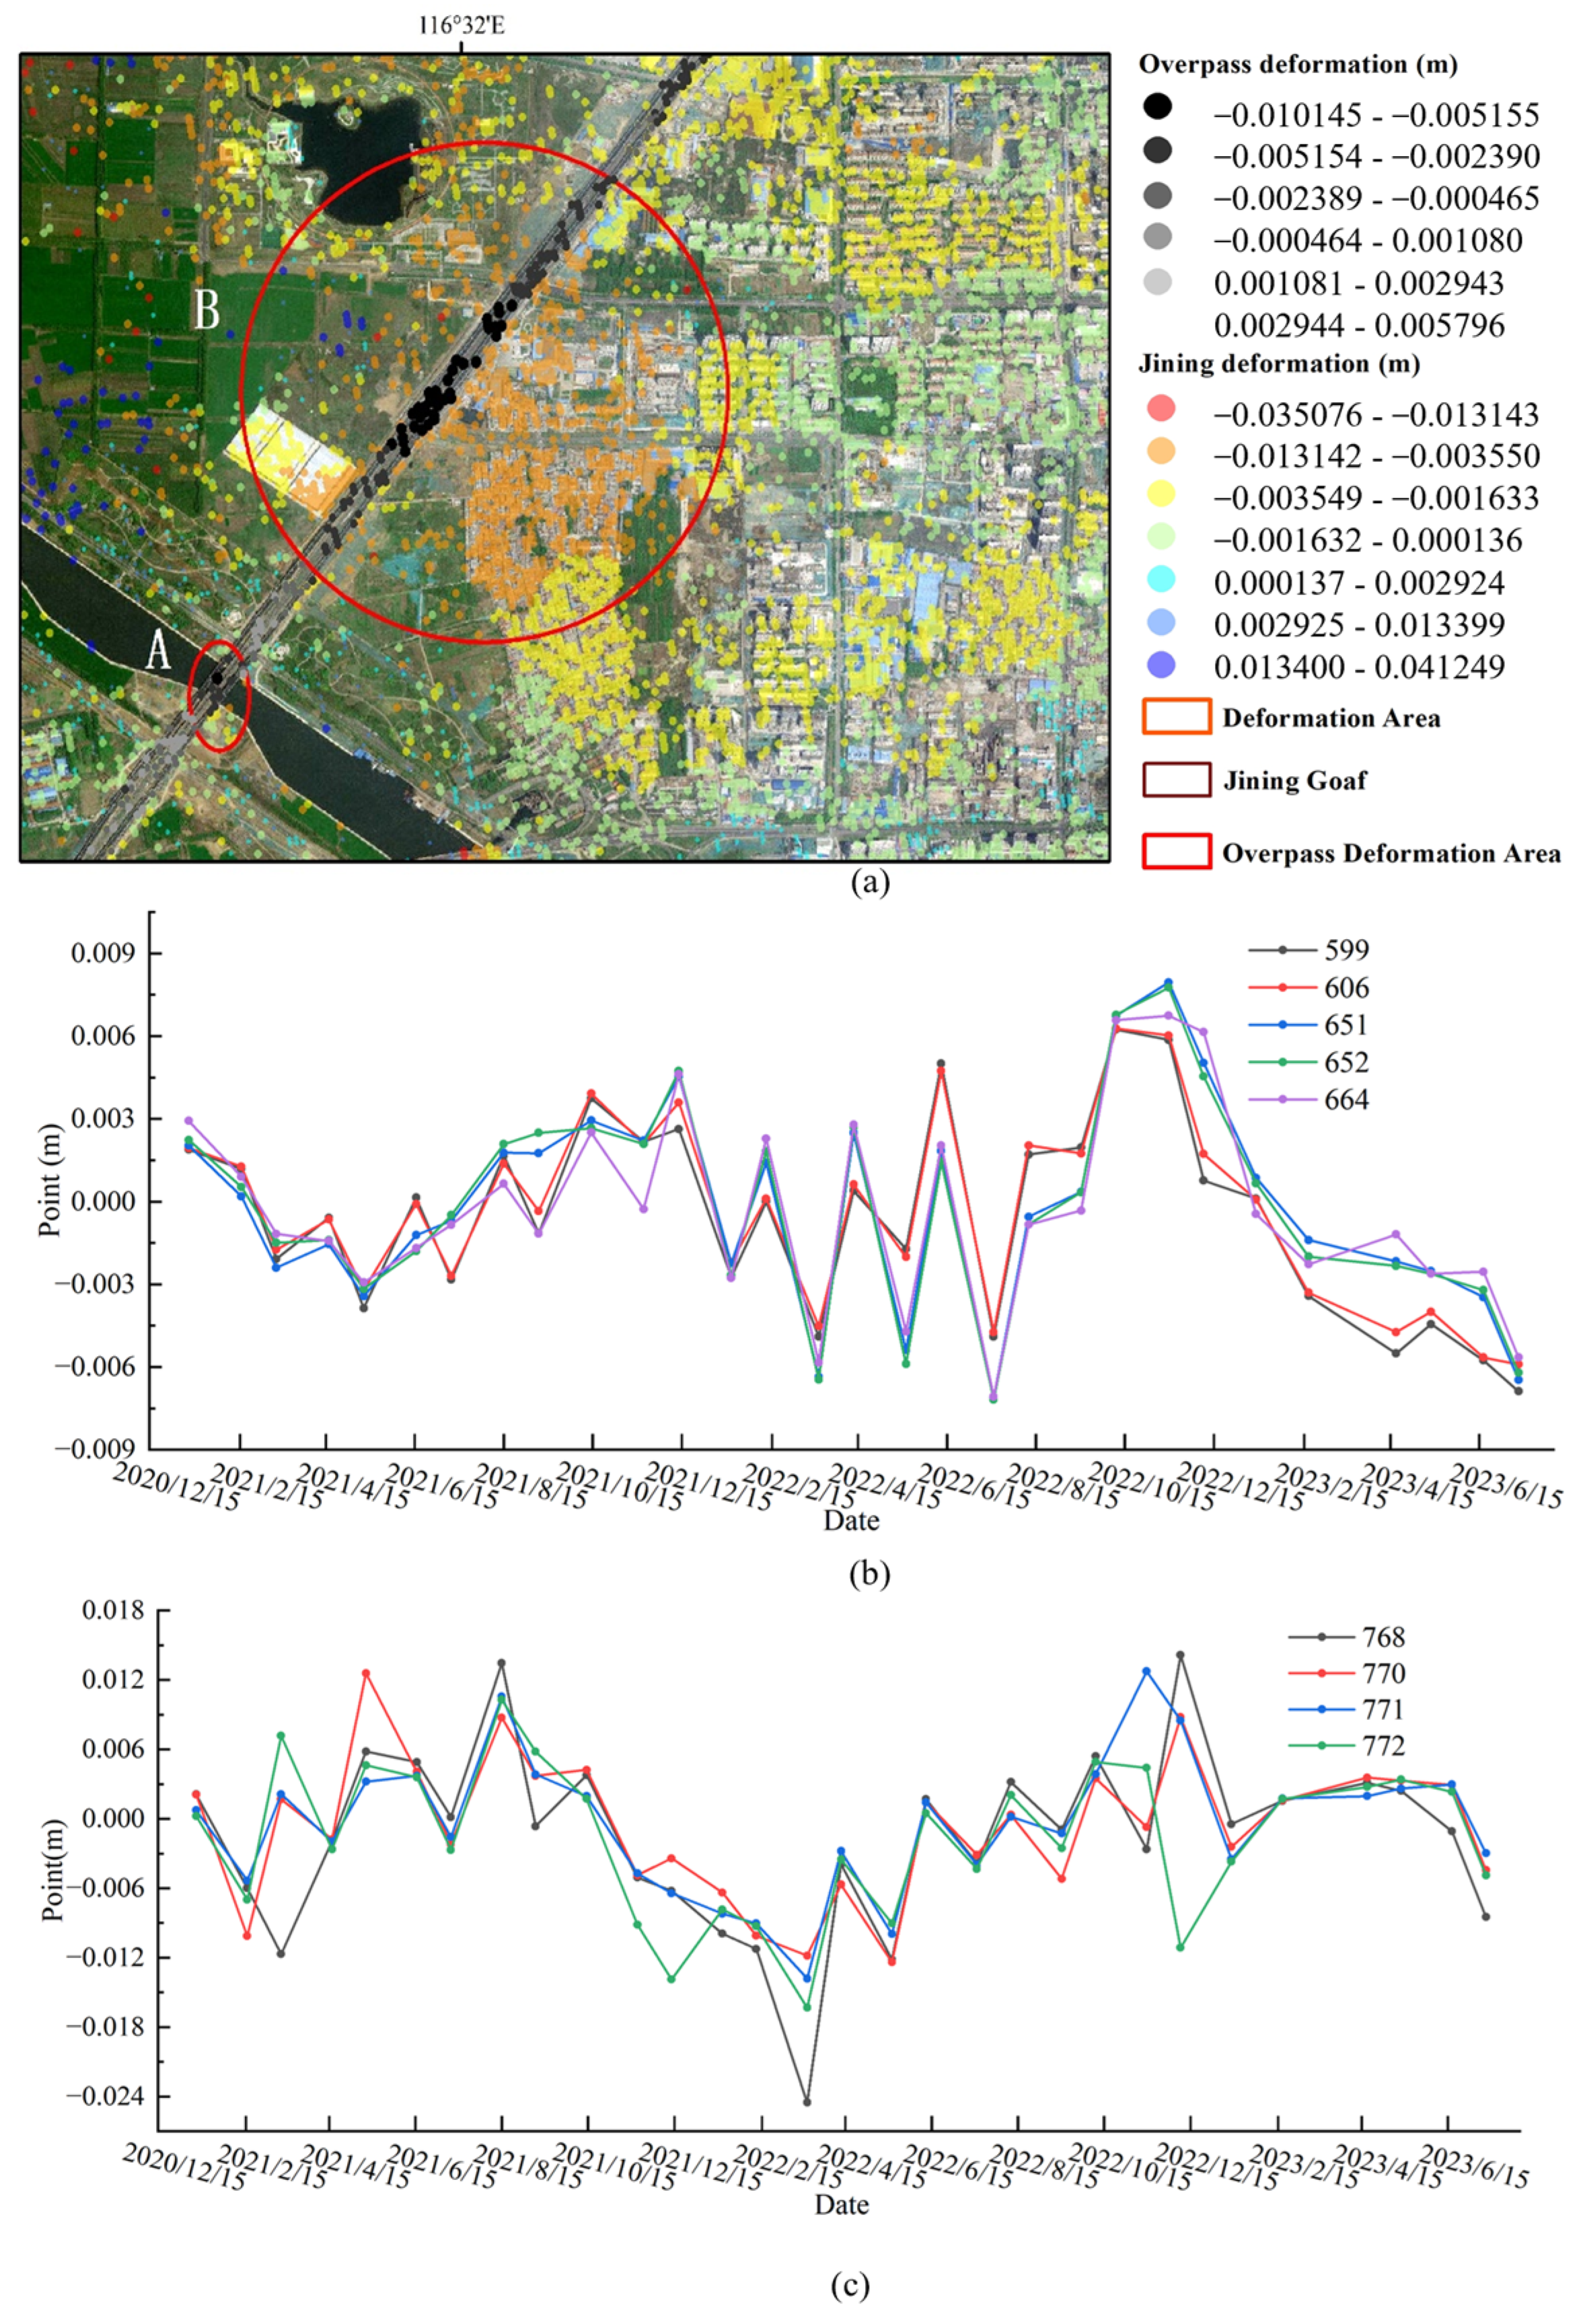
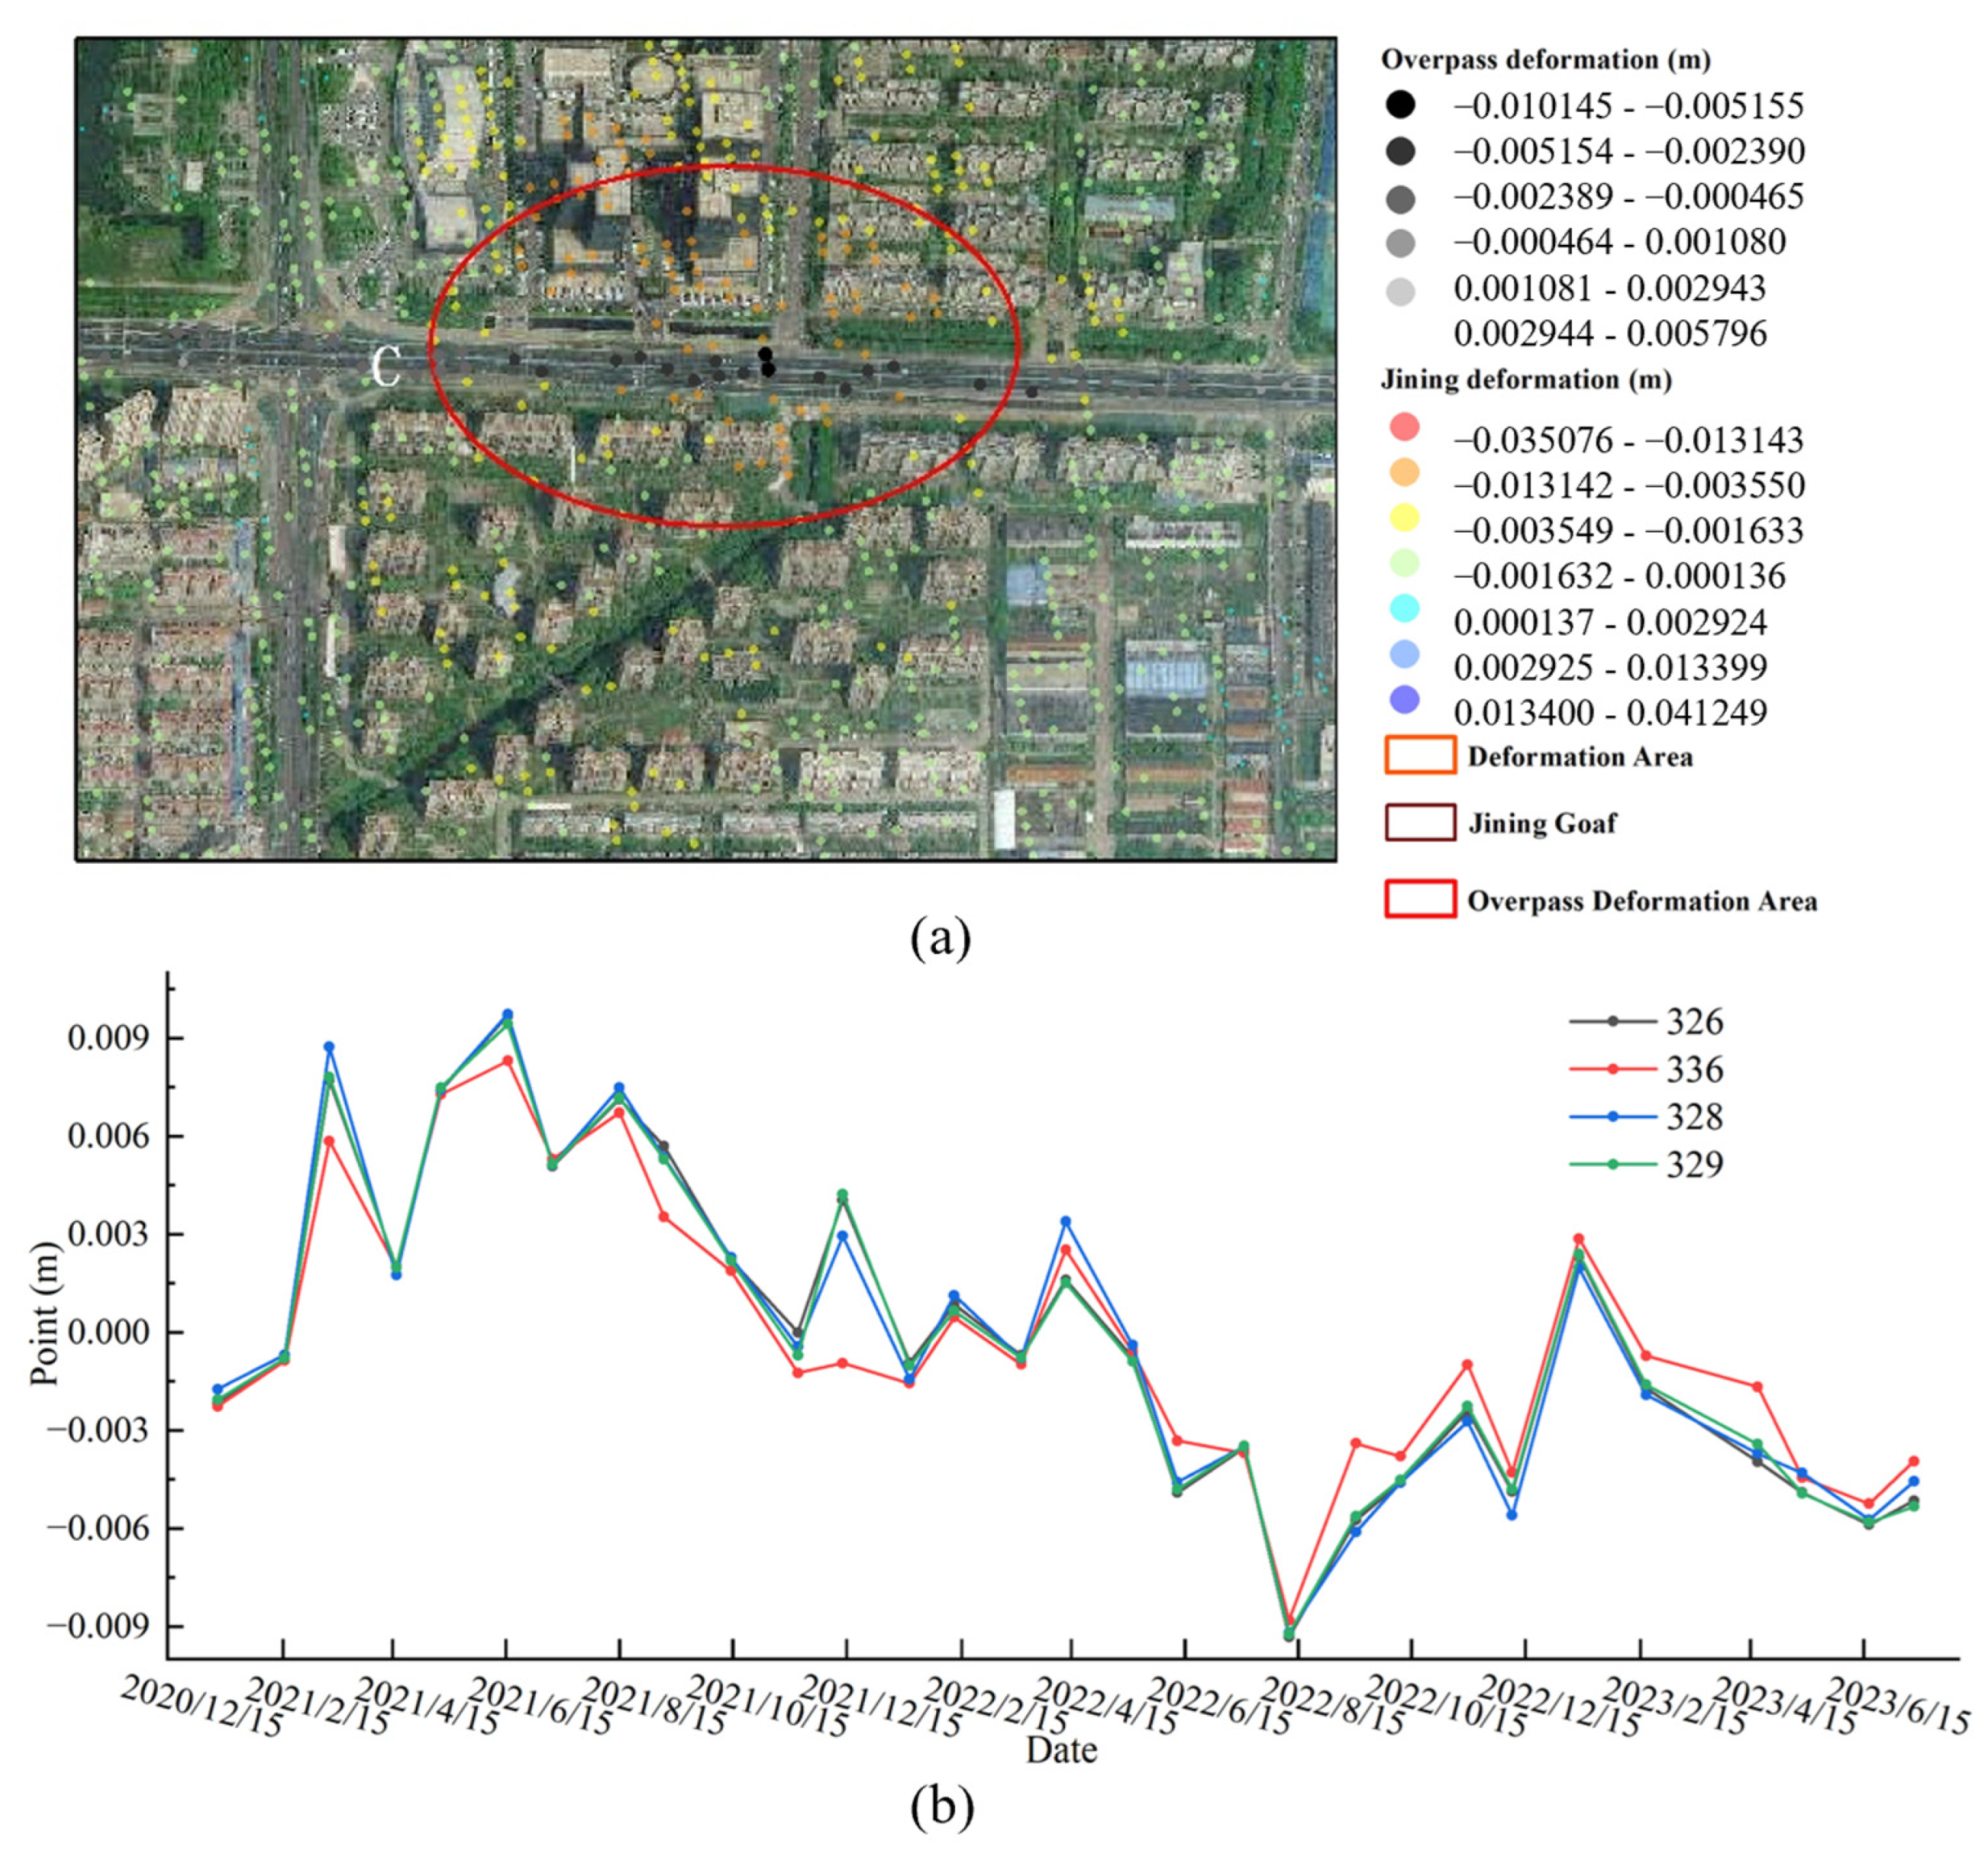
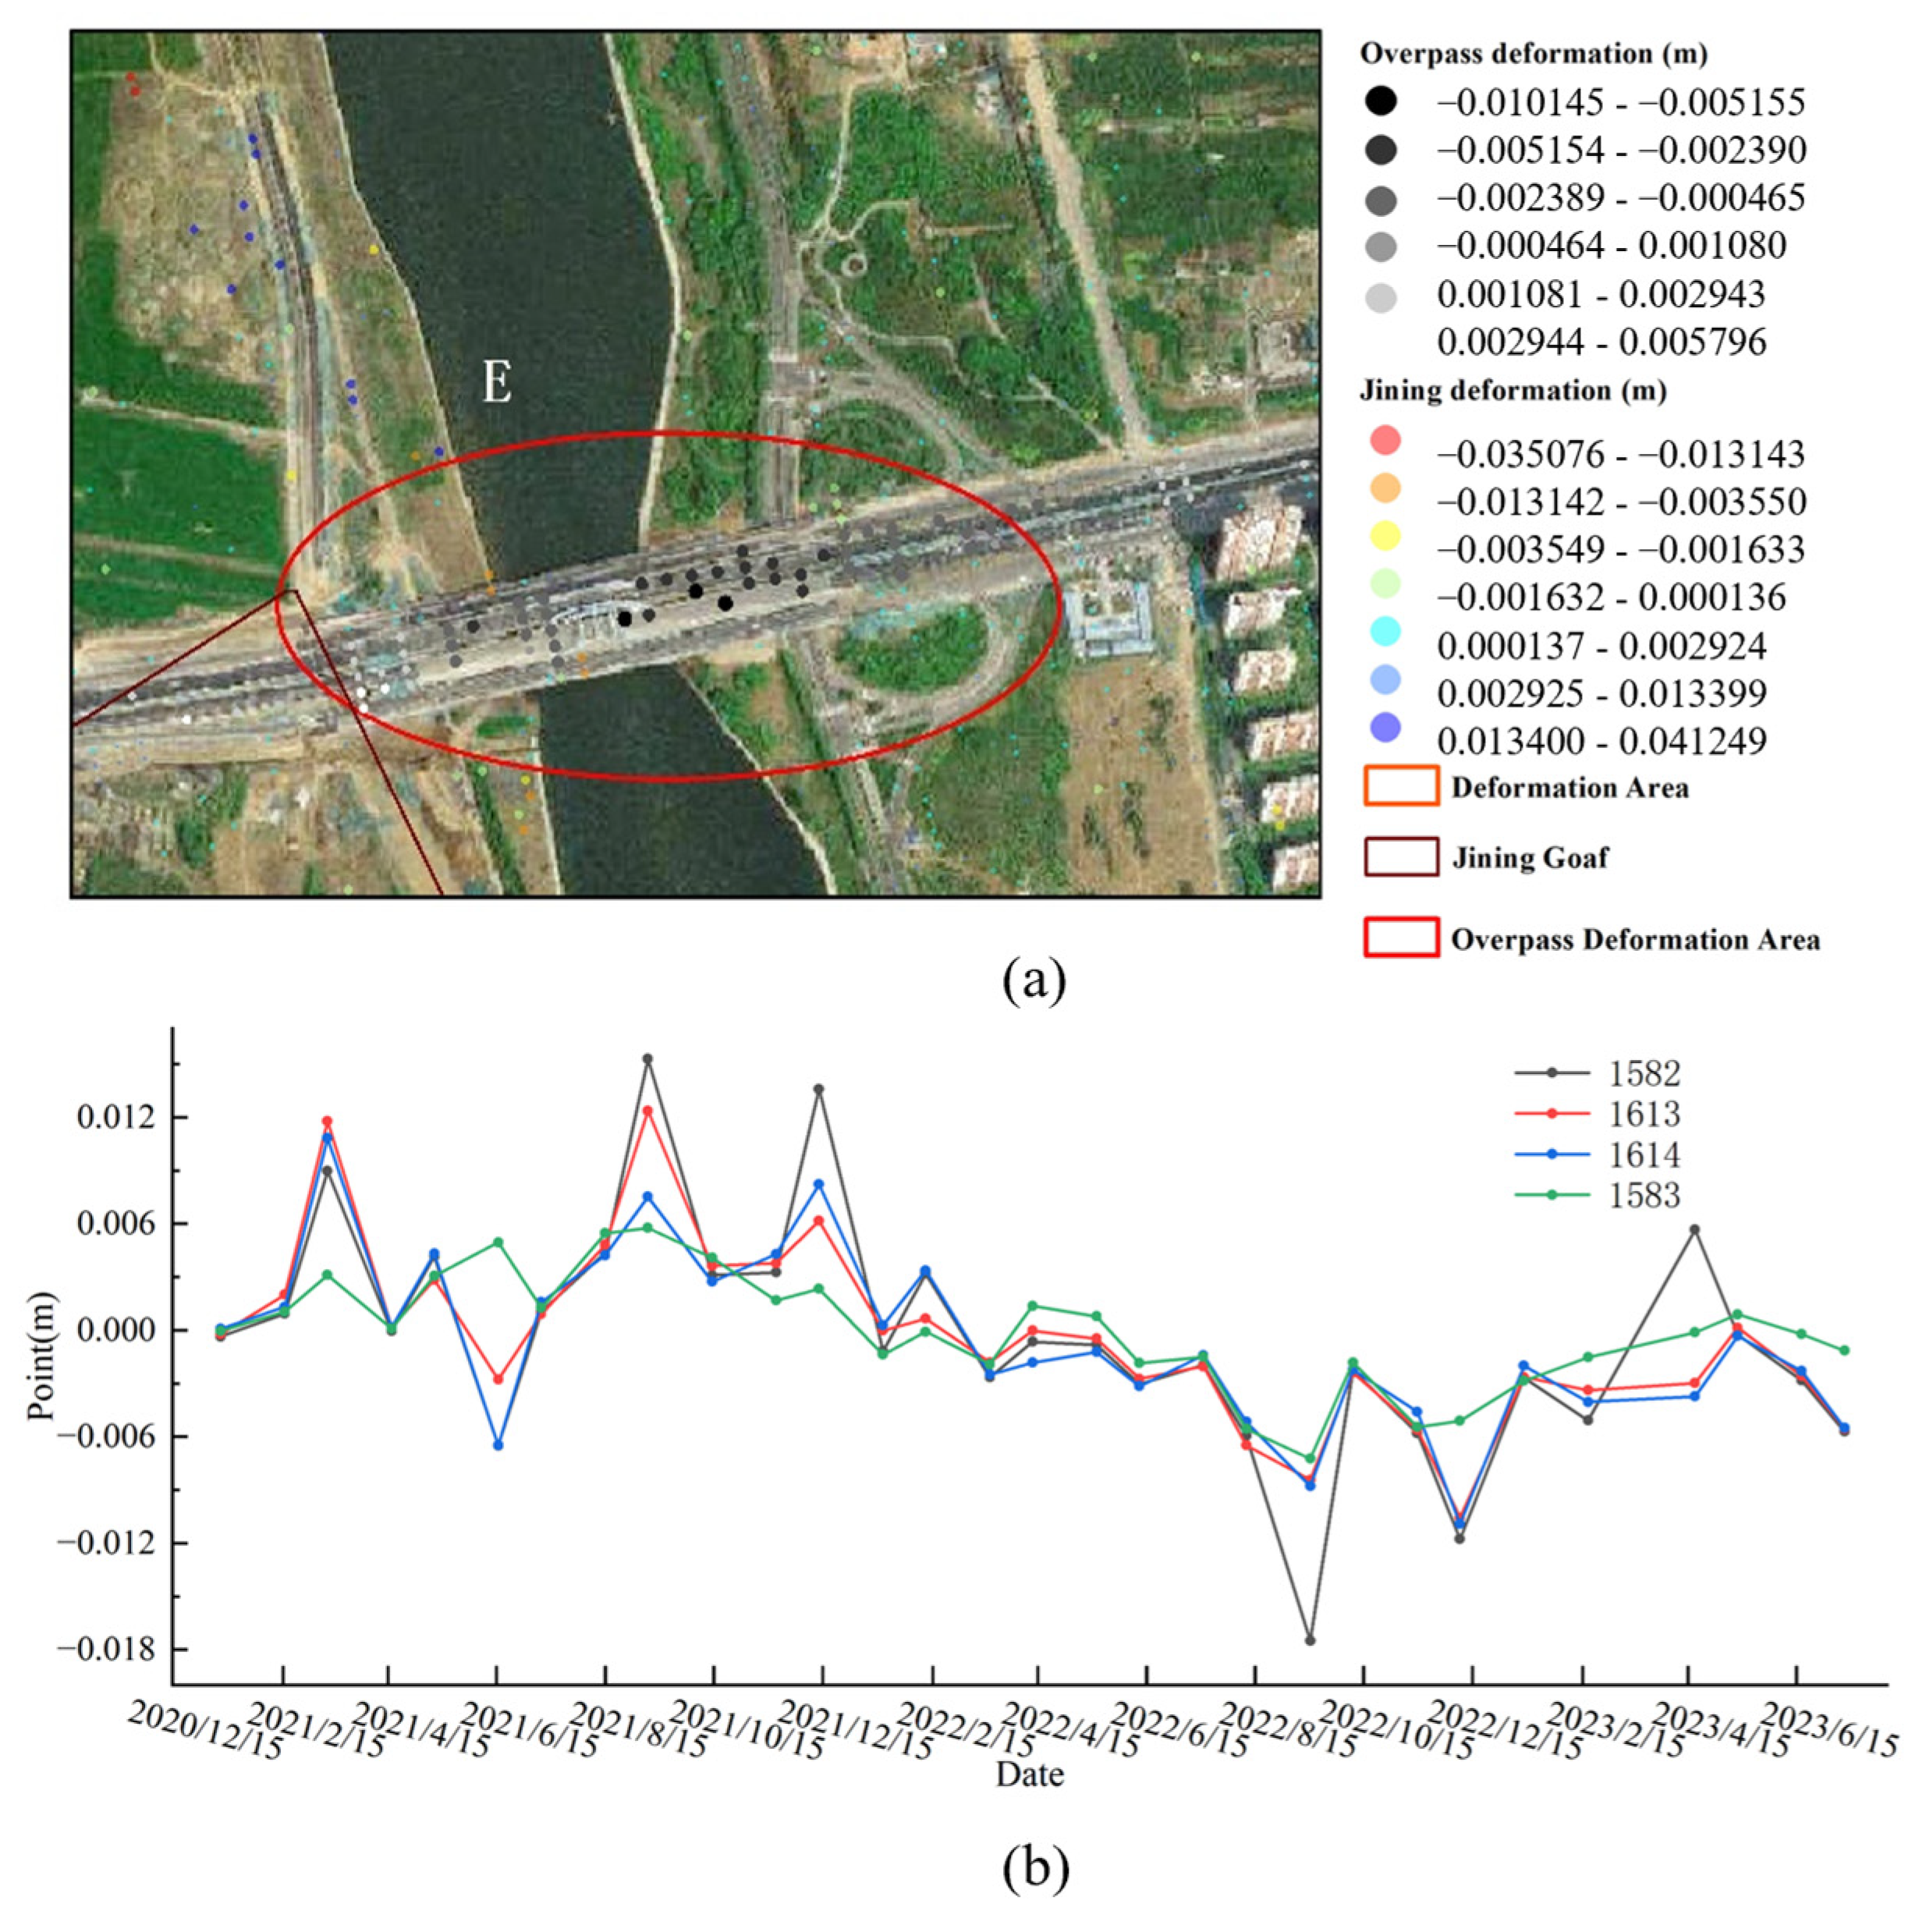
4.2. January 2021–July 2023 Monitoring Results and Analysis

In 2021, the main line of the inner ring elevated bridge became operational. For this period, a total of 31 satellite images were processed using SBAS-InSAR, resulting in a time-series deformation map for the region (Figure 10). Negative deformation values indicate subsidence, while positive values indicate uplift.
The above figure marks the location of the viaduct, and the bridge structure was well-covered by scattering points, allowing deformation information to be extracted. It was apparent that some deformation existed in the observation period. After the completion of the elevated bridge, deformation levels significantly decreased, and the area around the elevated bridge appeared to reach a stable state. The overall region experienced a change from a maximum deformation of −174 mm in December 2020 to a maximum deformation of −35.1 mm in July 2023. The mining subsidence area below the elevated bridge showed no significant deformation, while other areas of the elevated bridge exhibited substantial deformations, with the maximum deformation reaching −13.1 mm.
Due to the differential subsidence within the elevated bridge area, representative points A, B, C, D, and E were selected to explore the causes of subsidence. The deformations in areas F, G, H, and I within the city were also analyzed.
Area A is located at the Jing–Hang Grand Canal Bridge on the western outer ring road, with a maximum subsidence of approximately −8.50 mm. In Area A, the point with the maximum subsidence on the bridge deck was selected, along with an additional three arbitrary points, making a total of four points (Figure 11b). The points in Area A showed more fluctuation than those in Area B, but they showed roughly the same trend across all parts of the bridge, with no specific points showing anomalous displacement [25].
Area B is situated on Jishui Avenue, connected to Hongxing West Road on the right, with a maximum subsidence of approximately −6.88 mm. In Area B, five points were selected sequentially from south to north for time-series analysis (Figure 11c). This included the Songnan Village in Nanzhang Street, which has a total area of 0.4036 hectares and falls under the jurisdiction of Nanzhang Street. This land is designated for road use. The renovation of Guanghe Road includes road traffic improvements, road infrastructure upgrades, building facade enhancements, night lighting, and street lamps.
Area C is located above the elevated bridge on Rencheng Avenue, with a maximum subsidence of approximately −5.33 mm. In Area C, four points were chosen in sequence based on the subsidence values from inner-to-outer areas for time-series analysis (Figure 12).
Area D is positioned above the Inner Ring Elevated Bridge, where Beihu South Road intersects with Guangfu River. InSAR shows unique advantages in the safety monitoring of water-crossing bridges [23]. More monitoring sites can be detected in this area, but with this comes a greater need for safety assessment. The left side of the elevated bridge had a maximum subsidence of approximately −6.79 mm, the bridge above Guangfu River experienced a maximum subsidence of approximately −8.50 mm, and the right side of the elevated road had a maximum subsidence of approximately −10.15 mm. In Area D, six points were selected sequentially from left to right, according to the order of the bridges, for time-series analysis (Figure 13).
Area E is located above the bridge at the intersection of Jinan Avenue and the Beijing–Hangzhou Grand Canal. The maximum subsidence on the bridge deck was approximately −5.71 mm. Four points were selected sequentially based on the subsidence values in Area E (Figure 14).
In Figure 15a, Point F is situated at the intersection of Jin Yu Road and Huan Cheng West Road and exhibits a subsidence trend that spreads outward from the center. The reason for this subsidence is that Jin Yu Road is a major commercial area in the city, carrying a significant amount of traffic, which can lead to the road surface sinking and water accumulation.
In Figure 15b, Point G is located near the San Jia Village farmland. Due to the soft soil and high expansion coefficient of the farmland, coupled with heavy rainfall in the city from 2021 to the present year, most observation points experienced a phenomenon of subsidence and uplift, with relatively large fluctuations.
In Figure 15c, Point H is situated near the waters of a park. As mentioned earlier, there was an alternating pattern between semi-green land and water in March 2019. By December 2020, water had submerged a portion of the green land; by July 2023, most of the land had been covered by water. The primary reason for this subsidence is that this area is located above a large subsidence area that is continuously affected by its residual deformations, leading to rising water levels.
In Figure 15d, Point I is located near the Hu Village, and the minor deformations in this area are attributed to subsidence caused by nearby road construction on Ying Hui Road.
Further analyses revealed that the higher coherence of SBAS-InSAR was primarily observed in the urban and viaduct areas. However, challenges arise when attempting to obtain a sufficient number and density of coherent points in densely vegetated and water regions, potentially compromising the accuracy of water area monitoring. In addition, SBAS-InSAR will face challenges in detecting rapid or sudden surface deformations. This limitation could be addressed in future research by considering some long-term monitoring towards the continuous settlement point. Future research might consider the application of higher-resolution SAR imagery for regional monitoring or employing a combination of multiple datasets in the long term to enhance monitoring capabilities for urban areas and bridge underlying goaf sites. Safety monitoring of the viaduct in a coal resource city plays an important role in sustainable development.

5. Conclusions

This paper focuses on the elevated bridge site in a goaf site area in China, using SBAS-InSAR technology to monitor and analyze the site deformations during both the construction and operation phases of the elevated bridge. Correlation analysis of the bridge experimental area shows that the PS of the city in the region also maintains a good correlation. Variable analyses are conducted around monitoring points in the reflectance stability range. Finally, based on the results that the bridge area is in different degrees of deformation, the stability of the goaf is analyzed, and the area of surface subsidence is obtained by InSAR. The basic data of surface deformation monitoring are established in this area. These findings provide valuable insights for ensuring the safe operation of similar elevated bridges in coal-dependent cities globally and can lay the foundations for long-term monitoring. The results have important implications for the sustainable and safe utilization of subsidence land caused by mining in a coal resource-based city. The main conclusions are as follows:
  • SBAS-InSAR technology can effectively meet the safety monitoring requirements for elevated bridges in subsidence areas, thereby providing support for the safe operation of elevated bridges in coal-dependent cities.
  • During the period from March 2019 to December 2020, the cumulative maximum deformation in the subsidence area of the elevated bridge site was 44 mm and the maximum uplift was 22 mm, indicating a relatively stable site. However, protective measures should be implemented during the construction phase.
  • From January 2021 to July 2023, the cumulative maximum deformation in the subsidence area of the elevated bridge site was 10 mm, and the overall site remained stable. This deformation poses no threat to the safe construction and operation of regional elevated bridges.

Author Contributions

Conceptualization, H.L. (Huaizhan Li); methodology, H.L. (Hongjia Li); software, Y.C.; validation, Y.Y., Y.G. and S.L.; formal analysis, G.G.; investigation, H.L. (Huaizhan Li); resources, H.L. (Huaizhan Li); data curation, H.L. (Hongjia Li); writing—original draft preparation, H.L. (Hongjia Li); writing—review and editing, H.L. (Huaizhan Li); visualization, Y.Y.; supervision, Y.C.; project administration, G.G. All authors have read and agreed to the published version of the manuscript.

Funding

This work was funded by the National Key Research and Development Program of China (2023YFC3804201), the Natural Science Foundation of Jiangsu Province (BK20220158), the CNPC Innovation Found (2023DQ02–0108) and Postgraduate Research & Practice Innovation Program of Jiangsu Province (SJCX23_1316).

Institutional Review Board Statement

Not applicable.

Informed Consent Statement

Not applicable.

Data Availability Statement

The study area (Figure 2) and SAR Data Acquisition (Table 1 and Table 2) are available from the corresponding author upon reasonable request. Other data (data processing method) are proprietary in nature.

Conflicts of Interest

The authors declare no conflicts of interest.

References

  1. Ng, A.H.M.; Liu, Z.; Du, Z.; Huang, H.; Wang, H.; Ge, L. A novel framework for combining polarimetric Sentinel-1 InSAR time series in subsidence monitoring—A case study of Sydney. Remote Sens. Environ. 2023, 295, 113694. [Google Scholar] [CrossRef]
  2. Song, W.; Liu, J. Study on the utilization of Gob under the transformation condition of coal resource-based cities. In Proceedings of the 2012 China Urban Planning Annual Conference (02. Urban Master Planning), Yunnan, China, 17 October 2012. [Google Scholar]
  3. Dong, J.; Li, X.; Mei, Y.; Liu, S. Old goaf ground substation site stability of D-InSAR monitoring. J. Min. Saf. Eng. 2022, 33, 62–71. [Google Scholar]
  4. Ma, S.; Qiu, H.; Yang, D.; Wang, J.; Zhu, Y.; Tang, B.; Sun, K.; Cao, M. Surface multi-hazard effect of underground coal mining. Landslides 2023, 20, 39–52. [Google Scholar] [CrossRef]
  5. Gagliardi, V.; Tosti, F.; Bianchini Ciampoli, L.; Battagliere, M.L.; D’Amato, L.; Alani, A.M.; Benedetto, A. Satellite Remote Sensing and Non-Destructive Testing Methods for Transport Infrastructure Monitoring: Advances, Challenges and Perspectives. Remote Sens. 2023, 15, 418. [Google Scholar] [CrossRef]
  6. Xiong, S.; Wang, C.; Qin, X.; Zhang, B.; Li, Q. Time-Series Analysis on Persistent Scatter-Interferometric Synthetic Aperture Radar (PS-InSAR) Derived Displacements of the Hong Kong–Zhuhai–Macao Bridge (HZMB) from Sentinel-1A Observations. Remote Sens. 2021, 13, 546. [Google Scholar] [CrossRef]
  7. Lan, H.; Li, L.; Liu, H.; Yang, Z. Complex Urban Infrastructure Deformation Monitoring Using High Resolution PSI. IEEE J. Sel. Top. Appl. Earth Obs. Remote Sens. 2012, 5, 643–651. [Google Scholar] [CrossRef]
  8. Wang, Y.; Zhu, X.; Zeisl, B.; Pollefeys, M. Fusing Meter-Resolution 4-D InSAR Point Clouds and Optical Images for Semantic Urban Infrastructure Monitoring. IEEE Trans. Geosci. Remote Sens. 2017, 55, 14–26. [Google Scholar] [CrossRef]
  9. Chen, Y.; Dong, X.; Qi, Y.; Huang, P.; Sun, W.; Xu, W.; Tan, W.; Li, X.; Liu, X. Integration of DInSAR-PS-Stacking and SBAS-PS-InSAR Methods to Monitor Mining-Related Surface Subsidence. Remote Sens. 2023, 15, 2691. [Google Scholar] [CrossRef]
  10. Ferretti, A.; Prati, C.; Rocca, F. Permanent scatterers in SAR interferometry. IEEE Trans. Geosci. Remote Sens. 2001, 39, 8–20. [Google Scholar] [CrossRef]
  11. Sun, M.; Du, Y.; Liu, Q.; Feng, G.; Peng, X.; Liao, C. Understanding the Spatial-Temporal Characteristics of Land Subsidence in Shenzhen under Rapid Urbanization Based on MT-InSAR. IEEE J. Sel. Top. Appl. Earth Obs. Remote Sens. 2023, 16, 4153–4166. [Google Scholar] [CrossRef]
  12. Baltiyeva, A.; Orynbassarova, E.; Zharaspaev, M.; Akhmetov, R. Studying sinkholes of the earth’s surface involving radar satellite interferometry in terms of Zhezkazgan field, Kazakhstan. Min. Miner. Depos. 2023, 17, 61–74. [Google Scholar] [CrossRef]
  13. Hendrix, R.; Ooi, P. Interferometric Synthetic Aperture Radar versus Inclinometer Ground Surface Deformations at Active Landslide. Transp. Res. Rec. 2023, 2677, 736–747. [Google Scholar] [CrossRef]
  14. Necsoiu, M.; Mcginnis, R.N.; Hooper, D.M. New insights on the Salmon Falls Creek Canyon landslide complex based on geomorphological analysis and multitemporal satellite InSAR techniques. Landslides 2014, 11, 1141–1153. [Google Scholar] [CrossRef]
  15. Li, F.; Liu, G.; Gong, H.; Chen, B.; Zhou, C. Assessing Land Subsidence-Inducing Factors in the Shandong Province, China, by Using PS-InSAR Measurements. Remote Sens. 2022, 14, 2875. [Google Scholar] [CrossRef]
  16. Ou, W.; Zhao, B.; Zhi, Y.; Fei, X.; Ma, X.; Yang, G. Research on Displacement Monitoring Technique for Goaf along Power Transmission Line Based on GF-3 Satellite Data. In Proceedings of the International Conference on Information Science and Control Engineering (ICISCE), Shanghai, China, 20–22 December 2019. [Google Scholar]
  17. Chen, Y.; Yu, S.; Tao, Q.; Liu, G.; Wang, L.; Wang, F. Accuracy Verification and Correction of D-InSAR and SBAS-InSAR in Monitoring Mining Surface Subsidence. Remote Sens. 2021, 13, 4365. [Google Scholar] [CrossRef]
  18. Li, Y.; Yang, K.; Zhang, J.; Hou, Z.; Wang, S.; Ding, X. Research on time series InSAR monitoring method for multiple types of surface deformation in mining area. Nat. Hazards 2022, 114, 2479–2508. [Google Scholar] [CrossRef]
  19. Zheng, M.; Guo, Q.; Zhao, R.; Wang, L.; Huang, Y. Surface subsidence disasters over Xuzhou city, China 2014–2018 revealed by InSAR and Peck model. Environ. Earth Sci. 2023, 82, 264. [Google Scholar]
  20. Cusson, D.; Trischuk, K.; Hébert, D.; Hewus, G.; Gara, M.; Ghuman, P. Satellite-Based InSAR Monitoring of Highway Bridges: Validation Case Study on the North Channel Bridge in Ontario, Canada. Transp. Res. Rec. 2018, 2672, 76–86. [Google Scholar] [CrossRef]
  21. Zhang, Z.; Wang, M.; Liu, X.; Wang, C.; Zhang, H.; Tang, Y.; Zhang, B. Deformation Feature Analysis of Qinghai–Tibet Railway Using TerraSAR-X and Sentinel-1A Time-Series Interferometry. IEEE J. Sel. Top. Appl. Earth Obs. Remote Sens. 2019, 12, 5199–5212. [Google Scholar] [CrossRef]
  22. Wang, N.; Dong, J.; Wang, Z.; Lei, J.; Zhang, L.; Liao, M. Monitoring Large-Scale Hydraulic Engineering Using Sentinel-1 InSAR: A Case Study of China’s South-to-North Water Diversion Middle Route Project. IEEE J. Sel. Top. Appl. Earth Obs. Remote Sens. 2022, 15, 739–750. [Google Scholar] [CrossRef]
  23. Qin, X.; Li, Q.; Ding, X.; Xie, L.; Wang, C.; Liao, M.; Zhang, L.; Zhang, B.; Xiong, S. A structure knowledge-synthetic aperture radar interferometry integration method for high-precision deformation monitoring and risk identification of sea-crossing bridges. Int. J. Appl. Earth Obs. Geoinf. 2021, 103, 102476. [Google Scholar] [CrossRef]
  24. Tao, W.; Dai, L.; Zhang, Z.; Tang, B.; Yu, L. Stability Analysis Model of Expressway Passing through Goaf Based on SBAS-InSAR Technology. Math. Probl. Eng. 2022, 2022, 7006464. [Google Scholar] [CrossRef]
  25. Kinoshita, K.; Kumura, T.; Yamaguchi, Y.; Tanaka, T. Anomalous Displacement Detection of Bridges Using Satellite SAR: A Case Study on a Collapse of Musota Water Pipe Bridge. In Proceedings of the IGARSS 2023—2023 IEEE International Geoscience and Remote Sensing Symposium, Pasadena, CA, USA, 16–21 July 2023; pp. 1720–1723. [Google Scholar]
  26. Wang, Z.; Zhang, J.; Huang, G. Precise monitoring and analysis of the land subsidence in Jining coal mining area based on InSAR technique. J. China Univ. Min. 2014, 43, 169–174. [Google Scholar]
  27. Guo, S.; Ji, Y.; Tian, X.; Zhang, W.; Kang, W.; Li, Y.; Zhang, T. Deformation Velocity Monitoring in Kunming City using Ascending and Descending Sentinel-1A Data with SBAS-InSAR Technique. In Proceedings of the IGARSS 2020—2020 IEEE International Geoscience and Remote Sensing Symposium, Waikoloa, HI, USA, 26 September–2 October 2020; pp. 1993–1996. [Google Scholar]
  28. Xu, Y.; Li, T.; Tang, X.; Zhang, X.; Fan, H.; Wang, Y. Research on the Applicability of DInSAR, Stacking-InSAR and SBAS-InSAR for Mining Region Subsidence Detection in the Datong Coalfield. Remote Sens. 2022, 14, 3314. [Google Scholar] [CrossRef]
  29. Berardino, P.; Fornaro, G.; Lanari, R.; Sansosti, E. A new algorithm for surface deformation monitoring based on Small Baseline Differential SAR Interferograms. IEEE Trans. Geosci. Remote Sens. 2002, 40, 2375–2383. [Google Scholar] [CrossRef]
  30. Dong, S.; Samsonov, S.; Yin, H.; Ye, S.; Cao, Y. Time-series analysis of subsidence associated with rapid urbanization in Shanghai, China measured with SBAS InSAR method. Environ. Earth Sci. 2014, 72, 677–691. [Google Scholar] [CrossRef]
  31. Wegmuller, U.; Werner, C.; Strozzi, T. SAR interferometric and differential interferometric processing chain. In Proceedings of the Sensing and Managing the Environment 1998 IEEE International Geoscience and Remote Sensing. Symposium, Seattle, WA, USA, 6–10 July 1998. [Google Scholar]
  32. Hooper, A.; Zebker, H.; Segall, P.; Kampes, B. A new method for measuring deformation on volcanoes and other natural terrains using InSAR persistent scatterers. Geophys. Res. Lett. 2004, 31. [Google Scholar] [CrossRef]
  33. Hooper, A.; Segall, P.; Zebker, H. Persistent scatterer interferometric synthetic aperture radar for crustal deformation analysis with application to Volcán Alcedo Galápagos. J. Geophys. Res. 2007, 112. [Google Scholar] [CrossRef]
  34. Du, Y.; Liu, L.; Feng, G.; Peng, X.; Liang, H.; Zhu, Y. Time-Series Landslide Monitoring Based on Stamps-Sbas: A Case Study in Lushan, Taiwan. In Proceedings of the IEEE International Geoscience and Remote Sensing Symposium, Yokohama, Japan, 28 July–2 August 2019; pp. 9622–9625. [Google Scholar]
  35. Vajedian, S.; Motagh, M.; Nilfouroushan, F. StaMPS Improvement for Deformation Analysis in Mountainous Regions: Implications for the Damavand Volcano and Mosha Fault in Alborz. Remote Sens. 2015, 7, 8323–8347. [Google Scholar] [CrossRef]
Figure 1. Geographical location map of the inner ring viaduct.
Sustainability 16 06115 g001
Figure 2. Location diagram of the viaduct.
Sustainability 16 06115 g002
Figure 3. Technical flow chart.
Sustainability 16 06115 g003
Figure 4. Space–time baseline diagram. (a) Space–time baseline diagram from March 2019 to December 2020. (b) Space–time baseline diagram from January 2021 to July 2023.
Sustainability 16 06115 g004
Figure 5. Time-series deformation rate. (a) The average deformation rate of LOS direction from March 2019 to December 2020. (b) The average deformation rate of LOS direction from January 2021 to July 2023.
Sustainability 16 06115 g005
Figure 6. Cumulative deformation rate in March 2019–December 2020.
Sustainability 16 06115 g006
Figure 7. Regional cumulative shape variable of the goaf under the viaduct. (a) Regional shape variable of A. (b) Regional shape variable of B. (c) Regional shape variable of C. (d) Regional shape variable of D.
Sustainability 16 06115 g007
Figure 8. Deformation of non-viaduct area. (a) Deformation of E area. (b) Deformation of F area. (c) Deformation of G area. (d) Deformation of H area.
Sustainability 16 06115 g008
Figure 9. Comparison of deformation in G region especially in red box. (a) Pictures taken on March 2019. (b) Pictures taken on December 2020.
Sustainability 16 06115 g009
Figure 10. Cumulative deformation diagram of January 2021–July 2023 time series.
Sustainability 16 06115 g010
Figure 11. Cumulative shape variables of viaduct Areas A and B. (a) Location and shape variables of Areas A and B. (b) Settlement value point of Area A. (c) Settlement value point of Area B.
Sustainability 16 06115 g011
Figure 12. Cumulative shape variable of the viaduct in Area C. (a) Location of Area C and shape variable diagram. (b) Settlement value point of Area C.
Sustainability 16 06115 g012
Figure 13. Cumulative shape variables. (a) D region location and shape variable diagram. (b) D region settlement value point.
Sustainability 16 06115 g013
Figure 14. Cumulative shape variables of the viaduct in Area E. (a) Location of Area E and shape variable diagram. (b) Settlement value point of Area E.
Sustainability 16 06115 g014
Figure 15. Cumulative shape variables of the viaduct in F region. (a) F region location and shape variables diagram. (b) G region location and shape variables diagram. (c) H region location and shape variables diagram. (d) I region location and shape variables diagram.
Sustainability 16 06115 g015
Table 1. SAR Data Acquisition Timeframes: March 2019 to December 2020.
NumberImaging DateOrbitNumberImaging DateOrbit
123 March 2019Ascending1210 February 2020Ascending
228 April 2019Ascending1317 March 2020Ascending
322 May 2019Ascending1410 April 2020Ascending
427 June 2019Ascending1516 May 2020Ascending
521 July 2019Ascending1621 June 2020Ascending
626 August 2019Ascending1715 July 2020Ascending
719 September 2019Ascending1820 August 2020Ascending
825 October 2019Ascending1913 September 2020Ascending
918 November 2019Ascending2019 October 2020Ascending
1014 December 2019Ascending2112 November 2020Ascending
1117 January 2020Ascending2230 December 2020Ascending
Table 2. SAR Data Acquisition Timeframes: January 2021 to July 2023.
NumberImaging DateOrbitNumberImaging DateOrbit
111 January 2021Ascending1718 May 2022Ascending
216 February 2021Ascending1811 June 2022Ascending
312 March 2021Ascending1917 July 2022Ascending
417 April 2021Ascending2010 August 2022Ascending
511 May 2021Ascending2115 September 2022Ascending
616 June 2021Ascending2209 October 2022Ascending
710 July 2021Ascending2314 November 2022Ascending
815 August 2021Ascending2408 December 2022Ascending
908 September 2021Ascending2513 January 2023Ascending
1014 October 2021Ascending2618 February 2023Ascending
1119 November 2021Ascending2714 March 2023Ascending
1213 December 2021Ascending2819 April 2023Ascending
1318 January 2022Ascending2913 May 2023Ascending
1411 February 2022Ascending3018 June 2023Ascending
1519 March 2022Ascending3112 July 2023Ascending
1612 April 2022Ascending
Disclaimer/Publisher’s Note: The statements, opinions and data contained in all publications are solely those of the individual author(s) and contributor(s) and not of MDPI and/or the editor(s). MDPI and/or the editor(s) disclaim responsibility for any injury to people or property resulting from any ideas, methods, instructions or products referred to in the content.

