Article

Urban Air Pollution Exposure Impact on COVID-19 Transmission in a Few Metropolitan Regions

ITC Department, National Institute of R&D for Optoelectronics, 409 Atomistilor Street, MG5, 077125 Magurele, Romania
*
Author to whom correspondence should be addressed.
Sustainability 2024, 16(14), 6119; https://doi.org/10.3390/su16146119
Submission received: 26 April 2024 / Revised: 25 June 2024 / Accepted: 10 July 2024 / Published: 17 July 2024
(This article belongs to the Section Pollution Prevention, Mitigation and Sustainability)

Abstract

:
Based on outdoor air pollution and meteorological daily time series observational and in-situ monitoring data, this study investigated the impacts of environmental factors under different urban climates on COVID-19 transmission in four hotspot European metropolises (Berlin, London, Madrid, and Paris) from March 2020 to March 2022. Through applied statistical methods and cross-correlation tests involving multiple datasets pertaining to the main air pollutants (inhalable particulate matter PM2.5 and PM10, nitrogen dioxide (NO2), and ozone (O3)) and climate parameters (air temperature at 2 m height, relative humidity, wind speed intensity and direction, planetary boundary layer height, and surface solar irradiance), a direct positive impact of aerosol loading (PM2.5, PM10, and aerosol optical depth (AOD)) on COVID-19 spreading and severity was revealed. Despite some urban differences existing between the selected cities, particularly for the spring–summer periods, we have observed negative correlations between daily new COVID-19 cases and deaths and daily average ground-level ozone concentration, air temperature at 2 m height, planetary boundary layer height, and surface solar irradiance. Air relative humidity and urban population density have a direct impact on COVID-19 diffusion in large metropolitan areas, and the findings of this study highlight the crucial role of air pollution, in synergy with climate variability, in viral pathogens dispersion in COVID-19 transmission in large urban areas. This information can be used by decision-makers to develop targeted interventions during epidemic periods to reduce the potential risks associated with air pollution exposure and to promote the sustainable development of urban economies.

1. Introduction

Since late December 2019, when coronavirus disease COVID-19 was recorded for the first time in Wuhan, China, the pandemic outbreak has rapidly extended globally, reaching almost every country, with a higher intensity in metropolitan areas. It emerged as a public health crisis, testing the resilience of health systems, and it was established that the severity of the cases, as well as their lethality, was linked to the patient’s environmental and underlying health conditions. In large cities, the global severity of COVID-19 infectious disease, attributed to SARS-CoV-2 pathogens, has been associated with various urban characteristics (size, form, landscape, density of population, mobility, micro and macroclimate, and socioeconomic and environmental pollution), including exposure to ambient air pollutants. Air pollution containing inhalable particulate matter (PM) and gaseous pollutants is a major global health issue and a significant risk factor for cardiorespiratory illnesses. High-quality, science-based air pollution–climate interaction information regarding infectious disease spread and survival in large metropolitan areas is crucial for urban decision-makers and residents in preparing for future epidemics and adapting to climate change. The most recent global crisis generated by the COVID-19 pandemic, an airborne pathogen responsible for upper-respiratory infection, amplified sustainability issues through its challenge to healthcare systems and the economy worldwide [1,2]. From a sustainability perspective, due to its borderless nature, the COVID-19 pandemic, which spanned more than two years, was considered a meaningful crisis driver that affected different nations’ economies and social metropolises in different ways. However, in the face of accelerating urbanization, during viral pandemic periods, the issue of complex air pollution in European metropolitan cities was amplified, posing a serious threat to the environment, with a high risk to public health and the ecosystem [3,4]. However, short- or long-term exposure to the airborne particulate matter (PM) of biogenic or chemical compounds, with different size fractions (1 nm to 100 μm), considered potential carriers of SARS-CoV-2 pathogens responsible for the COVID-19 disease, is recognized as the fourth leading risk factor for disease and death related to the activation of inflammatory lung cells [5,6].
Several studies suggested that air pollutants could induce cell entry of SARS-CoV-2 pathogens and modulate the cellular response to the virus. Among the PM, due to its physicochemical characteristics, PM2.5 exposure is the most hazardous, with this air pollutant being one of the main drivers of the cardiorespiratory and systemic effects inducing lung oxidative stress and inflammation [7,8].
Like other airway diseases, including rhinitis, asthma, seasonal influenza (commonly known as the “flu”), organic dust toxic syndrome, and severe acute respiratory syndrome, coronavirus disease is related to outdoor and indoor bioaerosol exposure in highly agglomerated urban areas [9,10,11,12]. During the recent deadly pandemic outbreak of COVID-19, monitoring for airborne viral pathogens in cities with advanced bioaerosol technologies detected the presence of SARS-CoV-2 in indoor and outdoor air samples [13,14,15]. Knowledge of the main sources and transport pathways of viral bioaerosols is essential to understanding the role played by several pathogens in the lower atmosphere and controlling the transmission of the epidemic diseases associated with them [16,17]. At high levels and with acute or chronic inhalation exposure in the outdoor atmosphere to the most hazardous air pollutants (particulate matter in different size fractions: PM2.5 and PM1)—and, at the ground level, gaseous pollutants (ozone (O3), nitrogen dioxide (NO2), sulfur dioxide (SO2), carbon monoxide (CO), and benzene (C6H6))—this may cause various disorders of the human cardiorespiratory system and a decrease in the immune system, facilitating SARS-CoV-2’s viral entry [18]. Experimental and epidemiological studies demonstrated that among particulate matter, the fine particulate matter (PM2.5) is the most detrimental of the air pollutants, capable of penetrating human lungs and the cardiorespiratory system and leading to potentially lethal pulmonary and cardiovascular diseases [19].
The connection between air pollution, meteorological factors that affect the thermodynamic processes of the near-surface atmosphere, and SARS-CoV-2 pathogens is likely multifactorial, including impacts on virus stability and viability, host susceptibility, and human behavior [20]. The urban/periurban air pollution shows clear local and regional characteristics, being affected by the unique topography and the microclimate of the region [21]. Alongside local and regional air pollution sources, climate factors such as seasonality and the increased frequency of extreme climate events impact air quality and are of widespread public concern [22]. Aerosol optical depth (AOD) is sensitive to multiple air pollutants in the lower atmospheric system, including sulfur, black carbon, and organic components, being a marker of total columnar aerosol loading. This study used AOD spatiotemporal variability, the most relevant parameter for aerosol forcing assessment in the atmosphere with a high impact on urban air quality and atmospheric process dynamics.
Also, climate factors such as air temperature at 2 m height, air pressure, air relative humidity, surface solar irradiance, wind speed intensity and direction, and planetary boundary layer height and their cumulative effects at urban and regional scales may have great significant impacts in terms of the persistence of viral infections in aerosols and viral infections transmission [23,24,25].
In particular, the daily planetary boundary layer height (PBL) characteristics are closely related to the dispersion and transport of solid and gaseous pollutants affecting air quality atmospheric process dynamics and the spatiotemporal distribution of air pollutant concentrations [26].
Starting from the pioneering climate research of the last century, Richter C.M., in 1911 [27], found correlations between climate conditions (solar activity, atmospheric pressure, and air quality) and the prevalence of viral respiratory infections (pneumonia, influenza, enteroviruses) which caused seasonal epidemics and pandemics, with their transmission influenced by climate conditions in large cities in the United States of America (Chicago and San Francisco). Some previous studies have explored the connections between the seasonality of meteorological conditions associated with extreme climate events and the seasonal large-scale outbreaks of different viral infections such as SARS (severe acute respiratory syndrome) in 2002–2003, influenza H1N1 in 2009, MERS (Middle East respiratory syndrome) in 2012–2015, and new waves of SARS-CoV-2 (COVID-19) in 2019, with severe impacts on excess human lethality and morbidity and significant economic disruption. The existing scientific literature provides information on seasonal variability in the bacterial and fungal diversity of the near-surface atmosphere, which can target the human immune system through the damage of innate immune recognition receptors that respond to unique pathogen-associated molecular patterns [28,29,30,31,32,33]. Recent advances in the toxicological study of the mechanisms associated with airway diseases attributed to air pollutants have considered the epigenetic alteration of genes by combustion-related pollutants and how polymorphisms in the genes involved in antioxidant pathways and airway inflammation can modify responses to air pollution exposures [34,35,36,37,38,39].
Also, solar radiation, through its ultraviolet electromagnetic band regions UVB (280–315 nm) and UVA (315–400 nm), is the primary virucidal agent in the environment [40,41,42,43]. It is well recognized as an important variable that may affect the transmission and outcomes of COVID-19 through the reduction of SARS-CoV-2 pathogen diffusion and virus inactivation during specific periods of exposure [44,45]. Through vitamin D synthesis in the human body, solar radiation plays an essential role in increasing the innate and adaptative immune systems’ defense, thus reducing the risk, severity, and mortality of respiratory viral tract diseases like COVID-19 and influenza [46,47,48,49].
Due to ongoing urban growth, with different air quality levels, as well as climate and socioeconomic conditions, metropolitan agglomerated areas worldwide are often under increased pressure from epidemic viral diseases [50]. It is well known that urban green areas in public spaces are critical during epidemic events due to their air-pollutants-removal capacity, regulating surface temperature and lowering the urban heat island effect, contributing to the city’s environmental health [51]. This paper aims to provide scientific evidence on the influence of climate variability and ground surface air pollution on the fast diffusion of COVID-19 in four European selected metropolises (Berlin, London, Madrid, and Paris) between March 2020 and March 2022. Considering the importance of different lockdown restrictions and exploring the effects of exposure to particulate matter (PM) on the risk of severe COVID-19, this study conducts a time series comparative analysis of the differences in daily urban COVID-19 incidence and mortality, the daily average concentrations of air pollutants at ground level, and climate variables.

2. Material and Method

2.1. Study Test Metropolitan Areas

Since anthropogenic emissions and meteorological background differ in different metropolitan regions in Europe, four representative metropolitan areas with specific climate and urban morphology/geometry features have been selected in this study (Figure 1):
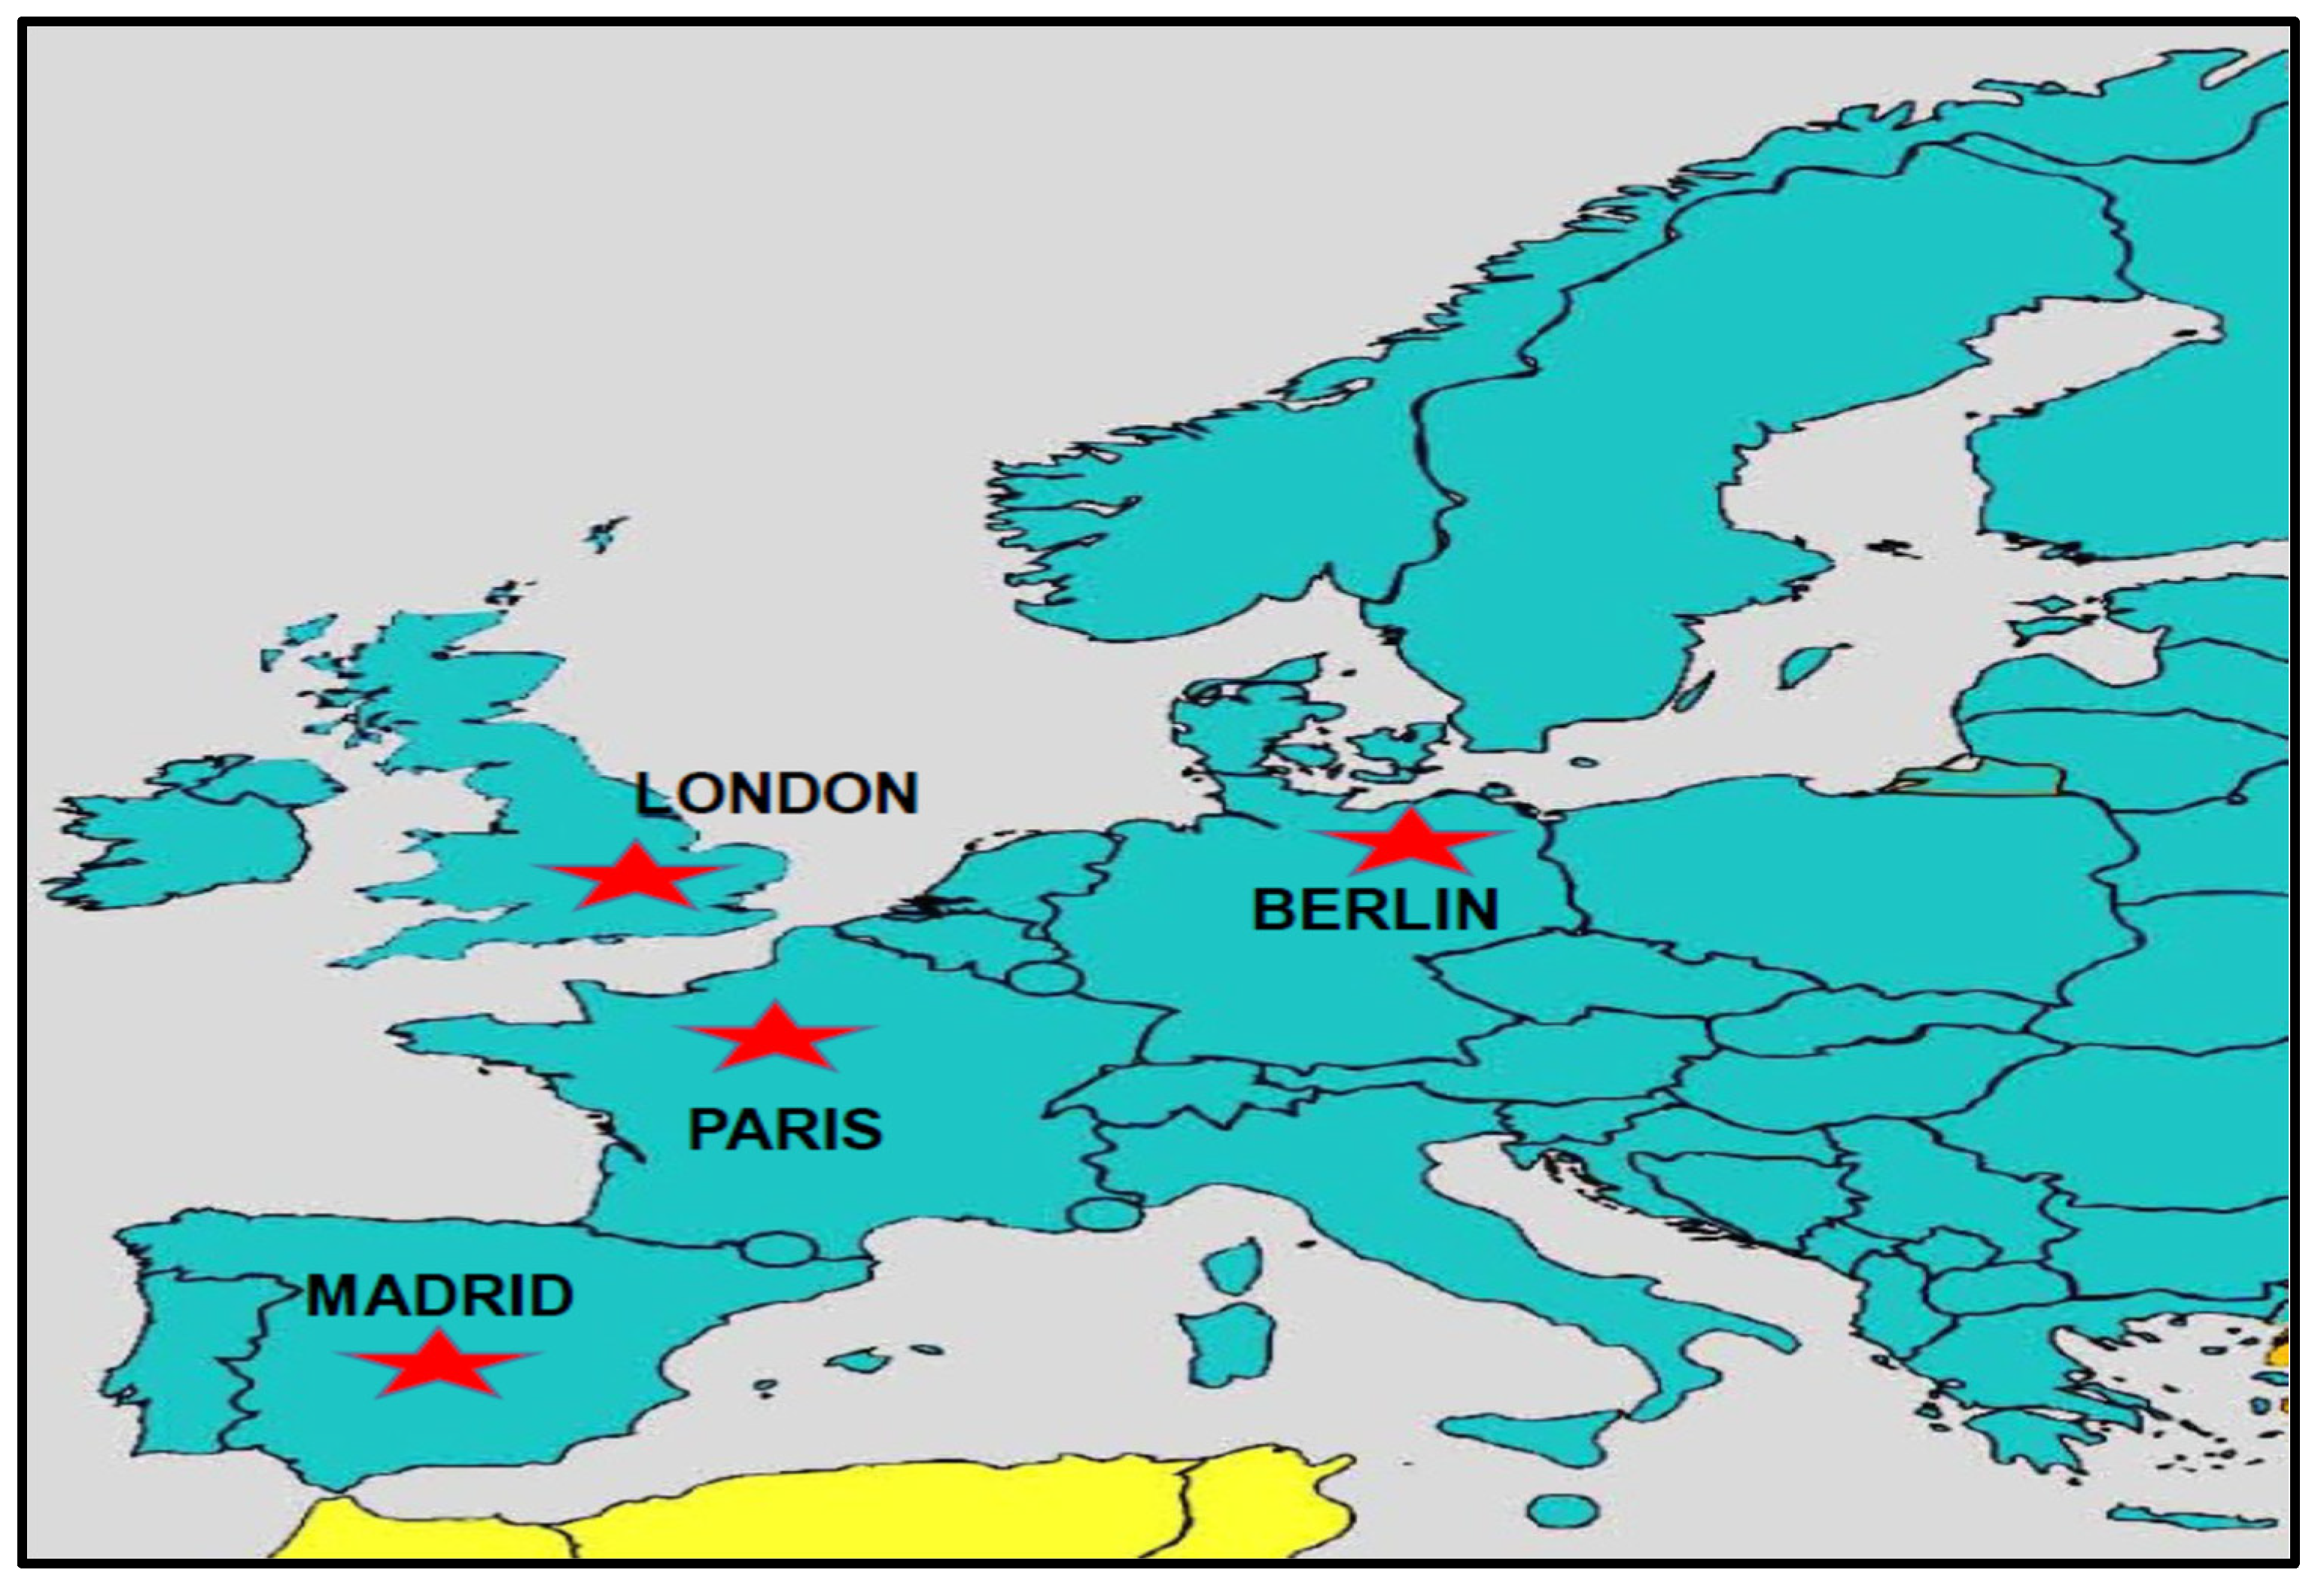
  • Berlin (52°31′ N 13°20′ E), the German capital located in northeastern Germany, with a surface of 1368 km2, has a predominantly flat topography, with a mean elevation of 35 m above sea level, and a temperate climate with precipitation in all seasons [52];
  • London (51.33° N, 0.42° W), the largest European city and the second-largest economic center globally, with a surface of 1738 km2 and dense road traffic, placed in the southeastern part of England, mostly consisting of low-land terrain with a mean elevation of 42 m, has a temperate, oceanic climate with cool winters, warm summers, and precipitation fairly evenly distributed all year round [53];
  • Madrid (40.42° N, 3.70° W), the largest metropolitan area in Spain, and the third largest city in the European Union, with a surface of 1365 km2, has a Mediterranean climate with continental influences, characterized by hot summers and cool winters. The urban area is settled on an uneven plain, approximately 700 m high, with the lowest altitudes of the basin located in the southeast, away from the mountains [54].
  • Paris (48°51′24″ N 2°21′3″ E), the capital of France, located in a relatively flat area with a mean elevation of 62 m, has a surface of 2844 km2 and a typical Western European climate, affected by its proximity to the Atlantic Ocean, being mild and moderately wet [55] with cool winters with frequent rain and overcast skies and mild-to-warm summers.
The populations of these metropolitan test areas are quite different: Berlin has 5.35 million inhabitants; London, 14.4 inhabitants; Madrid, 6.98 inhabitants; and Paris, more than 12.92 million in the adjoining urban agglomeration. According to the Urban PM2.5 Atlas, most European cities are characterized by poor air quality, with higher levels of air pollutant concentrations sometimes above the standards set by WHO and EU guidelines [56]. These cities fall into the category of “Greater Cities”, which refers to urban settings that, in addition to the core city, include a larger commuting zone, which can be defined as the surrounding travel-to-work areas where at least 15% of the employed population work. The COVID-19 pandemic was declared by the World Health Organization (WHO) on 11 March 2020 due to widespread global coronavirus infection, and it resulted in lockdowns associated with total quarantine under different phases in different European countries, including the metropolitan areas selected in this study (Berlin: 13 March 2020; London: 19 March 2020; Madrid: 16 March 2020; and Paris: 17 March 2020).

2.2. Datasets

To analyze the linkage between COVID-19 viral infection incidence and mortality with climate and air pollutants seasonality in the selected metropolitan regions, this study used the available observational data and reanalysis information from various sources. This research used the COVID-19 time window period from March 2020 to March 2022. Time series datasets for urban air pollutants and meteorological parameters were provided by city monitoring networks and different satellite platforms. All COVID-19 incidence and lethality data, namely, daily new cases (DNC) and daily new deaths (DND) were delivered by COVID-19 information webpages [57,58].
The daily and monthly derived total aerosol optical depth data at 550 nm data (MODIS Terra, AOD) products were provided by NASA (National Aeronautics and Space Administration) through their Giovanni (Geospatial Interactive Online Visualization and Analysis Infrastructure) portal [59]. This study used the daily average time series meteorological data (air temperature (T) at 2 m height; air relative humidity (RH); air pressure (p); wind speed intensity and direction (w); planetary boundary layer height (PBL); geopotential height) for the study period and selected metropolitan areas delivered via MERRA-2, Version 2 (Modern-Era Retrospective Analysis for Research and Applications) [60] and C3S (Copernicus Climate Change Service) [61]. The daily average time series at ground level for PM2.5, PM10, O3, and NO2 concentrations have been provided by local networks or AQICN (World Air Quality Index) [62].

2.3. Methods

This study comparatively analyzed urban air pollution together with the impacts of climate variability on coronavirus disease (COVID-19) incidence and lethality in the selected European cities. As a measure of the aerosol column concentration over a large urban area, this study used total AOD (aerosol optical depth) at 550 nm, a fundamental variable by which to investigate aerosol loading in the atmosphere. The temporal patterns of the monthly AOD in the period before the outbreak of the epidemic and during the control of COVID-19 have been analyzed. To investigate the mutual influence between the number of COVID-19 daily new cases (DNC) and daily cases of new deaths (DND) and the climate variables, we must understand that the phenomena involved are strongly nonlinear. To ascertain the relative impacts of the daily time series of air pollutant concentrations and climate parameters (considered as independent variables) on daily COVID-19 incidence and mortality data (considered as dependent variables), this study used descriptive statistical analysis, rank-correlation non-parametric test coefficients, Spearman rank correlation, and linear regression analysis considering the regression analysis of non-linearly related data [63]. Spearman’s rank correlation coefficient was considered as a non-parametric statistical indicator and a measure of the dependence between the rankings of two variables. Spearman’s r quantifies how well the relationship between two variables can be represented by a monotonic function without any linearity assumption. In other words, Spearman’s correlation quantifies the monotonic relationships whether they are linear or not. The normality of the daily time series datasets was determined by applying the Kolmogorov–Smirnov tests of normality. As daily new COVID-19 cases (DNC) and daily new COVID-19 deaths (DND) have a non-normal distribution, Spearman’s rank correlation was selected to identify the linear correlation between the main variables: (1) airborne inhalable PM2.5, PM10, and pollutant gases O3 and NO2 and their concentrations (total aerosol optical depth at 550 nm); (2) meteorological variables; and (3) the rates of COVID-19 incidence and mortality. ORIGIN 10.0 software version 2021 for Microsoft Windows was used for data processing.

3. Results and Discussion

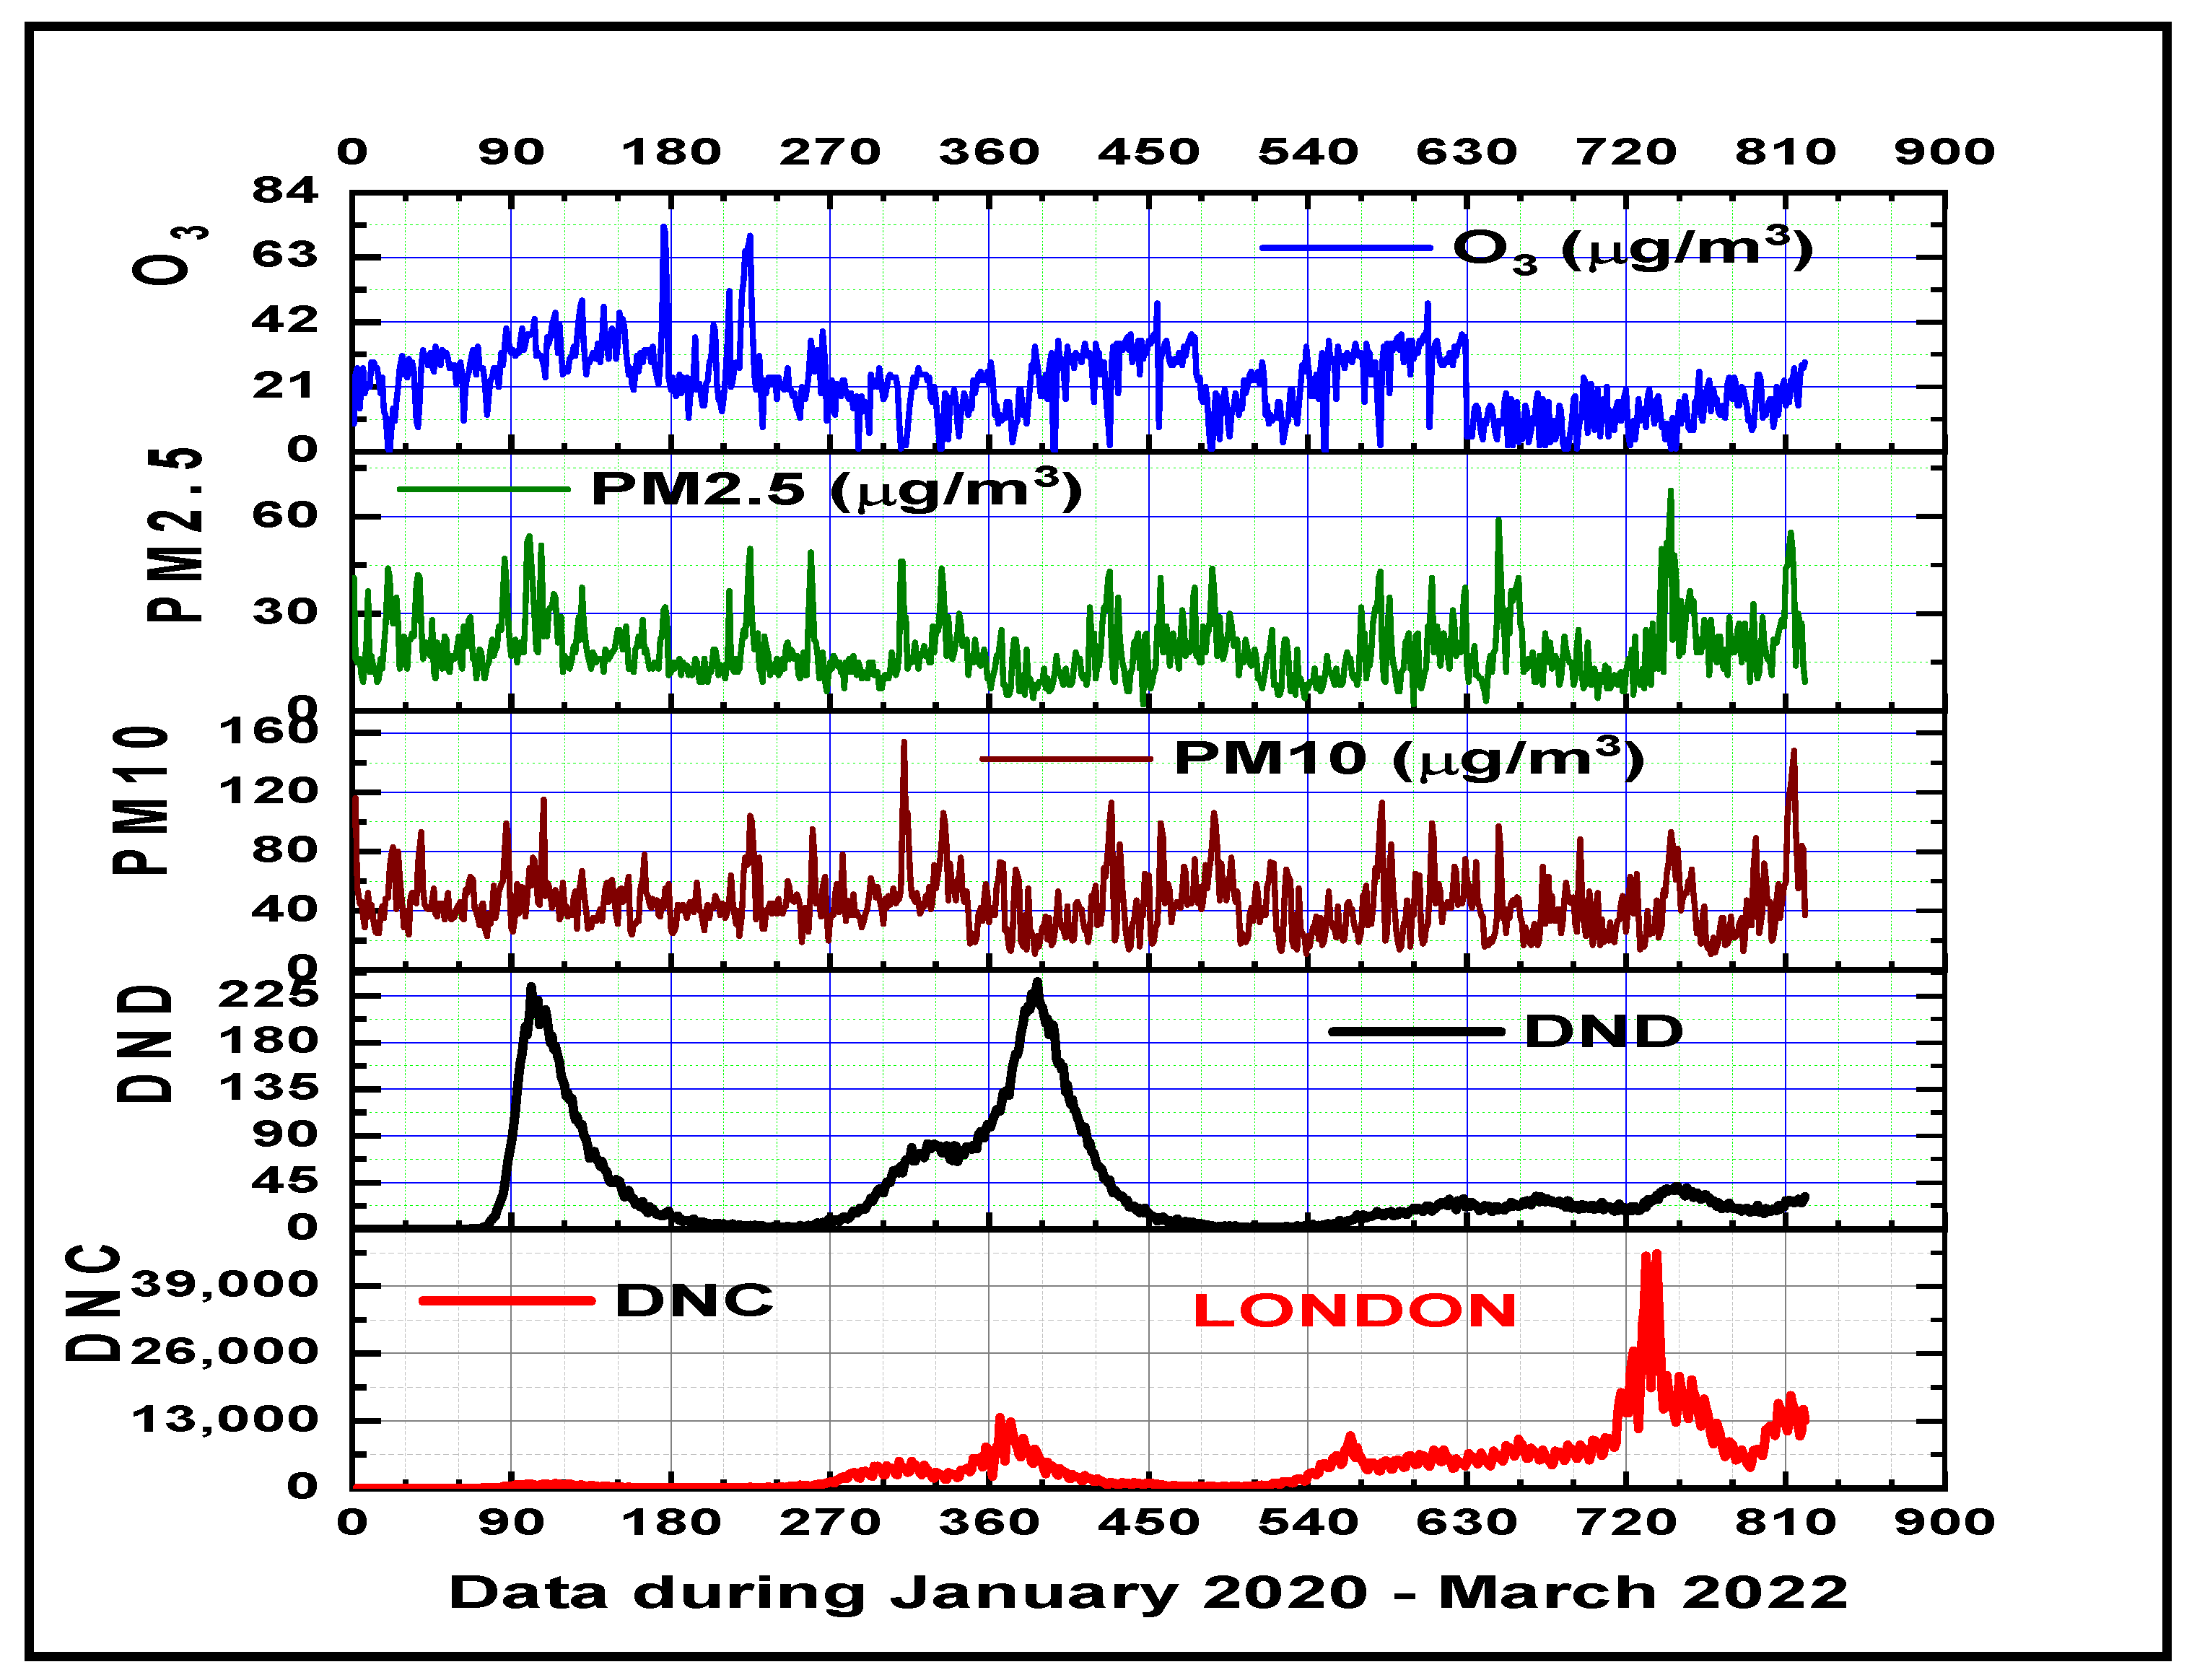
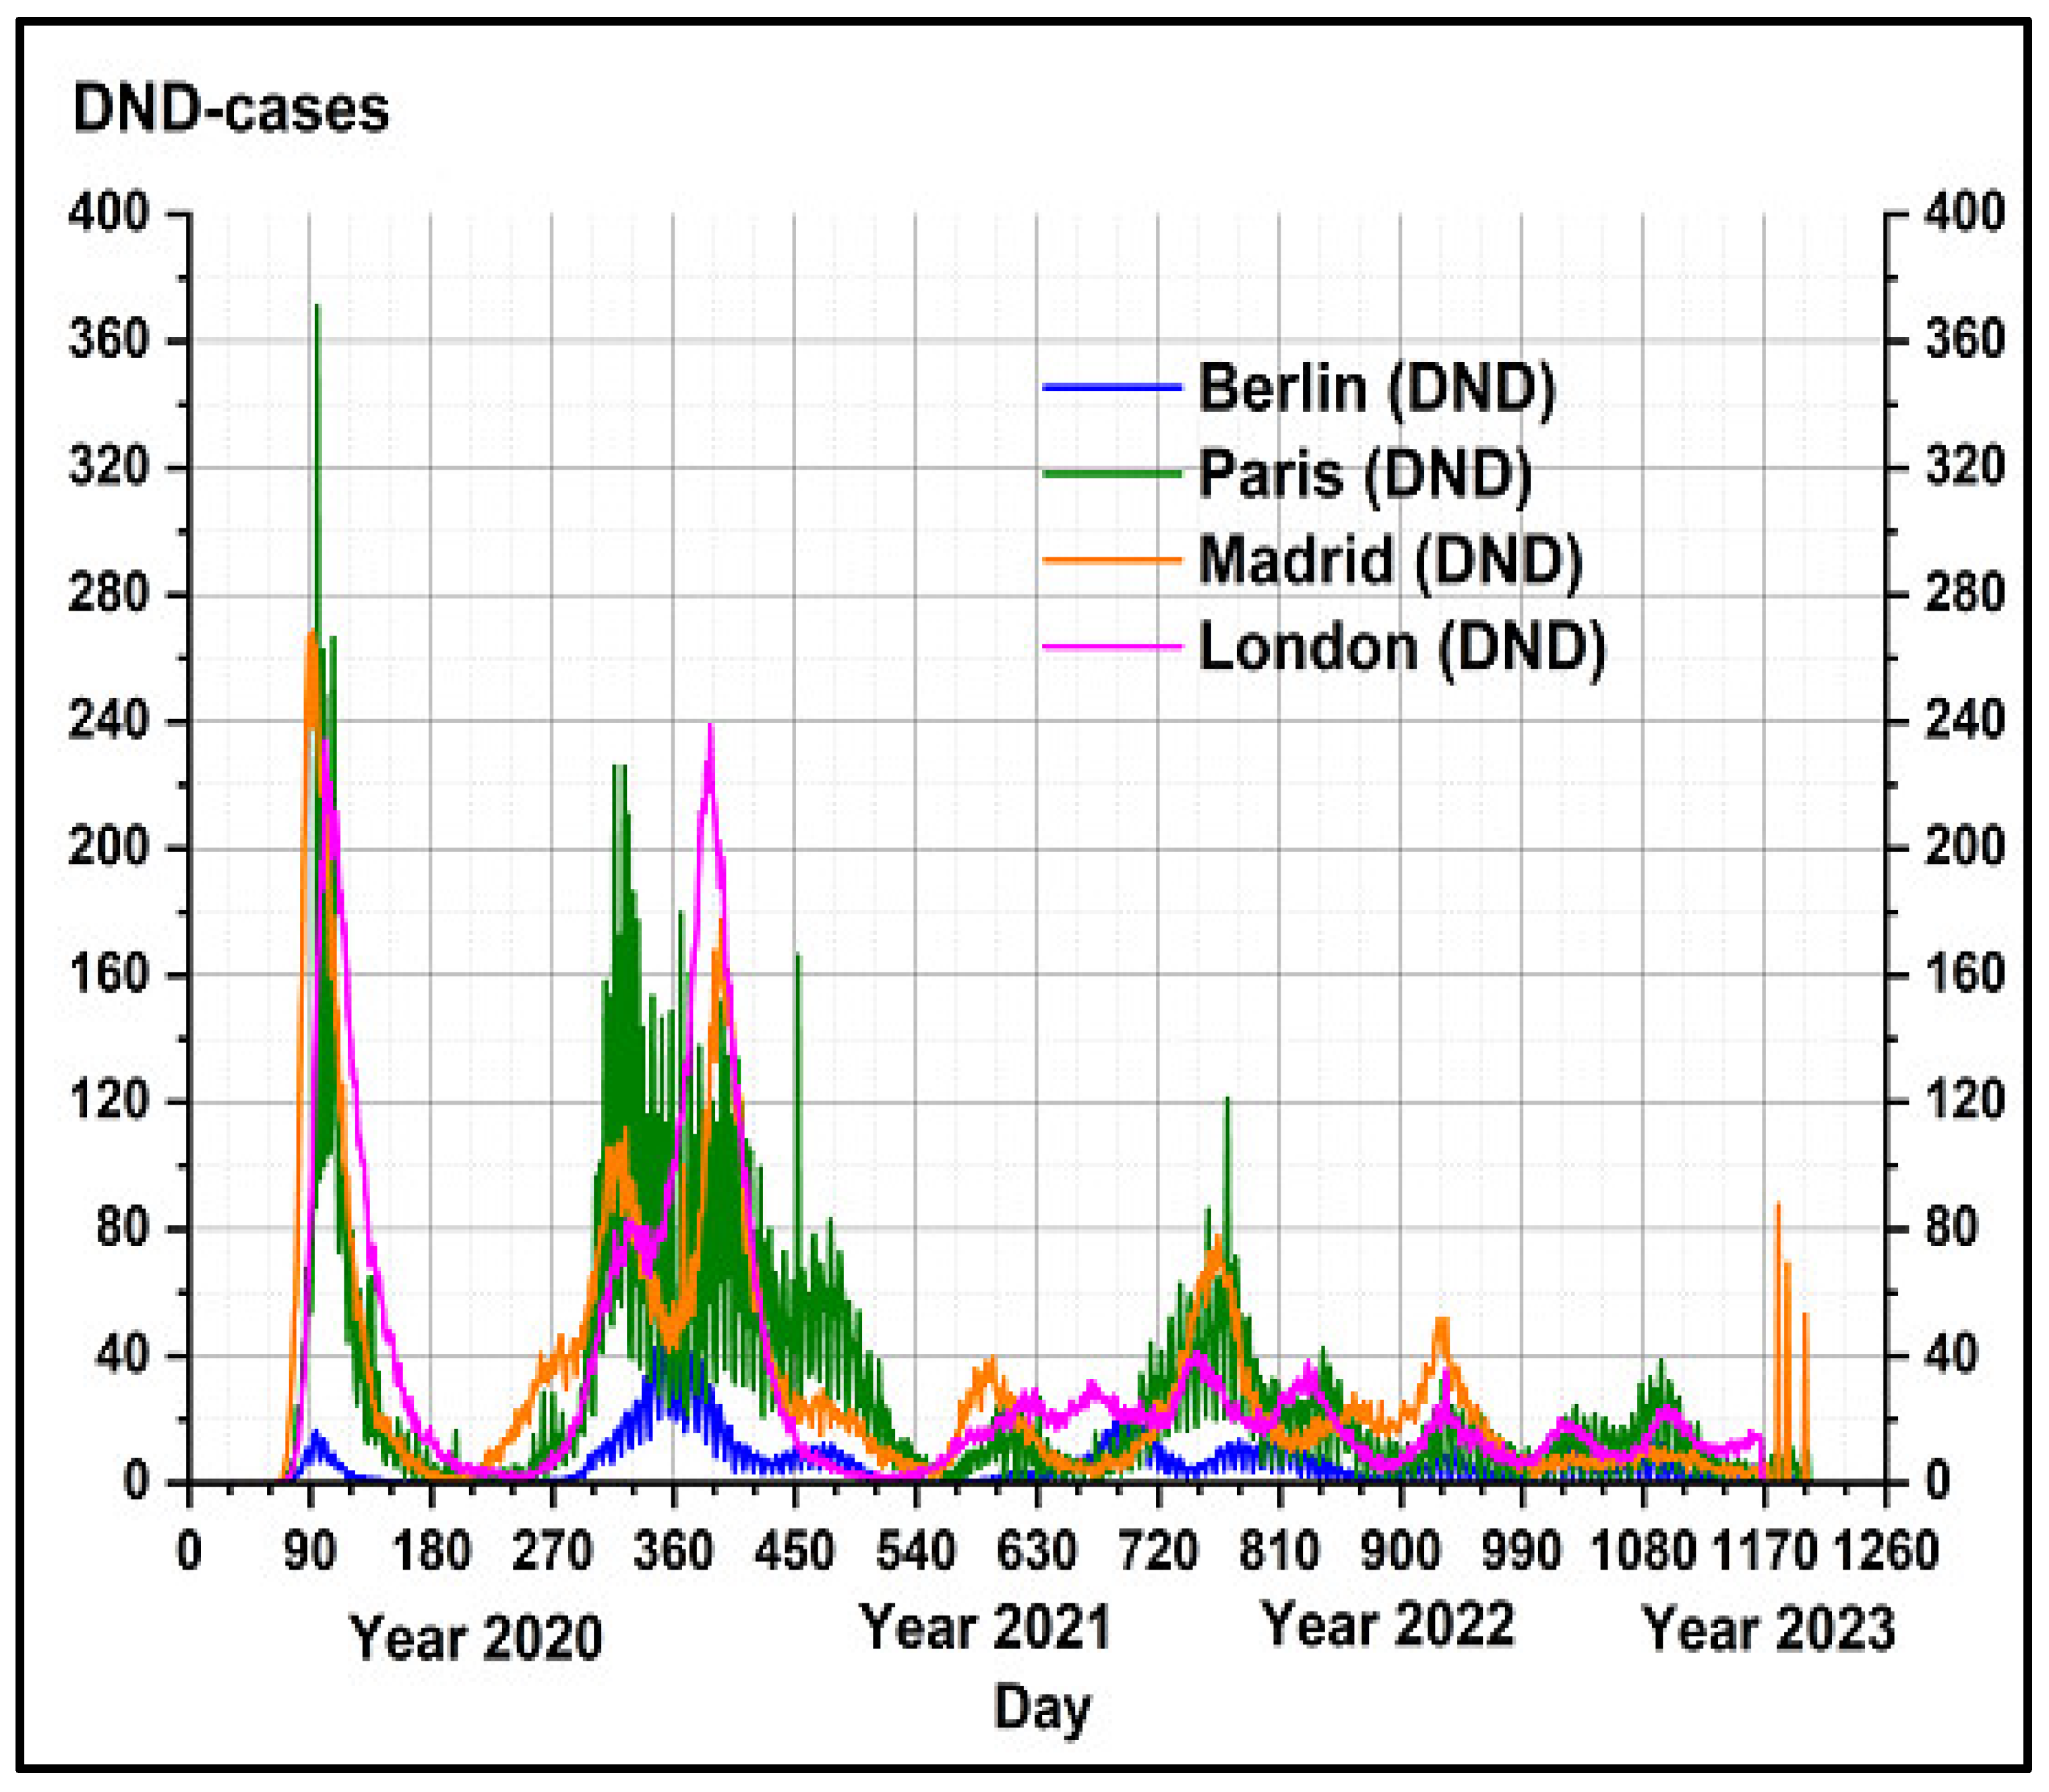
3.1. Air Pollutants and Climate Variability Impacts on COVID-19 Disease in the Metropolitan Areas

To develop targeted interventions related to pandemic viral infection transmission and controls on urban aerosol (particulate matter in different size fractions) pollutant gases and bioaerosol loading (fungi, bacteria, and viruses), it is necessary to implement big data analysis to identify trend patterns in atmospheric processes under the impact of climate and synoptic meteorology across different urban regions. The identification of the environmental, socioeconomic, and sociodemographic factors that influence urban aerosols and bioaerosols composition can help policymakers to better understand the potential risks associated with exposure to high levels of air pollution.
The local, regional, and global fast transmission of the SARS-CoV-2 virus since 2019 in metropolitan areas, which is mainly spread by aerosol and droplet dispersion, resulted in a reduction in traffic and industrial activity, with significant impacts on urban air quality. In strong accordance with other several studies, this research explored the complex relationships between air pollution and climate variability in selected metropolises during several seasons and COVID-19 pandemic waves using daily in situ time series, geospatial, and reanalysis data.
As can be seen in Table 1, the greatest COVID-19 incidence (DNC) and mortality cases have been registered in the London metropolis, with the highest population density (8285.39 inhabitants/km2), followed by the Madrid metropolis, with a population density (5113.55 inhabitants/km2), and the Paris metropolitan area, with a population density (4542.90 inhabitants/km2). The lowest values of COVID-19 incidence (DNC) and mortality cases have been recorded in the Berlin metropolis, which has also the lowest population density (3910.82 inhabitants/km2). In conclusion, population density has a direct impact on COVID-19 transmission in urban agglomerated areas.
The trend analysis found a high linear correlation (R2 = 0.9591) between total COVID-19 incidence and mortality cases and population density, being an effective factor for viral epidemic disease spreading. Like other previous studies, our findings suggest that agglomerated urban areas will be a key factor influencing the future spillover outcome of viral infection events [64,65].
Also, the results of this study highlight the importance of improving urban policies related to air pollution exposure during epidemic events and implementing urgent measures for inhabitants’ protection from harmful environmental stressors [66,67,68,69,70,71].
Figure 2, Figure 3, Figure 4 and Figure 5 present the temporal patterns of the daily COVID-19 incidence DNC cases and DND deaths, associated with the daily average, at ground level, of the main air pollutants (PM2.5, PM10, and O3) concentrations recorded in the investigated metropolises during the selected period. Because the severity and composition of urban air pollution is a strongly variable function of the geographical location, meteorological conditions, population density, and human activities in each area, the impact of air pollutants on viral pandemic diseases is quite different in the investigated metropolitan areas, being recognized as a leading risk factor for cardiorespiratory illnesses. Temporal patterns in Figure 2, Figure 3, Figure 4 and Figure 5 of the main air pollutants concentrations (PM2.5, PM10, O3, NO2) show significant seasonal variability and variability due to natural and anthropogenic emissions, as well as being attributed to the long-range transport of pollutants (mainly for test case of Madrid due to Saharan dust intrusions). Like all air pollutants, PM2.5 and PM10 showed a seasonal pattern, with the highest measured concentrations in the heating season in late autumn, winter, and early spring showing that domestic heating is another major source of air pollution in all of the selected cities.
In all studied metropolitan areas, the ground ozone concentration levels were inversely correlated with particulate matter and nitrogen dioxide concentrations. Surface ozone levels were found to be higher from spring to summer–late autumn, due to the availability of solar radiation and clear sky conditions, and comparatively lower during the late autumn and winter months. A fall in surface ozone concentration levels was observed from November to February due to low temperatures and short solar hours. While comparing major air quality parameters with COVID-19-related incidence and deaths, we found a good inverse relationship between surface ozone and COVID-19 mortality in all the analyzed cities. These findings can be explained by the results in Table 2, which presents the mean of the daily average air pollutant concentrations and the mean daily AOD levels for the selected metropolitan areas between March 2020 and March 2022.
However, emergency legislation and restrictive measures adopted during lockdown periods to control and prevent an increase in viral infections due to the COVID-19 pandemic have produced an improvement in the air quality of the investigated urban regions [72]. Due to the adopted traffic restrictions and industrial production during the COVID-19 lockdown, several studies dealing with the changes in urban air quality worldwide revealed a considerable reduction in atmospheric pollutants concentration levels compared to the pre-lockdown period. For example, the decreasing levels of particulate matter PM10 were 17% in Europe, 5% in North America, and 42% in South Asia, while PM2.5 showed similar tendencies, with a 20% decrease in Europe [73,74,75].
As Table 3 shows, for the entire analyzed period, we have recorded low positive correlations between PM2.5 and PM10 concentrations and DNC and DND cases, mostly for London and Paris. The negative correlations between the daily average ground level O3 concentrations and COVID-19 incidence and lethality were found in all investigated cities, with higher significances for Berlin and Paris.
Although the initial conditions of human exposure could differ from one metropolitan area to another, the daily air pollutant concentrations of PM2.5, PM10, and NO2 correlations were positive with respect to daily COVID-19 incidence and mortality, being similar for the cities considered here. As the measured size of the SARS-CoV-2 pathogens is about 60–140 nm, with an average of 0.1 µm, the virions can be attached to air particulate matter PM in different size fractions (PM0.1 µm, PM1 µm, PM2.5 µm, and PM10 µm), which become their carriers (droplets or particles) [76,77]. Our findings support the association of COVID-19 viral infection with high concentrations of PM2.5 and PM10 in urban densely populated areas.
The results of this study demonstrate that there was no significant improvement in air quality during the lockdown in all the investigated European metropolises; on average, pollutant emission reductions were estimated to be about 7% for PM2.5 for Madrid, 11% for London, and 12% for Paris. Despite the lower contributions from traffic, PM2.5 concentrations were reduced less than expected, probably due to increased contributions from domestic and agricultural biomass burning or climate conditions favoring high secondary aerosol formation yields.
More greatly decreased levels of particulate matter PM10 concentrations beyond lockdown were recorded in Madrid, which can be explained by reduced emissions from road dust, vehicle wear, and construction/demolition. Lower reductions of PM10 have been registered for London −1%, for Paris −5%, and for Berlin −9%. Like other studies, this research found that the COVID-19 lockdown period in the selected European metropolitan areas led to a significant increase in daily average ground-level O3 concentrations in comparison with the average values for the period 2015–2019 by factors varying from 2.05 in Madrid, 1.73 in Paris, 1.47 in London, and 1.37 in Berlin, while average daily ground-level NO2 concentrations exhibited decreased levels of 54% in Madrid, 26% in London, 22% in Paris, and 21% in Berlin.
As Table 3 presents, this study found significant inverse correlations between air meteorological parameters, namely, air temperature at 2 m height T, surface solar irradiance SI, and planetary boundary layer PBL heights, and COVID-19 incidence and lethality, as well as a clear positive correlation with air relative humidity. Planetary boundary layer height is one of the major parameters influencing surface air quality, bioaerosol concentration near the ground, and people’s health. The results confirm the significant role of the climate conditions at both local and regional scales related to the different aerosol properties in continental and coastal urbanized areas that might influence the atmospheric transport of the SARS-Cov-2 virus. Some studies used meteorological parameters like as air temperature, absolute air humidity, and wind speed to predict COVID-19 epidemic trends in different cities worldwide [78].
Like similar reported findings, our results sustain the hypothesis that during summer periods, European temperate countries experienced lower COVID-19 infectivity and lethality rates [79,80,81,82]. Also, during COVID-19 waves, this study revealed the occurrence of strong atmospheric anticyclonic blocking patterns over south and central Europe, including the Madrid, Paris, London, and Berlin metropolises. In the case of the first COVID-19 wave, Figure 6 shows that the geopotential at 500 mb anomaly occurrence favored the accumulation of virus-laden aerosols near the ground and COVID-19 disease transmission, and this explains the associated existing correlations between urban air pollution episodes and the intensity of each wave’s COVID-19 incidence and mortality in Paris, Madrid, London, and Berlin [83,84,85,86,87,88].
Surface solar irradiance (SI) is also a significant climate factor, which has a high impact on viral disease transmission due to its virucidal capacity in the environment and its capacity to increases human body immunity through vitamin D synthesis.
In this study, the mean values of the daily average SI registered in the selected metropolitan areas during March 2020 and March 2022 were highest in Madrid (234.12 ± 90.18 W/m2) in the range of (97.02–380.59 W/m2), followed by Paris (195.35 ± 102.72 W/m2) in the range of (53.04–363.62 W/m2), London (185.21 ± 106.14 W/m2) in the range of (41.01–360.90 W/m2), and Berlin (180.62 ± 105.85 W/m2) in the range of (38.71–358.46 W/m2).
The lowest values of SI recorded for London are very well reflected by the highest rates of COVID-19 incidence and mortality. The results of this study contribute to our understanding of the crucial role of the air pollutant dispersion mechanism over the investigated metropolitan areas during epidemic viral infections.

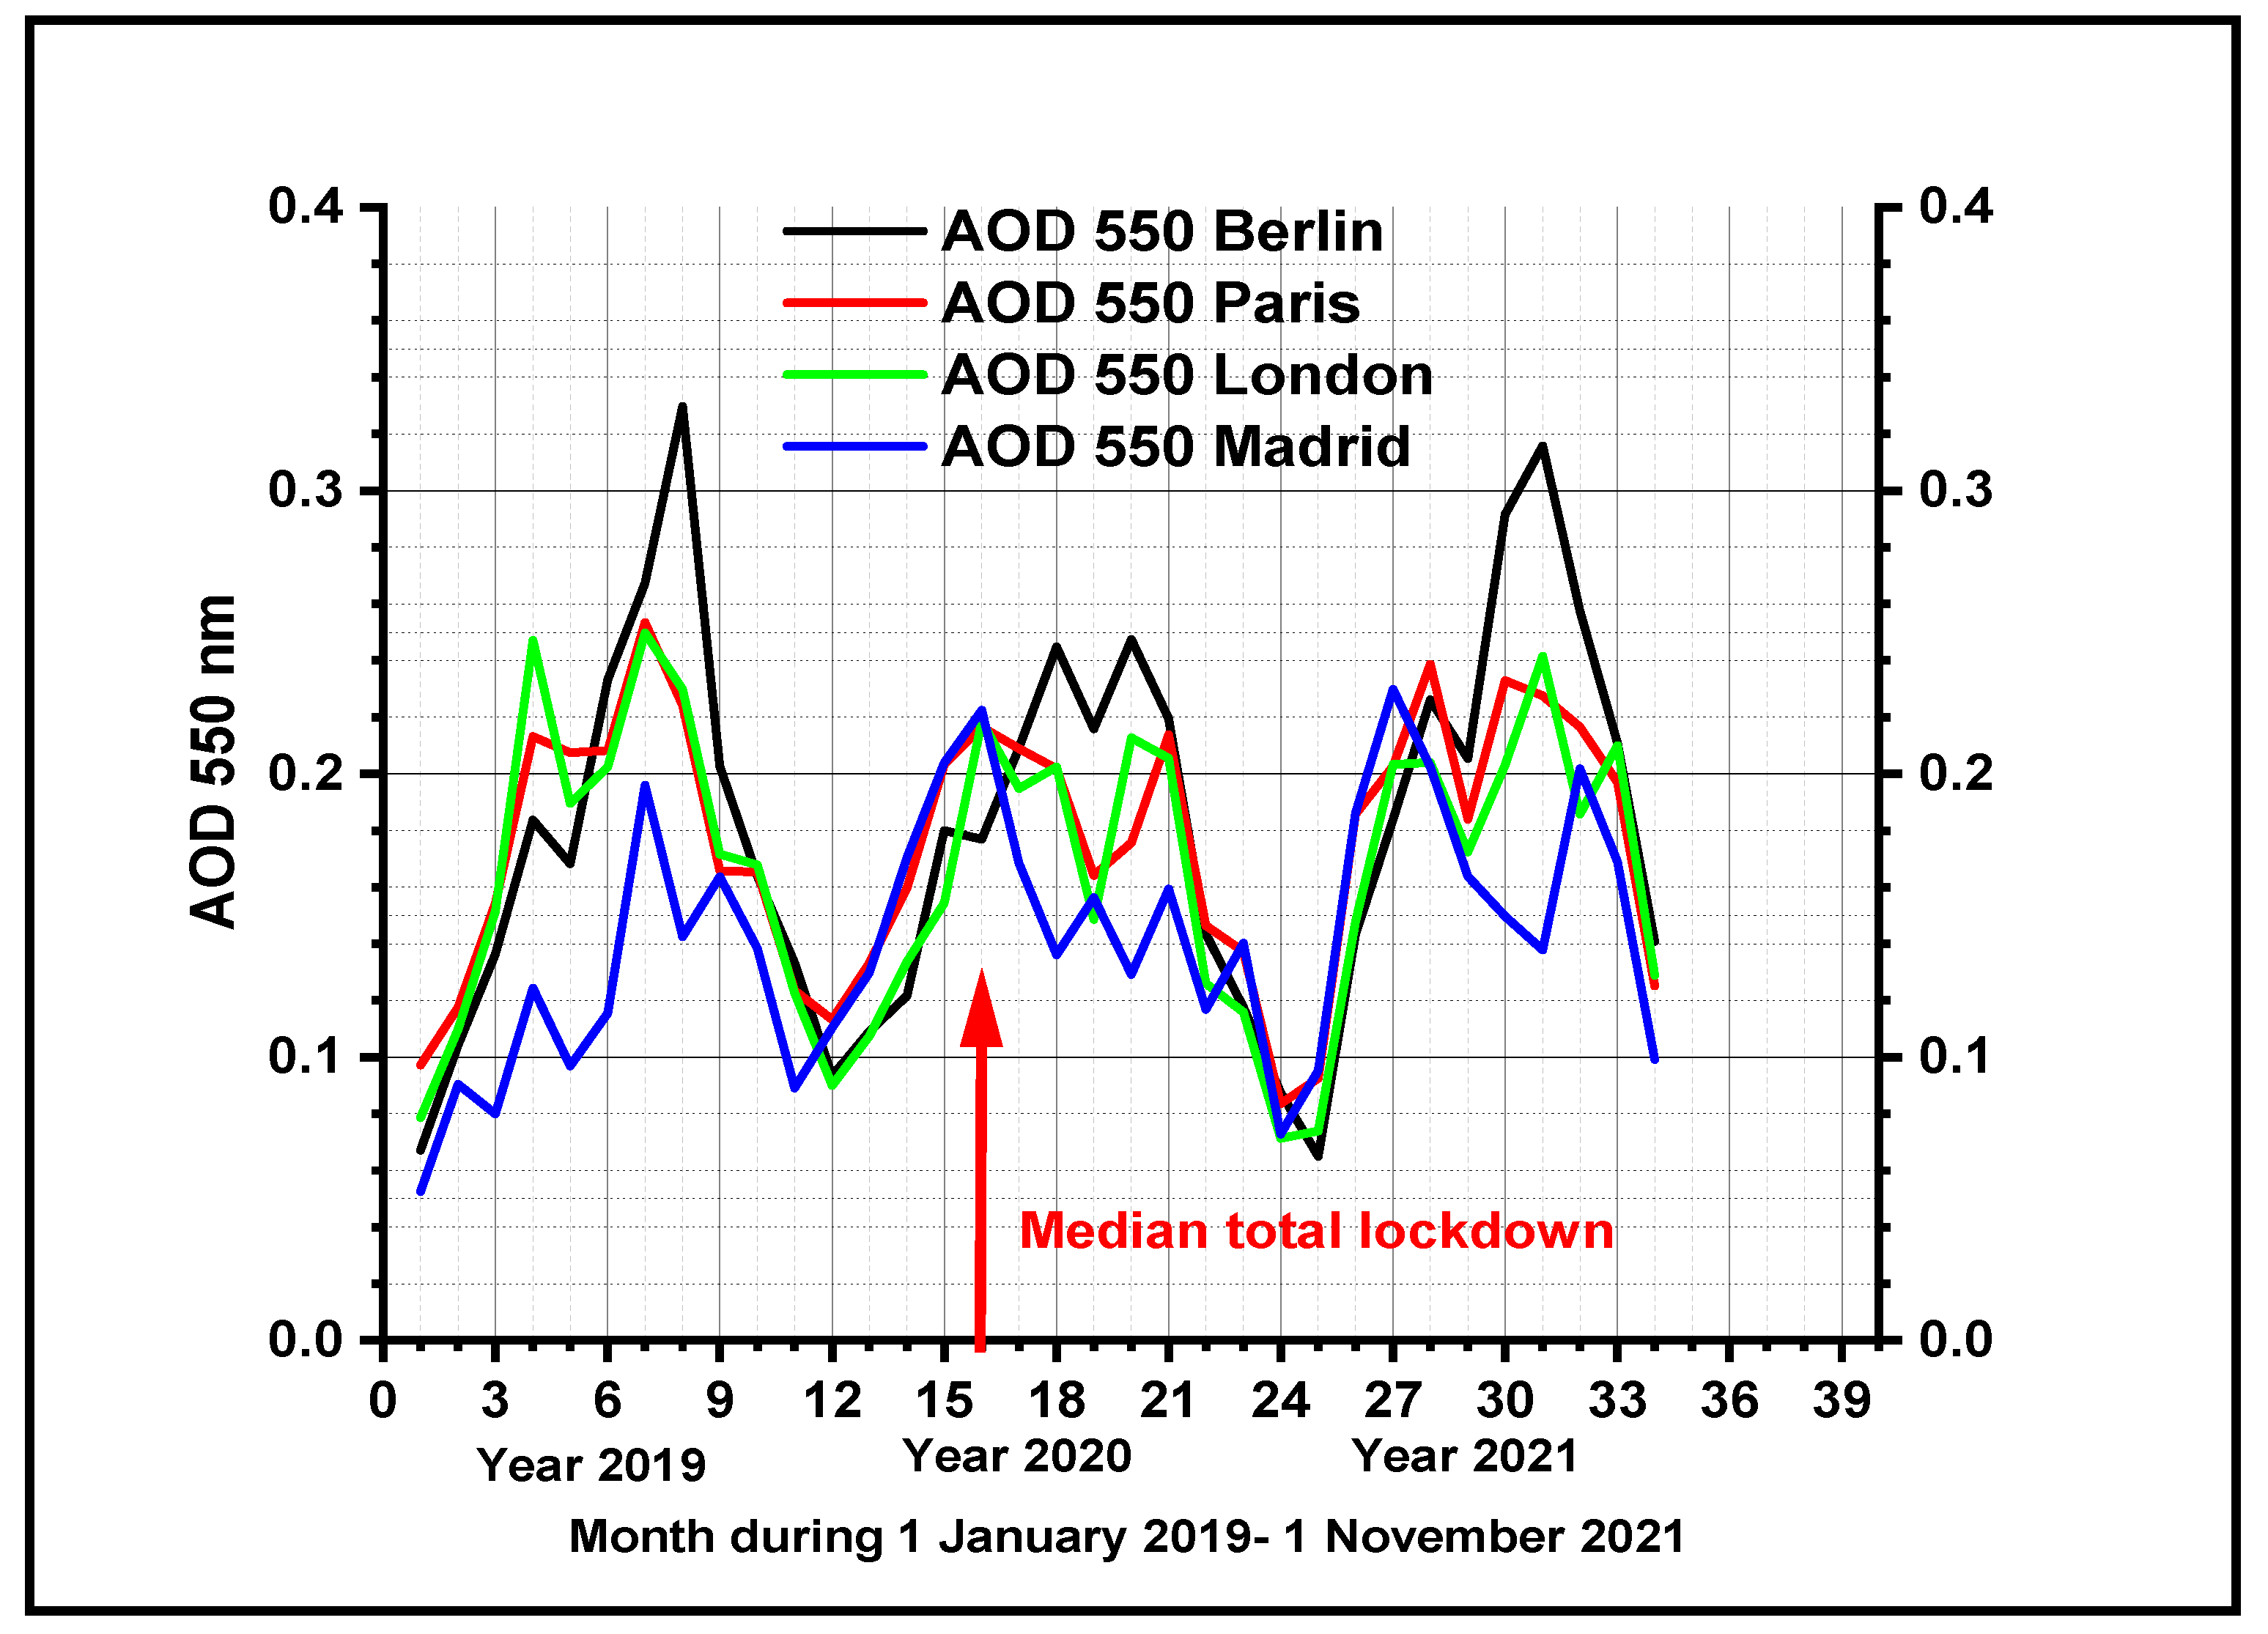
3.2. Evolution of Total Aerosol Optical Depth at 550 nm

Aerosol optical depth (AOD), derived from satellite data, was introduced in conjunction with other variables like as the main air pollutants concentrations and meteorological parameters. Over the investigated metropolises analyzed during the COVID-19 pre- and pandemic periods, this study found that AOD levels present a clear annual course, with maxima in spring and summer (sometimes associated with the transboundary Saharan intrusions), and minima in autumn and winter. Despite of COVID-19 outbreak in spring 2020, and the subsequent restrictions on mobility and physical contacts—which were also associated with the extreme collapse of international tourism—compared to the same time window (March–May) for the pre-pandemic (2015–2019) period, during the lockdown period (March 2020–May 2020), different AOD level variations were recorded, as can be seen in Figure 7 [89].
A comparison of the AOD levels in the selected metropolitan areas shows that Madrid recorded a high increase of 97.5%, Berlin and Paris also registered increases of 15.91% and 6.67%, respectively, while London registered a decrease of 3.5%. Springer Saharan dust intrusion in Spain, associated with long-period anticyclonic conditions and high values of AOD levels in Madrid, may explain the high rate of mortality (11,134 deaths) during the first COVID-19 wave [90,91]. However, there was a certain degree of variation of total AOD at 550 nm; a marker of air pollution was observed for the lockdown period in comparison with the pre-lockdown period, its spatiotemporal patterns having a high impact on viral disease transmission and lethality in densely populated areas. The geographic location of the analyzed metropolises introduces complexity in the spatial and temporal distribution of aerosol properties. AOD is also associated with local and regional climatology.
As can be seen in Table 2, during the investigated COVID-19 period from March 2020 to March 2022, the London metropolis recorded the greatest AOD value (0.247 ± 0.161), followed by Paris (0.213 ± 0.145), Berlin (0.184 ± 0.089), and Madrid (0.124 ± 0.102). This can explain the highest rates of COVID-19 mortality and incidence, presented, respectively, in Figure 8 and Figure 9.
Although the implementation of COVID-19 lockdown restrictions was not the same in each metropolis of the study areas, and the traffic and industrial structure of different the metropolitan areas varied considerably, during the spring period in 2020, massive COVID-19 were recorded deaths, especially in Madrid, Paris, and London. Alongside air pollutants’ contribution and the impacts of synoptic meteorological conditions, few adopted restrictions and health system crises also contributed to the reported increased fatalities reported in the scientific literature. The findings of this study align with previous studies that have identified a significant interaction between urban pollution, climate, and COVID-19 incidence and lethality [92,93,94].
As can be seen in Figure 9, the temporal patterns of the daily new COVID-19 cases (DNC) show a clear increase in viral disease incidence at the end of 2021, mostly in London, Madrid, and Paris, associated with low mobility restrictions and an increase in air pollution concentrations, as well as with the more-contagious SARS-CoV-2 variant (BA1/BA2) Omicron.
Despite the increased AOD levels in Berlin compared to Madrid and London, the recorded DNC and DND cases were lower in Berlin during the investigated pandemic period. This could be attributed to more severely imposed restrictions, social distancing’s role in varying COVID-19 exposure, and higher immunization coverage.
However, the results presented in this study highlight the significant role of urban aerosol loading and pollutant gases in synergy with climate variability in COVID-19 pandemic evolution in large metropolitan areas [95,96]. Outdoor-specific climate conditions (such as air temperature, relative humidity, wind speed intensity and direction, and surface solar irradiance) can be top predictors of airborne coronavirus diffusion.
In a European policy context, sustainable urban development needs to be focused on new urban policies, which must consider the European Green Deal. Also, according to the EU policy set agendas and initiatives, urban planners must urgently implement proper strategies for addressing the need for advancement in urban sustainability, air quality, and climate improvement for promoting people’s well-being [97,98]. According to Goal 3 of the United Nations (UN) Sustainable Development Goals (SDG), there is an urgent need for each country to ensure the good health and well-being of their population [99] and to limit environmental pollution [100,101] to advance sustainability in the post-pandemic era.

4. Strengths and Limitations

Overall, our study provides comprehensive information on the spatiotemporal variability of air pollution and the meteorological factors related to the epidemiological patterns of COVID-19 incidence and severity during the three-year epidemic period in the large European metropolitan areas of Berlin, Paris, Madrid, and London. One important finding emphasizes the significance of local and regional climate on viral infection spreading, especially under anomalous stagnant atmospheric circulation associated with a high increase in aerosols and airborne microbe concentrations near the ground, as observed over the investigated European cities during the first COVID-19 wave. Other strengths of this study include its almost three-year monitoring period based on in situ and satellite time series data of air pollutants and climate factors related to COVID-19 viral disease transmission. As a limitation, this study did not consider the spatiotemporal human mobility distribution in the studied metropolitan areas. Alongside air pollution and climate influencing factors and their relative risks, which vary across time and space, we must remember that sociodemographic factors exert a strong influence over environmental features. Factors like vaccination rate, demographic characteristics regarding age, sex, and comorbidities, and the quality and interventions of the various health services have not been considered.

5. Conclusions

Using multi-source data, this study focused on selected European metropolises, considering the regional characteristics of city areas. It is therefore scientific in its spatial scope, and it supports the conclusion that exposure to high levels of air pollutants and bioaerosols under the pressure of climate and anthropogenic changes has a strong impact on COVID-19 pandemic trends. Also, this study considered a long period of time and conducted a sufficient comparative analysis of air pollution loading as expressed by the total aerosol optical depth at 550 nm over the investigated metropolitan areas before, during, and after the COVID-19 outbreak.
In addition, we considered the basic in situ and geospatial data for various meteorological factors, such as air temperature, air relative humidity, wind speed intensity, air pressure, surface solar irradiance, planetary boundary layer height, and geopotential anomalies maps. Furthermore, this study highlights the factors that potentially affect viral infection spreading, such as air pollution levels, including seasonality and metropolitan atmospheric conditions, as well as population density. Our findings suggest that the increased mitigation of air pollution in large agglomerated cities is an imperious need, especially during pandemic viral events and long periods of stagnant atmospheric circulation conditions.
Although the outdoor pollution levels in our study metropolises were below European and WHO recommendation thresholds, the impacts on COVID-19 transmission were observed with respect to exposure at lower aerosol concentrations. Under the current climate change scenario, where extreme climate events are increasing in duration and frequency, the overlap of epidemic events with air pollution episodes in the outdoor environment is of crucial significance. Further research is needed to explore the underlying mechanisms and possible influential factors of these effects.
This study can help health and urban decision makers, who rely on evidence-based air pollution–climate information tailored to their needs in adequately adapting to and preparing for future epidemic and climate change events. However, combating pandemics by maintaining sufficient distance and driving (utilizing electric cars), cycling, and walking within blue and green cities could decrease population risks and limit human losses. Further research is urgently needed to explore the underlying mechanisms and potential influential factors of air pollution and climate effects with respect to the spread of viral pathogens during epidemic events.

Author Contributions

M.Z.: Conceptualization, Methodology, Supervision, Writing—review and editing. R.R.: Methodology, Validation, Review. D.S.: Methodology, Validation, Software. M.T.: Methodology, Validation. All authors have read and agreed to the published version of the manuscript.

Funding

This study was supported by the Romanian Ministry of Research, Innovation and Digitalization, Program 1: Development of the national research–development system; Subprogram 1.2: Institutional Performance—Projects to finance the excellent RDI, Contract no. 18PFE/30.12.2021; Research Development and Innovation Plan 2022–2027, CONTRACT PN 23 05 NUCLEU; and grant MRID, CNCS-UEFISCDI, CONTRACT PN-III-P4-PCE-2021-0585, within PNCDI III.

Data Availability Statement

Data are contained within the article.

Acknowledgments

We are very grateful for the NASA MERRA-2 derived AOD at 550 nm product provided by Copernicus Atmosphere Monitoring Service (CAMS).

Conflicts of Interest

The authors declare no conflicts of interest.

References

  1. Elsamadony, M.; Fujii, M.; Ryo, M.; Nerini, F.F.; Kakinuma, K.; Kanae, S. Preliminary quantitative assessment of the multidimensional impact of the COVID-19 pandemic on Sustainable Development Goals. J. Clean. Prod. 2022, 372, 133812. [Google Scholar] [CrossRef]
  2. Shuai, C.; Zhao, B.; Chen, X.; Liu, J.; Zheng, C.; Qu, S.; Zou, J.P.; Xu, M. Quantifying the impacts of COVID-19 on Sustainable Development Goals using machine learning models. Fundam. Res. 2022; in press. [Google Scholar] [CrossRef]
  3. Hyman, S.; Zhang, J.; Andersen, Z.J.; Cruickshank, S.; Møller, P.; Daras, K.; Williams, R.; Topping, D.; Lim, Y.H. Long-term exposure to air pollution and COVID-19 severity: A cohort study in Greater Manchester, United Kingdom. Environ. Pollut. 2023, 327, 121594. [Google Scholar] [CrossRef]
  4. Collivignarelli, M.C.; Bellazzi, S.; Caccamo, F.M.; Miino, M.C. Discussion about the Latest Findings on the Possible Relation between Air Particulate Matter and COVID-19. Int. J. Environ. Res. Public Health 2023, 20, 5132. [Google Scholar] [CrossRef]
  5. Ma, Y.; Cheng, B.; Li, H.; Feng, F.; Zhang, Y.; Wang, W.; Qin, P. Air pollution and its associated health risks before and after COVID-19 in Shaanxi Province, China. Environ. Pollut. 2023, 320, 121090. [Google Scholar] [CrossRef]
  6. Kirwan, P.D.; Charlett, A.; Birrell, P.; Elgohari, S.; Hope, R.; Mandal, S.; De Angelis, D.; Presanis, A.M. Trends in COVID-19 hospital outcomes in England before and after vaccine introduction, a cohort study. Nat. Commun. 2022, 13, 4834. [Google Scholar] [CrossRef]
  7. Marchini, T. Redox and inflammatory mechanisms linking air pollution particulate matter with cardiometabolic derangements. Free. Radic. Biol. Med. 2023, 209 Pt 2, 320–341. [Google Scholar] [CrossRef]
  8. Sofiev, M.; Sofieva, S.; Palamarchuk, J.; Šaulienė, I.; Kadantsev, E.; Atanasova, N.; Fatahi, Y.; Kouznetsov, R.; Kuula, J.; Noreikaite, A.; et al. Bioaerosols in the atmosphere at two sites in Northern Europe in spring 2021: Outline of an experimental campaign. Environ. Res. 2022, 214, 113798. [Google Scholar] [CrossRef]
  9. Liu, J.; Ruan, Z.; Gao, X.; Yuan, Y.; Dong, S.; Li, X.; Liu, X. Investigating the cumulative lag effects of environmental exposure under urban differences on COVID-19. J. Infect. Public Health 2024, 17, 76–81. [Google Scholar] [CrossRef]
  10. Xie, W.; Li, Y.; Bai, W.; Hou, J.; Ma, T.; Zeng, X.; Zhang, L.; An, T. The source and transport of bioaerosols in the air: A review. Front. Environ. Sci. Eng. 2021, 15, 44. [Google Scholar] [CrossRef] [PubMed]
  11. Asadi, S.; Bouvier, N.; Wexler, A.S.; Ristenpart, W.D. The coronavirus pandemic and aerosols: Does COVID-19 transmit via expiratory particles? Aerosol Sci. Technol. 2020, 54, 635–638. [Google Scholar] [CrossRef] [PubMed]
  12. Balyan, P.; Ghosh, C.; Das, S.; Banerjee, B.D. Spatio-temporal characterization of bioaerosols at diverse outdoor land-use sites in an urban environment. Aerobiologia 2020, 36, 77–81. [Google Scholar] [CrossRef]
  13. An, T.; Liang, Z.; Chen, Z.; Li, G. Recent progress in online detection methods of bioaerosols. Fundam. Res. 2024, 4, 442–454. [Google Scholar] [CrossRef] [PubMed]
  14. Huang, J.; Wang, D.; Zhu, Y.; Yang, Z.; Yao, M.; Shi, X.; An, T.; Zhang, Q.; Huang, C.; Bi, X.; et al. An overview for monitoring and prediction of pathogenic microorganisms in the atmosphere. Fundam. Res. 2023, 4, 430–441. [Google Scholar] [CrossRef]
  15. Tao, Y.; Zhang, X.; Qiu, G.; Spillmann, M.; Ji, Z.; Wang, J. SARS-CoV-2 and other airborne respiratory viruses in outdoor aerosols in three Swiss cities before and during the first wave of the COVID-19 pandemic. Environ. Int. 2022, 164, 107266. [Google Scholar] [CrossRef]
  16. Robles-Romero, J.M.; Conde-Guillén, G.; Safont-Montes, J.C.; García-Padilla, F.M.; Romero-Martín, M. Behaviour of aerosols and their role in the transmission of SARS-CoV-2; a scoping review. Rev. Med. Virol. 2022, 32, e2297. [Google Scholar] [CrossRef]
  17. Nesmachnow, S.; Tchernykh, A. The Impact of theCOVID-19 Pandemic on the Public Transportation System of Montevideo, Uruguay: A Urban Data Analysis Approach. Urban Sci. 2023, 7, 113. [Google Scholar] [CrossRef]
  18. Guan, Y.; Xiao, Y.; Chu, C.; Zhang, N.; Yu, L. Trends and characteristics of ozone and nitrogen dioxide related health impacts in Chinese cities. Ecotoxicol. Environ. Saf. 2022, 241, 113808. [Google Scholar] [CrossRef]
  19. De Angelis, E.; Renzetti, S.; Volta, M.; Donato, F.; Calza, S.; Placidi, D.; Lucchini, R.G.; Rota, M. COVID-19 incidence and mortality in Lombardy, Italy: An ecological study on the role of air pollution, meteorological factors, demographic and socioeconomic variables. Environ. Res. 2021, 195, 110777. [Google Scholar] [CrossRef]
  20. Eskandari, Z.; Maleki, H.; Neisi, A.; Riahi, A.; Hamid, V.; Goudarzi, G. Temporal fluctuations of PM2.5 and PM10, population exposure, and their health impacts in Dezful city, Iran. J. Environ. Health Sci. Eng. 2020, 18, 723–731. [Google Scholar] [CrossRef]
  21. Seposo, X.; Ueda, K.; Sugata, S.; Yoshino, A.; Takami, A. Short-term effects of air pollution on daily single- and co-morbidity cardiorespiratory outpatient visits. Sci. Total Environ. 2020, 29, 138934. [Google Scholar] [CrossRef] [PubMed]
  22. Bronte, O.; García-García, F.; Lee, D.-J.; Urrutia, I.; Uranga, A.; Nieves, M.; Martínez-Minaya, J.; Quintana, J.; Arostegui, I.; Zalacain, R.; et al. Impact of outdoor air pollution on severity and mortality in COVID-19 pneumonia. Sci. Total Environ. 2023, 894, 164877. [Google Scholar] [CrossRef] [PubMed]
  23. Aboura, S. The influence of climate factors and government interventions on the Covid-19 pandemic: Evidence from 134 countries. Environ. Res. 2022, 208, 112484. [Google Scholar] [CrossRef] [PubMed]
  24. Dabisch, P.; Schuit, M.; Herzog, A.; Beck, K.; Wood, S.; Krause, M.; Miller, D.; Weaver, W.; Freeburger, D.; Hooper, I.; et al. The influence of temperature, humidity, and simulated sunlight on the infectivity of SARS-CoV-2 in aerosols. Aerosol Sci. Technol. 2021, 55, 142–153. [Google Scholar] [CrossRef]
  25. Manik, S.; Mandal, M.; Pal, S.; Patra, S.; Acharya, S. Impact of climate on COVID-19 transmission: A study over Indian states. Environ. Res. 2022, 211, 113110. [Google Scholar] [CrossRef] [PubMed]
  26. Zoran, M.A.; Savastru, R.S.; Savastru, D.M.; Tautan, M.N. Assessing the relationship between ground levels of ozone (O3) and nitrogen dioxide (NO2) with coronavirus (COVID-19) in Milan, Italy. Sci. Total Environ. 2020, 740, 140005. [Google Scholar] [CrossRef] [PubMed]
  27. Richter, C.M. The simultaneous and cyclic appearance of epidemics of pneumonia, grip and enteritis on the Northern hemisphere and their synchronism with solar activity cycles. JAMA 1911, LVII, 1964–1967. [Google Scholar] [CrossRef]
  28. Bosch, B.J.; van der Zee, R.; de Hana, C.A.M.; Rottier, P.J.M. The coronavirus spike protein is a class I virus fusion protein: Structural and functional characterization of the fusion core complex. J. Virol. 2003, 77, 8801–8811. [Google Scholar] [CrossRef] [PubMed]
  29. Bowers, R.M.; Clements, N.; Emerson, J.B.; Wiedinmyer, C.; Hannigan, M.P.; Fierer, N. Seasonal variability in bacterial and fungal diversity of the near-surface atmosphere. Environ. Sci. Technol. 2013, 47, 12097–12106. [Google Scholar] [CrossRef] [PubMed]
  30. Cáliz, J.; Triadó-Margarit, X.; Camarero, L.; Casamayor, E.O. A long-term survey unveils strong seasonal patterns in the airborne microbiome coupled to general and regional atmospheric circulations. Proc. Natl. Acad. Sci. USA 2018, 115, 12229–12234. [Google Scholar] [CrossRef]
  31. Cao, C.; Jiang, W.; Wang, B.; Fang, J.; Lang, J.; Tian, G.; Jiang, J.; Zhu, T. InhalableMicroorganisms in Beijing’s PM2.5 and PM10 Pollutants during a Severe Smog Event. Environ. Sci. Technol. 2014, 48, 1499–1507. [Google Scholar] [CrossRef]
  32. Jones, A.M.; Harrison, R.M. The effects of meteorological factors on atmospheric bioaerosol concentrations—A review. Sci. Total Environ. 2004, 326, 151–180. [Google Scholar] [CrossRef] [PubMed]
  33. Khan, M.F.; Hamid, A.H.; Bari, M.A.; Tajudin, A.B.A.; Latif, M.T.; Nadzir, M.S.M.; Sahani, M.; Wahab, M.I.A.; Yusup, Y.; Maulud, K.N.A.; et al. Airborne particles in he city center of Kuala Lumpur: Origin, potential driving factors, and deposition flux in human respiratory airways. Sci. Total Environ. 2019, 650 Pt 1, 1195–1206. [Google Scholar] [CrossRef]
  34. Kelly, F.J.; Fussell, J.C. Air pollution and airway disease. Clin. Exp. Allergy 2011, 41, 1059–1071. [Google Scholar] [CrossRef] [PubMed]
  35. Wang, T.; Rovira, J.; Sierra, J.; Blanco, J.; Chen, S.-J.; Mai, B.-X.; Schuhmacher, M.; Domingo, J.L. Characterization of airborne particles and cytotoxicity to a human lung cancer cell line in Guangzhou, China. Environ. Res. 2021, 196, 110953. [Google Scholar] [CrossRef]
  36. Lepeule, J.; Bind, M.-A.C.; Baccarelli, A.A.; Koutrakis, P.; Tarantini, L.; Litonjua, A.; Sparrow, D.; Vokonas, P.; Schwartz, J.D. Epigenetic influences on associations between air pollutants and lung function in elderly men: The normative aging study. Environ. Health Perspect. 2014, 122, 566–572. [Google Scholar] [CrossRef]
  37. Ciencewicki, J.; Jaspers, I. Air Pollution and Respiratory Viral Infection. Inhal Toxicol. 2007, 19, 1135–1146. [Google Scholar] [CrossRef] [PubMed]
  38. Cui, Y.; Zhang, Z.-F.; Froines, J.; Zhao, J.; Wang, H.; Yu, S.-Z.; Detels, R. Air pollution and case fatality of SARS in the People’s Republic of China: An ecologic study. Environ. Health 2003, 2, 15. [Google Scholar] [CrossRef]
  39. Innocente, E.; Squizzato, S.; Visin, F.; Facca, C.; Rampazzo, G.; Bertolini, V.; Gandolfi, I.; Franzetti, A.; Ambrosini, R.; Bestetti, G. Influence of seasonality, air mass origin and particulate matter chemical composition on airborne bacterial community structure in the Po Valley, Italy. Sci. Total Environ. 2017, 593–594, 677–687. [Google Scholar] [CrossRef]
  40. Herman, J.; Biegel, B.; Huang, L. Inactivation times from 290 to 315 nm UVB in sunlight for SARS coronaviruses CoV and CoV-2 using OMI satellite data for the sunlit Earth. Air Qual. Atmos. Health. 2020, 14, 217–233. [Google Scholar] [CrossRef]
  41. Giese, A.C. Living with Our Sun’s Ultraviolet Rays; Plenum Press: New York, NY, USA, 1976; Chapter 3; pp. 33–34. [Google Scholar]
  42. Heßling, M.; Hönes, K.; Vatter, P.; Lingenfelder, C. Ultraviolet irradiation doses for coronavirus inactivation—Review and analysis of coronavirus photoinactivation studies. GMS Hyg. Infect. Control 2020, 14, Doc08. [Google Scholar] [CrossRef]
  43. Sagripanti, J.L.; Lytle, C.D. Estimated inactivation of coronaviruses by solar radiation with special reference to COVID-19. Photochem. Photobiol. 2020, 96, 731–737. [Google Scholar] [CrossRef] [PubMed]
  44. Luo, X.; Liao, Q.; Shen, Y.; Li, H.; Cheng, L. Vitamin D deficiency is associated with COVID-19 incidence and disease severity in Chinese people. J. Nutr. 2021, 151, 98–103. [Google Scholar] [CrossRef] [PubMed]
  45. Calder, P.C.; Carr, A.C.; Gombart, A.F.; Eggersdorfer, M. Optimal nutritional status for a well-functioning immune system an important factor to protect against viral infections. Nutrients 2020, 12, 1181. [Google Scholar] [CrossRef] [PubMed]
  46. Castillo, M.E.; Entrenas Costa, L.M.; Vaquero Barrios, J.M.; Alcala Díaz, J.F.; Lopez Miranda, J.; Bouillon, R.; Quesada Gomez, J.M. Effect of calcifediol treatment and best available therapy versus best available therapy on intensive care unit admission and mortality among patients hospitalized for COVID-19: A pilot randomized clinical study. J. Steroid Biochem. Mol. Biol. 2020, 203, 105751. [Google Scholar]
  47. Schuit, M.; Ratnesar-Shumate, S.; Yolitz, J.; Williams, G.; Weaver, W.; Green, B.; Miller, D.; Krause, M.; Beck, K.; Wood, S.; et al. Airborne SARS-CoV-2 is rapidly inactivated by simulated sunlight. J. Infect. Dis. 2020, 222, 564–571. [Google Scholar] [CrossRef] [PubMed]
  48. Jayawardena, R.; Jeyakumar, D.T.; Francis, T.V.; Misra, A. Impact of the vitamin D deficiency on COVID-19 infection and mortality in Asian countries. Diabetes, Metab. Syndr. Clin. Res. Rev. 2021, 15, 757–764. [Google Scholar]
  49. Zhang, H.; Wang, J.; Liang, Z.; Wu, Y. Non-linear effects of meteorological factors on COVID-19: An analysis of 440 counties in the Americas. Heliyon 2024, 10, e31160. [Google Scholar] [CrossRef]
  50. Zoran, M.A.; Savastru, R.S.; Savastru, D.M.; Tautan, M.N. Assessing the relationship between surface levels of PM2.5 and PM10 particulate matter impact on COVID-19 in Milan, Italy. Sci. Total Environ. 2020, 738, 13982. [Google Scholar] [CrossRef]
  51. Mela, A.; Tousi, E.; Melas, E.; Varelidis, G. Spatial Distribution and Quality of Urban Public Spaces in the Attica Region (Greece) during the COVID-19 Pandemic: A Survey-Based Analysis. Urban Sci. 2024, 8, 2. [Google Scholar] [CrossRef]
  52. Schatke, M.; Meier, F.; Schröder, B.; Weber, S. Impact of the 2020 COVID-19 lockdown on NO2 and PM10 concentrations in Berlin, Germany. Atmos. Environ. 2022, 290, 119372. [Google Scholar] [CrossRef]
  53. Zhang, C.; Stevenson, D. Characteristic changes of ozone and its precursors in London during COVID-19 lockdown and the ozone surge reason analysis. Atmos. Environ. 2022, 273, 118980. [Google Scholar] [CrossRef]
  54. Núñez-Peiró, M.; Sánchez, C.S.-G.; González, F.J.N. Hourly evolution of intra-urban temperature variability across the local climate zones. The case of Madrid. Urban Clim. 2021, 39, 100921. [Google Scholar] [CrossRef]
  55. Ivanovic, S.; Wood, J.; Purves, R. Evaluation of bicycle sharing scheme data as a proxy for cycling mobility—How COVID-19 measures influenced cycling in Paris. Transp. Res. Interdiscip. Perspect. 2023, 22, 100937. [Google Scholar] [CrossRef]
  56. Thunis, P.; Degraeuwe, B.; Peduzzi, E.; Vignati, E.; Trombetti, M.; Degraeuwe, B.; Wilson, J.; Belis, C.A. Urban PM2.5 Atlas: Air Quality in European Cities; (online); Publications Office of the European Union: Luxembourg, 2017. [Google Scholar] [CrossRef]
  57. Worldometer Info. 2023. Available online: https://www.worldometers.info/ (accessed on 20 January 2024).
  58. WHO. 2024. Available online: https://covid19.who.int/WHO-COVID-19-global-data.csv (accessed on 25 January 2024).
  59. Giovanni. 2024. Available online: https://giovanni.gsfc.nasa.gov/giovanni/ (accessed on 25 January 2024).
  60. MERRA. 2024. Available online: http://www.soda-pro.com/web-services/meteo-data/merra (accessed on 25 January 2024).
  61. Copernicus. 2024. Available online: https://cds.climate.copernicus.eu/ (accessed on 20 January 2024).
  62. AQICN. 2024. Available online: https://aqicn.org/city/ (accessed on 20 January 2024).
  63. Ireland, C. Multiple regression and non-linear regression analysis. In Experimental Statistics for Agriculture and Horticulture; CABI: Wallingford, UK, 2010. [Google Scholar] [CrossRef]
  64. Zhang, Y.; Sun, Q.; Liu, J.; Petrosian, O. Long-Term Forecasting of Air Pollution Particulate Matter (PM2.5) and Analysis of Influencing Factors. Sustainability 2024, 16, 19. [Google Scholar] [CrossRef]
  65. Xia, Q.; Yang, Y.; Wang, F.; Huang, Z.; Qiu, W.; Mao, A. Case fatality rates of COVID-19 during epidemic periods of variants of concern: A meta-analysis by continents. Int. J. Infect. Dis. 2024, 141, 106950. [Google Scholar] [CrossRef]
  66. Cheng, C.; Liu, Y.; Han, C.; Fang, Q.; Cui, F.; Li, X. Effects of extreme temperature events on deaths and its interaction with air pollution. Sci. Total Environ. 2024, 915, 170212. [Google Scholar] [CrossRef]
  67. Alameri, M.M.; Kong, A.S.-Y.; Aljaafari, M.N.; Ali, H.A.; Eid, K.; Sallagi, M.A.; Cheng, W.-H.; Abushelaibi, A.; Lim, S.-H.E.; Loh, J.-Y.; et al. The Spatiality of COVID-19 in Kermanshah Metropolis, Iran. Urban Sci. 2022, 6, 30. [Google Scholar] [CrossRef]
  68. Taczanowska, K.; Tansil, D.; Wilfer, J.; Jiricka-Pürrer, A. The impact of age on people’s use and perception of urban green spaces and their effect on personal health and wellbeing during the COVID-19 pandemic—A case study of the metropolitan area of Vienna, Austria. Cities 2024, 147, 104798. [Google Scholar] [CrossRef]
  69. Sobrino, N.; Arce-Ruiz, R.M. Effects of Mobility Restrictions on Air Pollution in the Madrid Region during the COVID-19 Pandemic and Post-Pandemic Periods. Sustainability 2023, 15, 12702. [Google Scholar] [CrossRef]
  70. Sohrabi, S.; Shu, F.; Gupta, A.; Sabbaghian, M.H.; Mehrara Molan, A.; Sajjadi, S. Health Impacts of COVID-19 through the Changes in Mobility. Sustainability 2023, 15, 4095. [Google Scholar] [CrossRef]
  71. Ju, T.; Geng, T.; Li, B.; An, B.; Huang, R.; Fan, J.; Liang, Z.; Duan, J. Impacts of Certain Meteorological Factors on Atmospheric NO2 Concentrations during COVID-19 Lockdown in 2020 in Wuhan, China. Sustainability 2022, 14, 16720. [Google Scholar] [CrossRef]
  72. Marquès, M.; Correig, E.; Domingo, J.L. Long-term exposure to PM10 above WHO guidelines exacerbates COVID-19 severity and mortality. Environ. Int. 2022, 158, 106930. [Google Scholar] [CrossRef]
  73. Lox, J.E.; Taylor, J.; Kaiser, J. Outdoor air pollution exposure and COVID-19 infection in the United States. Environ. Pollut. 2021, 292 Pt B, 118369. [Google Scholar] [CrossRef]
  74. Liu, X.; Huang, J.; Li, C.; Zhao, Y.; Wang, D.; Huang, Z.; Yang, K. The role of seasonality in the spread of COVID-19 pandemic. Environ. Res. 2021, 195, 110874. [Google Scholar] [CrossRef]
  75. To, T.; Zhang, K.; Maguire, B.; Terebessy, E.; Fong, I.; Parikh, S.; Zhu, J.; Su, Y. UV, ozone, and COVID-19 transmission in Ontario, Canada using generalised linear models. Environ. Res. 2021, 194, 110645. [Google Scholar] [CrossRef]
  76. Feng, B.; Lian, J.; Yu, F.; Zhang, D.; Chen, W.; Wang, Q.; Shen, Y.; Xie, G.; Wang, R.; Teng, Y.; et al. Impact of short-term ambient air pollution exposure on the risk of severe COVID-19. J. Environ. Sci. 2024, 135, 610–618. [Google Scholar] [CrossRef]
  77. Marquès, M.; Domingo, J.L. Positive association between outdoor air pollution and the incidence and severity of COVID-19. A review of the recent scientific evidences. Environ. Res. 2022, 203, 111930. [Google Scholar] [CrossRef]
  78. Chen, B.; Liang, H.; Yuan, X.; Hu, Y.; Xu, M.; Zhao, Y.; Zhang, B.; Tian, F.; Zhu, X. Roles of meteorological conditions in COVID-19 transmission on a worldwide scale. MedRxiv 2020. [Google Scholar] [CrossRef]
  79. Jana, A.; Kundu, S.; Shaw, S.; Chakraborty, S.; Chattopadhyay, A. Spatial shifting of COVID-19 clusters and disease association with environmental parameters in India: A time series analysis. Environ. Res. 2023, 222, 115288. [Google Scholar] [CrossRef]
  80. Jiang, S.; Sun, B.; Zhu, R.; Che, C.; Ma, D.; Wang, R.; Dai, H. Airborne microbial community structure and potential pathogen identification across the PM size fractions and seasons in the urban atmosphere. Sci. Total Environ. 2022, 831, 154665. [Google Scholar] [CrossRef]
  81. Tsuchiya, K.; Yamamoto, N.; Hosaka, Y.; Wakita, M.; Hiki, M.; Matsushita, Y.; Mori, H.; Hori, S.; Misawa, S.; Miida, T.; et al. Molecular characterization of SARS-CoV-2 detected in Tokyo, Japan during five waves: Identification of the amino acid substitutions associated with transmissibility and severity. Front. Microbiol. 2022, 13, 912061. [Google Scholar] [CrossRef]
  82. Chen, H.; Du, R.; Zhang, Y. Evolution of PM2.5 bacterial community structure in Beijing’s suburban atmosphere. Sci. Total Environ. 2021, 799, 149387. [Google Scholar] [CrossRef]
  83. Zoran, M.A.; Savastru, R.S.; Savastru, D.M.; Tautan, M.N. Impacts of exposure to air pollution, radon and climate drivers on the COVID 19 pandemic in Bucharest, Romania: A time series study. Environ. Res. 2022, 212, 113437. [Google Scholar] [CrossRef]
  84. Xia, X.; Zhang, K.; Yang, R.; Zhang, Y.; Xu, D.; Bai, K.; Guo, J. Impact of near-surface turbulence on PM2.5 concentration in Chengdu during the COVID-19 pandemic. Atmos. Environ. 2022, 268, 118848. [Google Scholar] [CrossRef]
  85. Baron, Y.M. Are there medium to short-term multifaceted effects of the airborne pollutant PM2.5 determining the emergence of SARS-CoV-2 variants? Med. Hypotheses 2022, 158, 110718. [Google Scholar] [CrossRef]
  86. Beloconi, A.; Vounatsou, P. Long-term air pollution exposure and COVID-19 case-severity: An analysis of individual-level data from Switzerland. Environ. Res. 2023, 216, 114481. [Google Scholar] [CrossRef]
  87. Sanchez-Lorenzo, A.; Vaquero-Martínez, J.; Calbó, J.; Wild, M.; Santurtún, A.; Lopez-Bustins, J.A.; Vaquero, J.M.; Folini, D.; Antón, M. Anomalous atmospheric circulation favor the spread of COVID-19 in Europe? Environ. Res. 2021, 194, 110626. [Google Scholar] [CrossRef]
  88. Jerrett, M.; Nau, C.L.; Young, D.R.; Butler, R.K.; Batteate, C.M.; Su, J.; Burnett, R.T.; Kleeman, M.J. Air pollution and meteorology as risk factors for COVID-19 death in a cohort from Southern California. Environ. Int. 2023, 171, 107675. [Google Scholar] [CrossRef]
  89. Amrhein, S.; Hospers, G.-J.; Reiser, D. Transformative Effects of Overtourism and COVID-19-Caused Reduction of Tourism on Residents—An Investigation of the Anti-Overtourism Movement on the Island of Mallorca. Urban Sci. 2022, 6, 25. [Google Scholar] [CrossRef]
  90. Salvador, P.; Barreiro, M.; Gómez-Moreno, F.J.; Alonso-Blanco, E.; Artíñano, B. Synoptic classification of meteorological patterns and their impact on air pollution episodes and new particle formation processes in a south European air basin. Atmos. Environ. 2021, 245, 118016. [Google Scholar] [CrossRef]
  91. Rodríguez-Arias, R.; Rojo, J.; Fernández-González, F.; Pérez-Badia, R. Desert dust intrusions and their incidence on airborne biological content. Review and case study in the Iberian Peninsula. Environ. Pollut. 2023, 316, 120464. [Google Scholar] [CrossRef]
  92. Fu, D.; Shi, X.; Zuo, J.; Yabo, S.D.; Li, J.; Li, B.; Li, H.; Lu, L.; Tang, B.; Qi, H.; et al. Why did air quality experience little improvement during the COVID-19 lockdown in megacities, northeast China? Environ. Res. 2023, 221, 115282. [Google Scholar] [CrossRef]
  93. Zoran, M.A.; Savastru, R.S.; Savastru, D.M.; Tautan, M.N.; Baschir, L.A.; Tenciu, D.V. Assessing the impact of air pollution and climate seasonality on COVID-19 multiwaves in Madrid, Spain. Environ. Res. 2022, 203, 111849. [Google Scholar] [CrossRef]
  94. Renard, J.-B.; Surcin, J.; Annesi-Maesano, I.; Delaunay, G.; Poincelet, E.; Dixsaut, G. Relation between PM2.5 pollution and Covid-19 mortality in Western Europe for the 2020–2022 period. Sci. Total Environ. 2022, 848, 157579. [Google Scholar] [CrossRef]
  95. Cao, B.; Wang, X.; Ning, G.; Yuan, L.; Jiang, M.; Zhang, X.; Wang, S. Factors influencing the boundary layer height and their relationship with air quality in the Sichuan Basin, China. Sci. Total Environ. 2020, 727, 138584. [Google Scholar] [CrossRef]
  96. Mora, C.; McKenzie, T.; Gaw, I.M.; Dean, J.M.; von Hammerstein, H.; Knudson, T.A.; Setter, R.O.; Smith, C.Z.; Webster, K.M.; Patz, J.A.; et al. Over half of known human pathogenic diseases can be aggravated by climate change. Nat. Clim. Chang. 2022, 12, 869–875. [Google Scholar] [CrossRef]
  97. European Commission. Urban Agenda for the EU—European Commission (europa.eu). 2024. Available online: https://futurium.ec.europa.eu/en/urban-agenda (accessed on 16 May 2024).
  98. European Commission. The European Green Deal—European Commission (europa.eu). 2024. Available online: https://ec.europa.eu/stories/european-green-deal/ (accessed on 16 May 2024).
  99. UN. Health—United Nations Sustainable Development; UN: New York, NY, USA, 2022. [Google Scholar]
  100. Han, Y.; Gu, X.; Lin, C.; He, M.; Wang, Y. Effects of COVID-19 on coastal and marine environments: Aggravated microplastic pollution, improved air quality, and future perspective. Chemosphere 2024, 355, 141900. [Google Scholar] [CrossRef]
  101. Houweling, L.; der Zee, A.-H.M.-V.; Holtjer, J.C.; Bazdar, S.; Vermeulen, R.C.; Downward, G.S.; Bloemsma, L.D. The effect of the urban exposome on COVID-19 health outcomes: A systematic review and meta-analysis. Environ. Res. 2024, 240 Pt 2, 117351. [Google Scholar] [CrossRef]
Figure 1. Study test European metropolitan areas (Berlin, London, Madrid, and Paris).
Sustainability 16 06119 g001
Figure 2. Temporal patterns of daily COVID-19 incidence and deaths associated with the daily average of the main air pollutants concentrations at ground level in the London metropolis.
Sustainability 16 06119 g002
Figure 3. Temporal patterns of daily COVID-19 incidence and deaths associated with the daily average of the main air pollutants concentrations at ground level in the Paris metropolis.
Sustainability 16 06119 g003
Figure 4. Temporal patterns of daily COVID-19 incidence and deaths associated with the daily average of the main air pollutants concentrations at ground level in the Madrid metropolis.
Sustainability 16 06119 g004
Figure 5. Temporal patterns of daily COVID-19 incidence and deaths associated with the daily average of the main air pollutants concentrations at ground level in the Berlin metropolis.
Sustainability 16 06119 g005
Figure 6. Composite anomaly chart of geopotential 500 mb over Europe during the first COVID-19 wave.
Sustainability 16 06119 g006
Figure 7. Aerosol optical depth temporal distribution between 1 January 2019 and 1 November 2021 over selected metropolitan areas (Berlin, London, Madrid, and Paris).
Sustainability 16 06119 g007
Figure 8. Temporal patterns of the daily new COVID-19 deaths (DND) in the investigated metropolises from spring 2020 to spring 2023.
Sustainability 16 06119 g008
Figure 9. Temporal patterns of the daily new COVID-19 cases (DNC) in the investigated metropolises from spring 2020 to spring 2023.
Sustainability 16 06119 g009
Table 1. Summary of population density, total COVID-19 incidence (DNC), and total COVID-19 deaths (DND) for metropolitan areas between March 2020 and March 2022.
MetropolisBerlinParisMadridLondon
Population size (million inhabitants)5.3512.926.9814.4
Population density (inhabitants/km2)3910.824542.905113.558285.39
Total COVID-19 cases (DNC) during March 2020–March 2022905,2721,155,5282,246,4433,278,230
Total COVID-19 deaths (DND) during March 2020–March 2022438125,31230,28430,321
Table 2. Mean of the daily average air pollutants concentrations and mean daily AOD levels for the selected metropolitan areas between March 2020 and March 2022.
Mean Daily Average
Variable
LondonParisMadridBerlin
PM2.5 (µg/m3)
(Particulate matter 2.5 µm)
(18.55 ± 9.61)
In the range
(2–68)
(24.80 ± 11.61)
In the range
(4–75)
(14.55 ± 9.61)
In the range
(2–68)
(24.80 ± 11.61)
In the range
(4–75)
PM10 (Particulate matter 10 µm) (µg/m3)(45.02 ± 20.44)
In the range
(11–154)
(50.37 ± 21.19)
In the range
(9–145)
(45.01 ± 20.45)
In the range
(11–154)
(50.37 ± 21.19)
In the range
(9–145)
O3 (Ozone) (µg/m3)(22.34 ± 11.06)
In the range
(1–73)
(26.01 ± 11.6)
In the range
(1–71)
(22.35 ± 11.06)
In the range
(0–73)
(26.0 ± 11.05)
In the range
(0–71)
NO2 (Nitrogen dioxide) (µg/m3)(16.60 ± 8.78)
In the range
(0–52)
(19.88 ± 11.34)
In the range
(2–70)
(16.60 ± 8.78)
In the range
(1–52)
(19.88 ± 11.35)
In the range
(2–70)
AOD(0.247 ± 0.161)
In the range
(0.096–0.664)
(0.213 ± 0.145)
In the range
(0.090–0.699)
(0.124 ± 0.102)
In the range
(0.038–0.547)
(0.184 ± 0.089)
In the range
(0.054–0.44)
Table 3. Spearman rank correlation coefficients between daily COVID-19 incidence DNC (cases) and DND (deaths) and daily average air pollutants concentrations and climate variables for the selected metropolitan areas between March 2020 and March 2022.
Daily Average VariableBerlinLondonMadridParis
DNCDNDDNCDNDDNCDNDDNCDND
PM2.5 (µg/m3)
(Particulate matter 2.5 µm)
0.20 *0.19 *0.22 *0.21 *0.18 *0.16 *0.22 *0.27 *
PM10 (Particulate matter 10 µm) (µg/m3)0.27 *0.26 *0.11 **0.03 **0.14 *0.19 *0.12 **0.14 *
O3 (Ozone) (µg/m3)−0.57 *−0.44 *−0.33 *−0.41 *−0.27 *−0.49 *−0.51 *−0.31 *
NO2 (Nitrogen dioxide) (µg/m3)0.47 *0.40 *0.12 *0.06 **0.29 *0.19 *0.05 **0.10 **
T (air Temperature at 2 m height) (°C)−0.60 *−0.67 *−0.48 *−0.58 *−0.25 *−0.61 *−0.51 *−0.63 *
RH (Relative Humidity) (%)0.47 *0.35 *0.55 *0.32 *0.28 *0.69 *0.41 *0.35 *
w (wind intensity) (m/s)−0.06 **−0.08 **0.18 *−0.20 *0.14 *−0.19 *0.04 **−0.04 **
SI (surface solar irradiance) (W/m2)−0.73 *−0.57 *−0.73 *−0.48 *−0.36 *−0.30 *−0.66 *−0.58 *
PBL (Planetary Boundary Layer height) (m)−0.59 *−0.45 *−0.46 *−0.28 *−0.26 *−0.52 *−0.44 *−0.42 *
Note: p value: * p ≤ 0.05-significant values; ** p ≥ 0.05-nonsignificant values.
Disclaimer/Publisher’s Note: The statements, opinions and data contained in all publications are solely those of the individual author(s) and contributor(s) and not of MDPI and/or the editor(s). MDPI and/or the editor(s) disclaim responsibility for any injury to people or property resulting from any ideas, methods, instructions or products referred to in the content.

