Article

Variation of the Groundwater Table within Indian Railway Embankments in Consideration of Climate Change

Graduate School of Urban Innovation, Yokohama National University, 79-1 Tokiwadai, Hodogaya Ward, Yokohama 240-0067, Japan
*
Author to whom correspondence should be addressed.
Sustainability 2024, 16(14), 6143; https://doi.org/10.3390/su16146143
Submission received: 28 May 2024 / Revised: 3 July 2024 / Accepted: 16 July 2024 / Published: 18 July 2024
(This article belongs to the Section Sustainable Transportation)

Abstract

:
Climatic changes have intensified heavy rainfall events in India, causing daily downpours from 156 to 594 mm, and these are expected to worsen in the future. This study analyses a double-line railway embankment using transient unsaturated–saturated seepage analysis through numerical modeling to examine the impact of rainfall scenarios, embankment height, initial groundwater table position, and soil water characteristics curves (SWCCs) of subgrade and subsoil. Our findings indicate an increased vulnerability of embankments to future rainfall due to rapid increases in the groundwater level, necessitating the requirement to make railway embankments resilient to climate change and thereby offering a sustainable mode of transportation. The groundwater onset mechanism across different heights remained consistent; rainwater infiltrated through side slopes first, rose near the toe, and then flowed horizontally, leading to convergence. The convergence level is affected by the SWCCs; however, a single normalized convergence plot can be created by presuming the horizontal flow of the infiltrated water through embankment and subsoil, irrespective of the material type, establishing horizontal flow as the principal convergence mechanism. In embankments over low-permeability subsoil, extremely heavy rainfall creates a unique pattern: side slopes and the top saturate early, while the saturation of the bottom central part is delayed. In such cases, deriving a groundwater variation curve might be challenging.

1. Introduction

India boasts the second-largest railway network in Asia and the fourth-largest global railway network, spanning approximately 123,000 km [1]. This vast railway system has been instrumental in India’s socioeconomic growth, offering efficient and cost-effective transportation. Used daily by millions for both passenger travel and commodity movement, any disruption to its services could significantly impact the national economy. Railway infrastructure, particularly embankments, often suffer damage owing to natural calamities or maintenance, leading to service suspensions.
Heavy rainfall frequently damages railway embankments. For instance, on 16 July 2011, a 206 mm downpour for 24 h caused a landslide that damaged the railway embankment in Pomendi, Maharashtra [2]. Similarly, Kishanganj, Bihar experienced a breach in its railway embankment due to 240 to 340 mm of rainfall on 12 August 2017 [3], followed by a total of 533 mm over three days [4]. On 22 July 2021, Mahabaleshwar, Maharashtra received a record 480 mm of rain, leading to multiple embankment failures in the Konkan railway, with an additional 594 mm the following day [5,6]. A cyclonic depression in Dimapur, Assam, from 11 to 18 May 2023, induced 807 mm of rain, causing over 50 embankment breaches [7].
These events are linked to global climatic changes, and their impacts are becoming increasingly disruptive. Studies have reported an increase in the number of heavy rainfall events in India [8]. The Ministry of Earth Sciences, Government of India, projects a 21–38% increase in extreme precipitation events across India by the end of the century [9], indicating the need to prioritize strengthening railway embankments and making them resilient to such rainfall events. Thus, understanding the railway embankment behavior under these conditions is vital.
Several studies have investigated embankment and slope failures in India. Raj et al. [10] conducted seepage and stability analyses on a repeatedly failing railway embankment and found that rainfall intensity and duration significantly reduced the factor of safety (FOS). Similar studies [2,11,12,13,14], as well as those by Showkat et al. [15] and Chatra et al. [16], also identified rainfall as a critical factor in embankment stability. Dhanai et al. [17] explored the impact of climate change on natural slopes and noted that the FOS decreases continuously with increasing rainfall intensity owing to reduced matric suction. Globally, studies, such as those by Shubhra et al. [18], have shown that future climate changes could significantly lower the embankment FOS, with similar findings reported worldwide [19,20,21].
While several Indian studies have focused on the post-failure analysis of slopes and embankments, few have predicted the stability under current climatic conditions, and even fewer have considered the impact of climate change, especially on railway embankments. This study aimed to fill this gap by examining Indian railway embankments in the context of climate change.

2. Indian Railway Embankments and Foundation—Overview and Selected Specifications
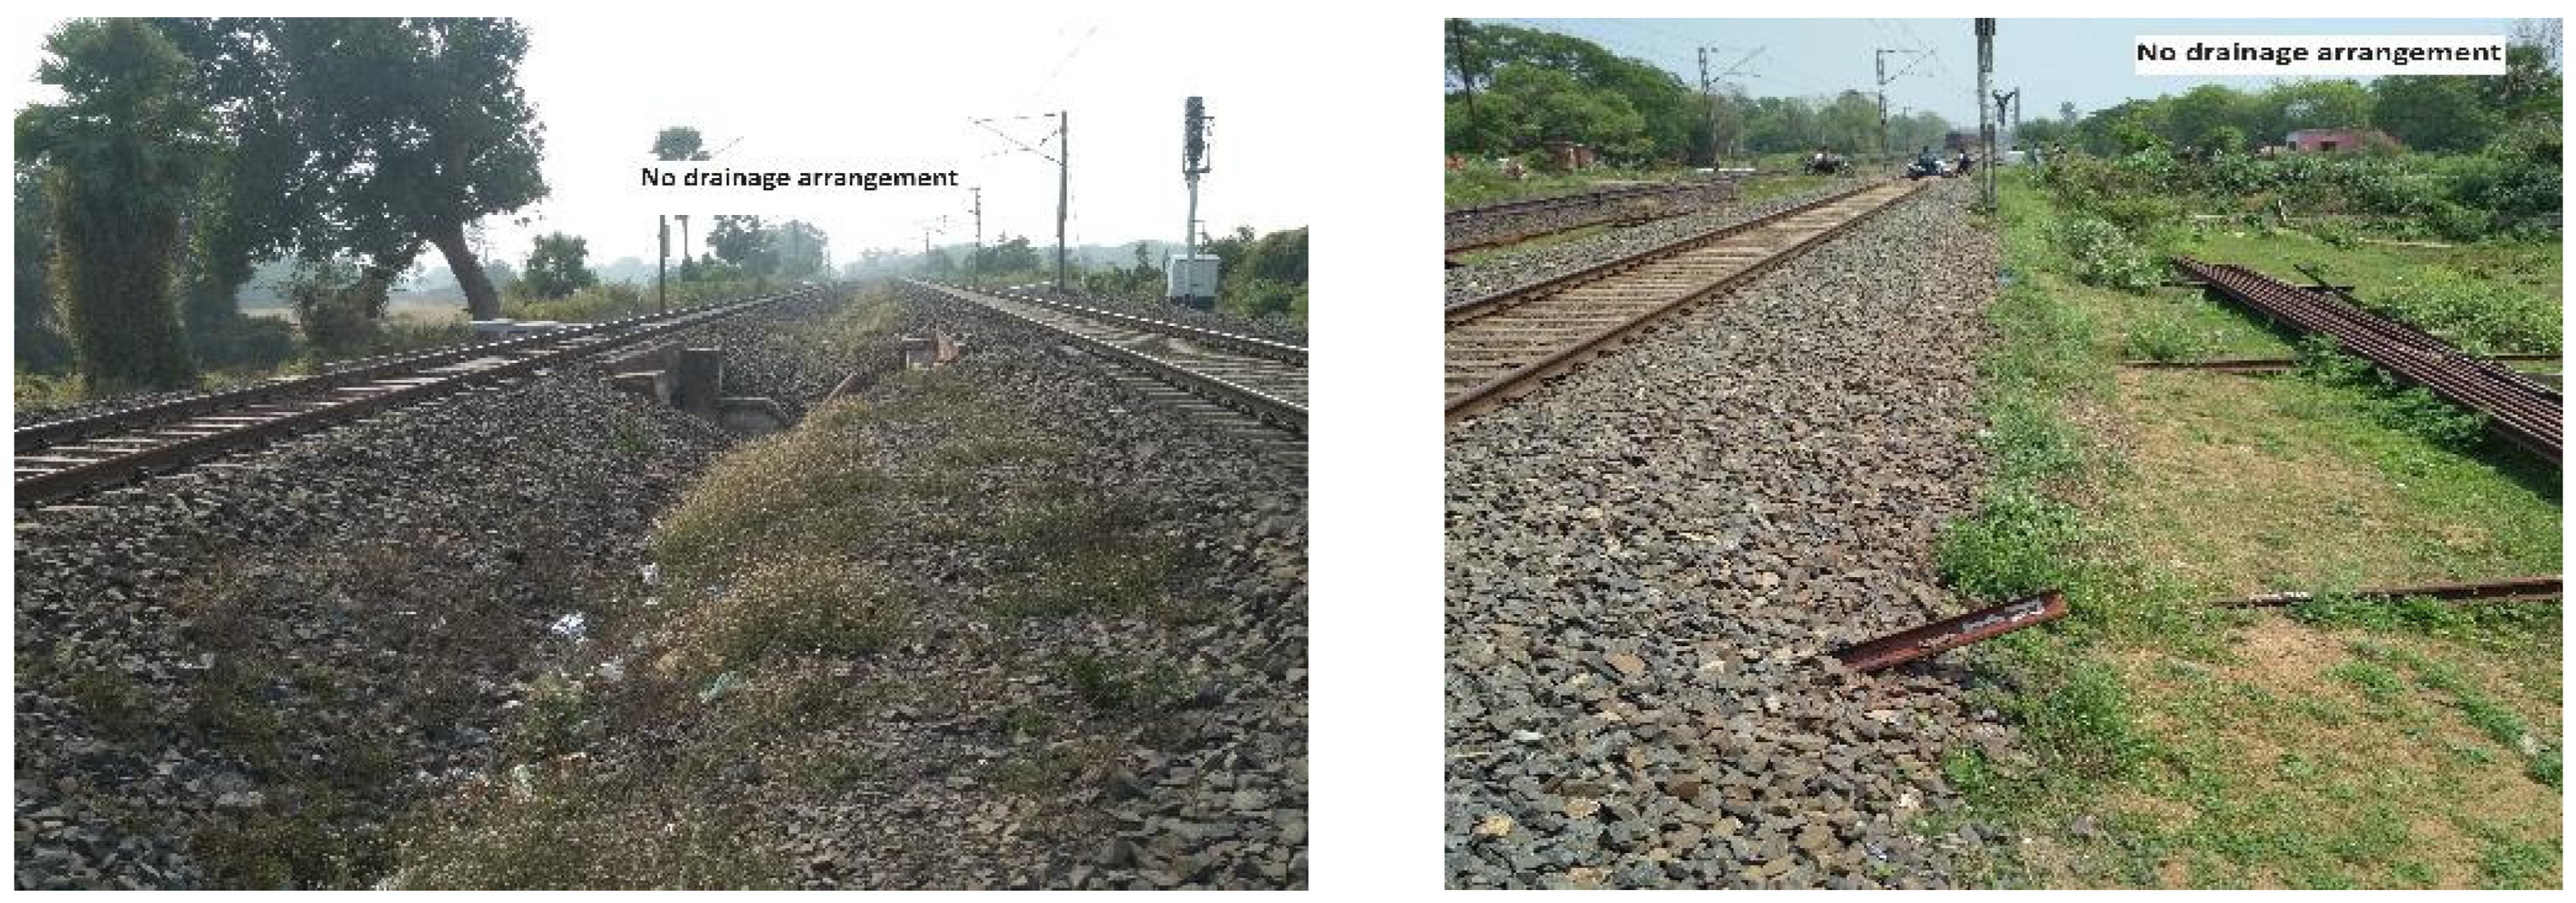
2.1. Overview

Initially, most railway tracks in India were single lines, which were later expanded to double lines by adding earthworks adjacent to existing embankments [22]. The center-to-center (C/C) distance between the two tracks varied based on site conditions, typically ranging from 5 to 10 m. The height of railway embankments in India generally ranges from 2 to 9 m [22,23]. The standard top width of the single embankment was approximately 7 m. The side slope was generally designed to have a minimum of 2H:1V, although the soil type and embankment height may necessitate a flatter gradient. For embankments taller than 6 m on soft subsoil, a gentler slope or additional sub-banks may be required to ensure stability.
A cross-slope of 1 in 30 from the center line (C/L) of the embankment is implemented at the top for effective water drainage. In cases where the railway is expanded, the cross-slope is generally set in one direction. However, if circumstances prevent this approach, a 1 × 30 cross-slope is maintained for each track, ensuring proper drainage and preventing water stagnation between the lines. Normally, a central drain between two tracks is avoided, and rainwater is allowed to flow in a natural manner. Further, there is no need for side drains in the case of the embankment, except in cuttings [24]. Embankments with no drainage arrangements were reported in the field, as shown in Figure 1.
Indian railway embankments are constructed in two primary layers: blanket and subgrade. The blanket layer, comprising coarse, granular, and well-graded materials, varies in thickness from 30 to 100 cm, depending on the subgrade soil type. The subgrade layer forming the load-bearing foundation is constructed from locally sourced soil that is compacted to the desired specifications. According to the Indian Standards classifications, subgrade soil is categorized into three types: SQ1 for soils with over 50% fines, SQ2 for soils with 12–50% fines, and SQ3 for soils with less than 12% fines [25].
Considering foundation or subsoil, soil investigation reports [26,27,28,29,30,31,32] from various parts of India reveal a diverse range of soil types, including clayish sand, black soil, fill soil, clayey silt, sandy silt clay, silty sand, and sand. These reports also indicate that the groundwater table can be at ground level in some regions, whereas in others it may be situated more than 20 m below the normal ground level (NGL).

2.2. Selected Specifications

This study focuses on a double-line embankment, originally a single-line track, which was expanded to a double line with a track center distance of 8.0 m. We selected embankments 3 m, 6 m, and 9 m high, each with a consistent blanket thickness of 0.6 m and a top width of 7.0 m. These embankments have a side slope of 2H:1V and feature distinct cross-slopes of 1 in 30 for each track, thereby creating a central trough between the two [25]. The cross-section of the chosen embankment is illustrated in Figure 2, and its dimensions are listed in Table 1.
Typically, subgrades are constructed using locally available soils, resulting in the use of the same material for both the embankment and foundation [10]. However, there are instances when local soil is unsuitable for subgrade construction [33]. In such cases, soil from different locations is used, leading to variations in the materials used for embankments and foundations [34,35,36]. In this study, well-graded sand and sandy silt, representing soil categories SQ3 and SQ2, respectively, were selected as the subgrade to represent the most common scenarios. The blanket material was defined as well-graded coarse sand. The ratio of embankment height H to foundation width W to foundation depth D is also an important factor in the variation of the groundwater level within an embankment, as analyzed by Kusaka et al. [37] for the W/H ratio, varying from 4 to 100, and the D/H ratio, varying from 0.1 to 14. Moreover, the total land available within railway boundaries normally varies between 40 m and 400 m [22]. Accordingly, the depth D and width W of permeable strata/foundation soil have been selected as 50 m and 400 m, respectively.
Considering the vast network of Indian railways spread across diverse geographical regions, specifying a single type of subsoil is challenging. Therefore, we selected three different types of subsoils for this study: i. sandy soil, ii. clayish sand, and iii. silty clay. The depth of the groundwater table varies not only through different regions but also through different seasons in India. A network of around 25,000 observation wells monitored during different seasons indicates that the groundwater table is at the highest position and, therefore, is most critical during monsoon season, i.e., June to September, when around 37% of wells show water levels of less than a 2 m depth below ground level [38]. For this study, we considered three different initial water table positions, 0.0 m, 1.5 m, and 3.0 m below the NGL, to reflect the most critical conditions.

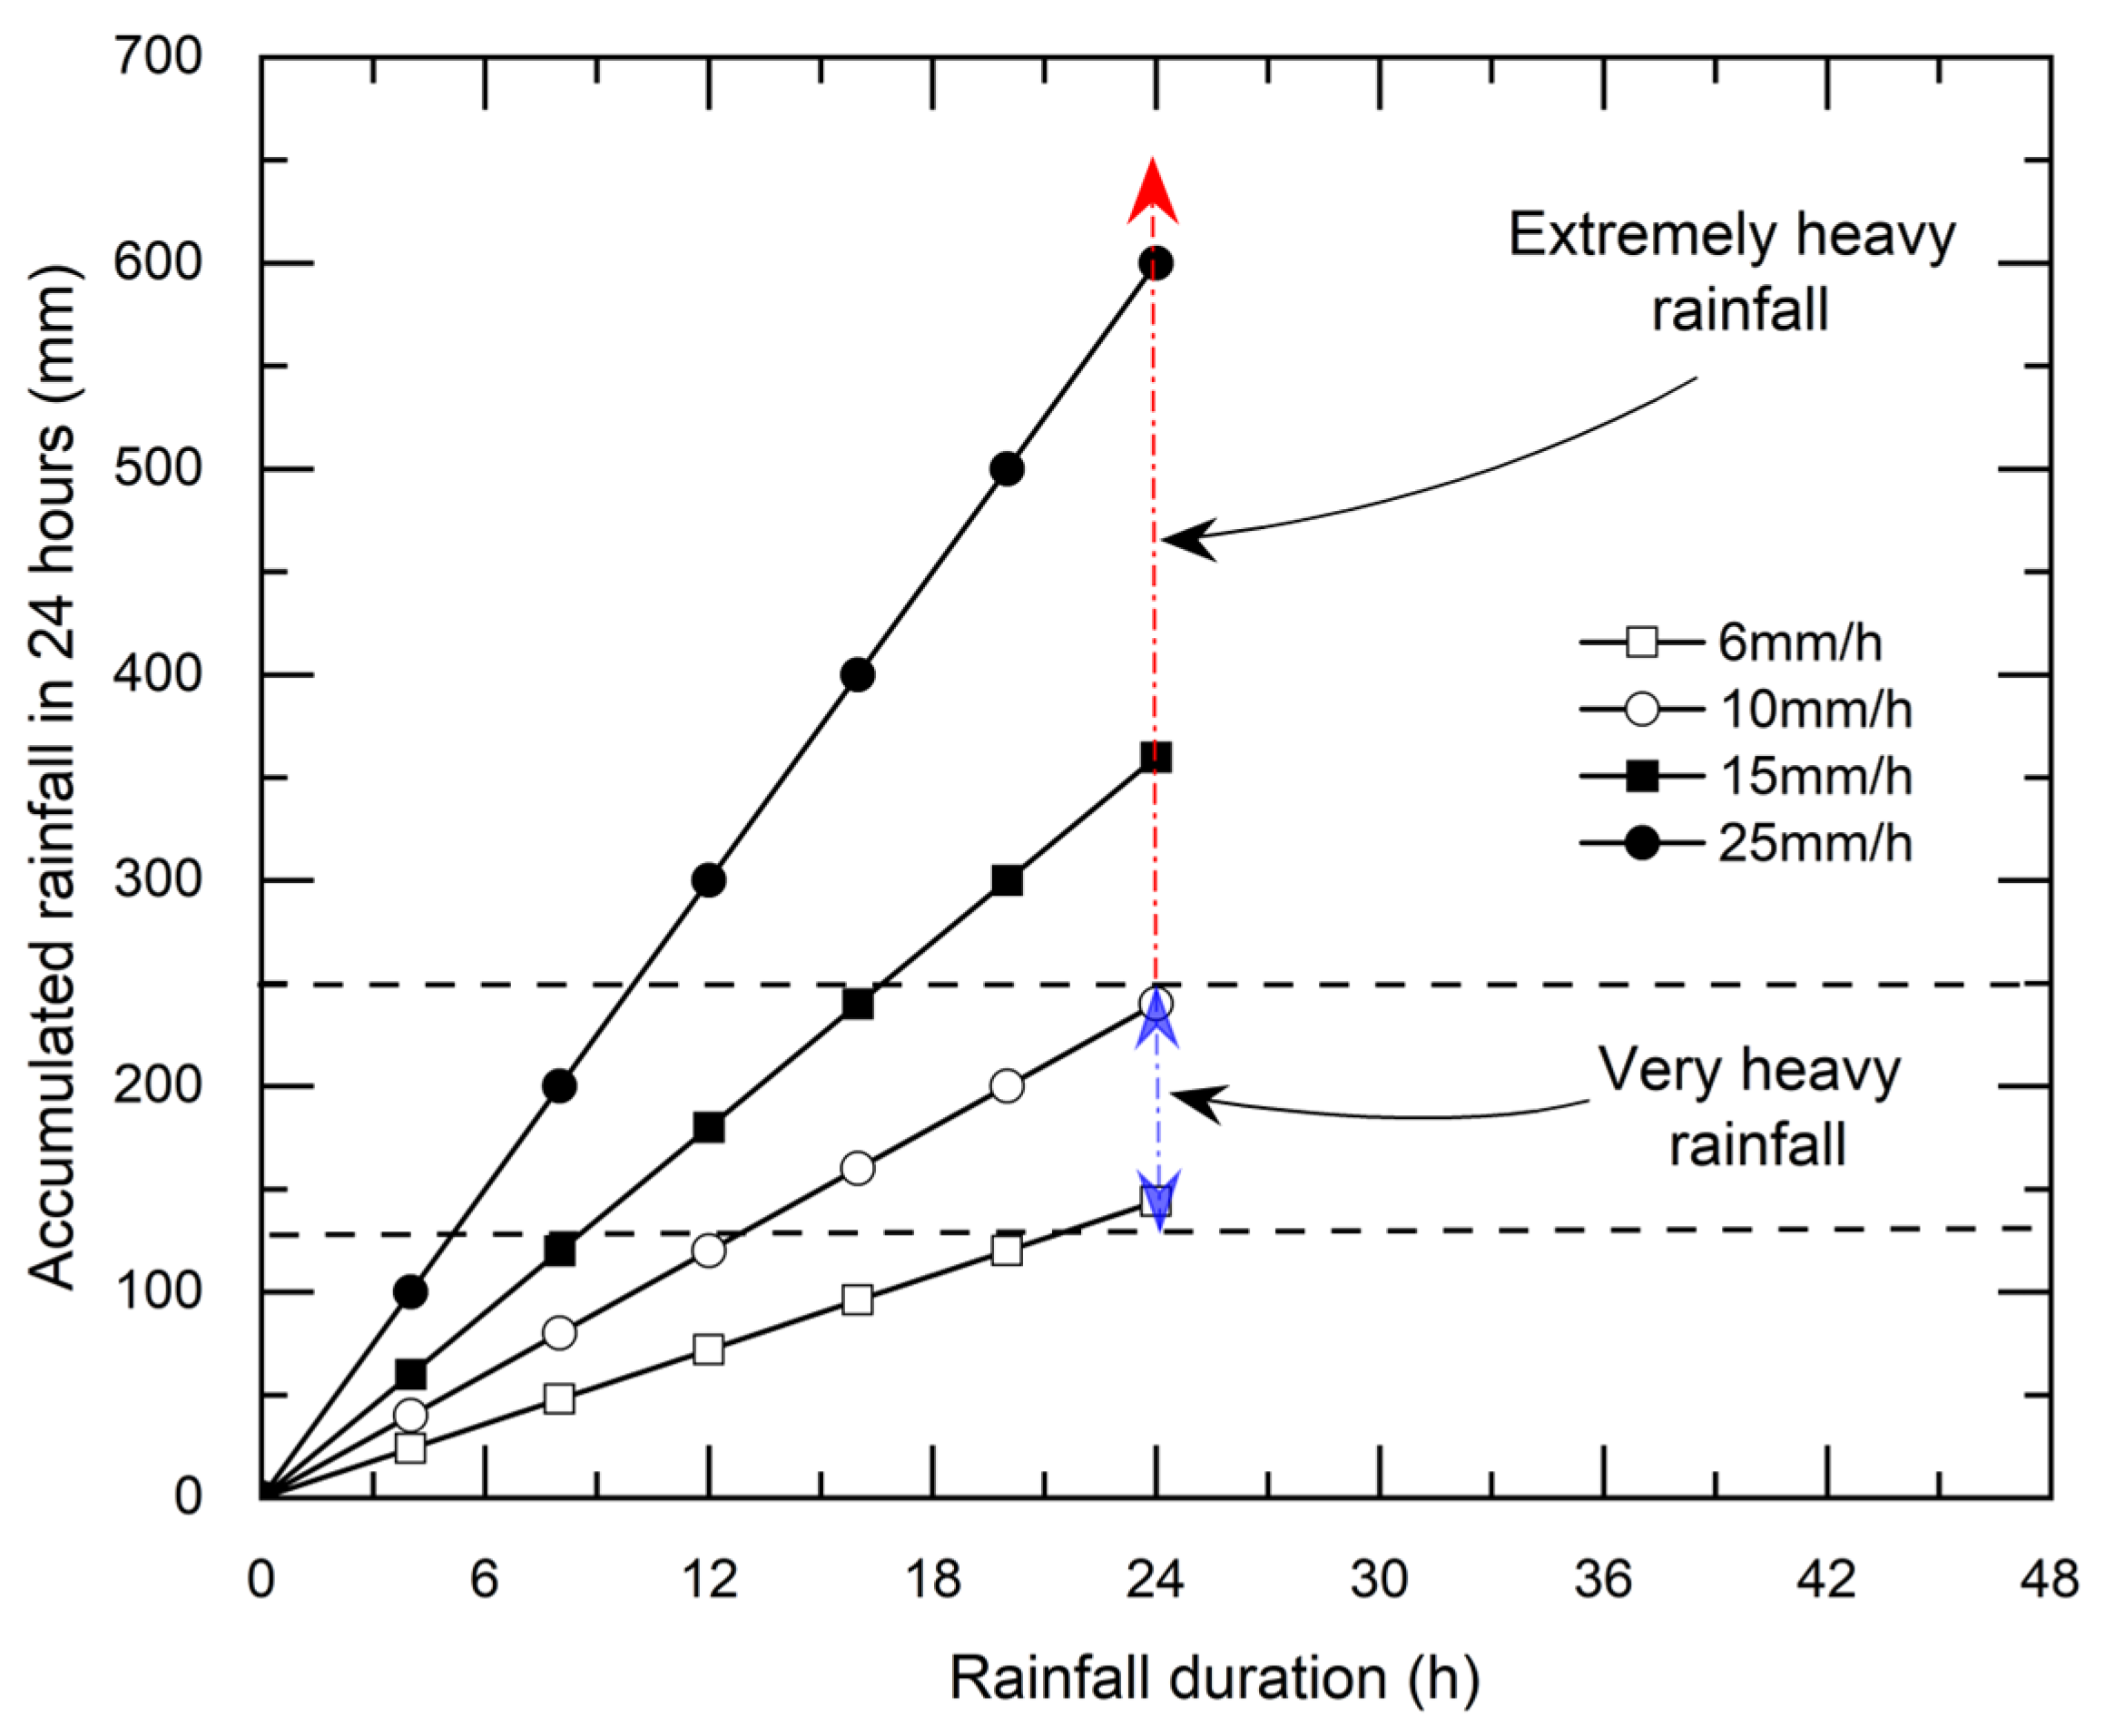
3. Rainfall Trends and Selected Scenarios

The Indian Meteorological Department (IMD) categorizes rainfall based on total accumulation over a 24 h period, as summarized in Table 2 [39]. Most Indian rainfall occurs during the monsoon season (June–September), contributing approximately 75% of the annual rainfall [8]. India has experienced considerable variability in monsoon rainfall, prompting numerous studies on its historical trends and future predictions. An analysis of century-long rainfall data from India’s 36 meteorological subdivisions revealed no long-term trends in annual, seasonal, or monthly rainfall nationwide [8,40]. However, there has been a notable decrease in very light and light-to-moderate rainfall events and a significant increase in very heavy and extremely heavy rainfall events across the country [8].
Khaladkar et al. [41] studied 165 meteorological stations across India, focusing on the highest 24 h rainfall recorded at each station. They discovered that of the 69 events with rainfall ≥ 500 mm between 1875 and 1990, 24 occurred in the last 30 years, indicating an increase in extreme rainfall events recently. Dash et al. [42] analyzed changes in short and long spells of monsoon rainfall and found an increase in short-duration (less than four days) heavy rain events across India.
Future projections suggest that this trend will continue and intensify. Krishnan et al. [9] predicted a wetter future for most of India, with a 10–14% increase in annual rainfall and a 5–10% increase in monsoon rainfall by the twenty-first century’s end. Extreme precipitation events are expected to increase throughout this century. This is supported by Mukherjee et al. [43], who anticipated more frequent extreme precipitation events, particularly in southern and central India, with rare extreme events intensifying in future climates. Ali et al. [44] also projected significant increases in the 1–3-day rainfall maxima in most Indian urban areas.
The extreme precipitation events, which are on a rising trend, are not uniform throughout India, and significant regional variation has been reported by several studies. Goswami et al. [45] analyzed daily gridded rainfall data from 1951 to 2000 and found that the frequency of heavy (>100 mm per day) and very heavy (>150 mm per day) rain show a significant increasing trend over central India. Similarly, Rajeevan et al. [46] and Falga et al. [47] reported that extreme rainfall events are mainly observed along the west coast and northeast and central India. Chaubey et al. [48] analyzed the trend in extreme rainfall events over Indian river basins using rainfall data from 1901 to 2019 and concluded that western and central Indian river basins have experienced increasing very heavy and extremely heavy rainfall events, with significant increases reported in the western ghats region. The distribution of rainfall events over India, indicating the concentration of extreme rainfall events mainly along west coast and central and northeast India, is shown in Figure 3.
In summary, while annual and seasonal rainfall in India show no significant variation, there is a clear increasing trend in extreme rainfall events, both historically and in projected future scenarios. Historical heavy rainfall events, ranging from 156 mm to 594 mm in 24 h (6.5 mm/h to 24.75 mm/h), have already caused substantial damage to railway embankments [2,3,5,7]. The potential for catastrophic damage to embankments is high with the projected increase in these extreme precipitation events. Consequently, this research focused on very heavy and extremely heavy rainfall categories, typically lasting 1–4 d. The selected rainfall scenarios, along with their 24 h thresholds as defined by the IMD, are depicted in Figure 4.
(i)
6 mm/h for 96 h;
(ii)
10 mm/h for 72 h;
(iii)
15 mm/h for 48 h;
(iv)
25 mm/h for 24 h.

4. Methodology for Transient Unsaturated–Saturated Seepage Analysis

In this study, we conducted a transient unsaturated–saturated seepage analysis using the finite element method to examine changes in the groundwater table position within an embankment during rainfall. For groundwater flow in the transient condition, a numerical model using flow governed by Darcy’s law, along with the continuity equation developed by Song [49], has been used. The soil water characteristics curve (SWCC) is a relationship between volumetric water content and suction in the soil. In this study, we employed soil water characteristic parameters based on the van Genuchten equation [50] as follows:
ϴ = ϴ r + ϴ s ϴ r [ 1 + α s n ] m
where
  • ϴ = volumetric water content (m3 H2O/m3 soil);
  • ϴr = residual volumetric water content (m3 H2O/m3 soil);
  • ϴs = saturated volumetric water content (m3 H2O/m3 soil);
  • α = fitting parameter associated with the air entry value of the soil (m−1);
  • s = suction (m of H2O);
  • n = fitting parameter associated with the rate of water extraction from the soil (dimensionless);
  • m = 1 1 n (dimensionless).
Suction is largely influenced by the saturated permeability, the Ksat of the soil, which has been determined for railway embankment and foundation soil in a few studies in India [10,34,36]. The SWCC parameters for embankment and foundation soil in this study were chosen based on prior research on Indian railway embankments and embankments used in highways and railways in other countries [10,35,37,51,52,53,54]. The selected parameters are listed in Table 3, and the corresponding SWCC plots are shown in Figure 5. The boundary conditions for numerical modeling are depicted in Figure 6. During the transient seepage analysis, only the embankment top and side slopes were assigned boundary conditions of “infiltration” because the focus of this study is to analyze the effect of rainfall within the embankment only. The interfaces between the blanket and subgrade layers and between the old and new embankments are subjected to seepage. The interface between the subgrade layer and foundation soil at the NGL was also assigned a seepage boundary condition, whereas both the sides and bottom of the foundation soil were set as undrained boundaries. The initial state of the transient seepage analysis was determined by performing steady-state seepage analysis, which established the initial position of the groundwater table in the absence of rainfall. We then observed changes in the groundwater level through transient seepage analysis, defining the groundwater level as the height at which the pore water pressure is zero. We anticipated a maximum rise in water at the center of the double-line embankment owing to the presence of a central trough between the tracks and, accordingly, variation of groundwater level was measured along the cross-section at the embankment center, as shown in Figure 7. This study did not account for the effects of evaporation, runoff, and drainage arrangements. The variation in groundwater depends on several factors. We analyzed the impact of these influencing elements in the following order:
  • Rainfall scenario;
  • Embankment height;
  • Properties of the foundation and embankment materials;
  • Initial position of the groundwater table.

5. Results

Figure 8a illustrates the impact of rainfall on groundwater table variation within a railway embankment. It should be noted that a negative value of the groundwater level means that the water table is below the NGL, while a positive value indicates that the water table position is above the NGL. For this analysis, we selected a 6 m high embankment with a subgrade and foundation made of sand and a groundwater table 1.5 m below ground level. When exposed to rainfall, the groundwater initially rises slowly and then reaches a stable convergence level after a certain period. The higher the rainfall intensity, the faster the water level increases, and the higher the convergent level. This suggests that under the extreme rainfall conditions expected in the future, the groundwater is likely to rise more rapidly to a much higher level.
Figure 8b shows the groundwater level changes within sandy embankments of three different heights, all constructed over sandy foundation soil and subjected to 10 mm/h of rainfall. The groundwater-increase pattern was consistent across all heights; it began to increase after a delay and eventually reached a convergent level. The taller the embankment, the higher the convergence level, and the longer it takes to converge.
We also examined the effects of different subsoil types. A 6 m high embankment with a sandy subgrade, exposed to 10 mm/h rainfall, was analyzed over three types of foundation soils: sand, clayey sand, and silty clay. Figure 8c shows the groundwater variation for the different foundation soils. The lower the coefficient of saturated permeability (Ksat), the faster the groundwater rises, and the higher the convergence level. Therefore, embankments built over subsoil with a higher percentage of fines (lower permeability) are more prone to failure, as the water rises quickly to a much higher level.
Figure 8d compares the groundwater level variations in two different embankment materials, one with a sandy subgrade and the other with a sandy silt subgrade—under 10 mm/h rainfall. The lower Ksat in the sandy silt resulted in a faster groundwater rise and a higher convergent level owing to the higher saturated volumetric water content of the material. This indicates that embankments comprising finer soils are more vulnerable to future climatic conditions.
Finally, Figure 8e shows the influence of the initial groundwater table position in a 6 m high embankment with a sandy subgrade over sandy subsoil, which was also subjected to 10 mm/h rainfall. For the water table at the ground level and 1.5 m below the ground level, the groundwater starts rising after a delay and then reaches a convergent level. However, for a water table 3.0 m below the ground level, the groundwater did not reach the convergent level, even after 72 h of rainfall. If the rainfall continues beyond 72 h (as indicated by Δ in Figure 8e), the groundwater eventually converges. From this, we inferred that the lower the initial water table position, the slower the groundwater rise, the lower the convergence level, and the longer it took to converge. Consequently, embankments in areas with high groundwater tables are more susceptible to damage during extreme rainfall events.

6. Discussion

6.1. Definition of Key Parameters

To comprehensively explain the behavior of embankments during extreme rainfall events, four critical parameters were defined: onset time, convergent time, rising time, and convergent level.
(i)
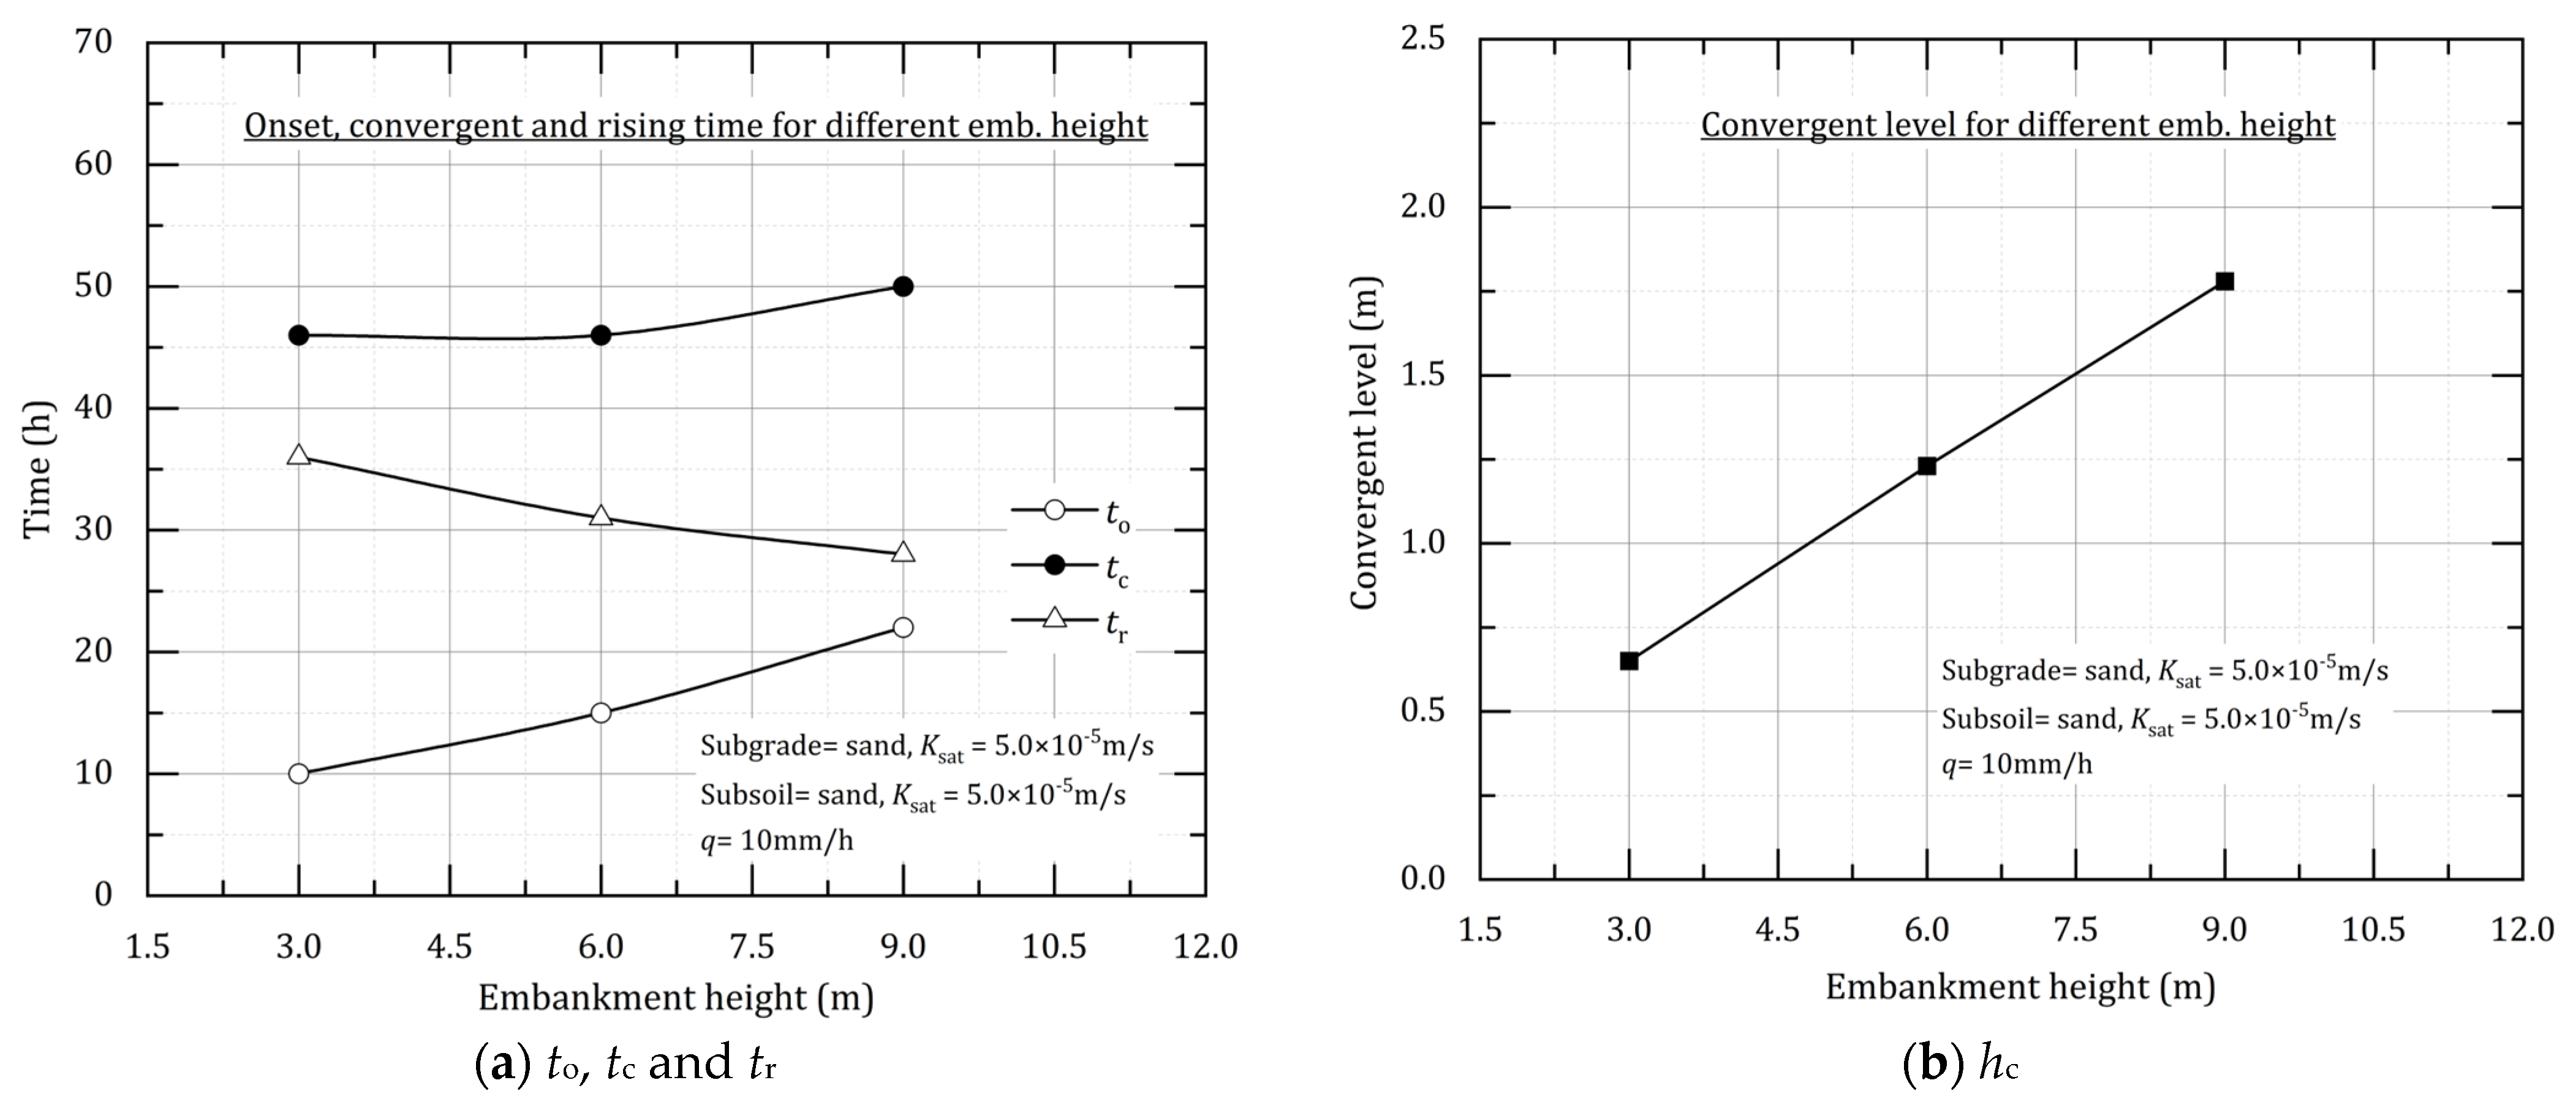
Onset time (to). This is the time when the groundwater level begins to increase significantly above its initial level. To determine the onset time, we drew a line along the steepest slope of the groundwater variation curve (step 1 in Figure 9a) and a horizontal line through the initial groundwater level (step 2). The point at which these two lines intersect indicates the onset time (step 3).
(ii)
Convergent time (tc). As shown in Figure 9, the variation in groundwater level becomes very little or negligible towards the end of rainfall. The time after which changes in the groundwater level become negligible can be defined as convergent time for a given set of parameters such as rainfall intensity, initial GWT depth, material, etc. To determine this, a line (step 1) connecting the initial and final positions of the groundwater level (shown in Figure 9b) was drawn and then offset upward (step 2) in +Y direction to become tangent to the rising limb of the curve. A horizontal line through the final groundwater level is also drawn (step 3). The convergence time is determined by the intersection of the tangent and horizontal lines (step 4).
(iii)
Rising time (tr). This is the critical period when the groundwater rises within the embankment, making it most vulnerable to failure. It is calculated as the difference between the convergence and onset times.
(iv)
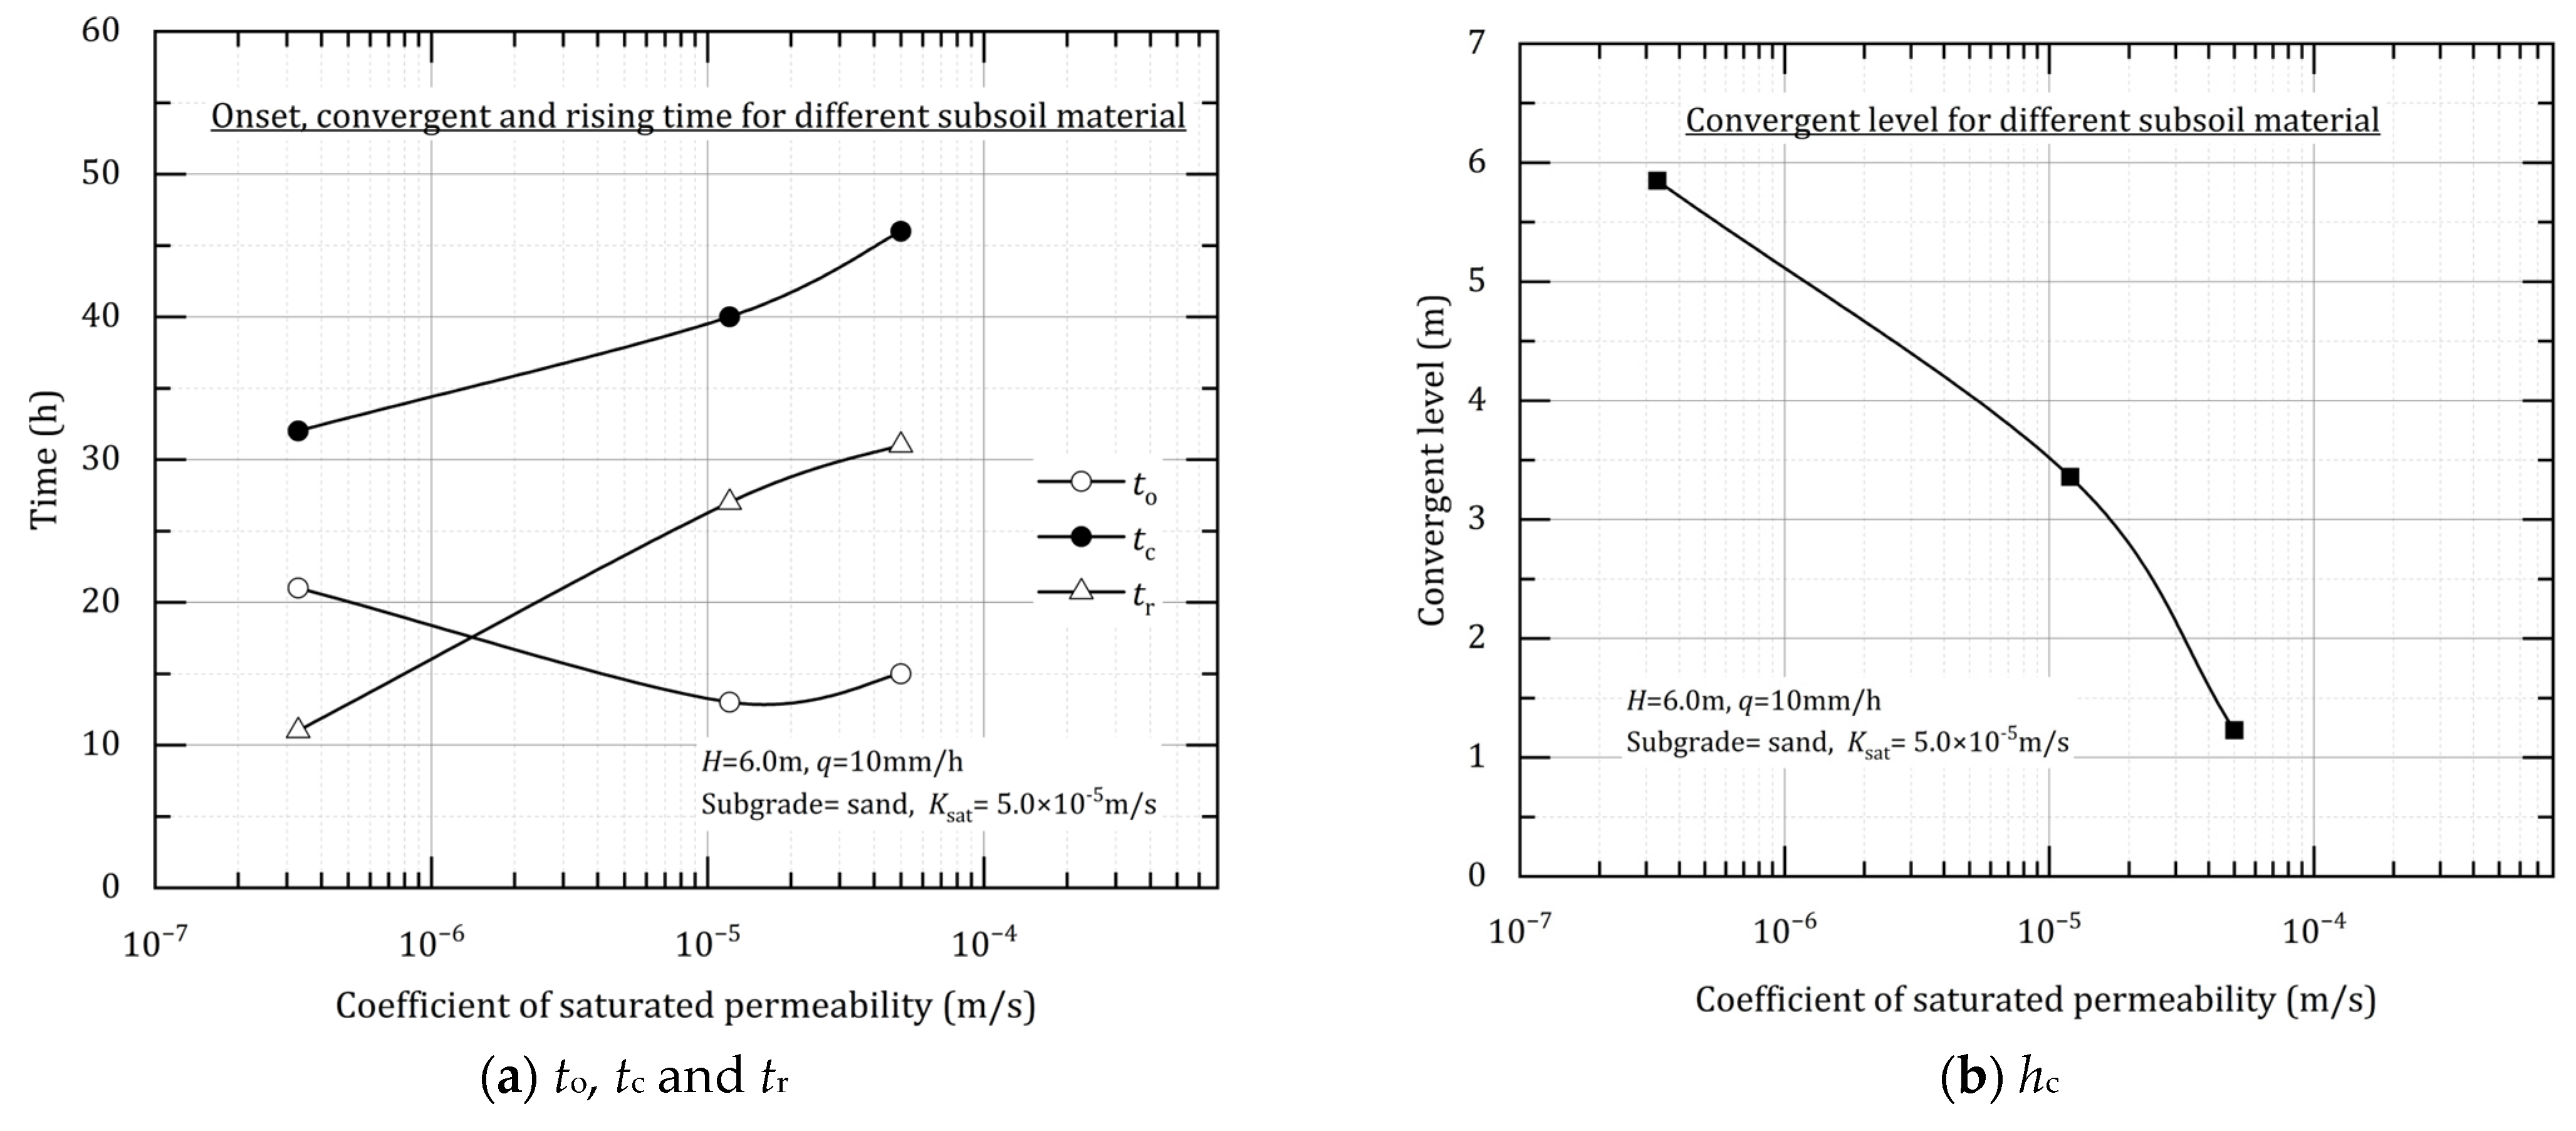
Convergent level (hc). This is the level beyond which the variation in groundwater position becomes minimal or negligible. It was obtained by averaging the groundwater levels beyond the convergent time, as shown in Figure 9b.
These parameters are essential for understanding and predicting the responses of railway embankments to intense rainfall, thereby aiding in their design and maintenance for enhanced safety and resilience.

6.2. Effect of Influencing Factors on the Key Parameters

Figure 10 illustrates the relationship between rainfall and the key parameters. The onset, convergence, and rising times were inversely proportional to rainfall intensity. That is, the higher the rainfall intensity, the quicker the groundwater starts to rise and reaches a convergent level. This implies that under future extreme rainfall events, the groundwater will rise earlier and stabilize faster than in the present climate. However, the convergence level is directly proportional to rainfall intensity, indicating that the groundwater will rise to higher levels under future climatic conditions.
Figure 11 shows the impact of embankment height on these key parameters. The onset time increased with the embankment height, indicating that taller embankments experienced delayed groundwater rise. The convergence time is similar for the 3 m and 6 m embankments but longer for the 9 m embankments, suggesting an increase in convergence time with height. However, the rising time decreased with increasing height, indicating a quicker water rise on taller embankments. The convergent level is directly correlated with the embankment height; however, the normalized convergent level (hc/H) remains consistent across different heights. Figure 12 shows the convergent water profile within a 3 m and 9 m embankment, and both have the same material properties. It can be concluded that the convergent water profile was similar, irrespective of the embankment height.
Figure 13 shows the effect of the subsoil on these parameters. Initially, the onset time decreased with decreasing soil permeability but later increased as the permeability dropped further. This is because of the groundwater increase mechanism within the embankment. Rainwater first infiltrates from the side slopes into the subsoil near the toe of the embankment and then flows horizontally towards the center, as shown in Figure 14. Clayish sand leads to an earlier onset owing to its lower permeability, whereas the very low permeability of silty clay delays horizontal flow, resulting in a significantly longer onset time. Both convergent and rising times decreased with decreasing permeability, with much lower values observed in finer soils such as silty clay, clay, or clayey silt. This suggests a sudden increase in the water level and a quicker achievement of the convergent level in the finer subsoils. The convergent level also increases with decreasing permeability owing to the higher saturated volumetric water content in soils, such as clayey sand and silty clay, which can hold more water.
In the case of different subgrade materials (as shown in Figure 8d), the onset was delayed in the sandy silt subgrade, but the rate of increase and the final convergent level were higher than those in the sandy subgrade. This suggests that embankments with finer subgrade soil are more vulnerable to climate change.
Figure 15 shows the effect of the initial position of the groundwater table on these parameters. The onset, convergence, and rising times were directly proportional to the depth of the groundwater table below the NGL, with an exponential increase in the convergent and rising times as the depth increased. This means that in areas where the water table is closer to the ground level, the groundwater starts rising earlier and reaches the convergent level faster under extreme rainfall events. Conversely, the convergence level was inversely proportional to the initial water table depth.
The effects of each influencing factor on groundwater variation are summarized in Table 4.

6.3. Normalization of Influencing Factors

A unique groundwater variation curve was developed by normalizing the water level and time against the key parameters or influencing factors. This curve remains consistent, regardless of the value of the influencing factor, and can be practically applied in the field. Figure 16 displays a normalized plot for various rainfall scenarios, where the groundwater level h normalized by the convergent level hc is plotted against the elapsed time (t > to) normalized by the rainfall intensity q. The normalized water level in Figure 16 indicates the water level at time t relative to the convergent level, while normalized time represents accumulated rainfall, as indicated by Equations (2) and (3), respectively. This normalized plot, specific to a given height, remained the same across different rainfall intensities. It can be used to determine the water level inside a 6 m high embankment under any rainfall intensity, assuming that the subgrade and subsoil are sand and the initial water table is 1.5 m below the NGL. By measuring the rainfall intensity on site, the onset time and convergence level can be deduced in Figure 10, and the water level inside the embankment at any time t can be graphically determined in Figure 16.
N o r m a l i z e d   w a t e r   l e v e l = h h c
where
  • h = water level, relative to the NGL (m);
  • hc = convergent level for a given rainfall intensity (m).
N o r m a l i z e d   t i m e = t × q for t > t o
where
  • t = time (h);
  • q = rainfall intensity (mm/h).
Figure 17 shows the normalized groundwater variation plot for different embankment heights. Here, the groundwater level h normalized by the embankment height H was plotted against the elapsed time t (for t > to) and normalized by the convergent time tc. In Figure 17, the normalized water level indicates the water level relative to embankment height, while normalized time represents elapsed time relative to convergent time, as indicated by Equations (4) and (5), respectively. This normalized plot remained consistent, irrespective of the embankment height. It can be used to estimate the approximate water level inside embankments of any height subjected to a 10 mm/h rainfall intensity, given that the subgrade and subsoil are sand and the initial water table is 1.5 m below the NGL. For a specific embankment height, the onset and convergence times can be determined using the linear relationship shown in Figure 11a, and the water level at any time t can be graphically obtained using Figure 17.
N o r m a l i z e d   w a t e r   l e v e l = h H
where
  • h = water level, relative to the NGL (m);
  • H = embankment height (m).
N o r m a l i z e d   t i m e = t t c for t > t o
where
  • t = time (h);
  • tc = convergent time (h).
Figure 18 shows the normalized convergent water level plots for different foundation soils. In this scenario, a 6 m high embankment subjected to varying rainfall intensities (from 1 mm/h to 100 mm/h) recorded the attained convergent level. This level, normalized by the embankment height, was plotted against the rainfall intensity normalized by the average permeability, assuming a one-dimensional horizontal flow through the embankment and foundation soil layers. The resulting unique normalized plot, which was consistent across all three foundation soils, validated the assumed mechanism of horizontal water flow. As shown in Figure 18, once the normalized rainfall intensity reached a certain threshold, the normalized convergent level became united, indicating complete embankment saturation, beyond which it did not change. This critical rainfall intensity, which causes guaranteed saturation, was uniform across all foundation soil types. This normalized plot aids in determining the convergent level inside a 6 m high embankment when the initial water table is 1.5 m below the NGL. The saturated permeability of the embankment and subsoil can be measured in the field, and then the average permeability, Kh. avg, can be calculated using Equation (6). Subsequently, the convergent water level for a given rainfall intensity was graphically derived in Figure 18.
k h .   a v g = k 1 × z 1 + k 2 × z 2 z
where
  • Kh.avg = average permeability in the horizontal direction (mm/h);
  • Z1 = thickness of soil layer 1, i.e., embankment soil (m);
  • K1 = saturated permeability of embankment soil (mm/h);
  • Z2 = thickness of soil layer 2, i.e., foundation soil (m);
  • K2 = saturated permeability of foundation soil (mm/h);
  • Z = total thickness of all layers = Z1 + Z2 (m).
A distinct pattern of groundwater onset was observed in embankments over silty clay foundations subjected to extremely high rainfall intensities. Figure 19 and Figure 20 show the groundwater positions during the onset and convergence periods for sandy and silty clay foundation soils, respectively. In the sandy subsoil case, the groundwater first rises near the toe and side slopes, followed by horizontal flow, increasing the water level at the center. However, in the silty clay subsoil, the permeability is so low that rainfall infiltrates slowly, saturating the top and side slopes of the embankment before the water level near the toe increases. Infiltrated water keeps rising near the toe region such that during the convergence period, almost the entire embankment, including the top and side slopes, was saturated; however, the central portion of the subgrade and subsoil around the NGL remained unsaturated, as shown in Figure 20b. The central portion around the NGL is the last to get saturated, and it leads to three distinct zero-pore water pressure points along the embankment height at the center. In such cases, defining the actual groundwater level is challenging, making it difficult to plot the groundwater variation curve accurately.
Figure 21 shows the normalized groundwater variation plots for different initial water table positions. The groundwater level h normalized by the convergent level hc was plotted against the elapsed time t (for t > to) and normalized by the convergent time tc, resulting in a consistent curve, regardless of the initial water table position. The normalized water level and normalized time, in Figure 21, are indicated by Equations (2) and (5), respectively. This plot can be utilized to determine the water level inside a 6 m high embankment subjected to 10 mm/h rainfall, with sand as the subgrade and subsoil material. The initial groundwater depth can be measured in the field, and the onset and convergence times can be graphically determined in Figure 15a, whereas the convergence level can be estimated in Figure 15b. Finally, the water level at time t is obtained using Figure 21.

7. Conclusions

In this study, transient unsaturated–saturated seepage analysis was performed on an Indian railway double-line embankment to examine groundwater level variations in the context of climate change. The factors considered included rainfall scenarios, embankment height, initial groundwater table position, and the SWCC properties of subgrade and subsoil. The key findings are as follows:
(i)
Rapid groundwater rises with increased rainfall intensity. We found that groundwater rise within the embankment was directly proportional to rainfall intensity. With increasing intensity, the groundwater increased more rapidly to a higher convergence level. Due to climate change, the frequency of significantly heavy (124.5–244.4 mm in 24 h) and extremely heavy rainfall (>244.4 mm in 24 h) events is expected to rise, potentially making Indian railway embankments more vulnerable in the future and thereby indicating the need to strengthen railway embankments to enhance their resilience to climate change.
(ii)
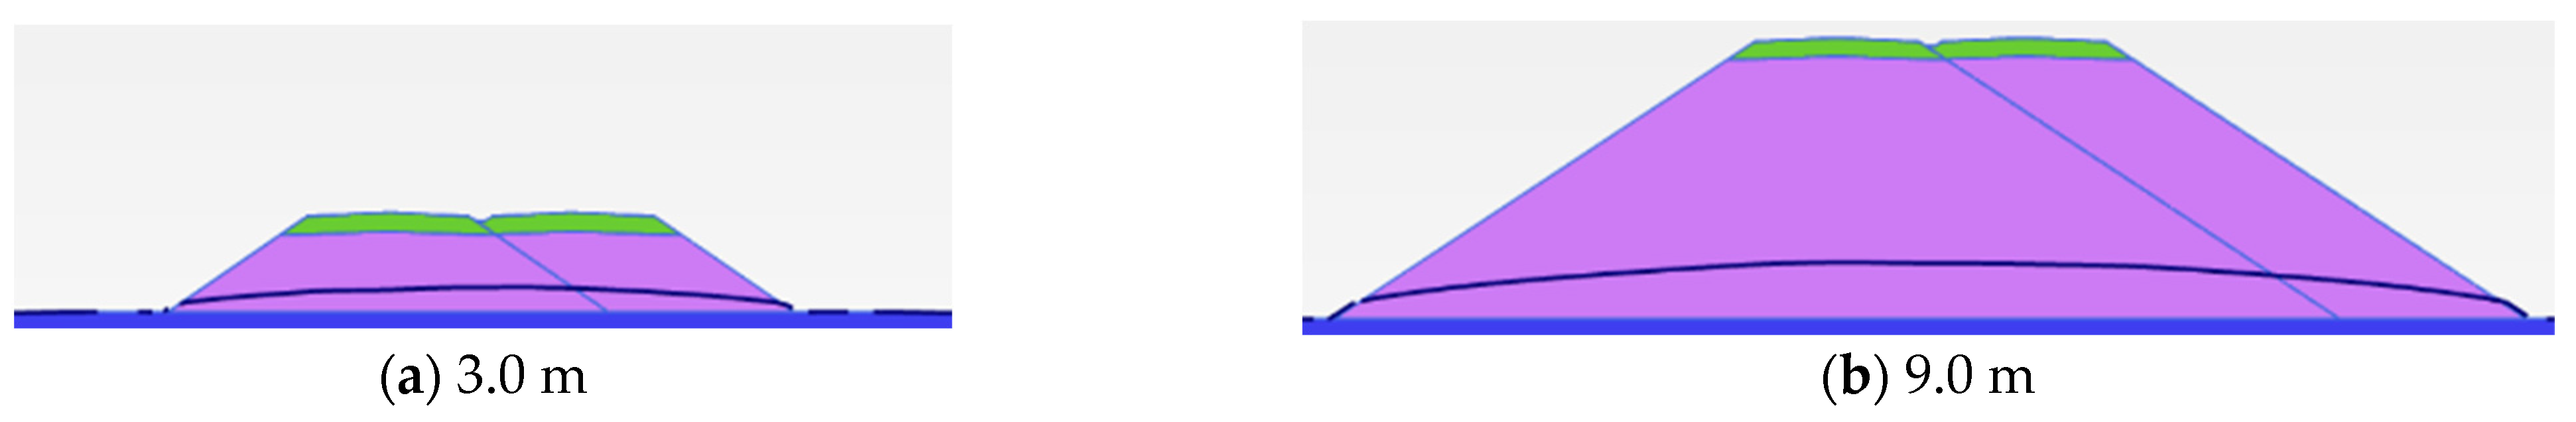
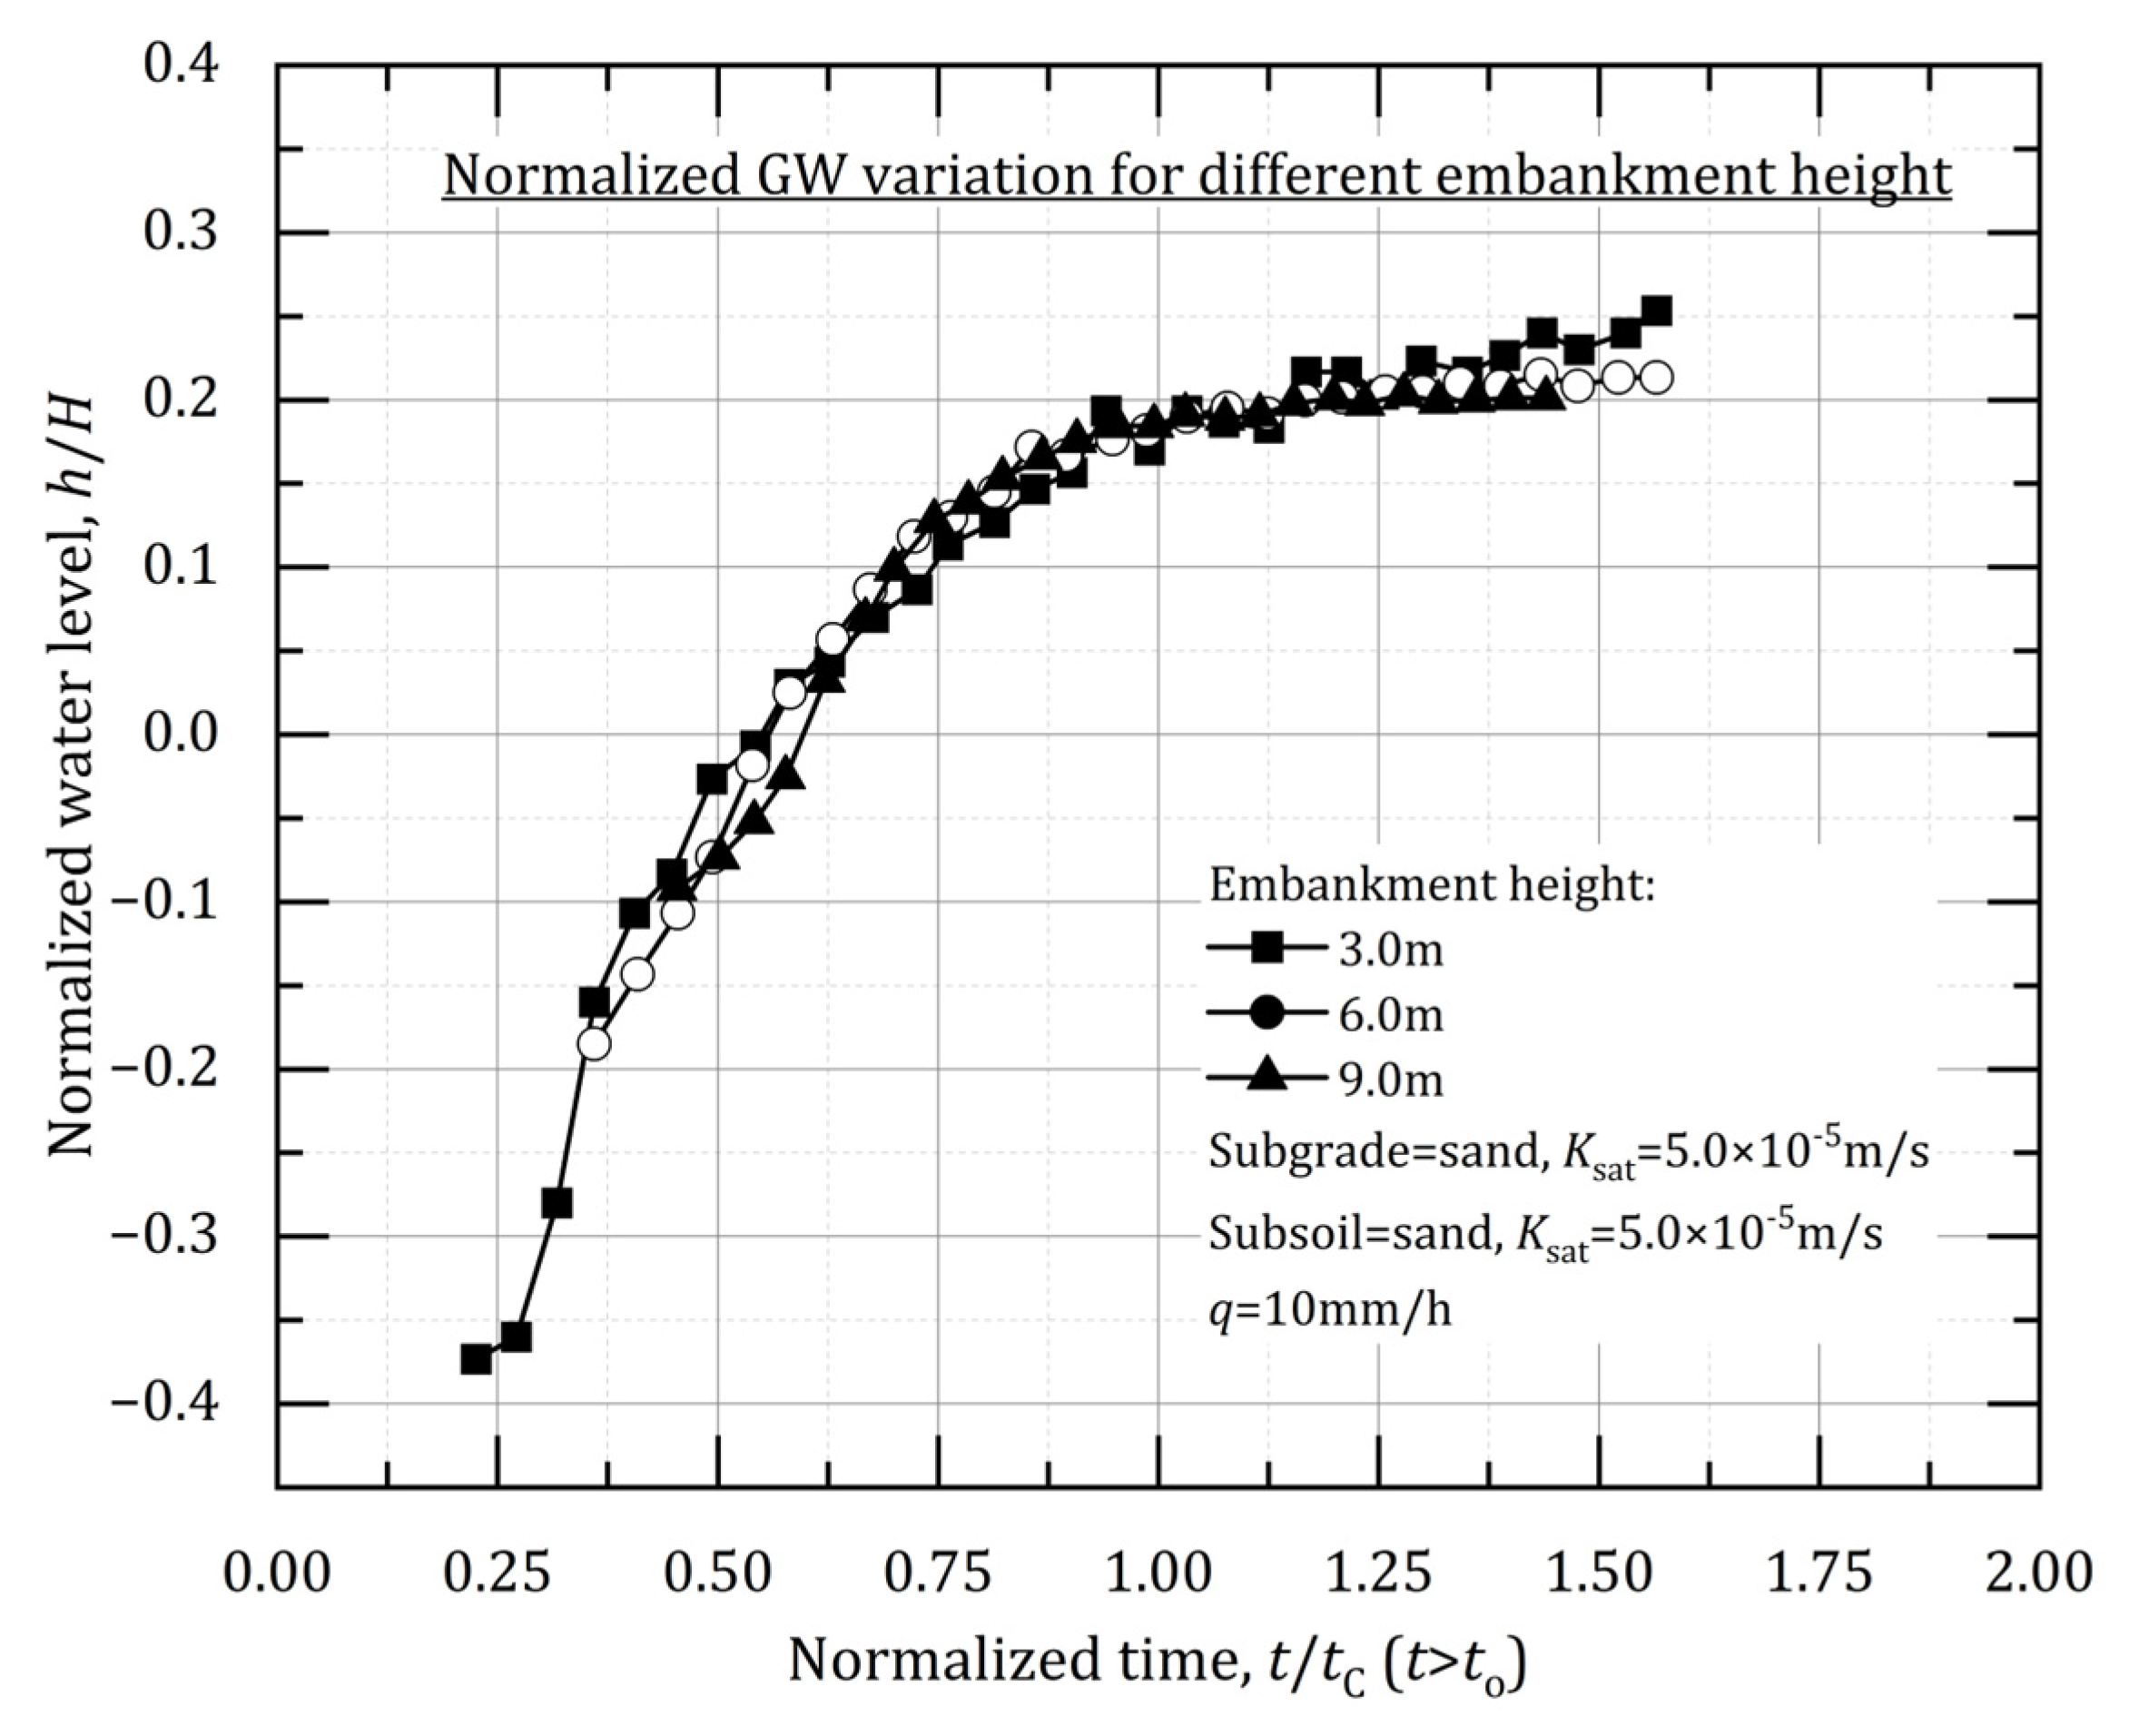
Uniform groundwater onset mechanism across embankment heights. Regardless of embankment height, the groundwater onset mechanism remains consistent. Rainwater first infiltrates through side slopes, increasing groundwater levels near the toe region, followed by horizontal flow, leading to convergence. However, the rate of the water level increase was higher for taller embankments. A single normalized groundwater variation curve was derived, which is applicable for estimating water levels within railway embankments of any height.
(iii)
Convergence is dominated by horizontal flow. A unified plot of the normalized convergence level for different subgrades and subsoil materials can be created, assuming horizontal water flow through these layers. Despite the varied materials used in subgrade and subsoil across India, this mechanism allows for a rough prediction of the convergence level within railway embankments. Although this finding indicates that the horizontal flow is the predominant mechanism in terms of convergence, it would be appropriate to consider other aspects, such as vertical water transport and interaction with geological layers. The combination of these factors can influence the final state of groundwater level convergence in constructions, such as embankments.
(iv)
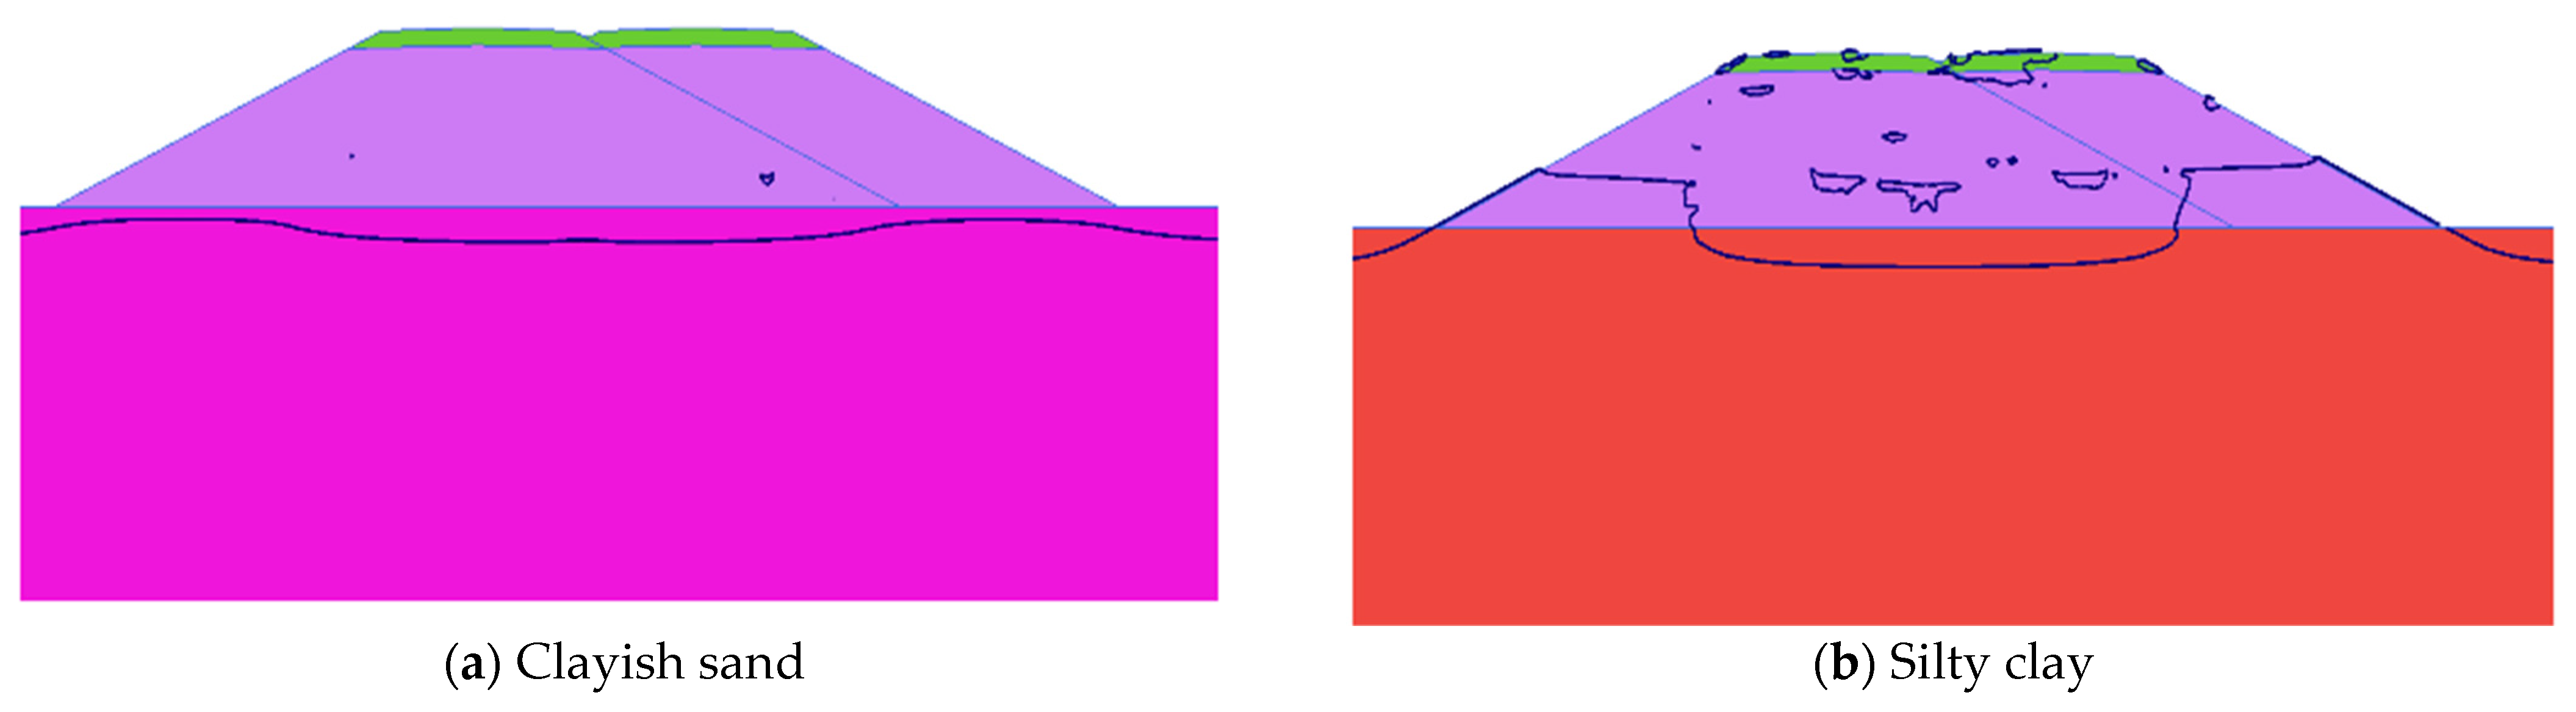
Unique convergence phenomena in low-permeability subsoils. A distinctive phenomenon was observed during the convergence period in the embankments over subsoils with low permeability, particularly under extremely heavy rainfall. The embankment top and side slopes were saturated; however, the bottom central portion and subsoil around the NGL remained unsaturated. In such cases, accurately determining the actual groundwater variation curve is challenging, and the derived curve may not accurately reflect the true water level within the embankment.

8. Limitations and Future Scope

(i)
In this study, only two subgrade soils, sand and sandy silt, belonging to categories SQ3 and SQ2, respectively, have been considered; however, in practice, some embankments are constructed with the very fine soil of SQ1 category, such as clay of low or medium plasticity [33]. Although such cases are rare, the effect of very fine subgrade soil on groundwater variation can be analyzed in a future study.
(ii)
This study focuses only on variations in the groundwater level through embankment height. However, in future prospects, it might be crucial to include the effect of the variation of water level on the stability and rainfall-induced settlement deformation of railway embankments, as performed by Sun et al. [55] and Gombert et al. [56].
(iii)
Flow-only analysis is conducted in this study, thereby establishing a unique convergence phenomenon in the case of low permeability subsoil; however, it does not explore the effect of such phenomena on the long-term stability of railway embankments, and it must be addressed in future studies.
(iv)
This thesis only studies changes in the water level, which is defined by pore water pressure; however, care must be taken, and in a future study, the changes in the internal stress state of the subgrade that might be happening because of changing water levels should be included.
(v)
Future research should consider the effects of evaporation, runoff, and drainage arrangements. Another potential area of study is the development of groundwater variation plots for scenarios with extremely heavy rainfall in which both the subgrade and subsoil exhibit very low permeability. Quantifying the critical rainfall duration and amount that compromises embankment safety presents another research opportunity.

Author Contributions

Conceptualization, M.K. and K.H.; methodology, M.K.; formal analysis, M.K.; investigation, M.K.; visualization, M.K.; supervision, K.H.; validation, M.K. and K.H.; writing—original draft, M.K.; writing—review and editing, K.H. All authors have read and agreed to the published version of the manuscript.

Funding

This research received no external funding.

Institutional Review Board Statement

Not applicable.

Informed Consent Statement

Not applicable.

Data Availability Statement

The original contributions presented in the study are included in the article, and further inquiries can be directed to the corresponding author.

Conflicts of Interest

The authors declare no conflicts of interest.

Nomenclature

hWater level relative to the NGL (m)
hcConvergent level (m)
HEmbankment height (m)
tTime (h)
toOnset time (h)
trRising time (h)
tcConvergent time (h)
qRainfall intensity (mm/h)
KsatCoefficient of saturated permeability (m/s)
Kh.avgAverage permeability in the horizontal direction (mm/h)
ϴVolumetric water content (m3 H2O/m3 soil)
ϴrResidual volumetric water content (m3 H2O/m3 soil)
ϴsSaturated volumetric water content (m3 H2O/m3 soil)
α A fitting parameter related to the air entry value of the soil (m−1)
n A fitting parameter, which is a function of the rate of water extraction from the soil (dimensionless)
sSuction (m of H2O)

References

  1. Sunil Kumar, D. Prepp by Collegedunia. Available online: https://prepp.in/news/e-492-railways-indian-economy-notes (accessed on 27 May 2024).
  2. Chitra, D.R.; Gupta, D.M. Geotechnical Investigations and Slope Stability Analysis of a Landslide. Int. J. Eng. Res. Technol. 2016, 5, 120–127. [Google Scholar]
  3. Davies, R. India-180,000 Evacuated After Floods in Bihar. Floodlist. 14 August 2017. Available online: https://floodlist.com/asia/india-floods-bihar-august-2017 (accessed on 15 October 2023).
  4. PGVS; Christian Aid. Flood Situation Report. PGVS. 2017. Available online: https://reliefweb.int/report/india/situation-report-bihar-floods-pgvs-ca-17082017 (accessed on 15 October 2023).
  5. Mehta, M.K. Maharashtra: Heavy Rain Disrupts Rail Traffic on Central Railway and Konkan Railway Routes. Times of India, 22 July 2021. Available online: https://timesofindia.indiatimes.com/city/mumbai/maharashtra-heavy-rain-disrupts-rail-traffic-on-central-railway-and-konkan-railway-routes/articleshow/84646564.cms (accessed on 15 October 2023).
  6. Indian Meteorological Department Climate Research and Services. Climate Summary for July 2021; Government of India, Ministry of Earth Sciences: New Delhi, India, 2021.
  7. Roy, P.; Martha, T.R.; Kumar, K.V.; Chauhan, P.; Rao, V.V. Cluster landlslides and associated damage in the Dima Hasao district of Assam, India due to heavy rainfall in May 2022. Landslides 2022, 20, 97–109. [Google Scholar] [CrossRef]
  8. Rajeevan, M.; Nayak, S. Observed Climate Variability and Change over the Indian Region; Springer Geology: New Delhi, India, 2016. [Google Scholar]
  9. Krishnan, R.; Sanjay, J.; Gnanaseelan, C.; Mujumdar, M.; Kulkarni, A.; Chakraborty, S. Assessment of Climate Change over the Indian Region; Springer: Pune, India, 2020. [Google Scholar]
  10. Raj, M.; Sengupta, A. Rain-triggered slope failure of the railway embankment at Malda, India. Acta Geotech. 2014, 9, 789–798. [Google Scholar] [CrossRef]
  11. Senthilkumar, V.; Chandrasekaran, S.S.; Maji, V.B. Geotechnical Characterization and Analysis of Rainfall-Induced 2009 Landslide at Marappalam Area of Nilgiris District, Tamil Nadu State; Springer: New Delhi, India, 2017. [Google Scholar]
  12. Ering, P.; Babu, G.L.S. Probabilistic back analysis of rainfall induced landslide-A case study of Malin landslide, India. Eng. Geol. 2016, 208, 154–164. [Google Scholar] [CrossRef]
  13. Juneja, A.; Chatterjee, D.; Kumar, R. Embankment failure in residual soils at Nivsar, Ratnagiri. Int. J. Geoengin. Case Hist. 2013, 2, 229–251. [Google Scholar]
  14. Aqib, M.; Usmani, S.; Khan, T.; Sadique, M.R.; Alam, M.M. Experimental and numerical analysis of rainfall-induced slope failure of railway embankment of semi high-speed trains. J. Eng. Appl. Sci. 2023, 70, 20. [Google Scholar] [CrossRef]
  15. Showkat, R.; Mohammadi, H.; Babu, G.S. Effect of Rainfall Infiltration on the stability of Compacted Embankments. Int. J. Geomech. 2022, 22, 04022104. [Google Scholar] [CrossRef]
  16. Chatra, A.S.; Dodagoudar, G.R.; Maji, V.B. Numerical Modelling of rainfall effects on the stability of soil slopes. Int. J. Geotech. Eng. 2019, 13, 425–437. [Google Scholar] [CrossRef]
  17. Dhanai, P.; Singh, V.P.; Soni, P. Rainfall Triggered Slope Instability Analysis with changing climate. Indian Geotech. J. 2022, 52, 477–492. [Google Scholar] [CrossRef]
  18. Shubhra, P.; Bashir, R.; Beddoe, R. Effect of climate change on earthen embankments in Southern Ontario, Canada. Environ. Geotech. 2021, 8, 148–169. [Google Scholar]
  19. Baninajarian, L.; Ghassemi, A.; Sangiuliano, T.; DeSira, A.; Bashir, R. Effect of Climate Change on Soil Embankment Stability. In Proceedings of the GeoSt.John’s 2019, The 72nd Annual CGS Conference, St. John’s, NL, Canada, 24 October 2019. [Google Scholar]
  20. Ng, C.; Tung, Y.-K.; Wang, B. Three-dimensional numerical investigations of groundwater responses in an unsaturated slope subjected to various rainfall patterns. Can. Geotech. J. 2021, 38, 1049–1062. [Google Scholar] [CrossRef]
  21. Rouainia, M.; Davies, O.; O’Brien, T.; Glendinning, S. Numerical modelling of climate effects on slope stability. Proc. Inst. Civ. Eng.-Eng. Sustain. 2009, 162, 81–89. [Google Scholar] [CrossRef]
  22. City Engineering and Testing Lab. Detailed Plan & L-Section for the Project of Final Location Survey in Connection with Doubling of B.G. Railway Line between Karaila Road and Shaktinagar from km 0.00 to 32.130 of Dhanbad Division, East Central Railway, India, 2018; Drawing no-488/D/LS-DHN/2019 (SH2/7); City Engineering and Testing Lab: Kolkata, India, 2019. [Google Scholar]
  23. Ministry of Railways, Govt of India. Indian Railways Schedule of Dimensions 1676 mm Gauge (BG); Ministry of Railways, Govt. of India: New Delhi, India, 2004.
  24. Research Designs and Standards Organisation, Ministry of Railways, Govt. of India. Guidelines on Erosion Control and Drainage of Railway Formation (Guideline no. GE: G-4); Research Designs and Standards Organisation, Ministry of Railways, Govt. of India: Lucknow, India, 2005.
  25. Research Designs and Standards Organisation, Ministry of Railways, Govt of India. Comprehensive Guidelines and Specifications for Railway Formation Specification no. RDSO/2020/GE: IRS-0044 (Including ACS No-01); Research Designs and Standards Organisation, Ministry of Railways, Govt. of India: Lucknow, India, 2020.
  26. East Central Railway, Ministry of Railways, Govt. of India. Geotechnical Investigation for Construction of Minor Bridge No 357 RCC Box between KPB-BUG Station of Narkatiaganj-Valmikinagar Doubling Work; East Central Railway, Ministry of Railways, Govt. of India: Narkatiaganj, India, 2018.
  27. Western Railway, Ministry of Railways, Govt. of India. Conducting Geo Technical Study by Soil Exploration with Bore Holes and Submitting Test Reports, Preparation and Submission of LWR Plans for Doubling between Surendranagar-Rajkot Stations in Connection with Doubling of Surendranagar-Rajkot Section; BR No-67; Western Railway, Ministry of Railways, Govt. of India: Ahmedabad, India, 2017.
  28. Western Railway, Ministry of Railways, Govt of India. Soil Investigation Work for the Work of Kanalus-Okha Provising RCC Box for Additional Opening (05 nos Locations); CH. 931/1-2; Western Railway, Ministry of Railways, Govt. of India: Jamnagar, India, 2022.
  29. East Central Railway, Ministry of Railways, Govt of India. Geotechnical Investigation Report for Minor Bridge No. 83, 84, 85, 86, 87, 88, 89, 90, 91, 92, 94; East Central Railway, Ministry of Railways, Govt. of India: Singrauli, India, 2017.
  30. South Eastern Railway, Ministry of Railways, Govt. of India. Subsoil Investigation for Construction of Proposed Construction of Normal Height Subway (NHS) (1 × 5.00 m × 5.00 m RCC Box) New Bridge No 91A at km 337.487 in Lieu of Manned LC No. TB-75 between OND-BMPR on TATA-BMPR Branch Line Section of CKP Division; South Eastern Railway, Ministry of Railways, Govt. of India: Dhanbad, India, 2021.
  31. West Central Railway, Ministry of Railways, Govt. of India. Geotechnical report of Jharkheda Syampur Railway Line work CH. 242+955; West Central Railway, Ministry of Railways. Govt. of India: Jharkheda, India, 2022.
  32. North Western Railway, Ministry of Railways, Govt. of India. Geotechnical Investigation Report for Construction Site of ROB at LC no 175, Khanbhakari, Dausa, Rajasthan; North Western Railway, Ministry of Railways, Govt. of India: Jaipur, India, 2020.
  33. RDSO/2007/GE:0014; To Assess the Availability of Subgrade Soil on Various Part of India and Its Cost Implication as per Specification Enumerated in Guidelines for Heavy Axle Load. Geo-Technical Engineering Directorate, Research Designs & Standards Organisation, Ministry of Railways, Govt. of India: Lucknow, India, 2011.
  34. Adapa, M.K.; Phalgun, M. Failure of a railway embankment on soft soil and its restoration. In Proceedings of the 16th Asian Regional Conference in Soil Mechanics and Geotechnical Engineering, Taipei, Taiwan, 14–18 October 2019. [Google Scholar]
  35. Chaudhuri, C.H.; Gangopadhyay, S.; Saha, D.R.; Ponnala, K. Failure Analysis of Railway embankment constructed on soft soil at Tripura—A case study. In Proceedings of the Sixth Indian Young Geotechnical Engineers Conference 6IYGEC2017, Trichy, India, 10–11 March 2017. [Google Scholar]
  36. Deshpande, T.D.; Kumar, S.; Begum, G.; Basha, S.; Rao, B.H. Analysis of Railway Embankment Supported with Geosynthetic-Encased Stone Columns in Soft Clays:A Case Study. Int. J. Geosynth. Ground Eng. 2021, 7, 43. [Google Scholar] [CrossRef]
  37. Kusaka, H.; Takahashi, A. Estimation of water level in road embankment by transient unsaturated seepage analysis. In Proceedings of the 2nd Pan-American Conference on Unsaturated Soils, Dallas, TX, USA, 12–15 November 2017. [Google Scholar]
  38. Central Ground Water Board, Ministry of Jal Shakti, Department of Water Resources, River Development and Ganga Rejuvenation, Government of India. Ground Water Year Book-India, 2022–2023; Central Ground Water Board, Ministry of Jal Shakti, Department of Water Resources, River Development and Ganga Rejuvenation, Government of India: New Delhi, India, 2023.
  39. Bhatla, R.; Verma, S.; Pandey, R.; Tripathi, A. Evolution of extreme rainfall events over Indo-Gangetic plain in changing climate during 1901–2010. J. Earth Syst. Sci. 2019, 128, 120. [Google Scholar] [CrossRef]
  40. Kumar, V.; Jain, S.K.; Singh, Y. Analysis of long-term rainfall trends in India. Hydrol. Sci. J. 2010, 55, 484–496. [Google Scholar] [CrossRef]
  41. Khaladkar, R.; Mahajan, P.; Kulkarni, J. Alarming Rise in the Number and Intensity of Extreme Point Rainfall Events over the Indian Region under Climate Change Scenario; Indian Institute of Tropical Meteorology: Pune, India, 2009. [Google Scholar]
  42. Dash, S.K.; Nair, A.A.; Kulkarni, M.A.; Mohanty, U.C. Characteristic changes in the long and short spells of different rain intensities in India. Theor. Appl. Climatol. 2011, 105, 563–570. [Google Scholar] [CrossRef]
  43. Mukherjee, S.; Aadhar, S.; Stone, D.; Mishra, V. Increase in extreme precipitation events under anthropogenic warming in India. Weather Clim. Extrem. 2017, 20, 45–53. [Google Scholar] [CrossRef]
  44. Ali, H.; Mishra, V.; Pai, D. Observed and projected urban extreme rainfall events in India. J. Geophys. Res. Atmos. 2014, 119, 12621–12641. [Google Scholar] [CrossRef]
  45. Goswami, B.N.; Venugopal, V.; Sengupta, D.; Madhusoodanan, M.S.; Xavier, P.K. Increasing trend of extreme rain events over India in a warming environment. Science 2006, 314, 1442–1446. [Google Scholar] [CrossRef]
  46. Rajeevan, M.; Bhate, J.; Jaswal, A.K. Analysis of variability and trends of extreme rainfall events over India using 104 years of gridded daily rainfall data. Geophys. Res. Lett. 2008, 35, L18707. [Google Scholar]
  47. Falga, R.; Wang, C. The rise of Indian summer monsoon precipitation extremes and its correlation with long-term changes of climate and anthropogenic factors. Sci. Rep. 2022, 12, 11985. [Google Scholar] [CrossRef] [PubMed]
  48. Chaubey, P.K.; Mall, R.K.; Jaiswal, R.; Payra, S. Spatio-temporal changes in extreme rainfall events over different Indian river basins. Earth Space Sci. 2022, 9, e2021EA001930. [Google Scholar] [CrossRef]
  49. Song, E.-X. Elasto-Plastic Consolidation under Steady and Cyclic Loads. Ph.D. Thesis, Delft University of Technology, Delft, The Netherlands, 1990. [Google Scholar]
  50. van Genuchten, M.T. A Closed form Equation for Predicting the Hydraulic Conductivity of Unsaturated Soils. Soil Sci. Soc. Am. J. 1980, 44, 892–898. [Google Scholar] [CrossRef]
  51. Roshan, M.J.; Rashid, A.S.A.; Wahab, N.A.; Hezmi, M.A.; Jusoh, S.N.; Azmi, M. Stability of railway embankment in saturated and unsaturated conditions. Mater. Sci. Eng. 2021, 1153, 012007. [Google Scholar] [CrossRef]
  52. Davies, O.; Rouainia, M.; Glendinning, S.; Birkinshaw, S.J. Assessing the influence of climate change on the progressive failure of a railway embankment. In Proceedings of the International Association for Computer Methods and Advances in Geomechanics (IACMAG), Goa, India, 1–6 October 2008. [Google Scholar]
  53. Khan, M.S.; Nobahar, M.; Stroud, M.; Amini, F.; Ivoke, J. Evaluation of rainfall induced moisture variation depth in highway embankment made of Yazoo clay. Transp. Geotech. 2021, 30, 100602. [Google Scholar] [CrossRef]
  54. Ganjian, N.; Pisheh, Y.P.; Hosseini, S.M.M.M. Prediction of soil-water characteristic curve based on soil index properties. In Experimental Unsaturated Soil Mechanics; Springer: Berlin/Heidelberg, Germany, 2007. [Google Scholar]
  55. Sun, J. Hard particle force in a soft fracture. Sci. Rep. 2019, 9, 3065. [Google Scholar] [CrossRef]
  56. Gombert, P.; Thoraval, A.; Watelet, J.-M. Geomechanical response of an abandoned chalk mine to multi-annual water table fluctuations. Bull. Eng. Geol. Environ. 2019, 78, 3353–3369. [Google Scholar] [CrossRef]
Figure 1. Double-line embankments with no drainage arrangements.
Sustainability 16 06143 g001
Figure 2. Cross-section of selected double-line Indian railway embankment.
Sustainability 16 06143 g002
Figure 3. Distribution of extreme rainfall events during 1901–2019 according to the IMD criteria in different regions across India (a) Heavy rain (b) Very heavy rain (c) Extremely heavy rain (source—Chaubey et al. [48]).
Sustainability 16 06143 g003
Figure 4. Selected rainfall scenarios along with 24 h thresholds for very heavy rainfall (blue marker) and extremely heavy rainfall (red marker).
Sustainability 16 06143 g004
Figure 5. SWCC of soils used in numerical modeling (a) Embankment soil (b) Foundation soil.
Sustainability 16 06143 g005
Figure 6. Boundary conditions used in numerical modeling.
Sustainability 16 06143 g006
Figure 7. Cross-section showing the location where groundwater variation is analyzed.
Sustainability 16 06143 g007
Figure 8. Variation of groundwater levels within an embankment for each influencing factor (a) Rainfall scenario (b) Embankment height (c) Foundation soil (d) Embankment soil (e) GWT position.
Sustainability 16 06143 g008
Figure 9. Method of determination of the key parameters (a) Onset time (b) Convergent time.
Sustainability 16 06143 g009
Figure 10. Effect of rainfall on the key parameters (a) Onset, convergent and rising time (b) Convergent level.
Sustainability 16 06143 g010
Figure 11. Effect of height on the key parameters. (a) Onset, convergent and rising time (b) Convergent level.
Sustainability 16 06143 g011
Figure 12. Convergent water level profile within embankments of different heights (a) 3.0 m (b) 9.0 m (subgrade–sand, subsoil–sand).
Sustainability 16 06143 g012
Figure 13. Effect of subsoil on the key parameters (a) Onset, convergent and rising time (b) Convergent level.
Sustainability 16 06143 g013
Figure 14. Groundwater onset for different subsoils (a) Clayish sand (b) Silty clay (H—6.0 m, subgrade—sand, q—6 mm/h).
Sustainability 16 06143 g014
Figure 15. Effect of the initial groundwater table position on the key parameters (a) Onset, convergent and rising time (b) Convergent level.
Sustainability 16 06143 g015
Figure 16. Normalized groundwater variation plot for different rainfall intensities (H—6.0 m, subgrade—sand, subsoil—sand).
Sustainability 16 06143 g016
Figure 17. Normalized groundwater variation plot for different embankment heights (q—10 mm/h, subgrade—sand, subsoil—sand).
Sustainability 16 06143 g017
Figure 18. Normalized convergent level for different foundation soils (H—6.0 m, subgrade—sand).
Sustainability 16 06143 g018
Figure 19. Groundwater position at different times in the case of sandy foundation soil (a) During onset hours (b) During convergence hours (H—6.0 m, q—50 mm/h, subgrade—sand).
Sustainability 16 06143 g019
Figure 20. Groundwater position at different times in the case of silty clay foundation soil (a) During onset hours (b) During convergence hours (H—6.0 m, q—50 mm/h, subgrade—sand).
Sustainability 16 06143 g020
Figure 21. Normalized groundwater variation plot for different initial groundwater table positions. (q—10 mm/h, H—6.0 m, subgrade—sand, subsoil—sand).
Sustainability 16 06143 g021
Table 1. Embankment and foundation dimensions selected for numerical modeling.
Height, H3.0 m, 6.0 m, 9.0 m
Blanket thickness0.60 m
Subgrade thicknessEmbankment height − blanket thickness
Top width of single track7.0 m
Center-to-center distance between two tracks8.0 m
Side slope2H:1V
Slope at embankment topCross-slope of 1 in 30 in each line
Sub-bank (for height >6.0 m)None
Groundwater table0.0 m, 1.5 m, and 3.0 m below ground level
Width of permeable strata/foundation, W400.0 m
Depth of permeable strata, D50.0 m
Table 2. IMD classification of rainfall events based on daily accumulated rainfall.
Rainfall CategoryDaily Accumulated Rainfall (mm)
No rain0
Very light rain0.1–2.4
Light rain2.5–7.5
Moderate rain7.6–35.5
Rather heavy rain35.6–64.4
Heavy rain64.5–124.4
Very heavy rain124.5–244.4
Extremely heavy rain≥244.5
Table 3. SWCC parameters of embankment and foundation soil used for numerical modeling.
SoilEmbankmentFoundation
BlanketSubgrade
SWCC ParametersSand
(Blanket)
Sand
(Subgrade)
Sandy Silt
(Subgrade)
SandClayish SandSilty Clay
ϴr0.140.170.210.180.190.21
ϴs0.30.330.420.400.440.56
α (1/m)3.42.11.23.821.40.3
n4.441.64.142.11.5
Ksat (m/s)5.0 × 10−55.0 × 10−55.55 × 10−65.0 × 10−51.2 × 10−53.3 × 10−7
Table 4. Summary of the effect of influencing factors on the key parameters.
Influencing FactorOnset Time, toConvergent Time, tcRising Time, trConvergent Level, hc
Increase in rainfall intensity, qDecreases (inversely proportional)Decreases (inversely proportional)Decreases (inversely proportional)Increases (directly proportional)
Increase in embankment height, HIncreases (directly proportional)Increases (especially for larger heights)Decreases (inversely proportional)Increases (directly proportional)
Decrease in the Ksat of foundation soilInitially decreases slightly then increases rapidlyDecreases rapidlyDecreases rapidlyIncreases rapidly
Decrease in the Ksat of embankment soilIncreasesIncreasesDecreasesIncreases
Increase in groundwater table depthIncreases (directly proportional)Increases rapidlyIncreases rapidlyDecreases
Disclaimer/Publisher’s Note: The statements, opinions and data contained in all publications are solely those of the individual author(s) and contributor(s) and not of MDPI and/or the editor(s). MDPI and/or the editor(s) disclaim responsibility for any injury to people or property resulting from any ideas, methods, instructions or products referred to in the content.

