
Forecasting Land Use Dynamics in Talas District, Kazakhstan, Using Landsat Data and the Google Earth Engine (GEE) Platform

 ,
,
Abstract
:1. Introduction
1.1. Literature Review
1.2. Objectives
- Development of predictive models: Formulate and test models that predict changes in land cover and use for 2030, taking into account anthropogenic and natural factors. This involves integrating multiple data and analytical approaches to improve the accuracy and reliability of predictions.
- Change Impact Analysis: Assess the potential environmental, social, and economic impacts of the projected changes to support sustainable land management in the Talas district. This includes examining the impacts of change on biodiversity, water resources, and agricultural production.
- Methodological contribution: To propose improved methods for analysis and forecasting by combining Landsat satellite data with machine learning algorithms within GEE. This involves the development of new approaches to land cover classification and land use adapted to the conditions of arid regions such as the Talas district.
- Practical application of the results: Develop recommendations for local authorities and stakeholders to adapt to the anticipated changes and minimize their negative impacts. This includes suggestions for improving land use practices, water use, and ecosystem conservation.
2. Materials and Methods
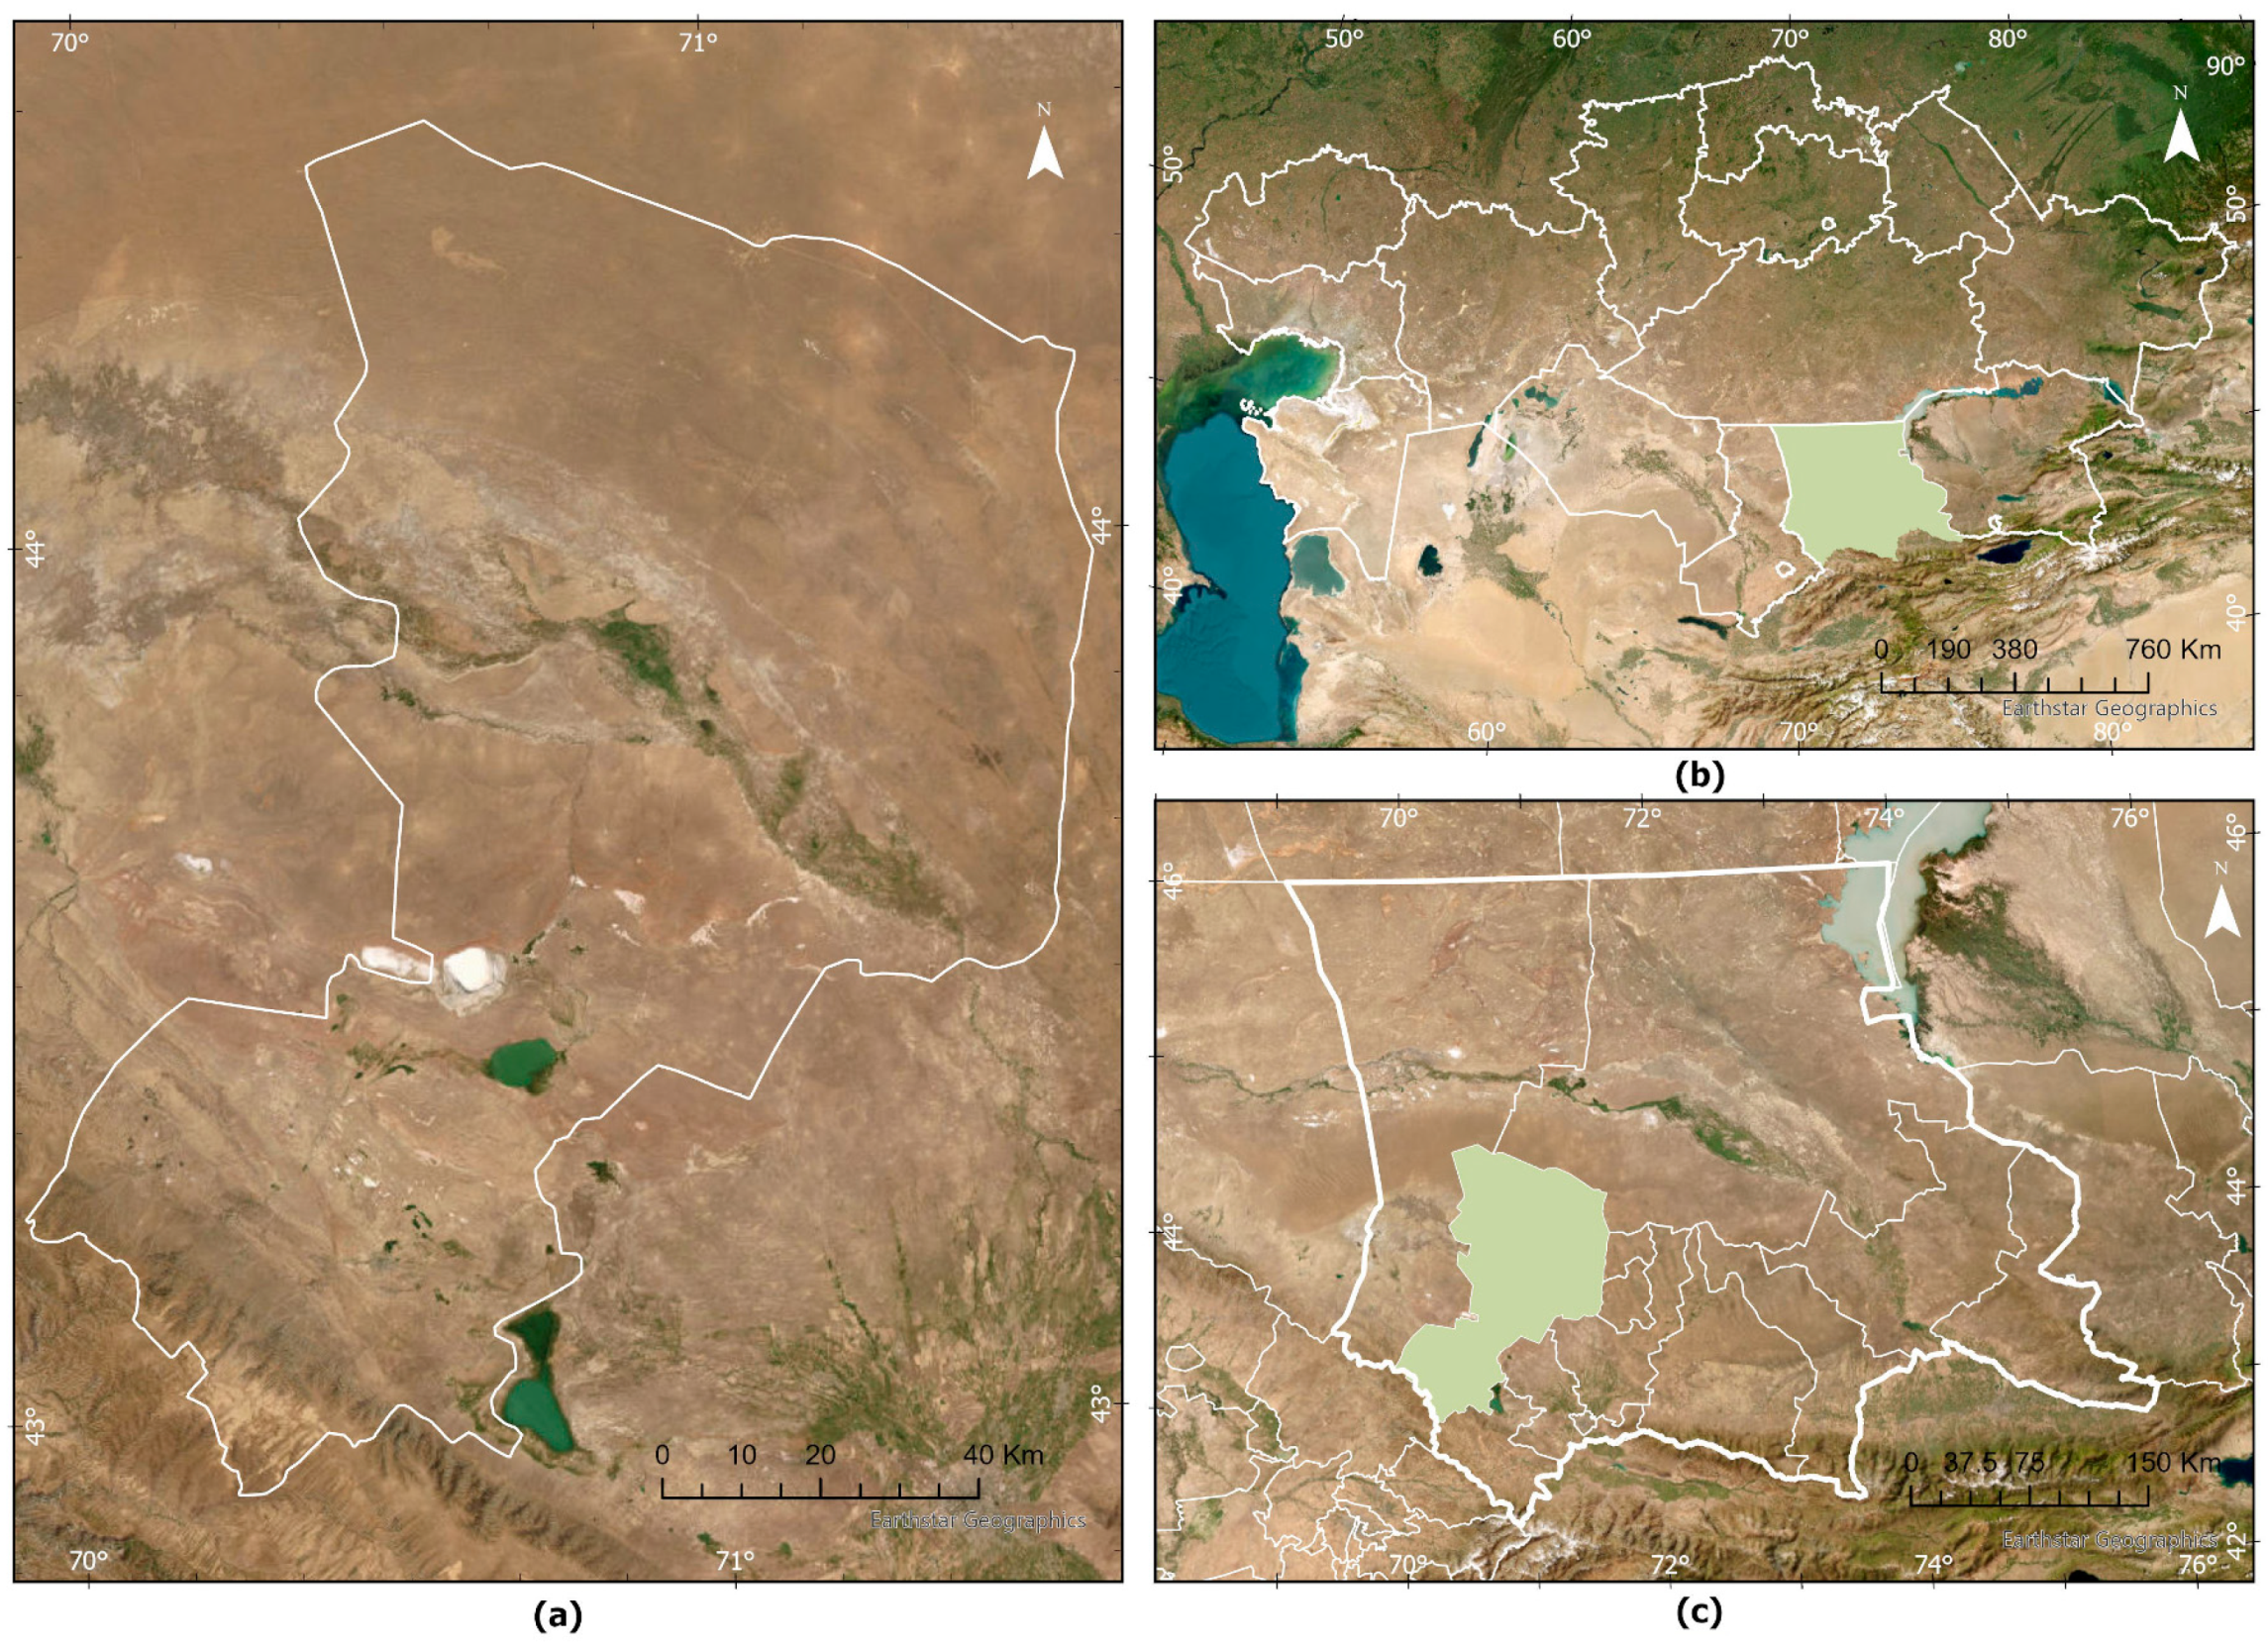
2.1. Study Area
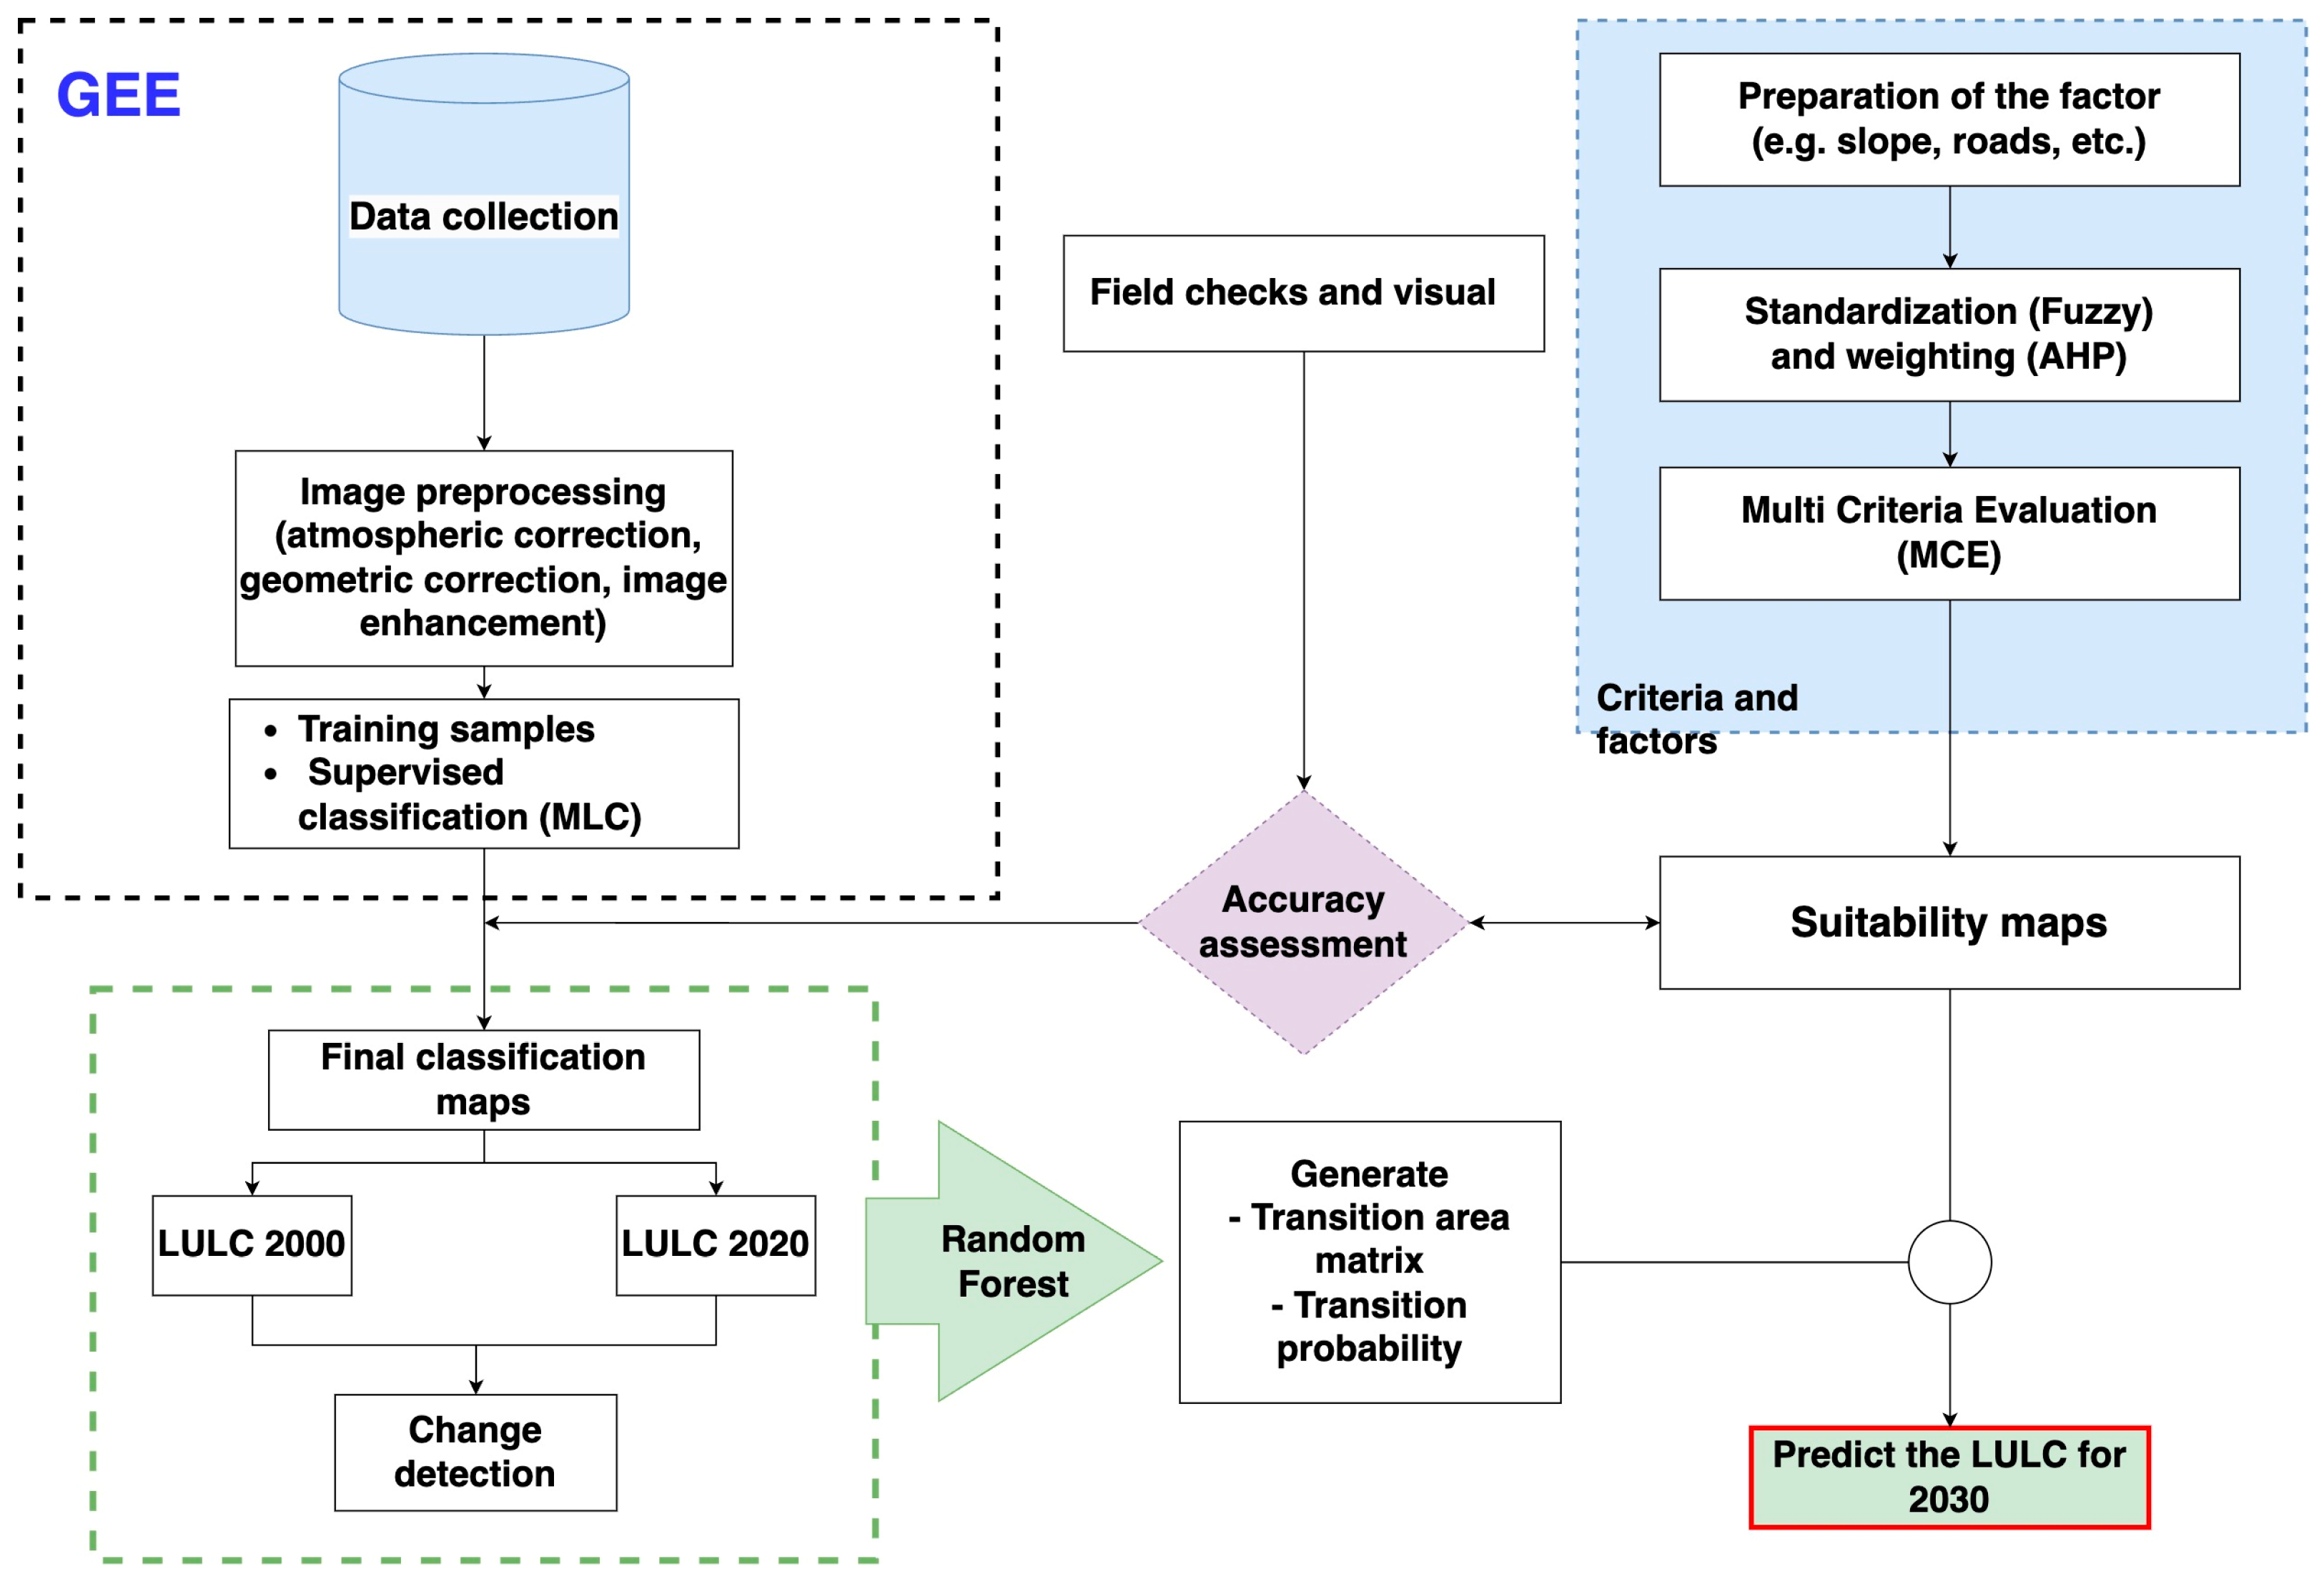
2.2. Materials and Methods
- Data preprocessing: Cleaning and preparation of satellite images.
- Model training: Using training samples to train Random Forest algorithm.
- Model validation: Checking the accuracy of the model on test data.
- Prediction: Using the Random Forest model to estimate the probability of transitions between different land use categories.
- Forecast generation: Generating a projected land use map for 2030 based on the derived probabilities and current landscape trends.
- Accuracy assessment using Kappa statistics and the confusion matrix: The final step involves a quantitative evaluation of the model’s accuracy in predicting land use changes. This is achieved through the use of Kappa statistics and the analysis of a confusion matrix. The confusion matrix compares the predicted classifications of land use against the actual observed classifications (or ground truth data) and includes specific values such as True Positives (TPs) = 120, True Negatives (TNs) = 105, False Positives (FPs) = 15, and False Negatives (FNs) = 10. These values detail the number of correct predictions (true positives and true negatives) and incorrect predictions (false positives and false negatives) across different categories, serving as the foundation for calculating various accuracy metrics, including overall accuracy, precision, recall, and the Kappa statistic. The Kappa statistic measures the agreement between the predicted and actual classifications, adjusted for the agreement that might occur by chance alone. A higher Kappa value signifies a higher level of accuracy and agreement beyond what could be expected by random chance, offering a robust measure of the model’s predictive performance.
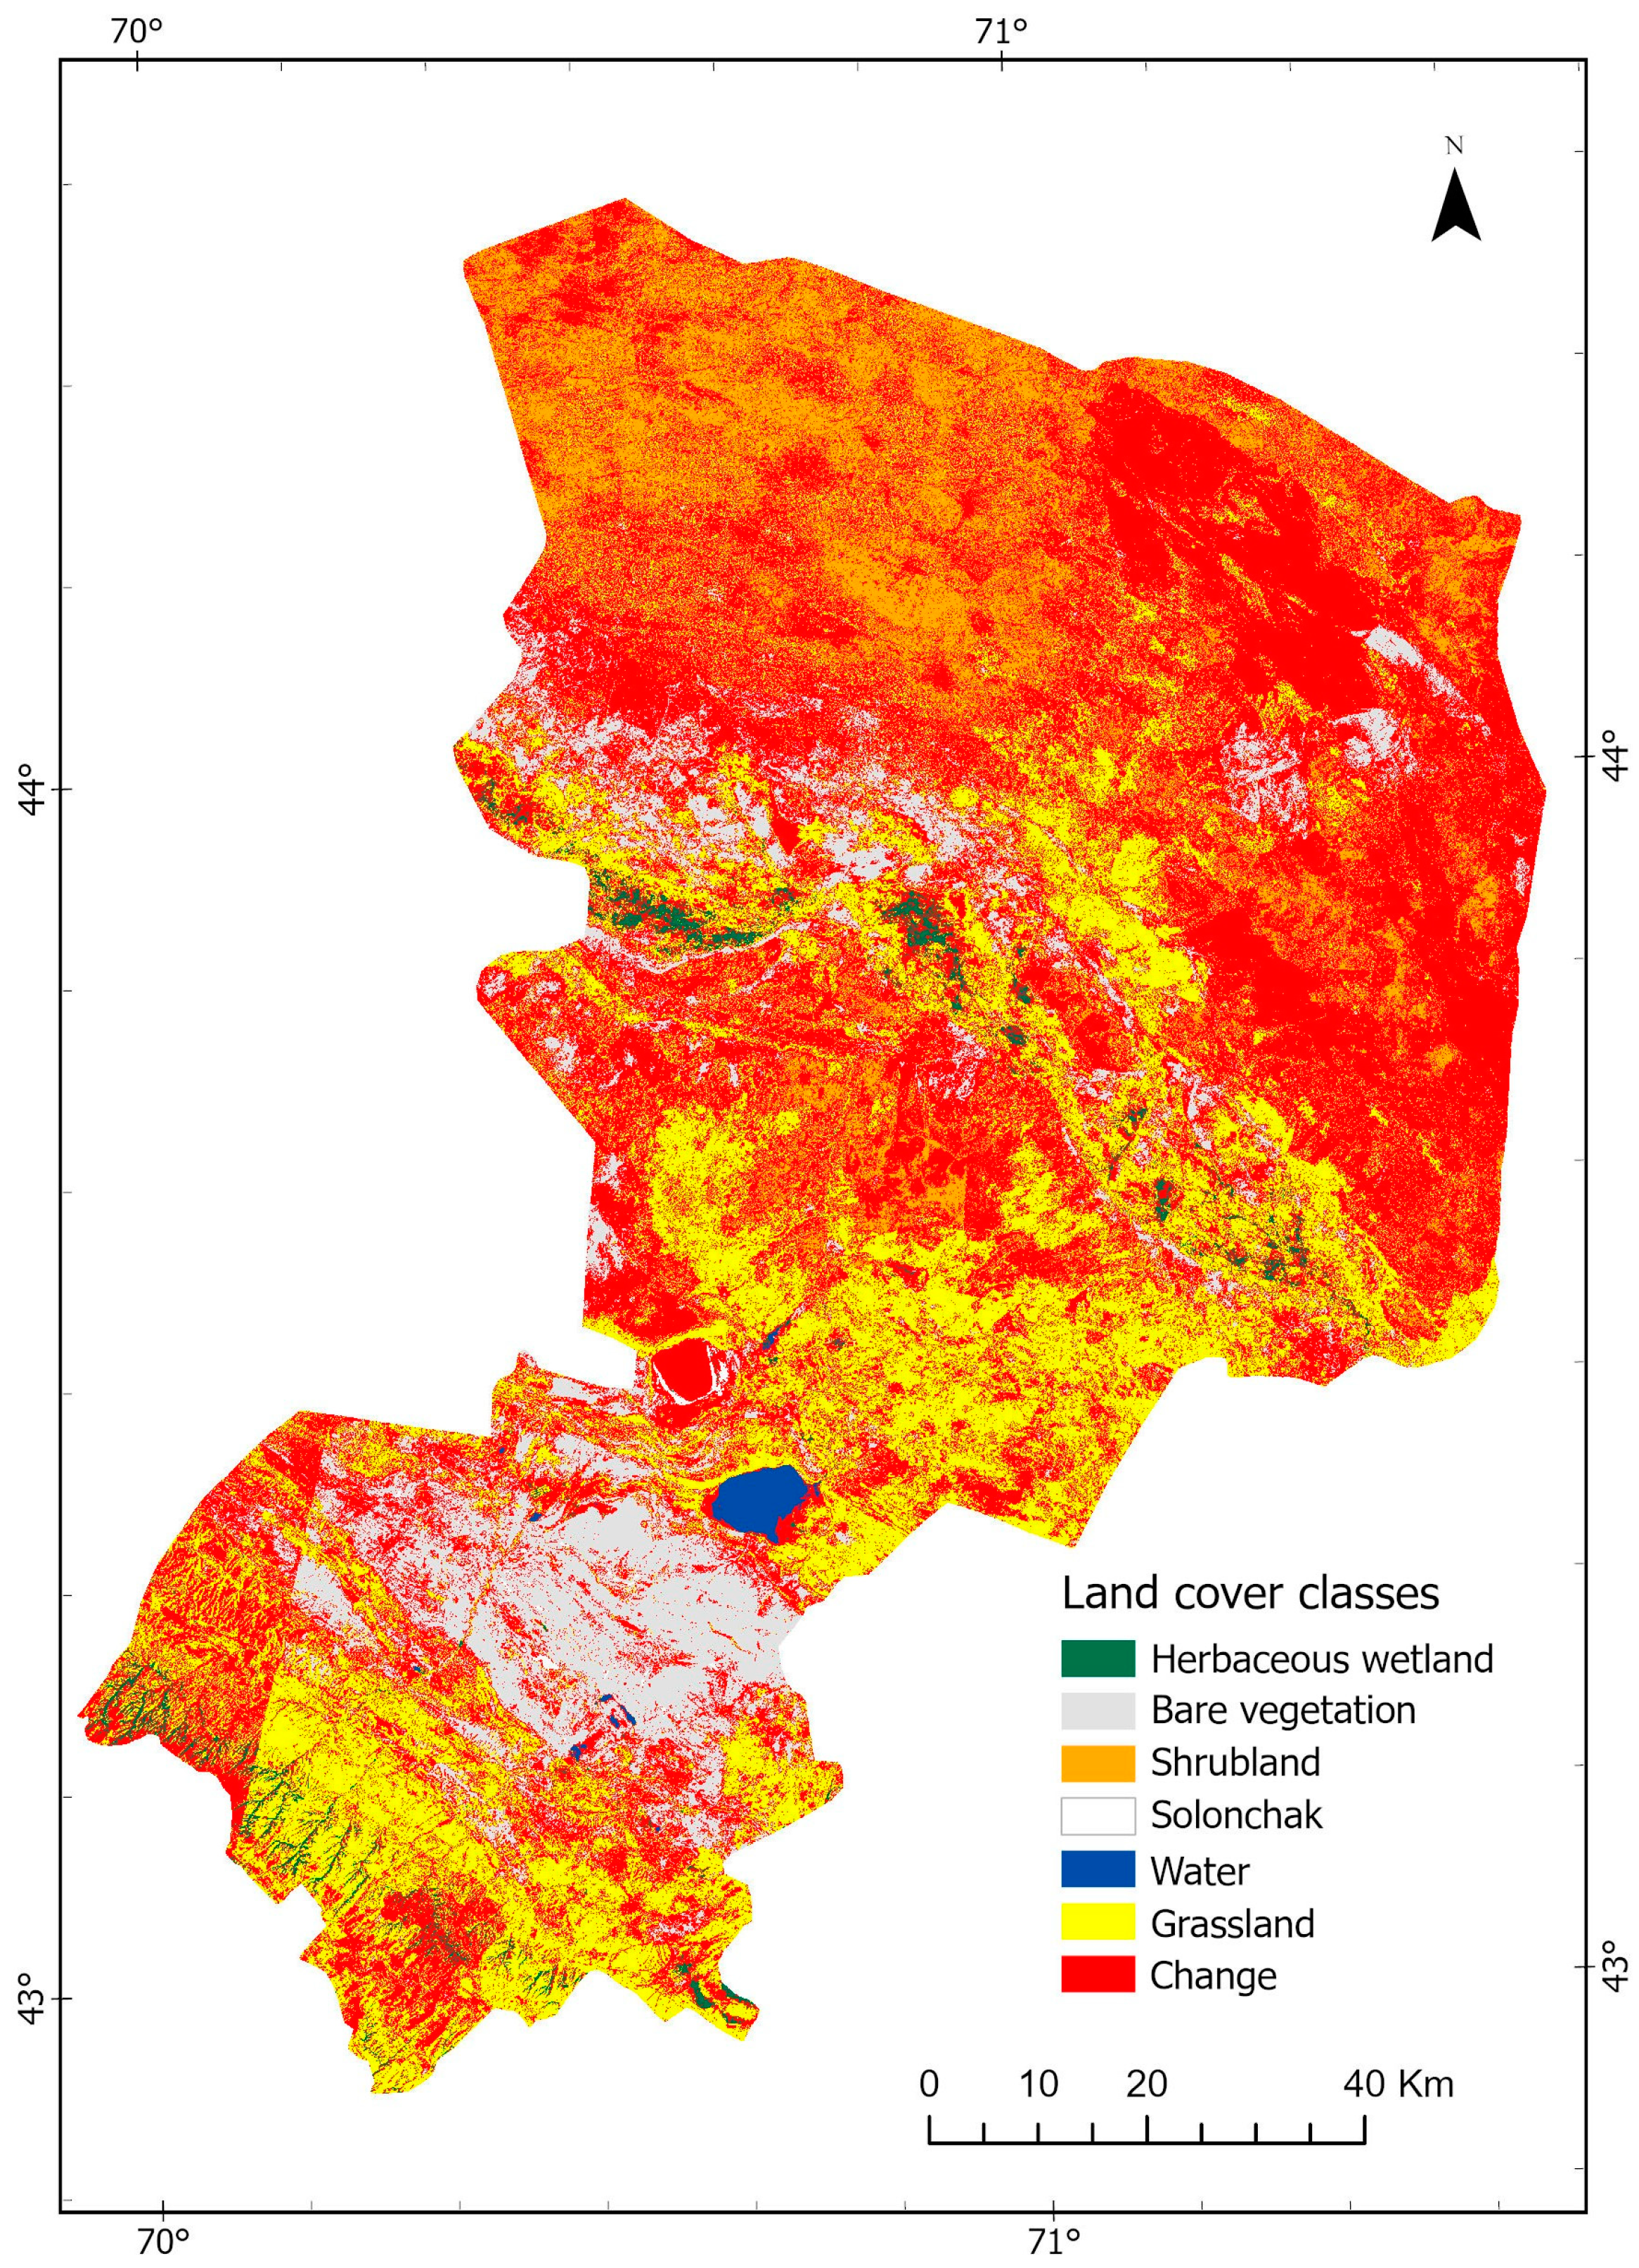
3. Results
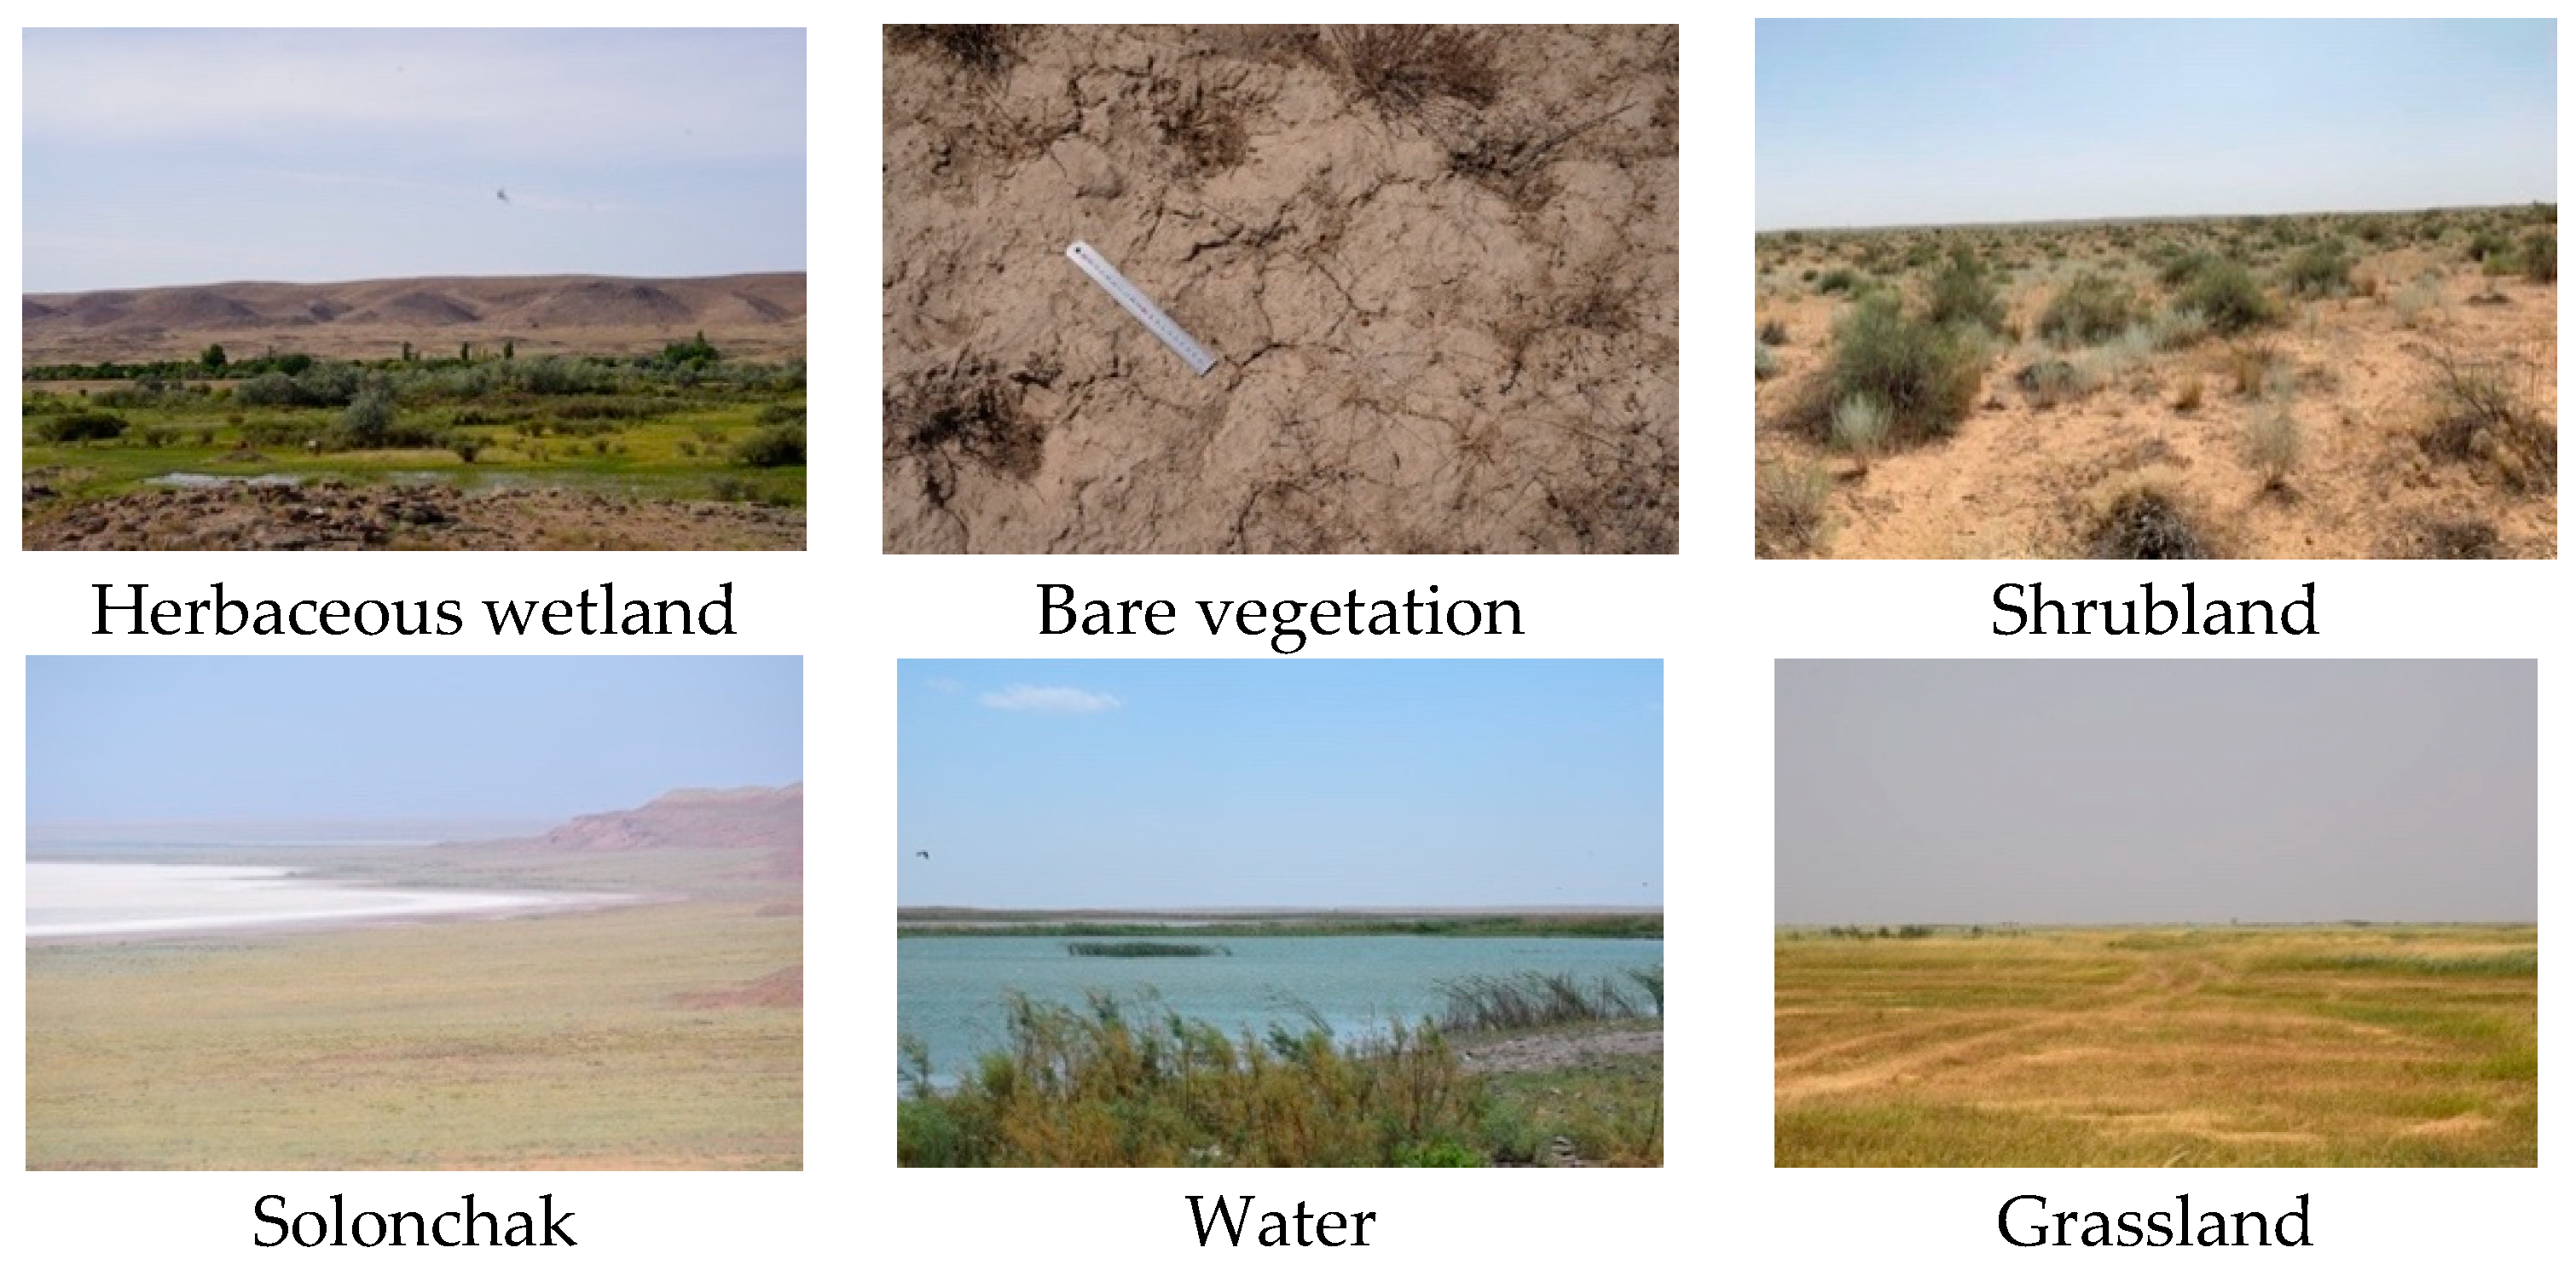
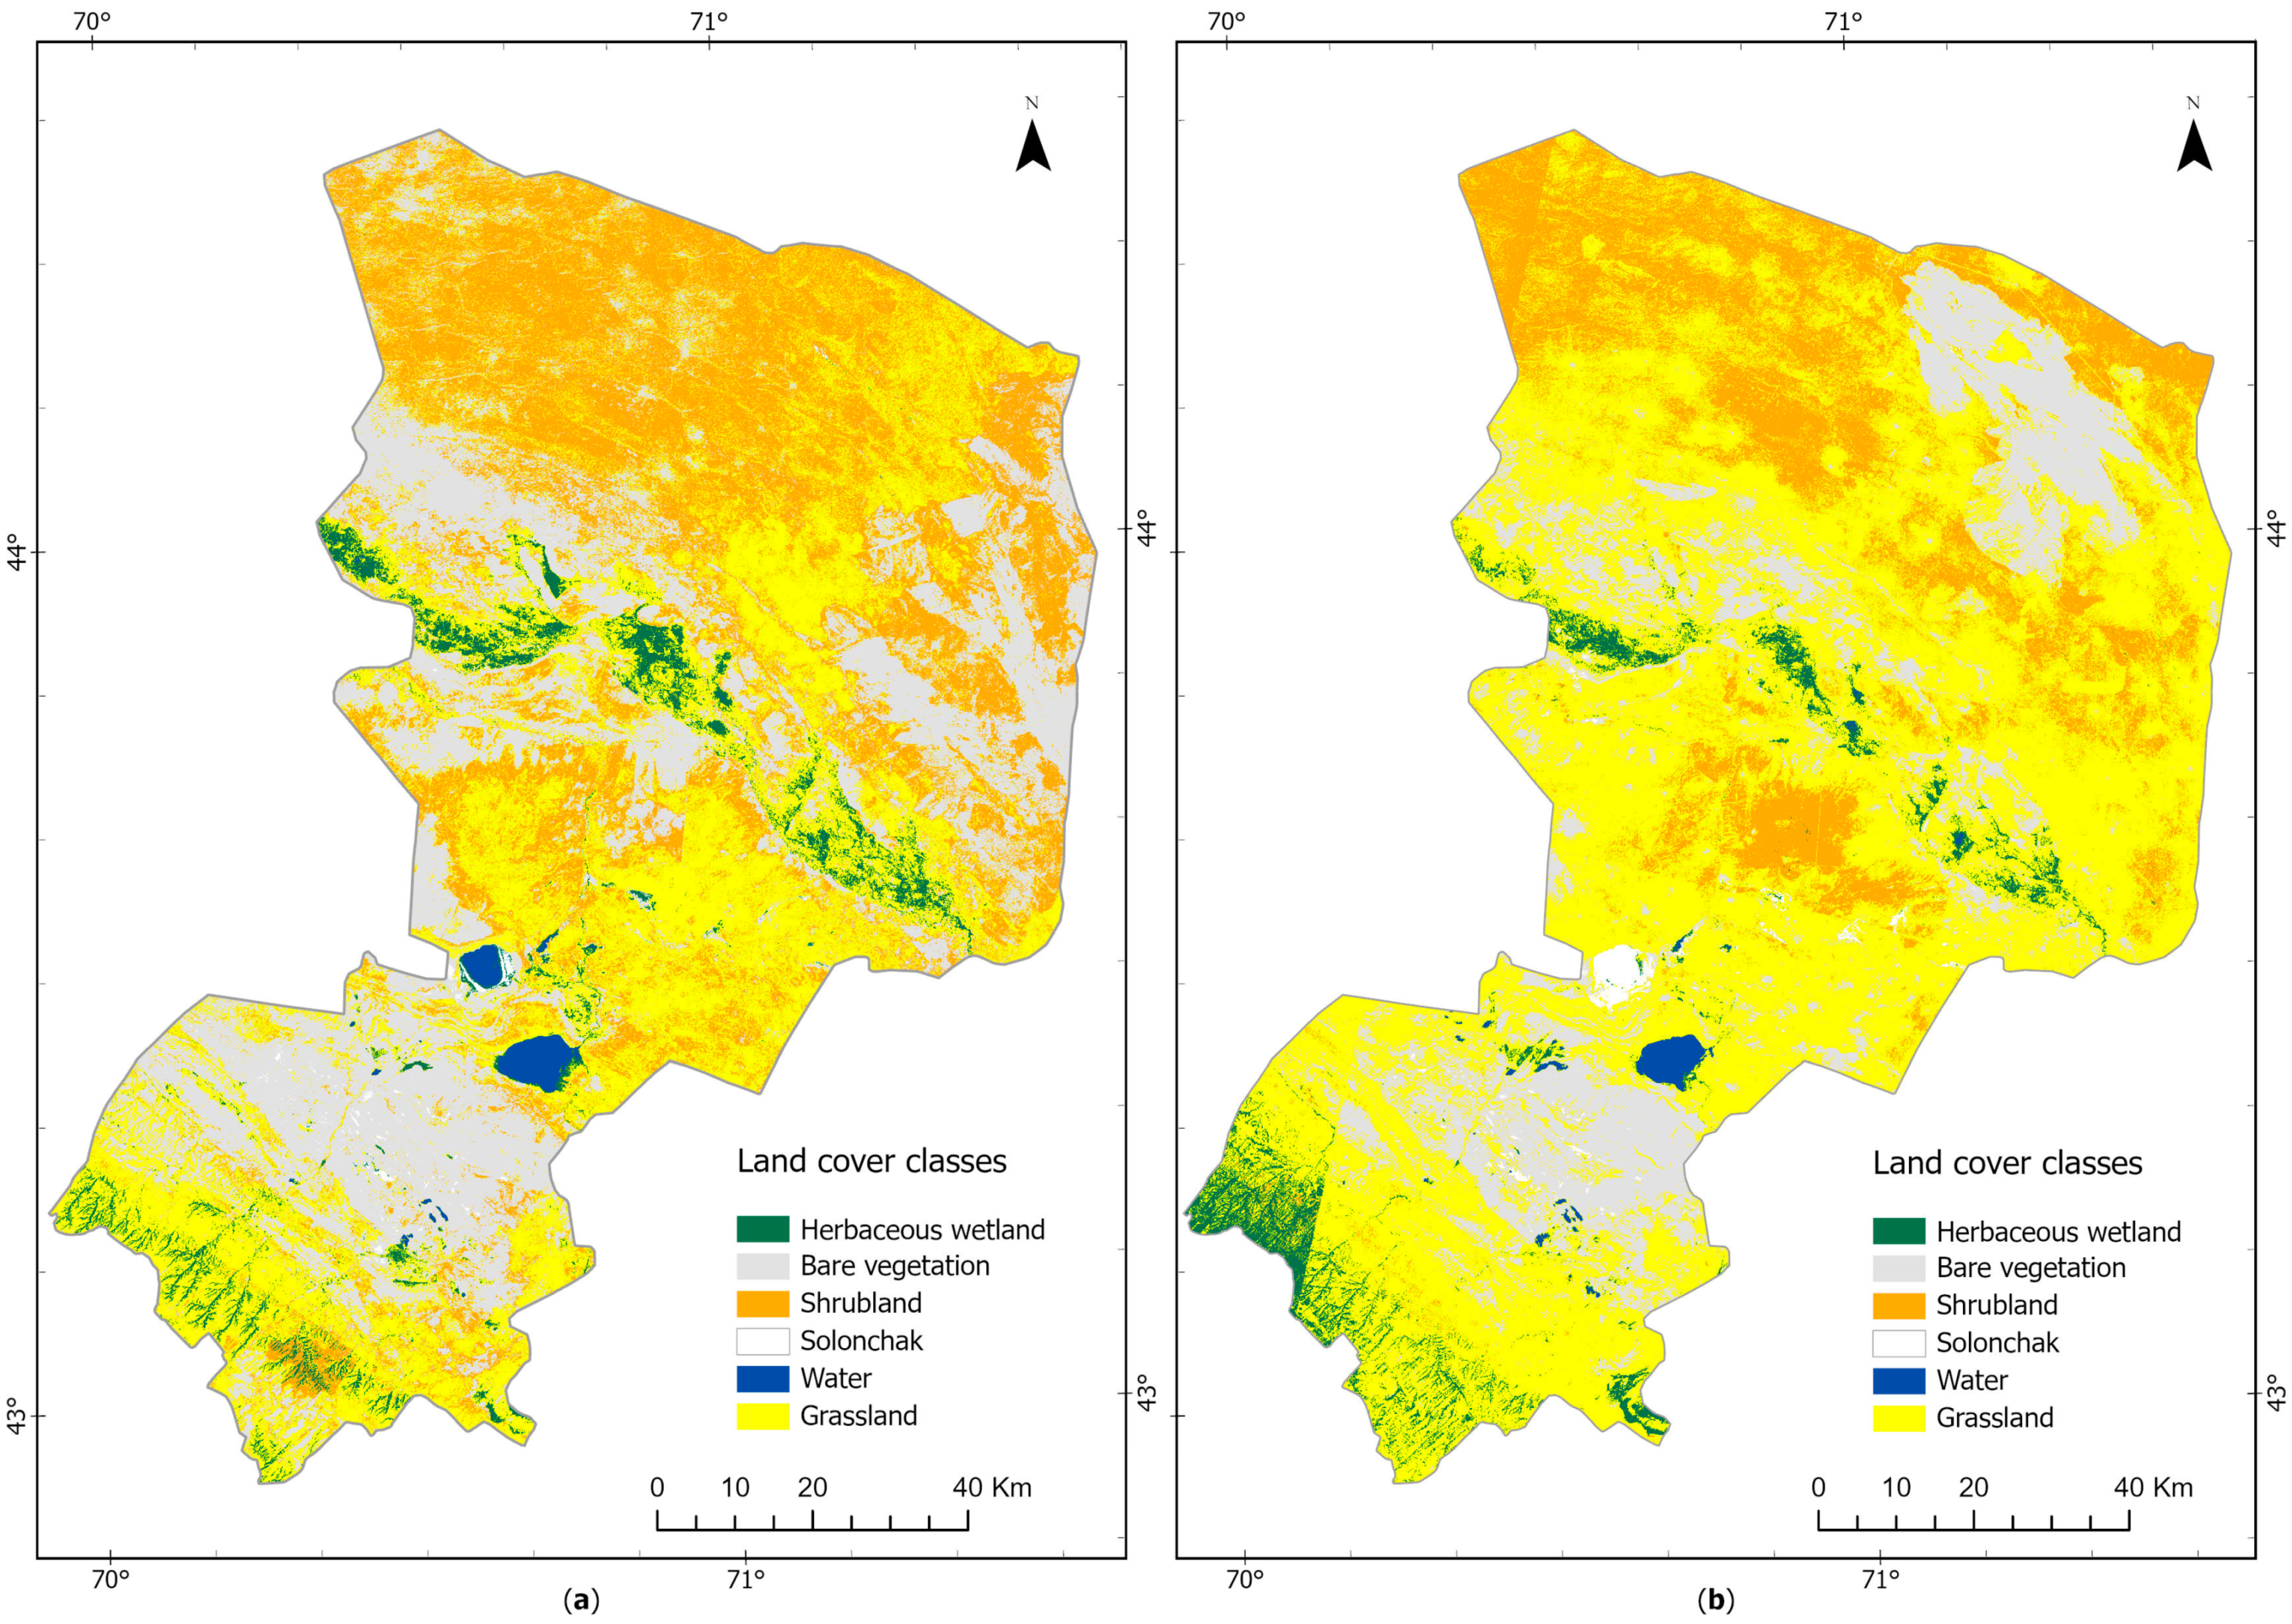
- Herbaceous Wetland: There has been a gradual decrease from 351.08 km2 in 2000 to 340.35 km2 in 2020, with a further slight decline anticipated by 2030 to 334.02 km2. This trend may reflect changes in wetland conservation and water management practices or possibly shifts in climate conditions affecting wetland ecosystems.
- Bare Vegetation: Initially, this class showed a substantial decrease from 3639.99 km2 in 2000 to 2056.23 km2 in 2020. Interestingly, a reversal of this trend is forecasted by 2030, with an increase to 2271.41 km2. This could suggest a recovery of previously bare areas, perhaps due to natural regrowth or effective land rehabilitation efforts.
- Shrubland: There has been a consistent decline in shrubland from 3518.83 km2 in 2000 to 2003.07 km2 in 2020, with the decline projected to continue to 1833.95 km2 by 2030. This ongoing reduction might be caused by land use changes, such as agricultural expansion or urban development, that replace shrubland with other land cover types.
- Solonchak: Contrary to most other classes, solonchak areas have been increasing, from 25.41 km2 in 2000 to 73.83 km2 in 2020, with a forecasted continuation of this trend to 102.523 km2 in 2030. The growth of these saline soils can have negative impacts on soil quality and agricultural productivity, potentially indicating over-irrigation or poor drainage in the region.
- Water: This class has exhibited a concerning decrease from 73.25 km2 in 2000 to 53.71 km2 in 2020, with the forecast predicting a more dramatic reduction to 24.01 km2 by 2030. This significant drop could have serious implications for regional water security, aquatic biodiversity, and could be indicative of the effects of climate change, increased water extraction for human use, or changes in land use that affect water retention.
- Grassland: In contrast to the general trend of decrease in other classes, grassland areas have expanded significantly from 4430.09 km2 in 2000 to 7511.48 km2 in 2020, with a projection of further increase to 8828.77 km2 by 2030. This might reflect changes in land management, such as the abandonment of agricultural lands reverting to grassland, or could be due to conservation efforts promoting grassland restoration.
4. Discussion
5. Conclusions
Author Contributions
Funding
Institutional Review Board Statement
Informed Consent Statement
Data Availability Statement
Acknowledgments
Conflicts of Interest
References
- Kumar, L.; Mutanga, O. Google Earth Engine Applications Since Inception: Usage, Trends, and Potential. Remote Sens. 2018, 10, 1509. [Google Scholar] [CrossRef]
- Xiao, W.; Deng, X.; He, T.; Chen, W. Mapping Annual Land Disturbance and Reclamation in a Surface Coal Mining Region Using Google Earth Engine and the LandTrendr Algorithm: A Case Study of the Shengli Coalfield in Inner Mongolia, China. Remote Sens. 2020, 12, 1612. [Google Scholar] [CrossRef]
- Zhao, Q.; Yu, L.; Li, X.; Peng, D.; Zhang, Y.; Gong, P. Progress and Trends in the Application of Google Earth and Google Earth Engine. Remote Sens. 2021, 13, 3778. [Google Scholar] [CrossRef]
- Tamiminia, H.; Salehi, B.; Mahdianpari, M.; Quackenbush, L.J.; Adeli, S.; Brisco, B. Google Earth Engine for Geo-Big Data Applications: A Meta-Analysis and Systematic Review. ISPRS J. Photogramm. Remote Sens. 2020, 164, 152–170. [Google Scholar] [CrossRef]
- Kadri, N.; Jebari, S.; Augusseau, X.; Mahdhi, N.; Lestrelin, G.; Berndtsson, R. Analysis of Four Decades of Land Use and Land Cover Change in Semiarid Tunisia Using Google Earth Engine. Remote Sens. 2023, 15, 3257. [Google Scholar] [CrossRef]
- Seyam, M.M.H.; Haque, M.R.; Rahman, M. Identifying the Land Use Land Cover (LULC) Changes Using Remote Sensing and GIS Approach: A Case Study at Bhaluka in Mymensingh, Bangladesh. Case Stud. Chem. Environ. Eng. 2023, 7, 100293. [Google Scholar] [CrossRef]
- Baig, M.F.; Mustafa, M.R.U.; Baig, İ.; Takaijudin, H.; Zeshan, M.T. Assessment of Land Use Land Cover Changes and Future Predictions Using CA-ANN Simulation for Selangor, Malaysia. Water 2022, 14, 402. [Google Scholar] [CrossRef]
- Liu, C.; Li, W.; Zhu, G.; Zhou, H.; Yan, H.; Xue, P. Land Use/Land Cover Changes and Their Driving Factors in the Northeastern Tibetan Plateau Based on Geographical Detectors and Google Earth Engine: A Case Study in Gannan Prefecture. Remote Sens. 2020, 12, 3139. [Google Scholar] [CrossRef]
- Nasiri, V.; Deljouei, A.; Moradi, F.; Sadeghi, S.M.M.; Borz, S.A. Land Use and Land Cover Mapping Using Sentinel-2, Landsat-8 Satellite Images, and Google Earth Engine: A Comparison of Two Composition Methods. Remote Sens. 2022, 14, 1977. [Google Scholar] [CrossRef]
- Phan, T.N.; Kuch, V.; Lehnert, L.W. Land Cover Classification Using Google Earth Engine and Random Forest Classifier—The Role of Image Composition. Remote Sens. 2020, 12, 2411. [Google Scholar] [CrossRef]
- Qu, L.; Chen, Z.; Li, M.; Zhi, J.; Wang, H. Accuracy Improvements to Pixel-Based and Object-Based LULC Classification with Auxiliary Datasets from Google Earth Engine. Remote Sens. 2021, 13, 453. [Google Scholar] [CrossRef]
- Seydi, S.T.; Akhoondzadeh, M.; Amani, M.; Mahdavi, S. Wildfire Damage Assessment over Australia Using Sentinel-2 Imagery and MODIS Land Cover Product within the Google Earth Engine Cloud Platform. Remote Sens. 2021, 13, 220. [Google Scholar] [CrossRef]
- Ermida, S.L.; Soares, P.C.; Mantas, V.M.; Göttsche, F.-M.; Trigo, I.F. Google Earth Engine Open-Source Code for Land Surface Temperature Estimation from the Landsat Series. Remote Sens. 2020, 12, 1471. [Google Scholar] [CrossRef]
- De Beurs, K.M.; Henebry, G.M. Land Surface Phenology, Climatic Variation, and Institutional Change: Analyzing Agricultural Land Cover Change in Kazakhstan. Remote Sens. Environ. 2004, 89, 497–509. [Google Scholar] [CrossRef]
- Alipbeki, O.; Alipbekova, C.; Sterenharz, A.; Toleubekova, Z.; Aliyev, M.; Mineyev, N.; Amangaliyev, K. A Spatiotemporal Assessment of Land Use and Land Cover Changes in Peri-Urban Areas: A Case Study of Arshaly District, Kazakhstan. Sustainability 2020, 12, 1556. [Google Scholar] [CrossRef]
- Qi, J.; Shen, T.; Pueppke, S.G.; Espolov, T.E.; Beksultanov, M.; Chen, X.; Cai, X. Changes in Land Use/Land Cover and Net Primary Productivity in the Transboundary Ili-Balkhash Basin of Central Asia, 1995–2015. Environ. Res. Commun. 2019, 2, 011006. [Google Scholar] [CrossRef]
- Alipbeki, O.; Alipbekova, C.; Sterenharz, A.; Toleubekova, Z.; Makenova, S.; Aliyev, M.; Mineyev, N. Analysis of Land-Use Change in Shortandy District in Terms of Sustainable Development. Land 2020, 9, 147. [Google Scholar] [CrossRef]
- Yuan, J.; Chen, J.; Sciusco, P.; Kolluru, V.; Saraf, S.; John, R.; Batkhishig, O. Land Use Hotspots of the Two Largest Landlocked Countries: Kazakhstan and Mongolia. Remote Sens. 2022, 14, 1805. [Google Scholar] [CrossRef]
- Hu, Y.; Yang, H. Land Cover Changes and Their Driving Mechanisms in Central Asia from 2001 to 2017 Supported by Google Earth Engine. Remote Sens. 2019, 11, 554. [Google Scholar] [CrossRef]
- Alipbeki, O.; Mussaif, G.; Alipbekova, C.; Kapassova, A.; Grossul, P.; Aliyev, M.; Mineyev, N. Untangling the Integral Impact of Land Use Change, Economic, Ecological and Social Factors on the Development of Burabay District (Kazakhstan) during the Period 1999–2021. Sustainability 2023, 15, 7548. [Google Scholar] [CrossRef]
- Kou, J.; Wang, J.; Ding, J.; Ge, X. Spatial Simulation and Prediction of Land Use/Land Cover in the Transnational Ili-Balkhash Basin. Remote Sens. 2023, 15, 3059. [Google Scholar] [CrossRef]
- Vilesov, E.N.; Naumenko, A.A.; Veselova, L.K.; Aubekerov, B.Z. Physical Geography of Kazakhstan; Tutorial; Under General Ed.; A.A. Naumenko: Almaty, Kazakhstan, 2019; 362p. [Google Scholar]
- Kazhydromet. Annual Bulletin of Monitoring the State and Climate Change in Kazakhstan. Available online: https://www.kazhydromet.kz/en/klimat/ezhegodnyy-byulleten-monitoringa-sostoyaniya-i-izmeneniya-klimata-kazahstana (accessed on 25 January 2024).
- Dwivedi, R.S.; Rao, B.R.M. The Selection of the Best Possible Landsat TM Band Combination for Delineating Salt-Affected Soils. Int. J. Remote Sens. 1992, 13, 2051–2058. [Google Scholar] [CrossRef]
- Hird, J.N.; DeLancey, E.R.; McDermid, G.J.; Kariyeva, J. Google Earth Engine, Open-Access Satellite Data, and Machine Learning in Support of Large-Area Probabilistic Wetland Mapping. Remote Sens. 2017, 9, 1315. [Google Scholar] [CrossRef]
- Spectral Bandpasses for All Landsat Sensors. Available online: https://www.usgs.gov/media/images/spectral-bandpasses-all-landsat-sensors (accessed on 28 February 2024).
- Zhang, G.; Wu, M.; Wei, J.; He, Y.; Niu, L.; Li, H.; Xu, G. Adaptive Threshold Model in Google Earth Engine: A Case Study of Ulva Prolifera Extraction in the South Yellow Sea, China. Remote Sens. 2021, 13, 3240. [Google Scholar] [CrossRef]
- Herndon, K.E.; Griffin, R.; Schroder, W.; Murtha, T.; Golden, C.; Contreras, D.; Cherrington, E.A.; Wang, L.; Bazarsky, A.; Van Kollias, G.; et al. Google Earth Engine for Archaeologists: An Updated Look at the Progress and Promise of Remotely Sensed Big Data. J. Archaeol. Sci. Rep. 2023, 50, 104094. [Google Scholar] [CrossRef]
- Safanelli, J.L.; Poppiel, R.R.; Ruiz, L.F.C.; Bonfatti, B.R.; De Oliveira Mello, F.A.; Rizzo, R.; Demattê, J.A.M. Terrain Analysis in Google Earth Engine: A Method Adapted for High-Performance Global-Scale Analysis. ISPRS Int. J. Geo-Inf. 2020, 9, 400. [Google Scholar] [CrossRef]
- Deng, Z.; Quan, B. Intensity Analysis to Communicate Detailed Detection of Land Use and Land Cover Change in Chang-Zhu-Tan Metropolitan Region, China. Forests 2023, 14, 939. [Google Scholar] [CrossRef]
- Deng, Z.; Quan, B.; Zhang, H.; Xie, H.; Zhou, Z. Scenario Simulation of Land Use and Cover under Safeguarding Ecological Security: A Case Study of Chang-Zhu-Tan Metropolitan Area, China. Forests 2023, 14, 2131. [Google Scholar] [CrossRef]
- Yao, J.; Chen, Y.; Chen, J.; Zhao, Y.; Tuoliewubieke, D.; Li, J.; Yang, L.; Mao, W. Intensification of Extreme Precipitation in Arid Central Asia. J. Hydrol. 2021, 598, 125760. [Google Scholar] [CrossRef]
- Hu, Z.; Zhou, Q.; Chen, X.; Qian, C.; Wang, S.; Li, J. Variations and Changes of Annual Precipitation in Central Asia over the Last Century. Int. J. Climatol. 2017, 37, 157–170. [Google Scholar] [CrossRef]
- Zhang, G.; Biradar, C.M.; Xiao, X.; Dong, J.; Zhou, Y.; Qin, Y.; Zhang, Y.; Liu, F.; Ding, M.; Thomas, R.J. Exacerbated Grassland Degradation and Desertification in Central Asia during 2000–2014. Ecol. Appl. 2018, 28, 442–456. [Google Scholar] [CrossRef] [PubMed]
- Henebry, G.M.; de Beurs, K.M.; John, R.; Owsley, B.C.; Kariyeva, J.; Chymyrov, A.; Mirzoev, M. Recent Land Surface Dynamics across Drylands in Greater Central Asia; Landscape Series; Springer International Publishing: Cham, Switzerland, 2020; pp. 25–47. ISBN 9783030307417. [Google Scholar]
- Taukebayev, O.Z.; Zulpykharov, K.B.; Assylbekova, A.A.; Duisenbayev, S.M.; Seitkazy, M. Technical Condition of Irrigation Systems and Its Impact on the Dynamics of Irrigated Lands (Talas District, Zhambyl Region). J. Geogr. Environ. Manag. 2022, 65, 17. [Google Scholar] [CrossRef]


| Image ID | Sensor | Acquisition Date | Path | Row | Bands | Cloud Cover (%) | UTM Zone |
|---|---|---|---|---|---|---|---|
| LANDSAT/LE07/C01/T1_TOA/LE07_153029_20000721 | Landsat 7 | 21 July 2000 | 153 | 29 | 10 | 0 | 42 |
| LANDSAT/LE07/C01/T1_TOA/LE07_154030_20000728 | Landsat 7 | 28 July 2000 | 154 | 30 | 10 | 3 | 42 |
| LANDSAT/LE07/C01/T1_TOA/LE07_153030_20000721 | Landsat 7 | 21 July 2000 | 153 | 30 | 10 | 0 | 42 |
| LANDSAT/LE07/C01/T1_TOA/LE07_154029_20000728 | Landsat 7 | 28 July 2000 | 154 | 29 | 10 | 3 | 42 |
| LANDSAT/LC08/C01/T1_TOA/LC08_153029_20200618 | Landsat 8 | 18 June 2020 | 153 | 29 | 12 | 0.009 | 42 |
| LANDSAT/LC08/C01/T1_TOA/LC08_154029_20200524 | Landsat 8 | 24 May 2020 | 154 | 29 | 12 | 0.009 | 42 |
| LANDSAT/LC08/C01/T1_TOA/LC08_153030_20200618 | Landsat 8 | 18 June 2020 | 153 | 30 | 12 | 0.72 | 42 |
| LANDSAT/LC08/C01/T1_TOA/LC08_154030_20200524 | Landsat 8 | 24 May 2020 | 154 | 30 | 12 | 0.11 | 42 |
| Class | Area 2000 (km2) | Area 2020 (km2) | Area 2030 (km2) |
|---|---|---|---|
| Herbaceous Wetland | 351.08 | 340.35 | 334.02 |
| Bare Vegetation | 3639.99 | 2056.23 | 2271.41 |
| Shrubland | 3518.83 | 2003.07 | 1833.95 |
| Solonchak | 25.41 | 73.83 | 102.52 |
| Water | 73.25 | 53.71 | 24.012 |
| Grassland | 4430.09 | 7511.48 | 8828.77 |
Disclaimer/Publisher’s Note: The statements, opinions and data contained in all publications are solely those of the individual author(s) and contributor(s) and not of MDPI and/or the editor(s). MDPI and/or the editor(s) disclaim responsibility for any injury to people or property resulting from any ideas, methods, instructions or products referred to in the content. |
© 2024 by the authors. Licensee MDPI, Basel, Switzerland. This article is an open access article distributed under the terms and conditions of the Creative Commons Attribution (CC BY) license (https://creativecommons.org/licenses/by/4.0/).
Share and Cite
Seitkazy, M.; Beisekenov, N.; Taukebayev, O.; Zulpykhanov, K.; Tokbergenova, A.; Duisenbayev, S.; Sarybaev, E.; Turymtayev, Z. Forecasting Land Use Dynamics in Talas District, Kazakhstan, Using Landsat Data and the Google Earth Engine (GEE) Platform. Sustainability 2024, 16, 6144. https://doi.org/10.3390/su16146144
Seitkazy M, Beisekenov N, Taukebayev O, Zulpykhanov K, Tokbergenova A, Duisenbayev S, Sarybaev E, Turymtayev Z. Forecasting Land Use Dynamics in Talas District, Kazakhstan, Using Landsat Data and the Google Earth Engine (GEE) Platform. Sustainability. 2024; 16(14):6144. https://doi.org/10.3390/su16146144
Chicago/Turabian StyleSeitkazy, Moldir, Nail Beisekenov, Omirzhan Taukebayev, Kanat Zulpykhanov, Aigul Tokbergenova, Salavat Duisenbayev, Edil Sarybaev, and Zhanarys Turymtayev. 2024. "Forecasting Land Use Dynamics in Talas District, Kazakhstan, Using Landsat Data and the Google Earth Engine (GEE) Platform" Sustainability 16, no. 14: 6144. https://doi.org/10.3390/su16146144