Article

Optimization Strategies for the Envelope of Student Dormitories in Hot Summer and Cold Winter Regions: Multi-Criteria Assessment Method

College of Water Resources and Civil Engineering, Hunan Agricultural University, Changsha 410128, China
*
Author to whom correspondence should be addressed.
Sustainability 2024, 16(14), 6172; https://doi.org/10.3390/su16146172
Submission received: 21 May 2024 / Revised: 17 July 2024 / Accepted: 17 July 2024 / Published: 19 July 2024
(This article belongs to the Topic Sustainable Built Environment, 2nd Volume)

Abstract

:
Energy consumption in student dormitories, key living and study spaces, is a major concern for institutions and communities. This paper proposes a multi-objective optimization model to address the issue of incomplete single-dimensional analysis in existing research. Firstly, optimization was conducted separately for the external walls, windows, and roof to study different parts of the building envelope. Secondly, a student dormitory in a hot summer and cold winter region was used for a comprehensive optimization analysis. The study compared energy consumption, carbon emissions, and costs with the original building, showing a 31.79% reduction in energy savings (ESR), while carbon emission savings (CESR) and cost savings (CSR) increased by 57.18% and 15.58%. This study highlights the importance of selecting appropriate window configurations for sustainability. Optimized thermally broken Low-E glass windows save 5.6% in annual energy consumption compared to aluminum alloy double-glazed windows, with only a 0.03% increase in energy consumption and a 4.49% rise in costs. Long-term, optimized windows provide greater positive feedback for energy efficiency. This case study offers insights for retrofitting buildings with good wall performance but poor window performance and emphasizes the comprehensive decision-making authority of designers and policymakers in sustainable renovations.

1. Introduction

The construction industry, as one of the three major sources of carbon emissions, has undeniable potential for energy conservation [1]. With the rapid socioeconomic development and global changes in China, the focus of the country has shifted from infrastructure to renovation and maintenance [2]. In the phenomenon of global energy conservation and emission reduction, building energy efficiency requirements have become more stringent [3]. It is a challenge how to implant the idea of sustainability and energy efficiency into the renovation and maintenance of buildings for designers, government departments, and stakeholders. Over the past decade, campus education has flourished in China, with undergraduate numbers tripling from 12 million in 2003 to 34 million in 2013, reflecting a growing emphasis on education [4]. This growth has led to increased demand for university buildings, particularly dormitories, which universities are responsible for providing [5,6]. While most research focuses on the energy efficiency of academic buildings, dormitories need more attention. Adopting the Chinese carbon neutrality goal [7], it is crucial to analyze the energy of dormitories, and the building envelope, as a key barrier to heat exchange, should be prioritized in the design phase.
Based on the previous research of many scholars, it is evident that selecting appropriate energy-saving measures to improve the thermal performance of building envelope structures plays an essential role in reducing building energy consumption. The life cycle assessment (LCA) method is widely used to assess key environmental parameters for the energy demand during both the construction phase and operational phase of buildings [8,9]. The LCA approach has also been applied to improving the properties of building envelope structures [10]. Some experts have undertaken studies focused on energy-saving optimization of external window details, such as the window-to-wall ratio [11,12,13], window orientation [14,15,16], and window glass [17,18,19], and some scholars have started from the building structure [19]. Some studies have explored the external wall and roof, such as the external wall structure [20] and roof structure [21]. In addition, various research has been conducted on insulation materials, including the type of insulation material [22], the performance of insulation material [23], and the thickness of insulation material [24,25]. Some studies have also focused on photovoltaics [25,26].
Reducing building energy consumption as a single evaluation metric can be limited in practical building production and life. Therefore, many scholars combine it with building thermal comfort to explore jointly [27]. Margarita-Niki Assimakopoulos et al. used volumetric add-ons in building renovation to increase dormitory living space by 20%, improve thermal and visual comfort, and achieve zero energy consumption while reducing energy use and pollution emissions by 90% [28]. Yujing Deng et al. proposed effective energy-saving measures for dormitory designs in hot summer and cold winter regions from a management perspective [6]. Yifang Xu et al. developed a model framework to evaluate trade-offs among health, energy, and thermal comfort using school building data. The results indicated a 43% lower infection risk and a 61% improvement in thermal comfort but a 70% higher in energy consumption [27]. Fang’ai Chi et al. centered on thermal comfort in dormitories with three balcony types, focusing on seven building envelope variables. The study found that a multi-objective genetic algorithm significantly impacted the performance of nine types of study rooms [5]. Afshin Razmi et al. innovatively proposed the “PCA-ANN-integrated NSGA-III” framework for dormitory research, achieving improvements of 41.27% in building energy efficiency, 42.24% in daylight performance, and 15.57% in thermal comfort performance with the optimal building design [29]. Some scholars also discussed the energy-saving strategy of building renovation from the perspective of an adaptive strategy [30,31,32]. For example, Giulia Lamberti et al. explored the renovation strategies of historical buildings in response to future weather changes [33]. The research presented above examined the relationship between building thermal comfort and energy consumption regulation. However, in practical production and living, cost control is the most significant barrier to construction optimization.
Cost is critical in determining the existence of a building and the overall user experience. For example, increasing the thickness of insulating materials consistently reduces building energy usage. However, due to economic and structural considerations, continuous increases in material thickness may not be feasible. Therefore, many studies use economics as a secondary evaluation criterion, aiming to explore the trade-off between economy and energy consumption [34]. Jin Zhan et al. developed a two-stage model that integrated the NSGA-II, NSGA-III, and C-TAEA multi-objective optimization algorithms to evaluate thermal comfort, carbon emissions, and costs in designing a senior apartment building in North China, addressing complex building optimization challenges [35]. Shady Jami et al.’s main contribution was proposing a decision-making tool to prioritize energy conservation measures (ECMs) based on investment return and thermal comfort improvement. The model shows that HVAC and lighting systems are the most effective ECMs [36]. Nazanin Moazzen et al. surveyed reference buildings and then suggested that the share of energy and carbon can exceed 80% at the nZEB level, whereas, at the cost-optimal level, it is less than 15% [37]. Many studies have been conducted on the energy consumption and thermal comfort of building envelope structures. The optimization evaluation of structures is enhanced by the inclusion of cost as an evaluation metric. In the meanwhile, some scholars have also included carbon emissions as an evaluation metric in the optimization of building envelope structures with the concept of carbon emissions entering the research.
Energy consumption and carbon emissions of buildings are two crucial and tangentially connected metrics for assessing environmental protection in buildings. Similar to many real-world designs, energy design is susceptible to uncertainties. Therefore, scholars from different countries often combine energy consumption, carbon emissions, and costs to optimize designs for different types of buildings [38,39]. Xing Su et al. introduced a dynamic life cycle assessment (LCA) model that predicted a 23.4% reduction in life cycle carbon emissions compared to traditional static parameter input LCA assessments. The optimal insulation layer thicknesses were identified as 130 mm, 120 mm, and 250 mm, respectively [40]. Touraj Ashrafian et al. suggested that, in hot climates, both cost-optimal and near-zero energy scenarios could nearly double future primary energy consumption, costs, and carbon dioxide emissions. On the other hand, primary energy consumption and CO2 emissions decrease in colder regions, but overall costs increase [41]. Džana Kadrić et al. integrated energy consumption, CO2 emissions, and cost in a multi-objective analysis to indicate that upgrading the external walls and heating system efficiency were the most effective measures [42]. Federica Rosso et al. demonstrated the application of NSGA-II in multi-objective optimization for a residential building in Rome, Italy. The optimal strategy reduced the annual energy demand by 49.2%, lowered the annual energy costs by 48.8%, and decreased CO2 emissions by 45.2%. Compared to other standard optimal solutions, it also achieved nearly 60% lower investment costs [43]. Cong Wang et al. minimized the life cycle costs and net consumption deficit and analyzed how changes in the economic, environmental, and technical parameters influenced the optimal solution composition through parameter analysis [44]. Previous research in China has primarily focused on residential and office buildings, with limited studies on student dormitories [45]. However, with increasing emphasis on student welfare and the urgent need for renovating old dormitory buildings, research on student dormitories has become imperative and necessary.
Considering the practical feasibility of building renovation operations, this study employs a multi-objective optimization model that includes full life cycle energy consumption, carbon emissions, and costs. Using existing student buildings as a case study, the study focuses on optimizing building envelope structures and implementing energy-saving measures tailored for regions with hot summers and cold winters. The methods used in this study will aid in a comprehensive assessment of refurbishing or constructing student dormitories, offering insights into architectural design. It is important to note that many existing retrofitted buildings have good wall performance but poor window performance, a topic with limited research. This study addresses this gap, providing case references for such retrofits, highlighting sustainability, and promoting green renovations.

2. Materials and Methods

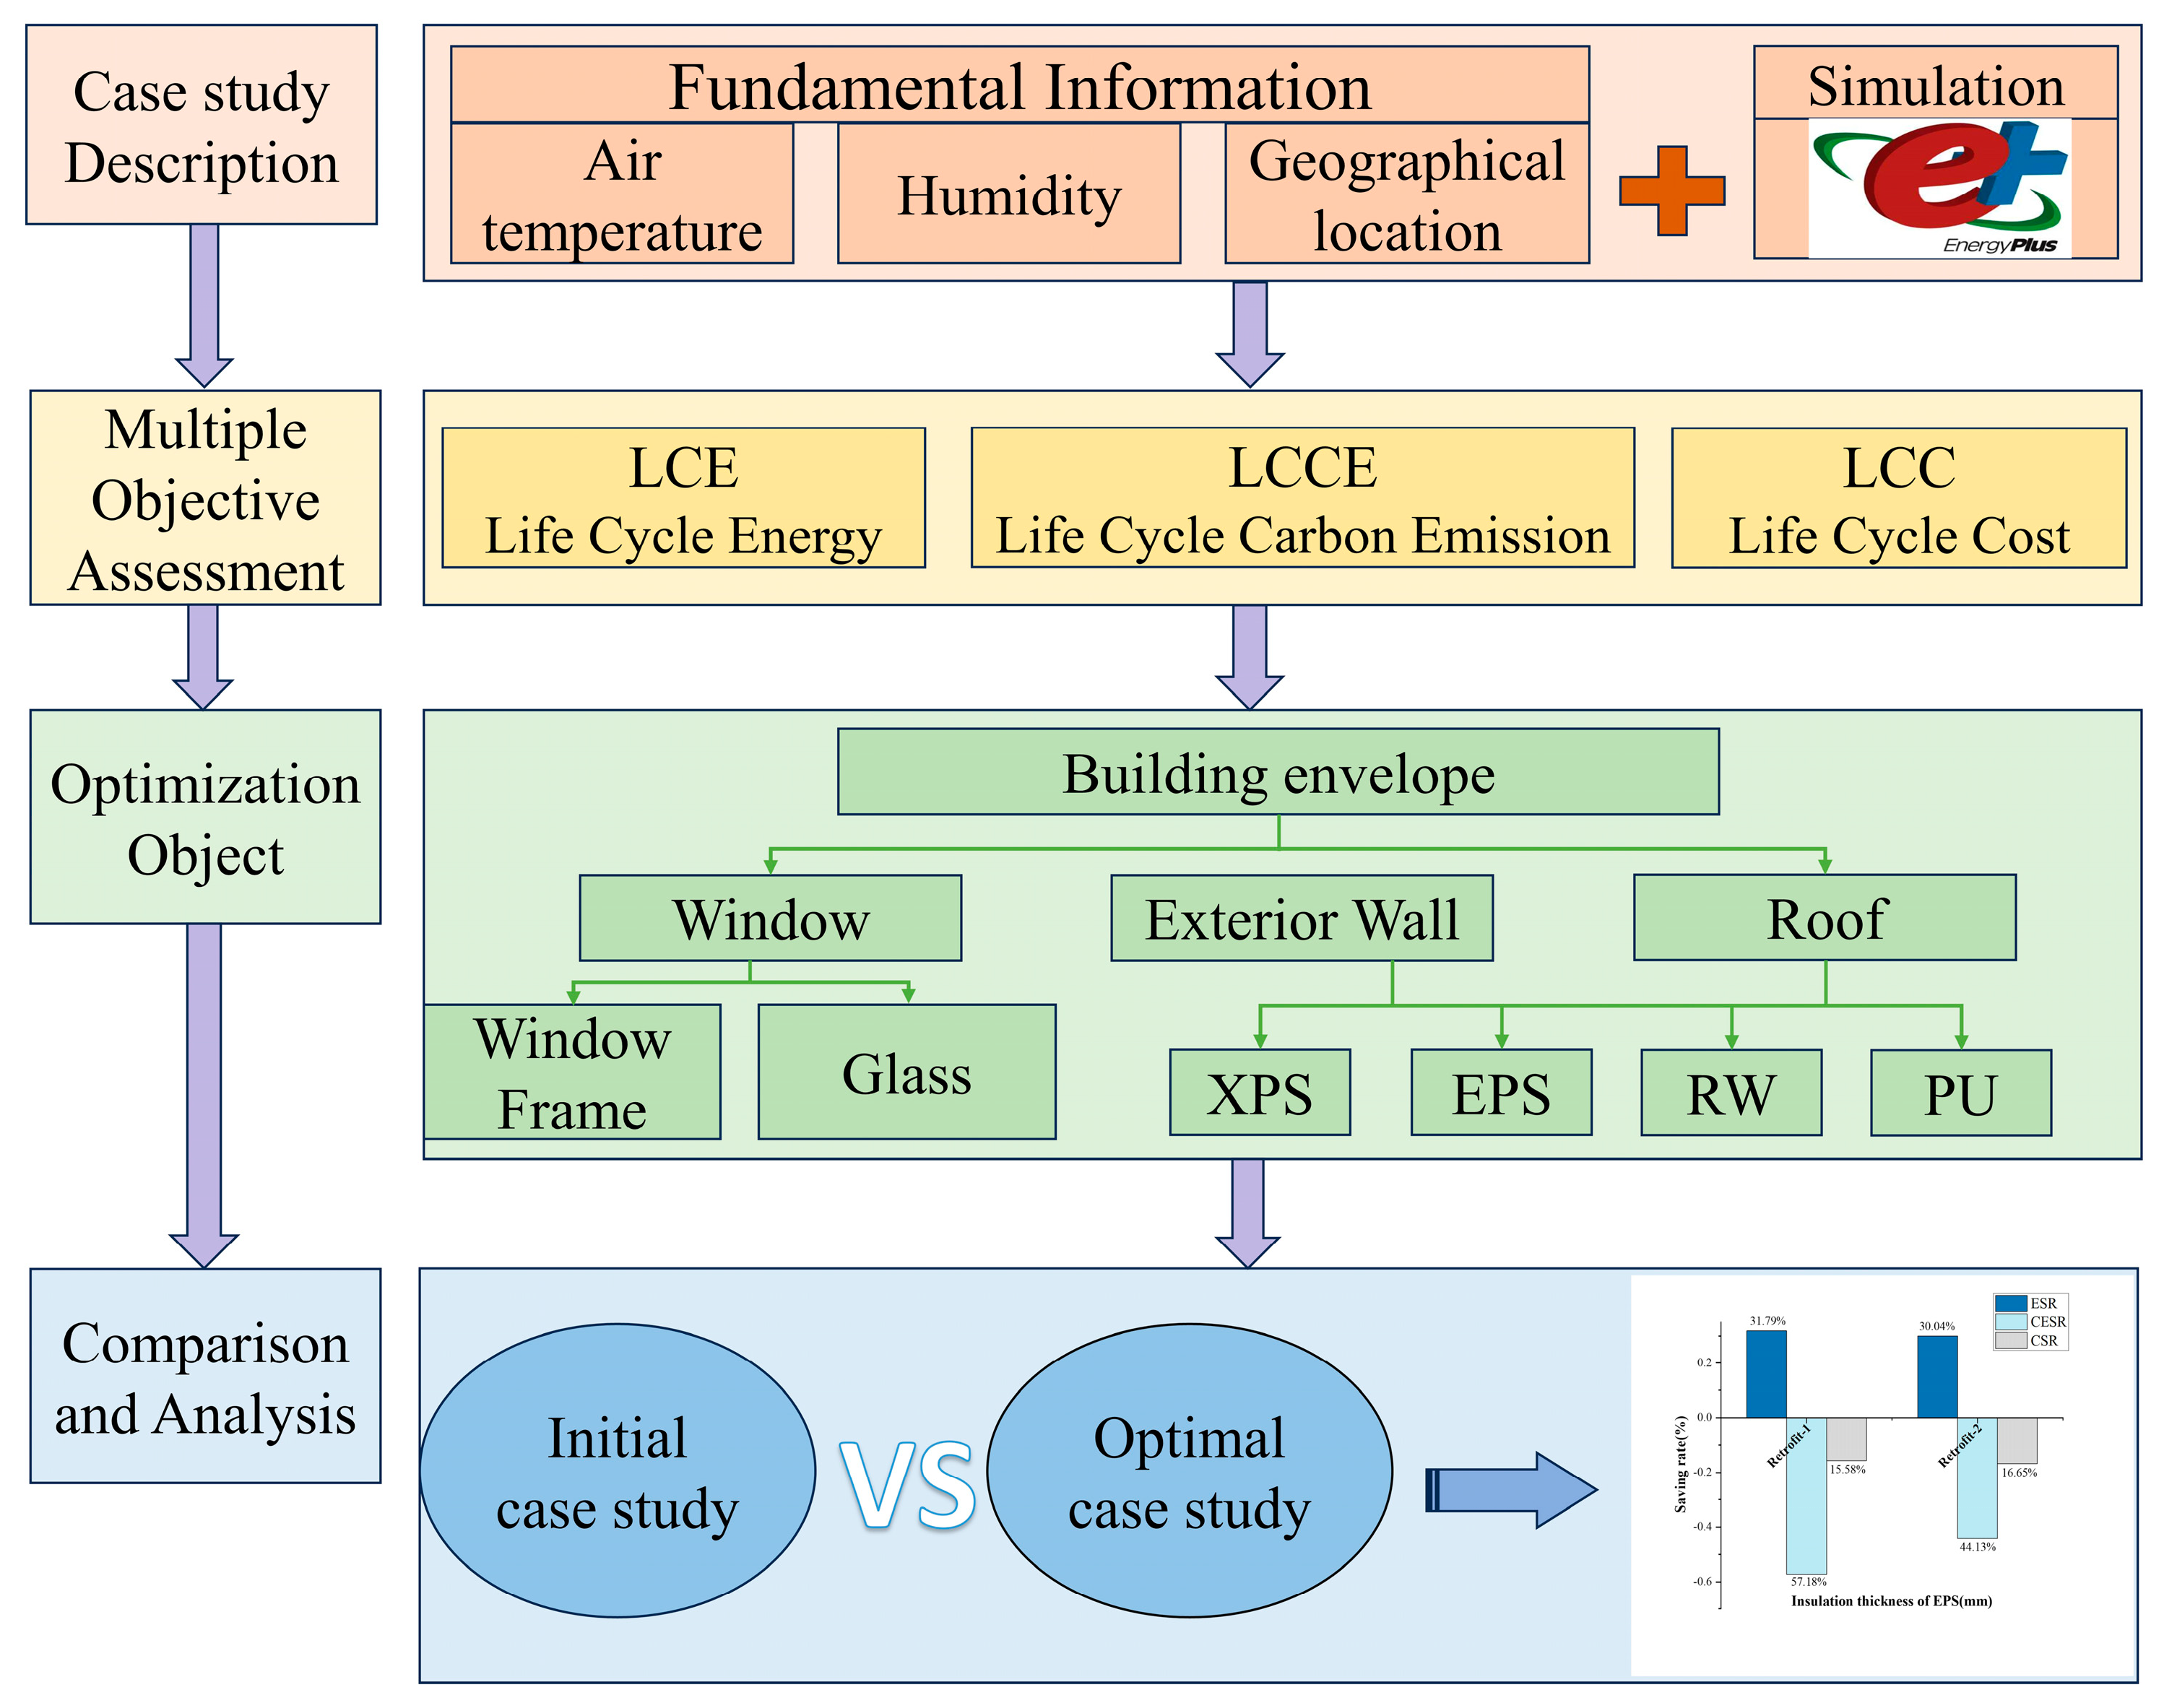
2.1. Research Flowchart

This study analyzes energy-saving strategies for student dormitory buildings of hot summer and cold winter regions in China. The research evaluates the impact of optimizing the building envelope by using a multi-criteria assessment method that incorporates life cycle energy (LCE), life cycle carbon emissions (LCCE), and life cycle costs (LCC). The model is applied to external walls, roofs, and windows to identify the optimal materials and thicknesses. The study compares the energy performance of retrofitted and original buildings, providing a reference for dormitory renovations in similar climates. All calculation processes are supported by formulas and national standards to ensure the accuracy of the simulation and the reliability of the results. The research flowchart is depicted in Figure 1.

2.2. Case Study

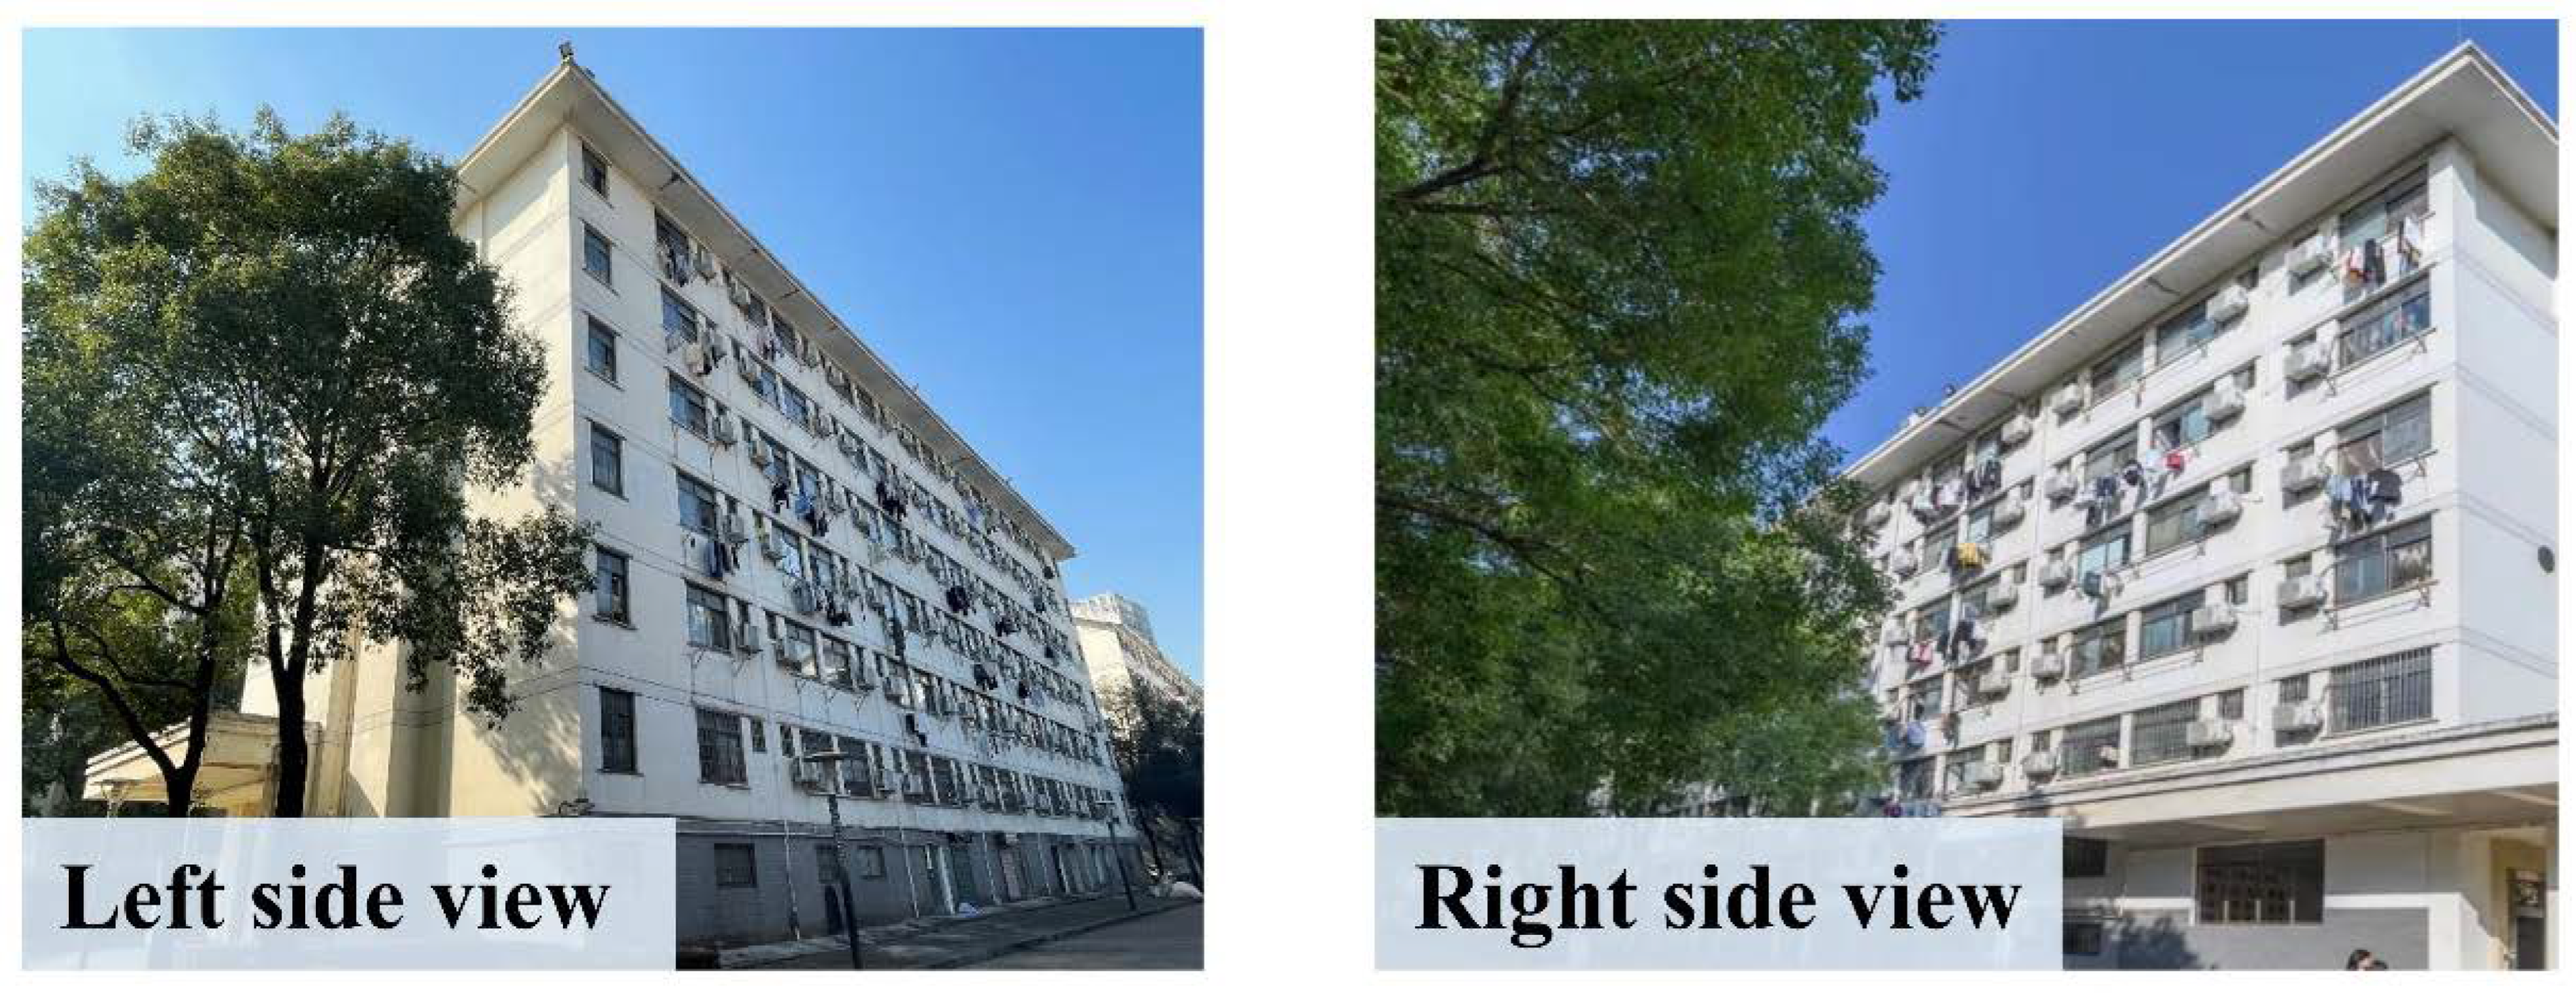
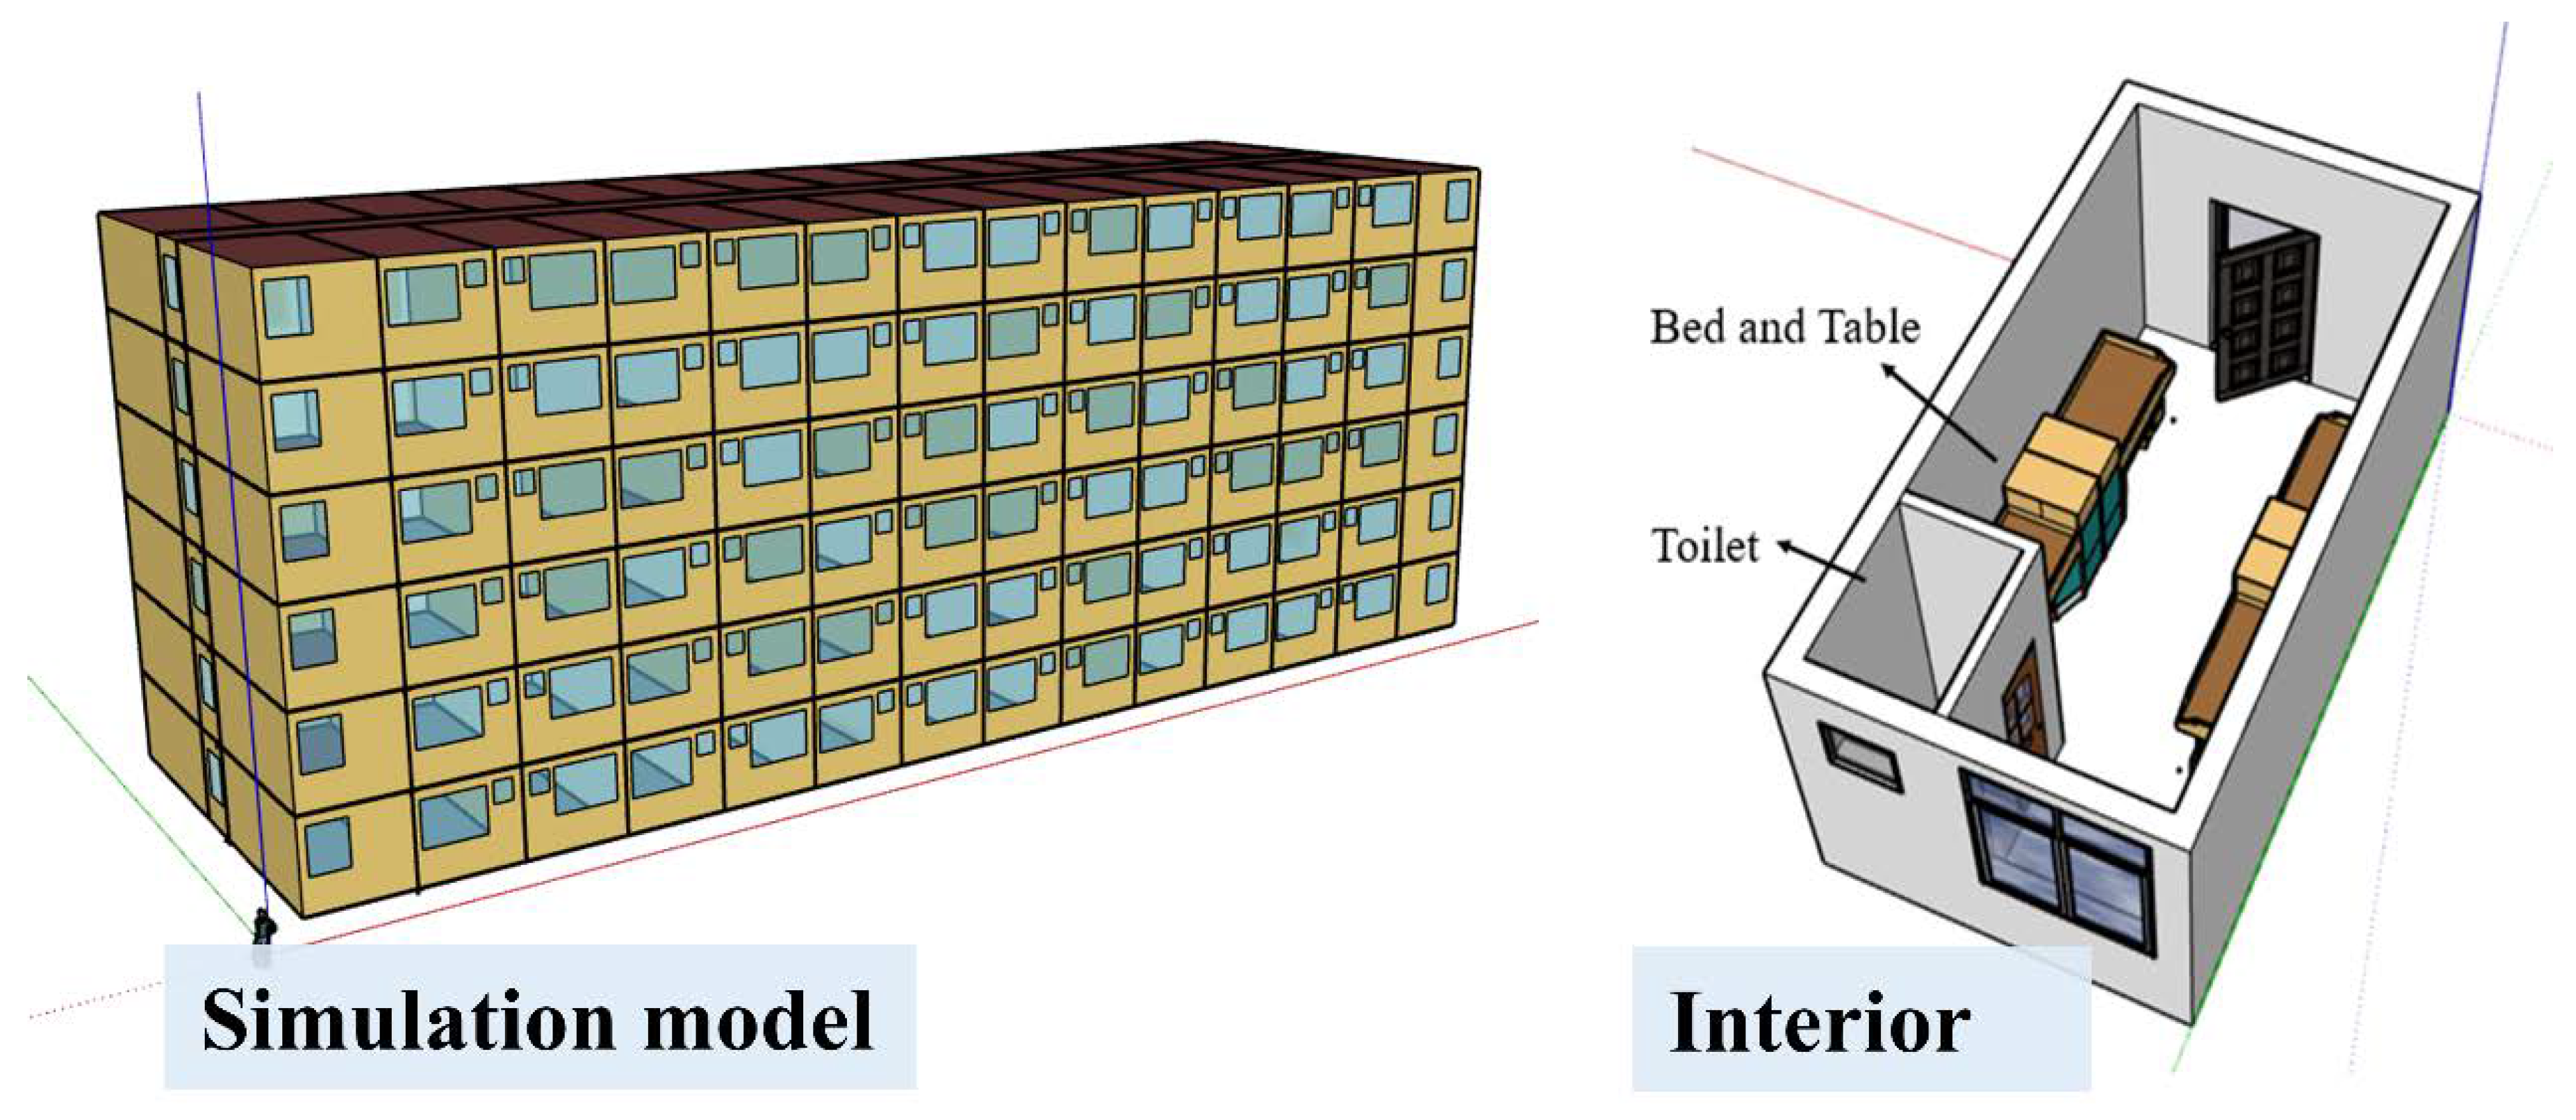
2.2.1. Building Overview
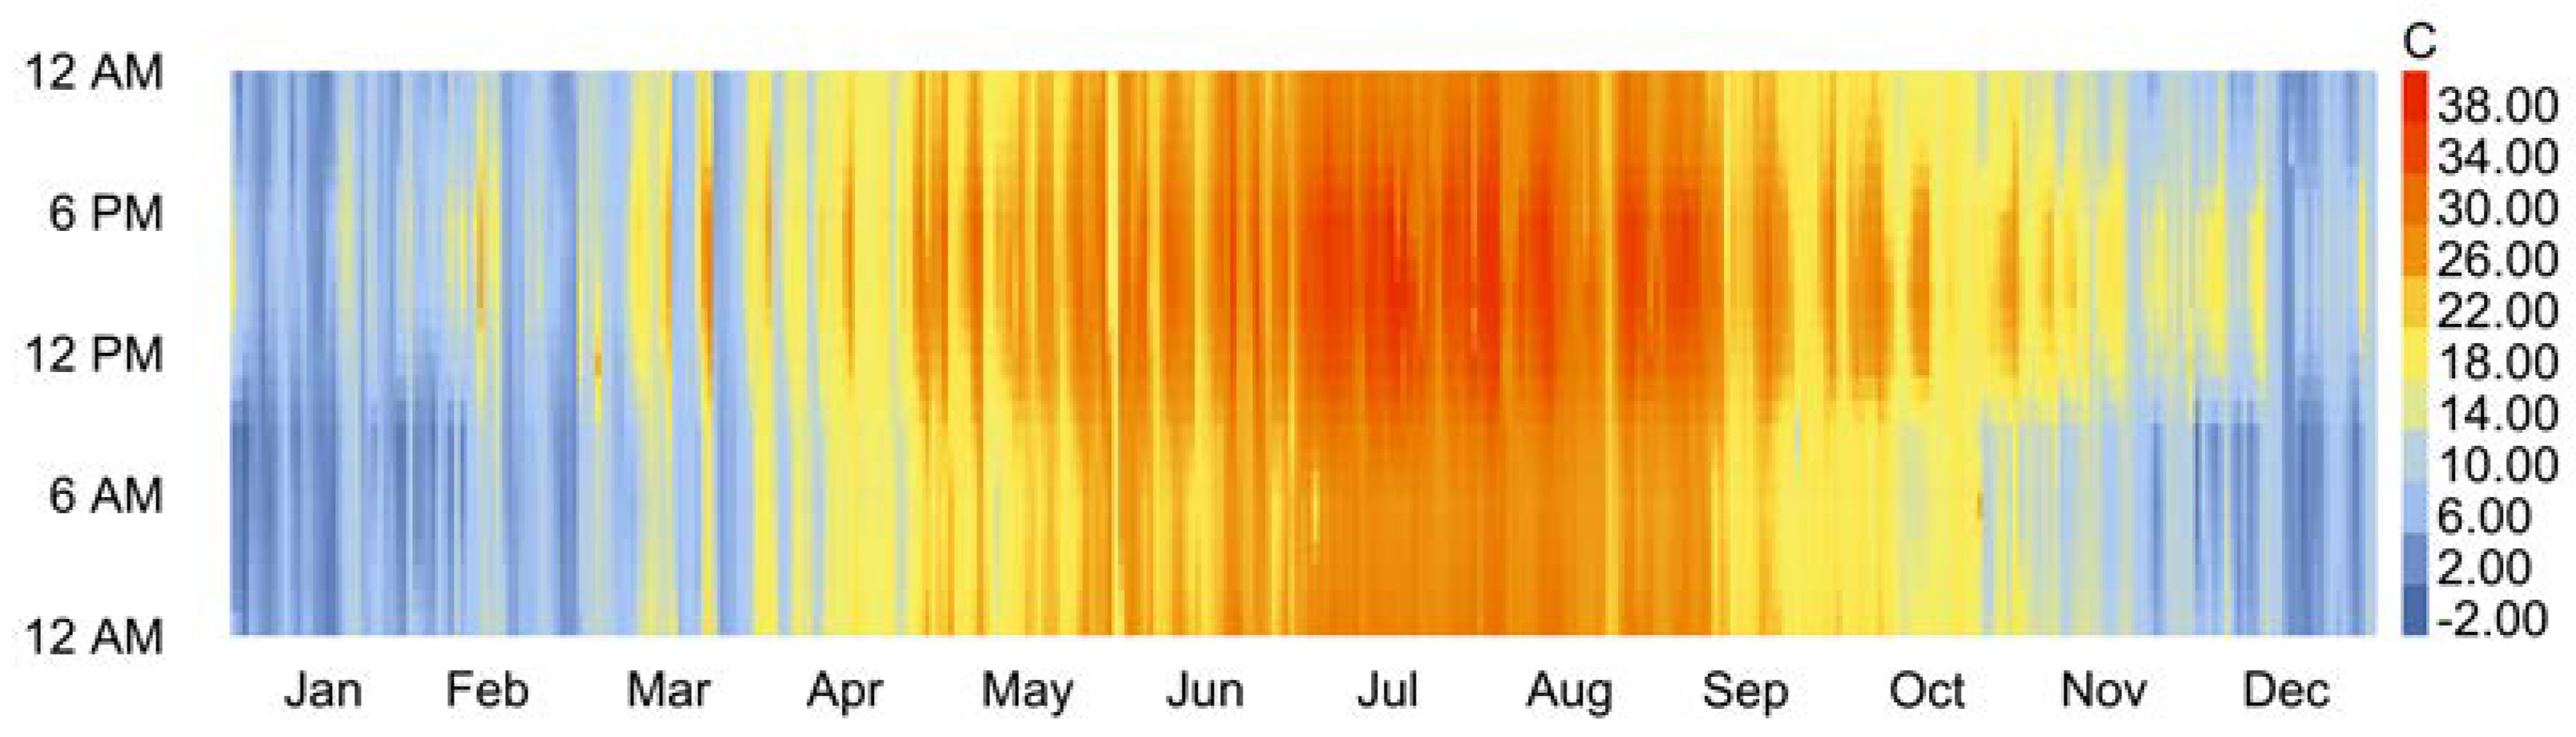
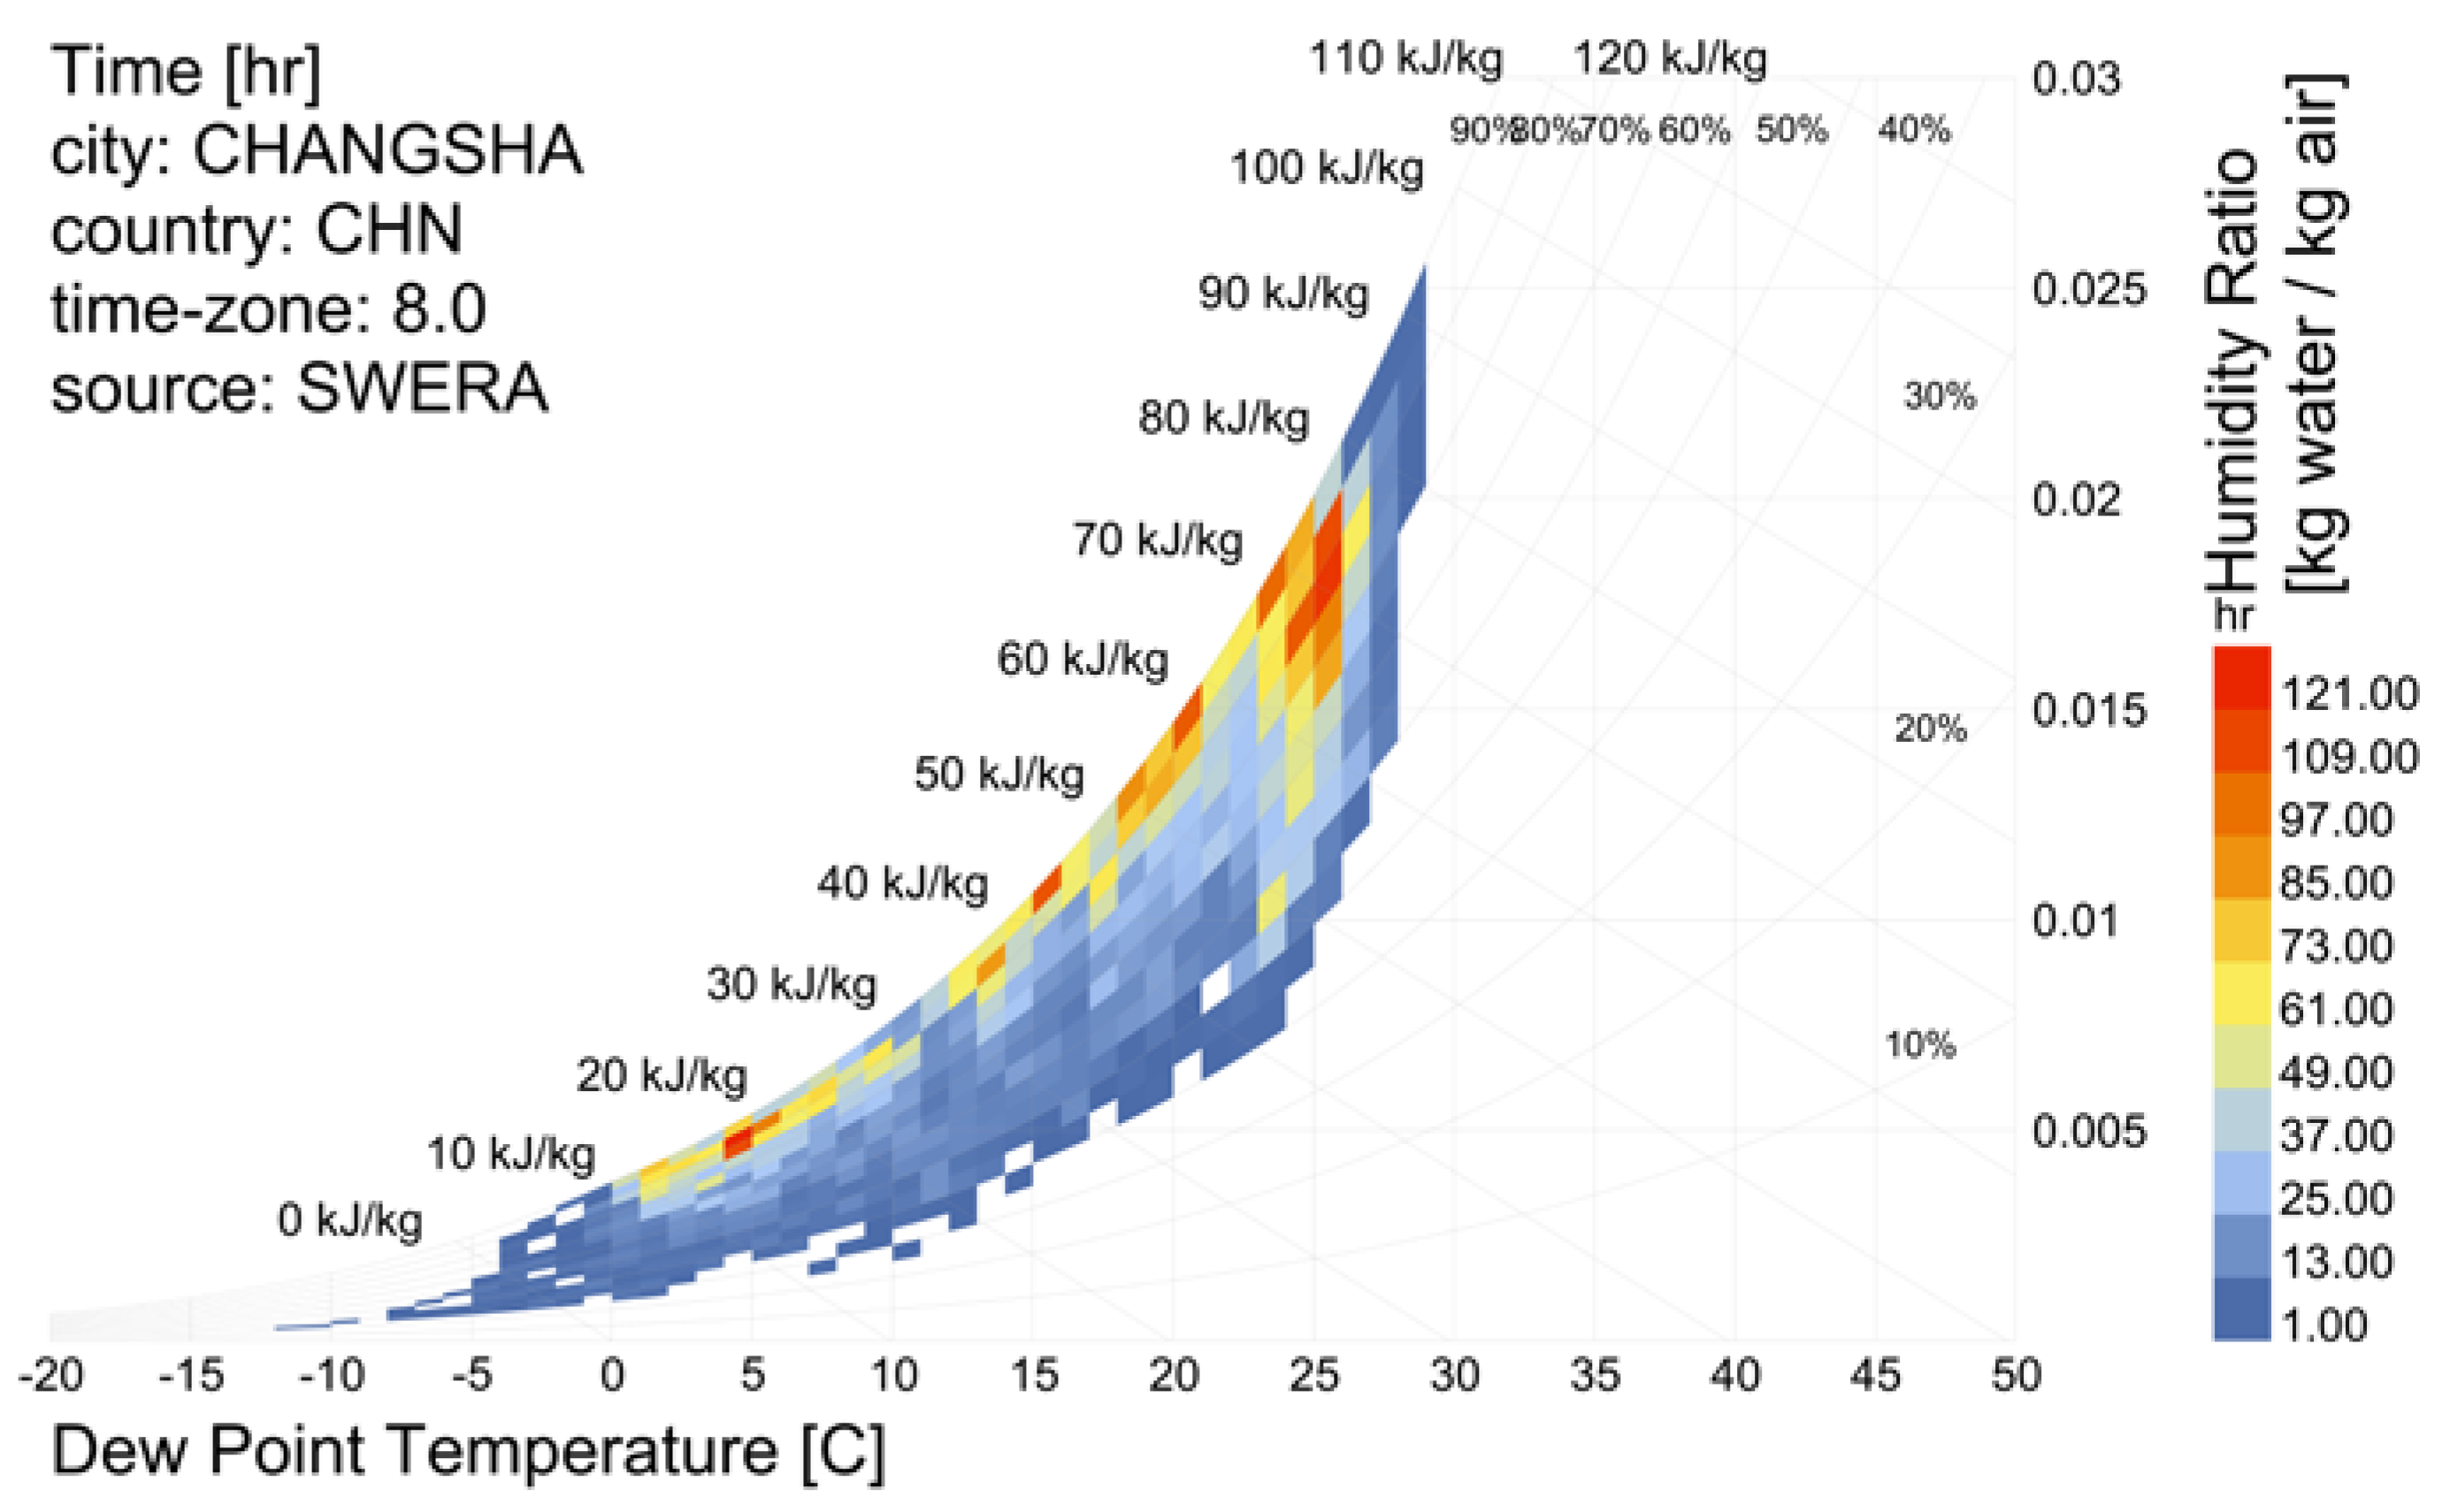
The selected case study is the dormitory located at Hunan Agricultural University (longitude 113.08° E, latitude 28.18° N), situated in Furong District, Changsha City, Hunan Province, China, as shown in Figure 2. Changsha City, located in the central region of China, has experienced increased heat during summers due to the effects of global warming. Being in the Yangtze River Delta region, it also experiences higher humidity in winter, leading to colder temperatures. The lowest temperatures in the winter can even reach sub-zero, and Changsha City is not categorized as a heating zone. Consequently, during the hot summers and cold winters, air conditioning usage peaks. According to the “Design Standard for Energy Efficiency of Public Buildings” (GB50189-2015 [46]), Changsha City is designated as a hot summer and cold winter climate zone (Zone A).
The dry bulb temperature and enthalpy humidity charts of Changsha are shown in Figure 3 and Figure 4, both of which are exported from Ladybug 1.5.0 software.
The building faces south, with a total of 6 floors. The building has a floor area of 4213.44 m2, with a floor height of 3 m. The comprehensive window-to-wall ratio of the building is 26.24%. Specifically, the window-to-wall ratio on the east side is 3.95%, on the west side is 6.58%, on the south side is 34.55%, and on the north side is 32.21%. The architectural parameters of the dormitory building are shown in Table 1.
The interior of the building mainly includes student dormitories, corridors, stairwells, and equipment rooms, and the elevated level is not considered. The case building is shown in Figure 5.

2.2.2. Simulation

Building energy modeling (BEM) is a highly effective tool for evaluating the energy performance of buildings [47]. This study used EnergyPlus, a widely used building energy simulation engine developed by the U.S. Department of Energy (DOE) and Lawrence Berkeley National Laboratory (LBNL), to simulate the energy consumption of the case study building [48]. The dormitory simulation diagram and the dormitory unit interior diagram are shown in Figure 6. The construction of the exterior envelope and heat conduction coefficient of the case study building are shown in Table 2.
Due to the special characteristic of functional use, the campus exhibits unique usage patterns. Upon investigation, it was found that the spring semester runs from February to August, with holidays typically starting around 15 August, while the autumn semester spans from September to January of the following year, with holidays generally starting around 15 January. Analysis of the hourly average temperatures in Changsha over the past decade indicates that temperatures begin to rise or fall starting in July and December, respectively. Table 3 illustrates the air conditioning operating hours for student dormitories in Changsha, Hunan Province, during the spring and autumn semesters.
After the outbreak of the COVID-19 pandemic in 2020, universities prohibited students from staying on campus during holidays unless under special circumstances due to concerns about student safety and pandemic prevention. Therefore, the electricity consumption in the student dormitories during the winter and summer breaks was no longer considered. Wenlu Xu [49] studied the correlation between the occupancy characteristics of student dormitories and air conditioning usage behavior during students’ time on campus. Considering the similarity between the climate in the southern region and student behavior, an hourly occupancy rate investigation was applied in this study, without considering the difference between holidays and weekdays. The hourly occupancy rate of the dormitories is shown in Table 4.

2.3. Multi-Goal Optimization Model

Multi-objective optimization is a problem that studies the optimization of multiple objective functions (n ≥ 2) under certain constraints. Its mathematical model is described in Equations (1) and (2). In Equation (1), F 1 ( x ) represents the life cycle energy consumption, F 2 ( x ) represents the life cycle carbon emission, and F 3 ( x ) represents the life cycle cost of the building, respectively. In this study, the influence of the insulation layer material thickness on the whole building is weighed and calculated from these three dimensions to explore the optimal solution of the envelope structure under multi-objective optimization.
M in F 1 ( x ) , F 2 ( x ) , F 3 ( x )
x = x 1 , x 2 , , x n
where F 1 ( x ) , F 2 ( x ) , F 3 ( x ) is the objective function.

2.3.1. Life Cycle Energy Assessment

The first function represents the total life cycle operational energy consumption, including the energy consumption for cooling in summer, heating in winter, and lighting equipment. In the southern region, there is no central heating system, and high-power electrical appliances are not allowed in student dormitories. Therefore, in this study, only the air conditioning system is used for both heating and cooling purposes. The operational stage of the building contributes to over 90% of the total energy consumption throughout the life cycle of the building. The impact of changes in the building envelope structure is mainly observed during the operational stage. Therefore, energy consumption calculations are limited to the operational stage of the building. The mathematical expression for this function is represented in the following expression [50]:
F 1 ( x ) = L C E
L C E = n × ( E s + E w + E e p )
where E s represents the energy consumption for summer air conditioning cooling, GJ; E w represents the energy consumption for winter air conditioning heating, GJ; E e p represents the energy consumption for lighting equipment, GJ; and n represents the designed lifespan of the building, typically chosen as 50 years.

2.3.2. Life Cycle Carbon Emission Assessment

The second function represents the carbon emissions over the building’s life cycle, including emissions from the production and operation stages of the building materials. The calculation is based on the carbon emission coefficient method proposed by the IPCC, which combines information on the extent of human activities (activity data, AD) with the emission or removal coefficients for quantified activities (emission factor, EF). This can be expressed simply as E = AD × EF. The carbon emission coefficient for electricity is taken as 0.9515 tCO2/MWh for the central region in China, and the design lifespan of the building is assumed to be 50 years. The calculation expression is as follows [51]:
F 2 ( x ) = L C C E
L C C E = C E m + C E o p
C E m = φ i A i δ i ρ i
C E o p = 1000 × α × ( E s 3.6 × E E R s + E w 3.6 × E E R w )
where C E m represents the carbon emissions generated in the production stage of the building materials, kg; C E o p represents the carbon emissions of the operational phase of the building materials, kg; φ i represents the carbon emission coefficient of the i material; A i represents the surface area of the material covering the outer protective structure, m2; δ i represents the material thickness, m; ρ i represents the material density, kg/m3; α represents the carbon emission coefficient of electricity, tCO2/MWh; E s represents the energy consumption of air conditioning refrigeration in the summer, GJ; E w represents the energy consumption of air conditioning heating in the winter, GJ; E E R s represents the dormitory air conditioning refrigeration energy consumption ratio; and E E R w represents the dormitory air conditioning heating energy consumption ratio; the energy consumption ratio is the ratio of output power to input power.
After investigation, it was found that the air conditioner used in the dormitory is a 1.51 hp hanging air conditioner, and its detailed data are shown in Table 5.

2.3.3. Life Cycle Cost Assessment

The third function is the whole life cycle cost, which is the sum of the energy consumption cost and the cost of insulation materials in the whole life cycle of the insulation layer of the building. The net present value method is a method to evaluate the investment plan. The method uses the total present value of the net cash benefit and the net cash investment to calculate the net present value and then evaluates the investment plan according to the size of the net present value. Considering the need for currency conversion between RMB and USD in China, the currency conversion rate of 1 USD = 6.8041 CNY is adopted in this paper [53]. Using the following expression [51]:
F 3 ( x ) = C
L C C = ( C W + C S ) × P W F + d × ( S m S n ) × C i n
where L C C represents the sum of the energy consumption cost and thermal insulation material cost during the life period, USD/year; PWF represents the present value factor; d represents the thickness of the insulation material, mm; S m represents the building external wall area, m2; S n represents the building door and window opening area, m2; and C i n represents the price of thermal insulation material per unit volume, USD.
Considering the time value of money and the scientific and simple characteristics of the NPV method, which has been widely used and verified in real life, the NPV method is chosen to evaluate the life cycle cost of carbon. When calculating the cost of a product during its use, it is necessary to convert the annual use cost of the product during its life cycle to the initial year for comparison between different products. In order to consider the impact of bank lending rates and inflation rates on the depreciation of funds, it is necessary to convert a sum of money in the future to the present value at a certain interest rate. The value coefficient PWF is introduced here.
P W F = ( 1 + I ) N 1 I ( 1 + I ) N
If   g < I ,   then :   I = I g 1 + g
If   g > I ,   then ,   I = g I 1 + I
If   g = I ,   then ,   P W F = ( 1 + I ) 1
where g represents the inflation rate, I represents the loan interest rate, N represents the life of the insulation material, and year, the life of the insulation material is set to 20 years. By referring to the historical data of the Bank of China’s basic lending rate (LPR), it can be seen that the current lending rate I is 4.3%. According to the data of the World Bank, China’s inflation rate as measured by the consumer price index in 2018–2022 is 2.1%, 2.9%, 2.4%, 1.0%, and 2.0%. In this study, the inflation rate is taken as the five-year average of 2.08%. Through calculation, the PWF is 16.09.

2.3.4. Optimal Multi-Objectives

The energy saving rate (ESR), carbon emission saving rate (CESR), and cost saving rate (CSR) were compared to the initial value of the building, and different envelope design combinations were evaluated according to the three dimensions to determine the best energy saving in retrofit. The calculation method is shown as follows:
E S R = 1 ( F 1 o p t / F 1 b c )
C S E R = 1 ( F 2 o p t / F 2 b c )
C S R = 1 ( F 3 o p t / F 3 b c )
where F o p t represents the objective function value of the optimal solution, and F b c represents the initial function value of the building.

2.4. Detailed Calculation of Optimizing the Envelope

2.4.1. Exterior Window

The exterior window is an important part of the building envelope and the main energy consuming part of the building. The window is composed of a window frame and glass; with the national attention to energy conservation and environmental protection, Hunan Province has also introduced the corresponding energy-saving regulations, and the energy-saving indicators of the window are controlled. The case building window is aluminum alloy window + flat glass; in the comparative study, choose the common window frame materials: aluminum alloy window, hot break aluminum alloy window, and PVC plastic steel window; the selected glass is ordinary hollow glass, hollow glass, and Low-E glass. The structure and heat transfer coefficient of the window are shown in Table 6.
The carbon emission factor data of three types of windows with different structures are from the “Building Carbon Emission Calculation Standard” (GB/T 51366-2019 [54]), and the carbon emission factor data of different glass are from Chao Mao et al. [55]. The carbon emission factors of the windows and glass are shown in Table 7.

2.4.2. Selection of Insulation Materials

The main methods of external wall insulation are internal insulation, sandwich insulation, and external insulation. From the perspective of building thermodynamics and the practical results of energy-saving building external wall insulation, it is observed that external insulation is the most preferable method for external walls. This is because, when external walls are insulated externally, it effectively cuts off thermal bridges on the external walls, preventing condensation, discoloration, and mold growth on the inner surface of the walls during winter. It also enhances the thermal stability of the rooms, making them more comfortable to inhabit. Moreover, it effectively protects the main structure of the external walls, prolonging the lifespan of the building. Additionally, it increases the effective usable area of the house, providing superior overall economic benefits. Currently, the most common insulation materials in the market include expanded polystyrene (EPS), extruded polystyrene (XPS), rock wool (RW), and polyurethane (PU). Among them, XPS has good thermal insulation and strong waterproofing properties and is commonly used for roof insulation. EPS has good sound insulation effects and is relatively low in price. PU has excellent insulation effects, while RW has good fire resistance. To meet the thermal parameters required for nearly zero energy buildings, EPS, XPS, PU, and RW are selected as the external wall insulation materials for comparative studies on their different thicknesses. EPS, XPS, and PU are also commonly used for roof insulation in southern regions. Therefore, these three materials are chosen as roof insulation materials to explore the optimal thickness under multi-objective optimization for roof insulation. Table 8 shows the basic information of the insulation materials.

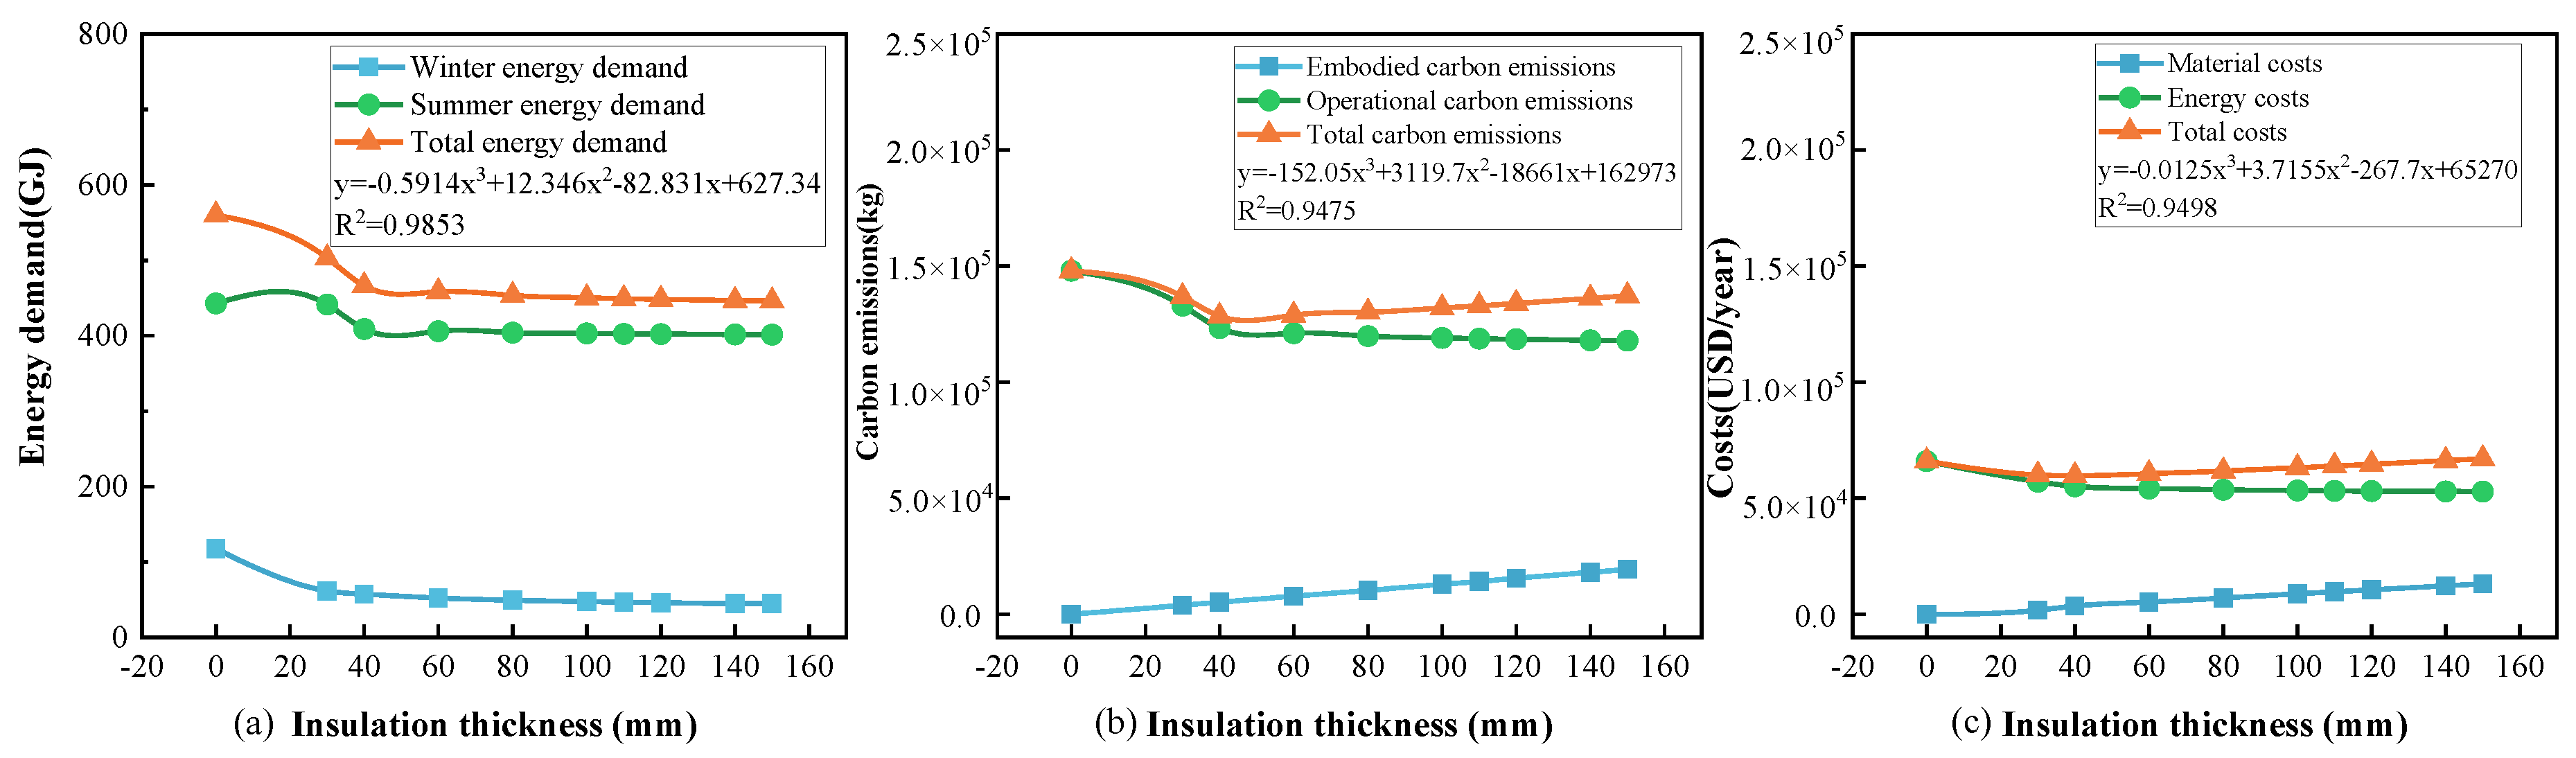
2.4.3. Determination of Insulation Material Thickness

According to the “Technical Standard for Near Zero Energy Buildings” (GB/T 51350-2019 [60]), relevant provisions are made for the design parameters of the envelope structure in each climate zone. The envelope structure in hot summer and cold winter areas is shown in Table 9.
According to the “Design Standard for Energy Efficiency of Public Buildings”(GB 50189-2015 [46]), the case study is located in cold zone C, and the calculated indoor temperature is set at 20 °C in winter and 26 °C in summer, considering that the top floor may be more susceptible to climate change in hot or cold climates. In the case that the operational effect of air conditioning is slower than that of the standard floor, according to the investigation of the student dormitory, it is found that the indoor temperature of students living on the top floor is set at 18 °C on summer and 28 °C in winter. According to the “Code for Thermal Design of Civil Buildings”(GB 50176-2016 [56]), the values of the internal and external resistance of the envelope structure are shown in Table 10.
As described earlier, the thermal conductivity of the envelope structure is shown in Table 1. Under the condition of 65% energy savings, the minimum material thickness can be obtained by empirical formula [61], which is shown as follows:
U = 1 R ¯
R ¯ = R E , 1 + R E , 2 + + R E , i + ( R i + R e )
R E , i = δ E , i λ E , i φ E , i
where U represents the overall heat transfer coefficient, m2·K/W; R ¯ represents the thermal resistance of the system, m2·K/W; R E , 1 , R E , 2 R E , i represent the thermal resistance of each layer of material, m2·K/W; R i represents the heat transfer resistance value of the inner surface of the enclosure structure; R e represents the heat transfer resistance value of the outer surface of the enclosure structure; λ E , i represents the thermal conductivity of the i kind of material, W/(m·K); R E , i represents the heat transfer coefficient of the i kind of material, m2·K/W; δ E , i represents the thickness of the i kind of material, mm; and φ E , i represents the correction coefficient of the i kind of material.
Many studies have proven that the selection and consumption of building materials directly impact the energy consumption of the building operational phase [62]. Mushu Fu [63] compiled a formula for calculating the energy consumption per unit area of the envelope structure, according to which, the minimum thickness of the exterior wall and roof can be solved under near-zero energy consumption. The formula is shown as follows:
S E , T O T A L S E = N ( Δ T S T S + Δ T W T W ) R n + δ E , i λ E , i + R w + μ E , i ρ E , i δ E , i
S R , T O T A L S R = N ( Δ T S T S + Δ T W T W ) R n + δ R , k λ R , k + R w + μ R , k ρ R , k δ R , k
where S E , T O T A L and S R , T O T A L , respectively, represent the total energy consumption of the exterior wall and roof, MJ; δ E , i and δ R , k , respectively, represent the thickness of the i kind of exterior wall material and the thickness of the k kind of roofing material, m; λ E , i and λ R , k , respectively, represent the thermal conductivity of the i kind of external wall material and the thermal conductivity of the k kind of roofing material, W/m·K; N indicates the operating life, years; Δ T S and Δ T W , respectively, represent the hourly temperature difference between indoor and outdoor in the summer and winter, K; T S and T W represent the cooling and heating times in the summer and winter, respectively, s; R n and R w , respectively, represent the thermal resistance of the building envelope in the summer and winter, K/W; μ E , i and μ R , k , respectively, represent the mass energy of the i kind of exterior wall material and the k kind of roofing material, MJ/kg; and ρ E , i and ρ R , k , respectively, represent the density of the i type of exterior wall material d and the density of the k type of roof material, kg/m3.
If the two forms are combined, the minimum thickness of the insulation material can be calculated according to the energy-saving constraint value in the specification, and the same thickness range of the same material can be taken, which meets the energy-saving specifications and meets the requirement of near-zero energy consumption. The design thickness range of the insulation materials is shown in Table 11.

3. Results and Discussion

This section begins by individually optimizing the materials of the external walls, windows, and roof structures, identifying the best optimization schemes for different building components. These findings are then integrated to form the optimal renovation strategy for the building envelope, which is applied to the case study for further discussion and analysis.

3.1. Establishment of a Single Parameter Retrofit Construction Plan

This subsection covers the results of the parametric investigation of a single parameter retrofit construction plan by analyzing each variable separately and commenting on (i) the exterior wall, (ii) exterior window, and (iii) exterior roof.

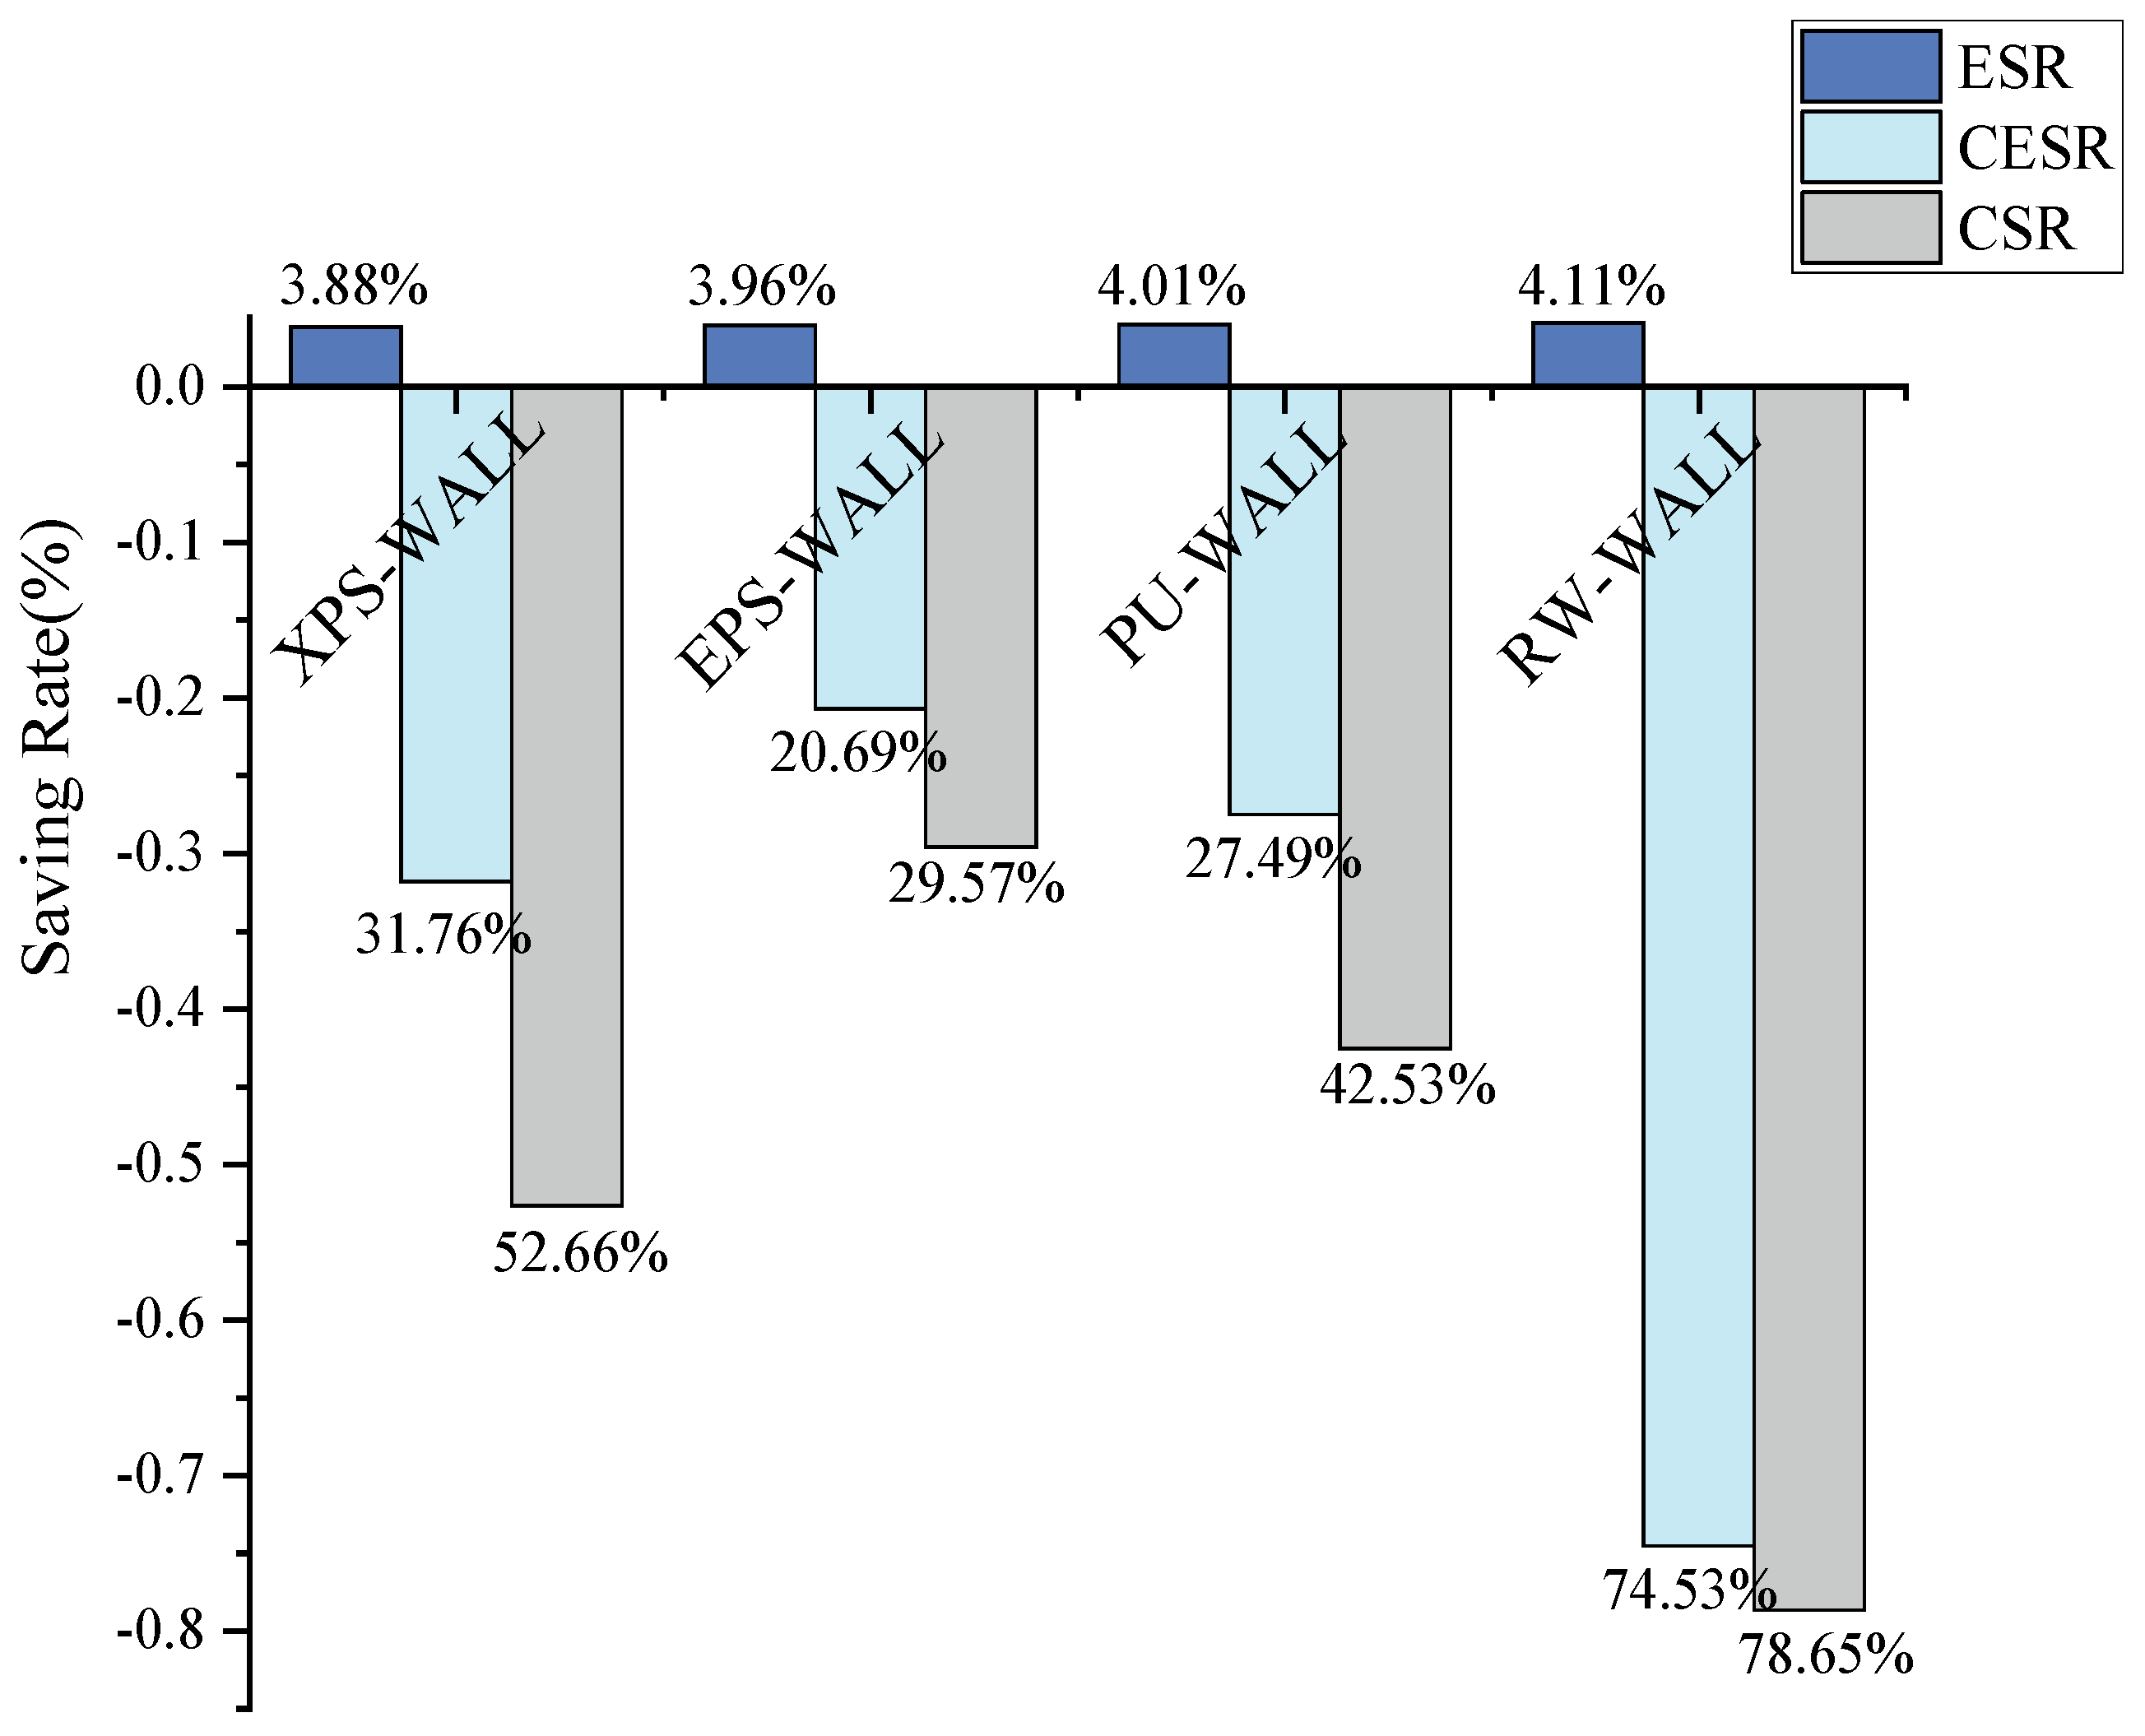
3.1.1. Exterior Wall

(1)
Multi-objective optimization analysis
Based on the case study, this section employs a multi-criteria assessment model to meet the energy-saving retrofit measures by adding different insulation materials to the external walls individually. Considering the requirements of energy-saving regulations, different insulation materials have different thickness ranges. A common material range (60–130 mm) was selected for comparison. Figure 7 presents the variation curves of the unit area annual total energy HVAC consumption for different thicknesses of the same material and for the same thickness with different materials added.
Figure 7 shows a negative correlation between the annual cumulative load index and the insulation layer thickness per unit area of the building. The index decreases linearly with the increased insulation thickness. This is primarily due to the significant temperature difference between inside and outside in Changsha. Adding insulation reduces the thermal conductivity of the building envelope, effectively preventing heat flow and improving insulation for heating. Insulation in the external walls minimally impacts energy consumption. For example, with XPS, starting from 60 mm, the energy savings rates for every additional 10 mm are 3.14%, 3.27%, 3.41%, 3.53%, 3.63%, 3.72%, 3.80%, and 3.88%. Compared to the initial building, these rates are not significant, because the building’s autoclaved aerated concrete blocks already provide good insulation and low thermal conductivity. As the insulation thickness increases, the energy consumption reduction levels off. Therefore, an appropriate insulation thickness can meet the energy-saving standards and minimize building energy consumption for optimal cost-effectiveness.
Figure 8 illustrates that, as the thickness of the insulation material increases, the cost per unit area of the building also increases accordingly. The total cost of the building is the cumulative sum of the energy consumption cost and the material cost. Taking XPS as an example, starting from 60 mm, the cost increases for every additional 10 mm of material thickness are 24.06%, 28.13%, 32.17%, 36.25%, 40.34%, 44.44%, 48.55%, and 52.66%, respectively. The main reason is that, while the addition of insulation materials decreases the building’s overall energy consumption, it does not significantly improve the already relatively sound original construction of the building envelope. This means that the existing building envelope is already effective at energy conservation. After increasing the thickness of the insulation material, the increase in material cost outweighs the decrease in energy consumption cost, leading to a gradual increase in total cost. It can be observed that the order of cost increase for different materials after changes in the insulation layer thickness is PU > RW > XPS > EPS. Therefore, when designing for energy consumption in buildings, it is nonnegligible to consider that the choice of insulation materials is also subject to economic constraints, and a balanced analysis should be conducted based on different practical situations.
Figure 9 indicates that the annual life cycle carbon emissions per unit area of the building exhibit a certain positive linear correlation with the thickness of the insulation layer. That is, the annual life cycle carbon emissions increase linearly with the increase in insulation layer thickness. Taking XPS as an example, starting from 60 mm, the increase in carbon emissions for every additional 10 mm of material thickness is 13.31%, 15.92%, 18.52%, 21.15%, 23.79%, 26.45%, 29.12%, and 31.79%, respectively. In this study, the life cycle carbon emissions consist of the carbon emissions from the material production stage and the operational stage, indicating that, with the increase in insulation material thickness, the carbon emissions from the material production stage far exceed the carbon emissions saved during the operational stage. The production processes and techniques for different insulation materials are not only similar but also affected by different geographical constraints and construction personnel, leading to varying carbon emissions during the production process and the formation of different carbon emission factors. According to the above analysis, it is evident that the ranking of the life cycle carbon emissions for different insulation materials varies as follows: RW > PU > XPS > EPS. It can be observed that, while the life cycle carbon emissions of PU and XPS materials are comparable, PU material’s carbon reduction rate is slightly lower than that of XPS material.
Based on the analysis above, the study explores the variations in life cycle energy consumption, life cycle carbon emissions, and life cycle costs for four different insulation materials within the thickness range of 60 mm to 130 mm and conducts a comparative analysis of the materials in three dimensions. Subsequently, using XPS material as an example, detailed discussions and research on life cycle energy consumption, life cycle carbon emissions, and life cycle costs under the three objectives are conducted, as shown in Figure 10.
As shown in Figure 10, adding an insulation layer to the external walls significantly reduces the heating load, which means the energy consumption during winter can be effectively lowered. While the cooling load of the building also shows a decreasing trend with increased insulation thickness, this reduction is minimal and can be largely ignored. The primary reasons are the relatively small temperature difference between indoor and outdoor environments in the summer in Changsha and the use of autoclaved aerated concrete blocks as the main material for the case study building, which inherently provides good thermal insulation and heat storage functions. Therefore, when the external wall structure of the case study building is already close to energy-saving standards, adding an insulation layer to change the thermal conductivity of the building envelope seems a weak impact on the cooling load.
(2)
Multi-objective optimization outcome
The range of XPS insulating board thicknesses is from 0 to 160 mm, as depicted in Figure 10. When the thickness of the insulation material grows, the building’s heat load curves downward, whereas the cooling load drops linearly. Although raising the thickness of the insulation layer reduces the building’s energy consumption, it is not possible to expand it indefinitely in practical engineering manufacturing. The graph shows that there is a maximum thickness for the insulation layers. Beyond this thickness, the rate of energy savings is quite tiny. As a result, there is a decrease in cost-effectiveness when the cost increases and energy consumption decreases. Therefore, establishing the relationship between the thickness of the insulation material and the building’s total life cycle energy consumption is essential to explore the range of insulation layer thicknesses, as shown in Table 12.
The optimal thickness of the selected external wall insulation materials was re-simulated, and the optimal external wall insulation materials were selected from the aspects of the life cycle energy saving rate, carbon emission saving rate, and cost-saving rate. The optimized results are shown in Figure 11.
Since both cost and carbon emissions tend to increase linearly, smaller material thicknesses are more cost-effective. However, there is a relationship between life cycle energy consumption and insulation material thickness. By establishing the relationship between insulation material thickness and energy consumption, we can explore the maximum thickness of different materials that meet the energy-saving standards and evaluate their savings rates in three dimensions. It was found that EPS and RW have lower increases in life cycle carbon emissions and costs compared to XPS and PU materials within their maximum thickness range. Additionally, the energy savings rates of EPS and RW are similar within the maximum thickness range. Therefore, EPS material was chosen for the overall optimization at the maximum value of 164 mm, while EPS was optimized at the minimum thickness of 55 mm according to energy-saving standards, providing a reference for practical production and life.
Through the above analysis, it can be found that different insulation materials have different optimal thicknesses in the energy savings of external walls, which is caused by the properties of the materials themselves. Figure 12 shows the relationship between the optimal thickness of insulation materials and the thermal conductivity.
From the concept of thermal conductivity itself, it is evident that the lower the thermal conductivity of an insulating material, the thinner the material is needed on external walls or roofs to achieve the desired energy efficiency. It is visualized in Figure 12. The thermal conductivity of EPS is 0.041 W/(m·K), while that of RW is 0.040 W/(m·K). When selecting the optimal thickness, the maximum thickness of the insulation material was chosen to minimize the impact on energy consumption. However, EPS exhibits larger fluctuations in thickness compared to RW while complying with the regulations. Therefore, it is beneficial to select insulation materials with lower thermal conductivity during the design phase to reduce building energy consumption. However, architects must also balance this choice with economic and carbon emission considerations.

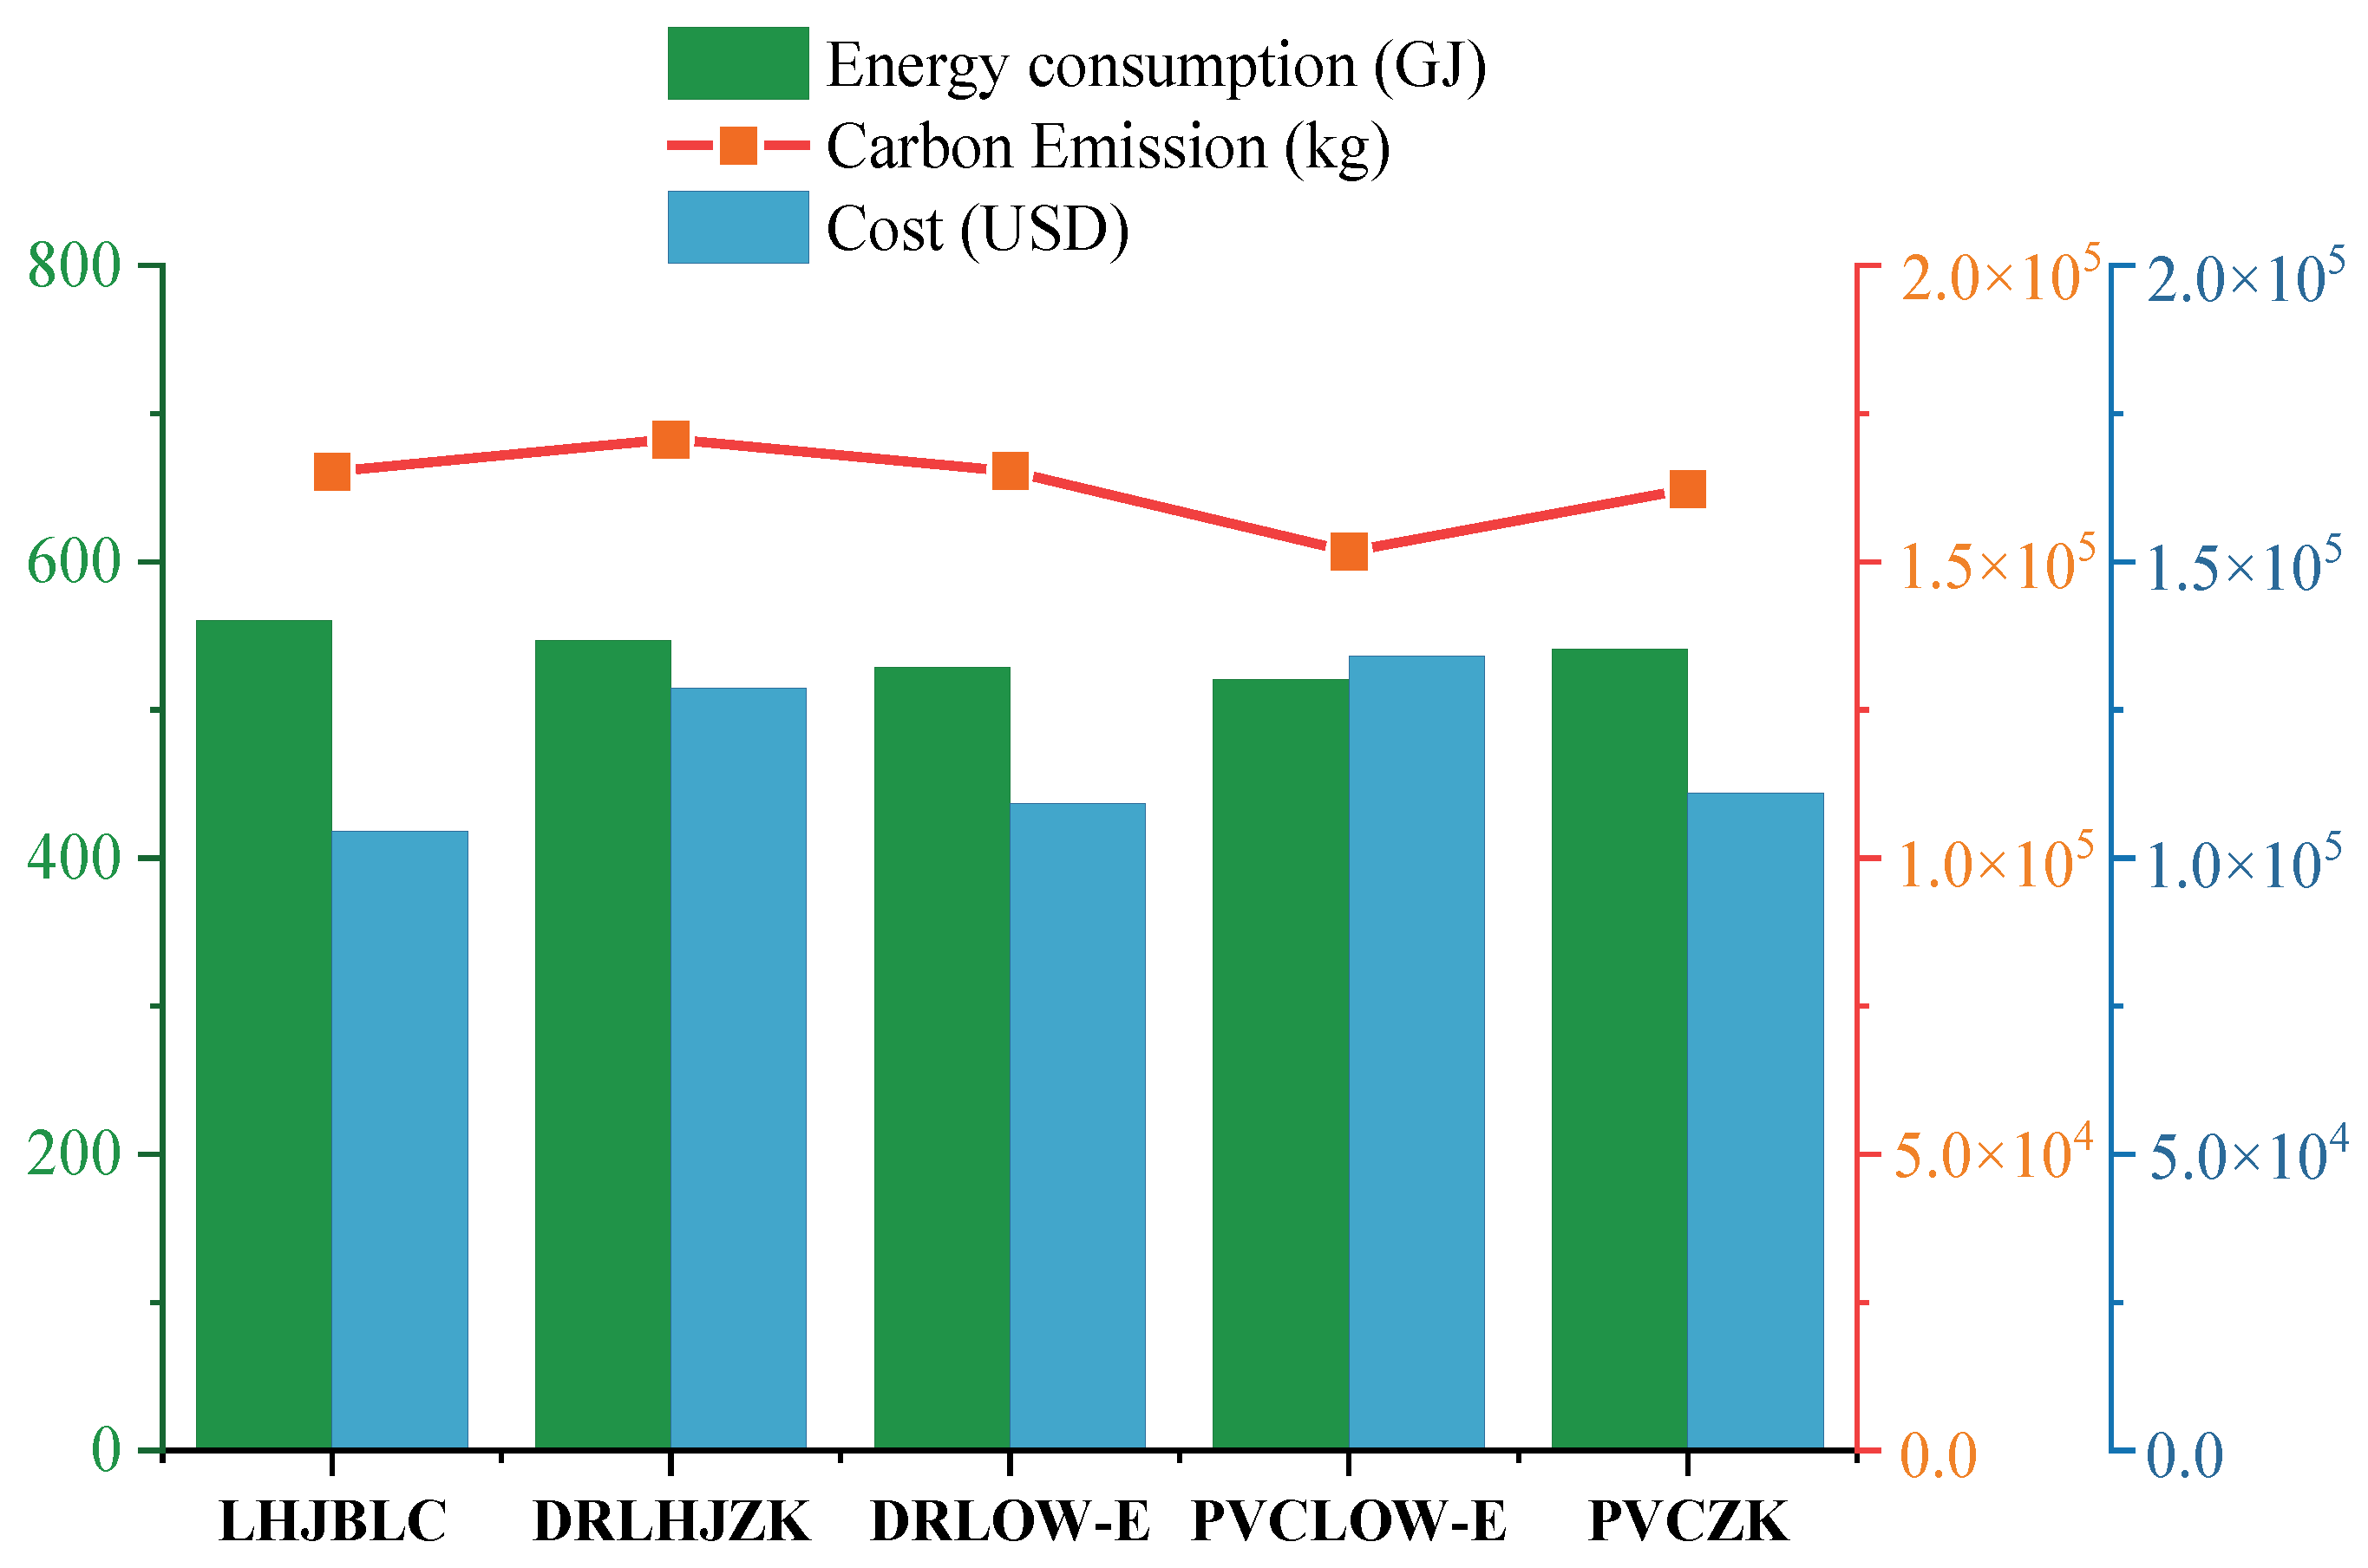
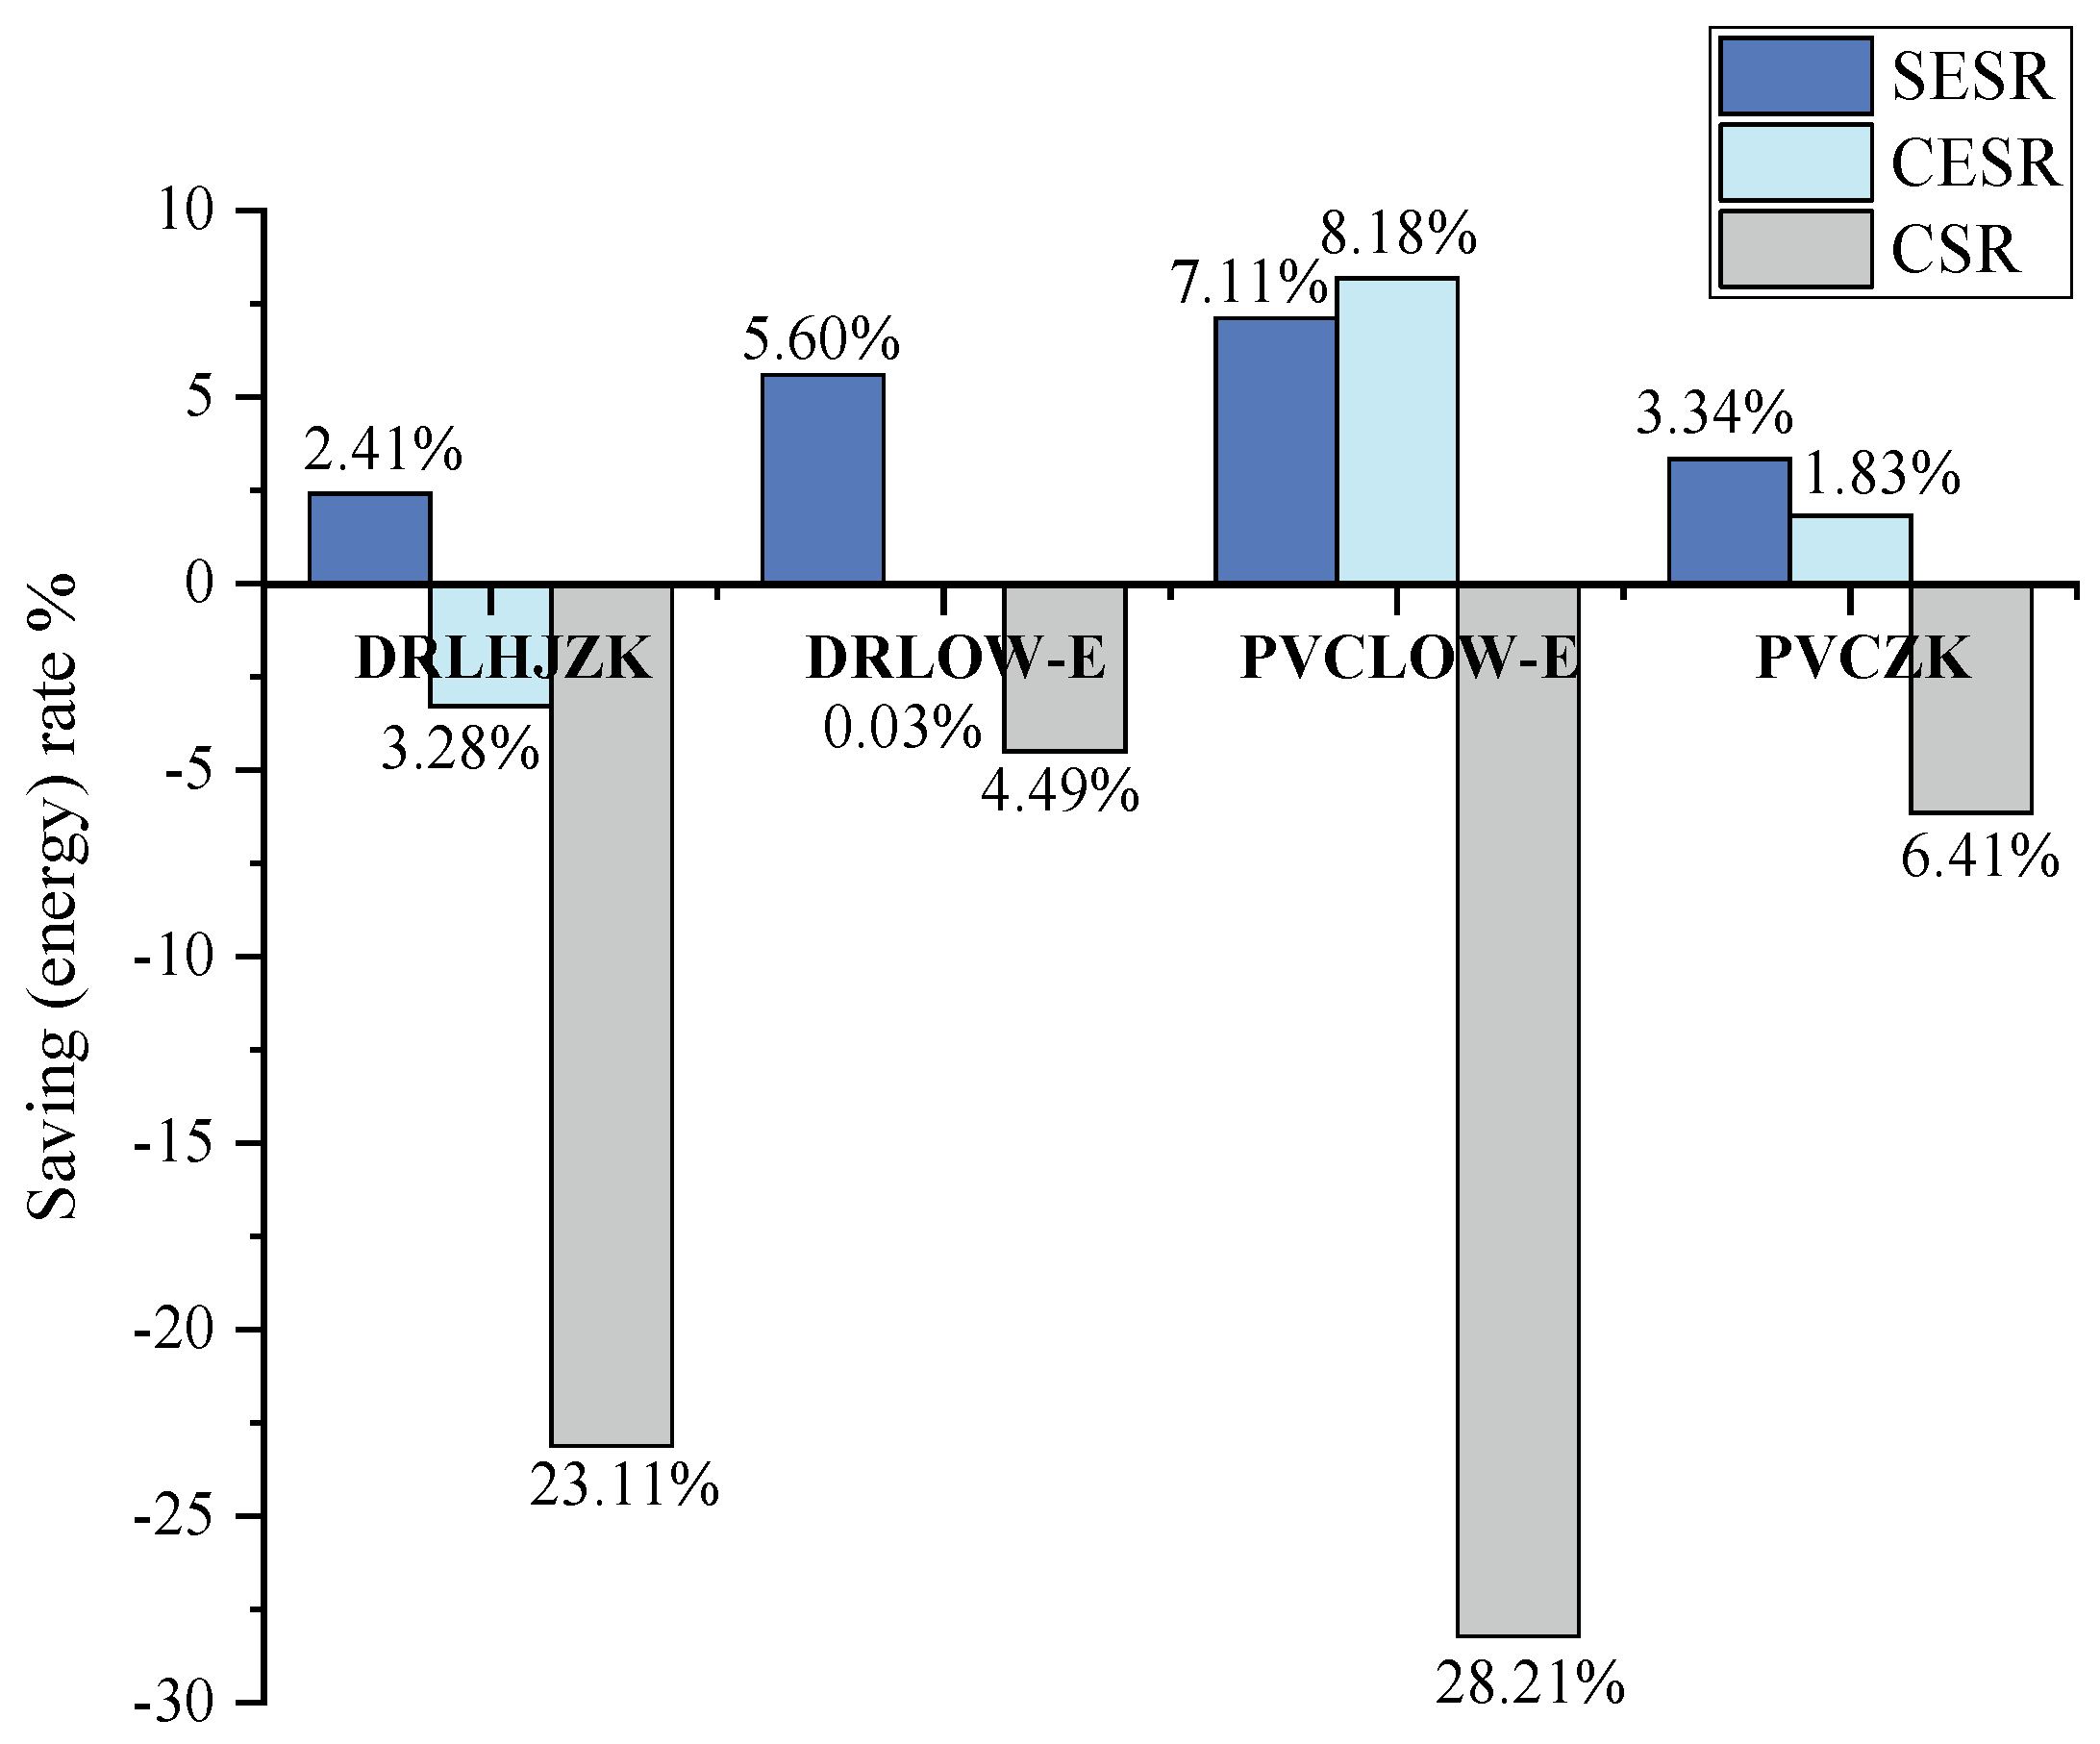
3.1.2. Exterior Window

(1)
Multi-objective optimization analysis
In the peripheral components of buildings, windows, due to their poorer thermal insulation performance compared to other peripheral structures and larger surface area, become the main pathway for energy consumption losses in buildings. Taking this case building as a representative, many buildings also have poor performance of external windows. The thermal performance of external windows directly affects indoor thermal comfort. Therefore, studying window thermal performance significantly impacts building energy consumption, carbon emissions, and costs throughout its life cycle. In the case study building, windows account for 32.21% of north-facing walls and 34.55% of south-facing walls, with individual dormitories having nearly 50% of their exterior walls as windows. Thus, window design is crucial for both individual units and the entire building. Currently, the windows’ thermal transmittance is far below energy efficiency standards. Given the significant proportion of windows, improving only the external walls’ thermal performance has a minimal overall impact. The case study building uses aluminum alloy flat glass windows. A comparison analysis was conducted with insulated aluminum alloy hollow glass windows, insulated aluminum alloy Low-E hollow glass windows, PVC steel Low-E hollow glass windows, and PVC steel hollow glass windows. Figure 13 illustrates the life cycle energy consumption, carbon emissions, and costs of these various window types.
From Figure 13, it is evident that PVC steel windows paired with Low-E glass result in the lowest carbon emissions. Compared to the aluminum alloy flat glass windows in the case study building, the other window types all reduce energy consumption to some extent. However, the life cycle cost incurred by the windows in the case study building is the lowest and most economical. Following this, the next most economical option is the external window structure of insulated aluminum alloy windows paired with Low-E glass.
(2)
Multi-objective optimization outcome
The results of the four-window constructions for the case study building were evaluated using SESR, CESR, and CSR in a three-objective assessment, as shown in Figure 14. It can be observed that the optimized external windows of the building have improved compared to the initial state. An analysis of flat glass, insulating glass, and Low-E glass reveals that different window types with Low-E glass shading have lower shading coefficients and light transmittance, making them suitable for regions with hot summers and cold winters. They effectively prevent indoor heat loss in winter and block solar heat and radiation from entering the interior in summer. Considering economic optimization, both insulated aluminum alloy hollow windows and PVC plastic Low-E windows have economic increases exceeding 20%, so they are no longer considered. The difference between insulated Low-E windows and PVC plastic hollow windows lies in their energy-saving and carbon reduction rates. Since the energy-saving rate of insulated Low-E windows is higher and the increase in the carbon reduction rate is only 0.03%, in this study, insulated Low-E windows are chosen as the optimal external window construction for analysis.

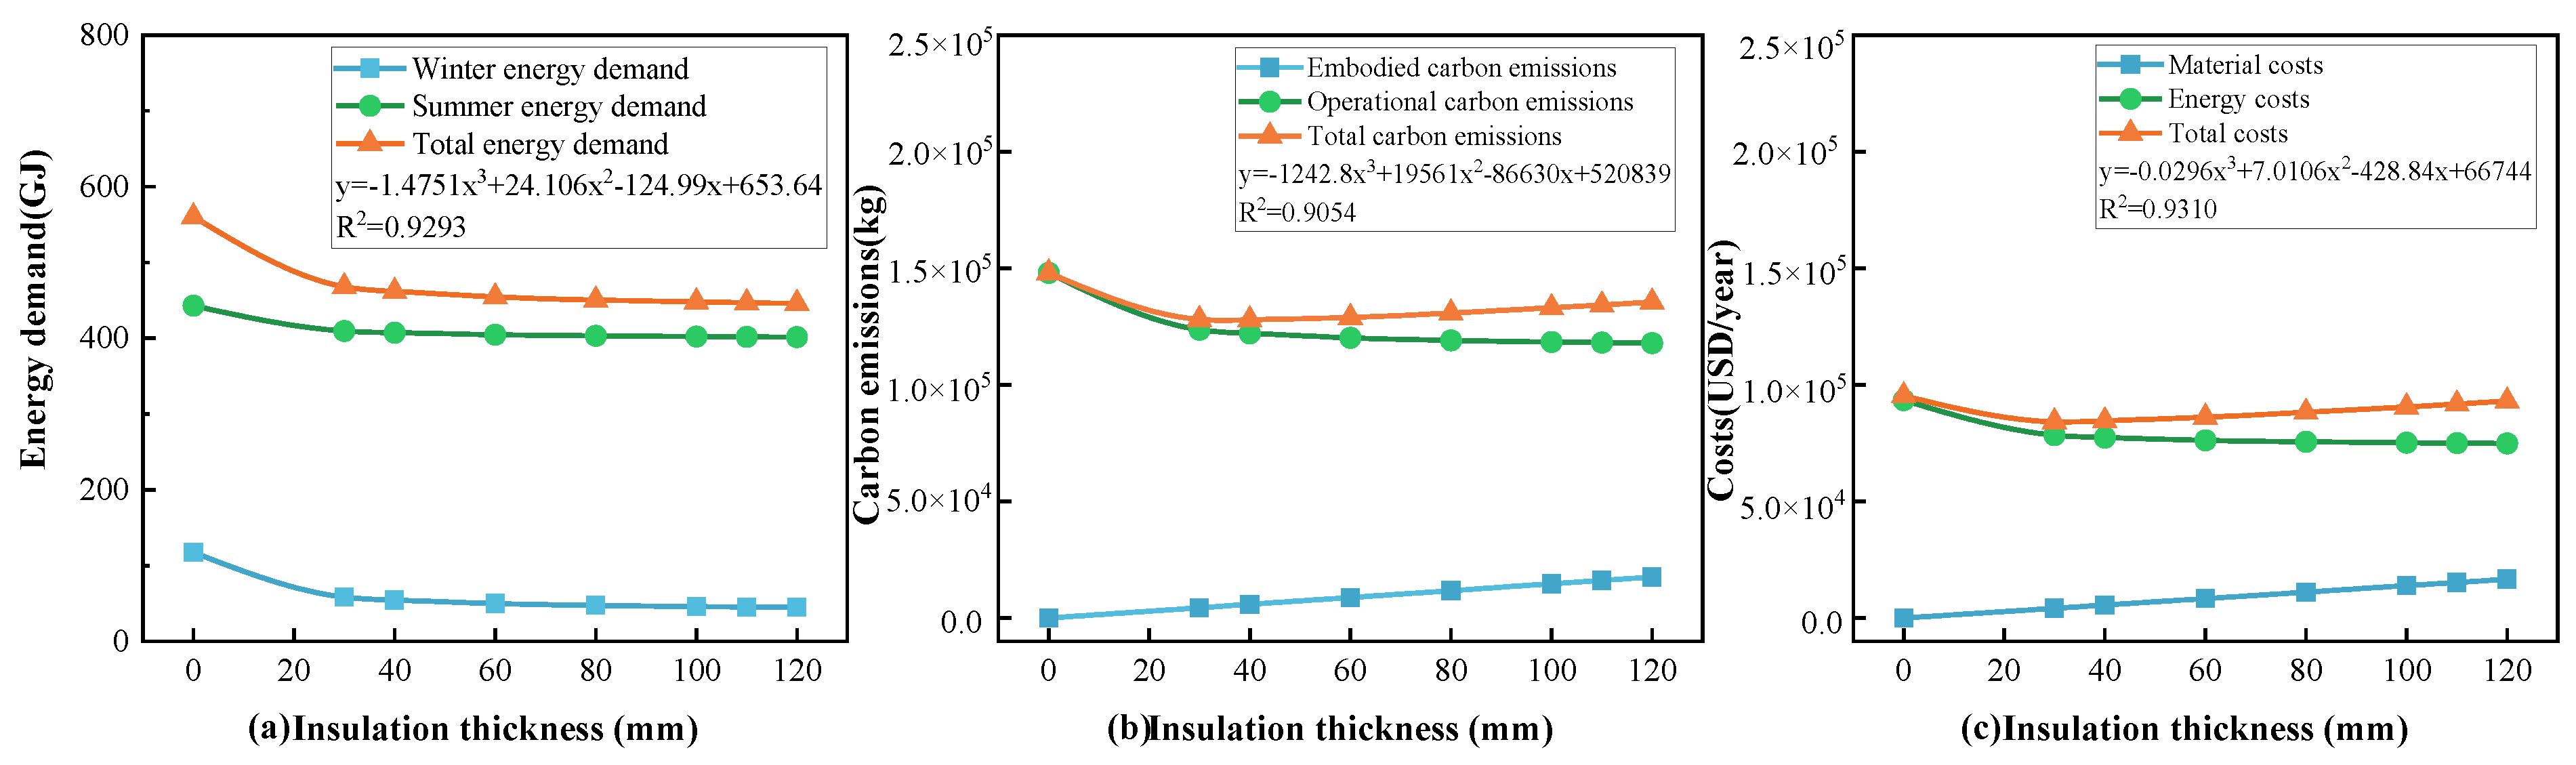
3.1.3. Exterior Roof

EPS, XPS, and PU are also commonly used for roof insulation in the southern region. Therefore, these three materials are used as roof insulation materials to explore the optimal thickness of roof insulation under multi-objective optimization.
(1)
Multi-objective optimization analysis
XPS is formed through continuous extrusion foaming during material production, resulting in XPS boards with dense surface layers and closed-cell structures in the inner layers. XPS boards exhibit excellent moisture resistance, maintaining good thermal insulation performance even in humid environments. Additionally, they have higher strength, bearing capacity, and compression resistance. Figure 15 illustrates the relationship between XPS material thickness and energy consumption, cost, and carbon emissions.
EPS is a lightweight polymer. It is produced by adding a foaming agent to polystyrene resin, which is then heated to soften and release gas, forming a rigid closed-cell foam plastic. The uniformly closed cellular structure of EPS gives it features such as low water absorption, excellent insulation, lightweight, and high mechanical strength. Polystyrene foam plastic is lightweight and has a large volume, making it the primary choice for insulation materials. However, it is difficult for recycling use due to the resistance to aging and corrosion.
As can be seen from Figure 16, compared to XPS, with the same material thickness, EPS has a lower energy savings rate than XPS, but the unit price of EPS is nearly half that of XPS, and the carbon emission is also about 25% lower. Therefore, since XPS is considered from the perspective of economy and environmental protection, EPS has a wider applicability.
Polyurethane (PU) insulation is globally acknowledged as a top-performing material. Rigid PU offers lightweight, low thermal conductivity, good heat resistance, aging resistance, ease of bonding with other materials, and non-drip combustion. It is extensively used in building roofs, walls, ceilings, floors, doors, and windows in Europe and the US. In these regions, about 49% of building insulation materials are PU, compared to less than 10% in China. Thus, exploring PU insulation thickness trends across three dimensions is vital. Figure 17 shows the relationship between PU insulation thickness and energy consumption, cost, and carbon emissions.
From Figure 17, it is evident that, when optimizing the roof of the initial building with different insulation materials, the addition of PU material can reduce the demand for insulation material thickness. This is because PU material has better thermal conductivity, which can better contribute to energy-saving and temperature control.
Comparing the changes in energy consumption after adding insulation to the exterior walls and roof reveals that the building’s cooling load decreases with the increasing insulation thickness. Although the reduction is not significant for the exterior walls, it is more pronounced for the roof due to its lower thermal conductivity. Adding insulation materials significantly increases energy-saving rates, affecting both cost and carbon emissions. Thus, when the original building envelope is less efficient, adding insulation results in a greater reduction in energy consumption and offers more options for insulation materials. Therefore, a comprehensive analysis of life cycle energy consumption, carbon emissions, and costs is crucial in determining the optimal type and thickness of insulation materials for buildings.
(2)
Multi-objective optimization outcome
Through solving the fitting curves of insulation materials with the full life cycle energy consumption, carbon emissions, and costs, the thicknesses of materials achieving extremes in three different dimensions can be obtained for discussion and analysis, ultimately determining the optimal material thickness.
Taking XPS material as an example for solving, the fitting curve of full life cycle energy consumption for XPS used on the roof shows minimum values within the range of 0 to 190 mm, specifically at 177.73 mm and 85.599 mm. The life cycle carbon emissions fitting curve indicates minimum values within the same range, specifically at 24 mm and 254 mm. The life cycle cost fitting curve reveals minimum values within the range of 20 to 190 mm, specifically at 64.83 mm and 178.8849 mm. To meet energy-saving regulations, the XPS roof insulation must be at least 80 mm thick. Therefore, for minimal energy consumption and carbon emissions, the optimal thicknesses are similar. It is advisable to select 179 mm for the insulation layer to balance the three objectives of LCE, LCCE, and LCC.
When XPS, EPS, and PU insulation materials are added to the roof for energy-saving purposes, the required thickness ranges are determined by energy-saving regulations (Table 4). Within these ranges, the optimal thicknesses are found using fitting curve solutions for life cycle energy consumption, carbon emissions, and costs. These optimal values will be excluded for exceeding the regulation thickness, and the minimum value within the energy-saving range is selected, as shown in Table 13.
According to the optimal thickness obtained, the energy consumption, cost, and carbon emission of the whole life cycle are calculated. The energy saving rate, cost saving rate, and carbon emission saving rate of different materials are shown in Figure 18.
After adjusting the optimal thickness of the insulation materials, an analysis of the energy-saving rate in three dimensions for the building was conducted. According to Figure 18, compared to the initial values of the building, the inclusion of XPS, EPS, and PU materials all results in savings in energy consumption and carbon emissions. However, XPS contributes to an increase in costs, which is due to the fact that the cost of reducing energy consumption after adding XPS is not as significant as the cost incurred by the increase in material thickness. It can be observed that, considering the economic factors, PU material demonstrates advantages when added to the roof for energy savings at a thickness of 62 mm.

3.2. Establishment of a Combined Retrofit Construction Plan

Based on the above analysis and according to the discussion in Section 3.1.1, increasing the thickness of insulation material in buildings with well-performing exterior walls yields minimal energy savings. Therefore, in this section, in addition to selecting 164 mm for the exterior wall thickness, we will add the minimum required exterior wall thickness of 55 mm to conduct a multi-objective comparison of the building envelope. The optimized structures of exterior windows and roofs remain unchanged. In summary, the optimization strategies for the building envelope of the case study can be divided into two scenarios: (i) Retrofit-1 of Wall (164 mm EPS) + window (DRLow-E) + roof (62 mm PU) and (ii) Retrofit-2 of Wall (55 mm EPS) + window (DRLow-E) + roof (62 mm PU). A study on LCE, LCCE, and LCC was conducted, with the specific data displayed in Table 14.
Additionally, the optimization results of the external envelope structure of two different retrofit plans were evaluated through ESR, CESR, and CSR for the three-objective assessments, as shown in Figure 19.
Figure 19 illustrates the energy savings of the improved building compared to the initial building under the three-objective assessment of the external walls, windows, and roof envelope structures. It was found that, with the specific values derived from this study for the renovation of the envelope structure, the improved building achieved a 31.79% reduction in energy consumption. Compared to the analysis of individual envelope structure components mentioned earlier, the improvement was nearly 10 to 30 times higher, indicating that energy-saving renovations for buildings cannot be limited to single components; rather, every aspect of the envelope structure needs to be planned comprehensively.
The overall life cycle carbon emissions increased by 57.18%, mainly due to the higher embodied carbon emissions from adding insulation to the external walls, windows, and roof and the enhanced envelope structure, which outweighed the carbon savings from reduced energy use. The life cycle costs increased by 15.58%, showing that optimizing the envelope structure significantly balanced energy savings with life cycle costs. EPS was chosen for external wall insulation, analyzed at a maximum 164 mm and a minimum 55 mm in thickness. As the insulation thickness increased, the energy savings and cost reduction rates diminished. However, EPS at 164 mm led to a 13.05% increase in carbon emissions compared to 55 mm. In practice, insulation thickness can be adjusted based on the actual requirements. If life cycle carbon emissions exceed the regulatory limits, the insulation thickness can be reduced. Conversely, if the costs and energy consumption comply with regulations, the minimum insulation thickness can be chosen.

4. Conclusions

This study developed a multi-criteria assessment model incorporating life cycle energy assessment (LCE), life cycle carbon emissions assessment (LCCE), and life cycle cost assessment (LCC) to conduct a detailed assessment of a student dormitory building in China. The building envelope was green retrofitted to enhance the performance of sustainability of the building, and a comparative investigation was performed based on the case study. The following conclusions were acquired:
(1)
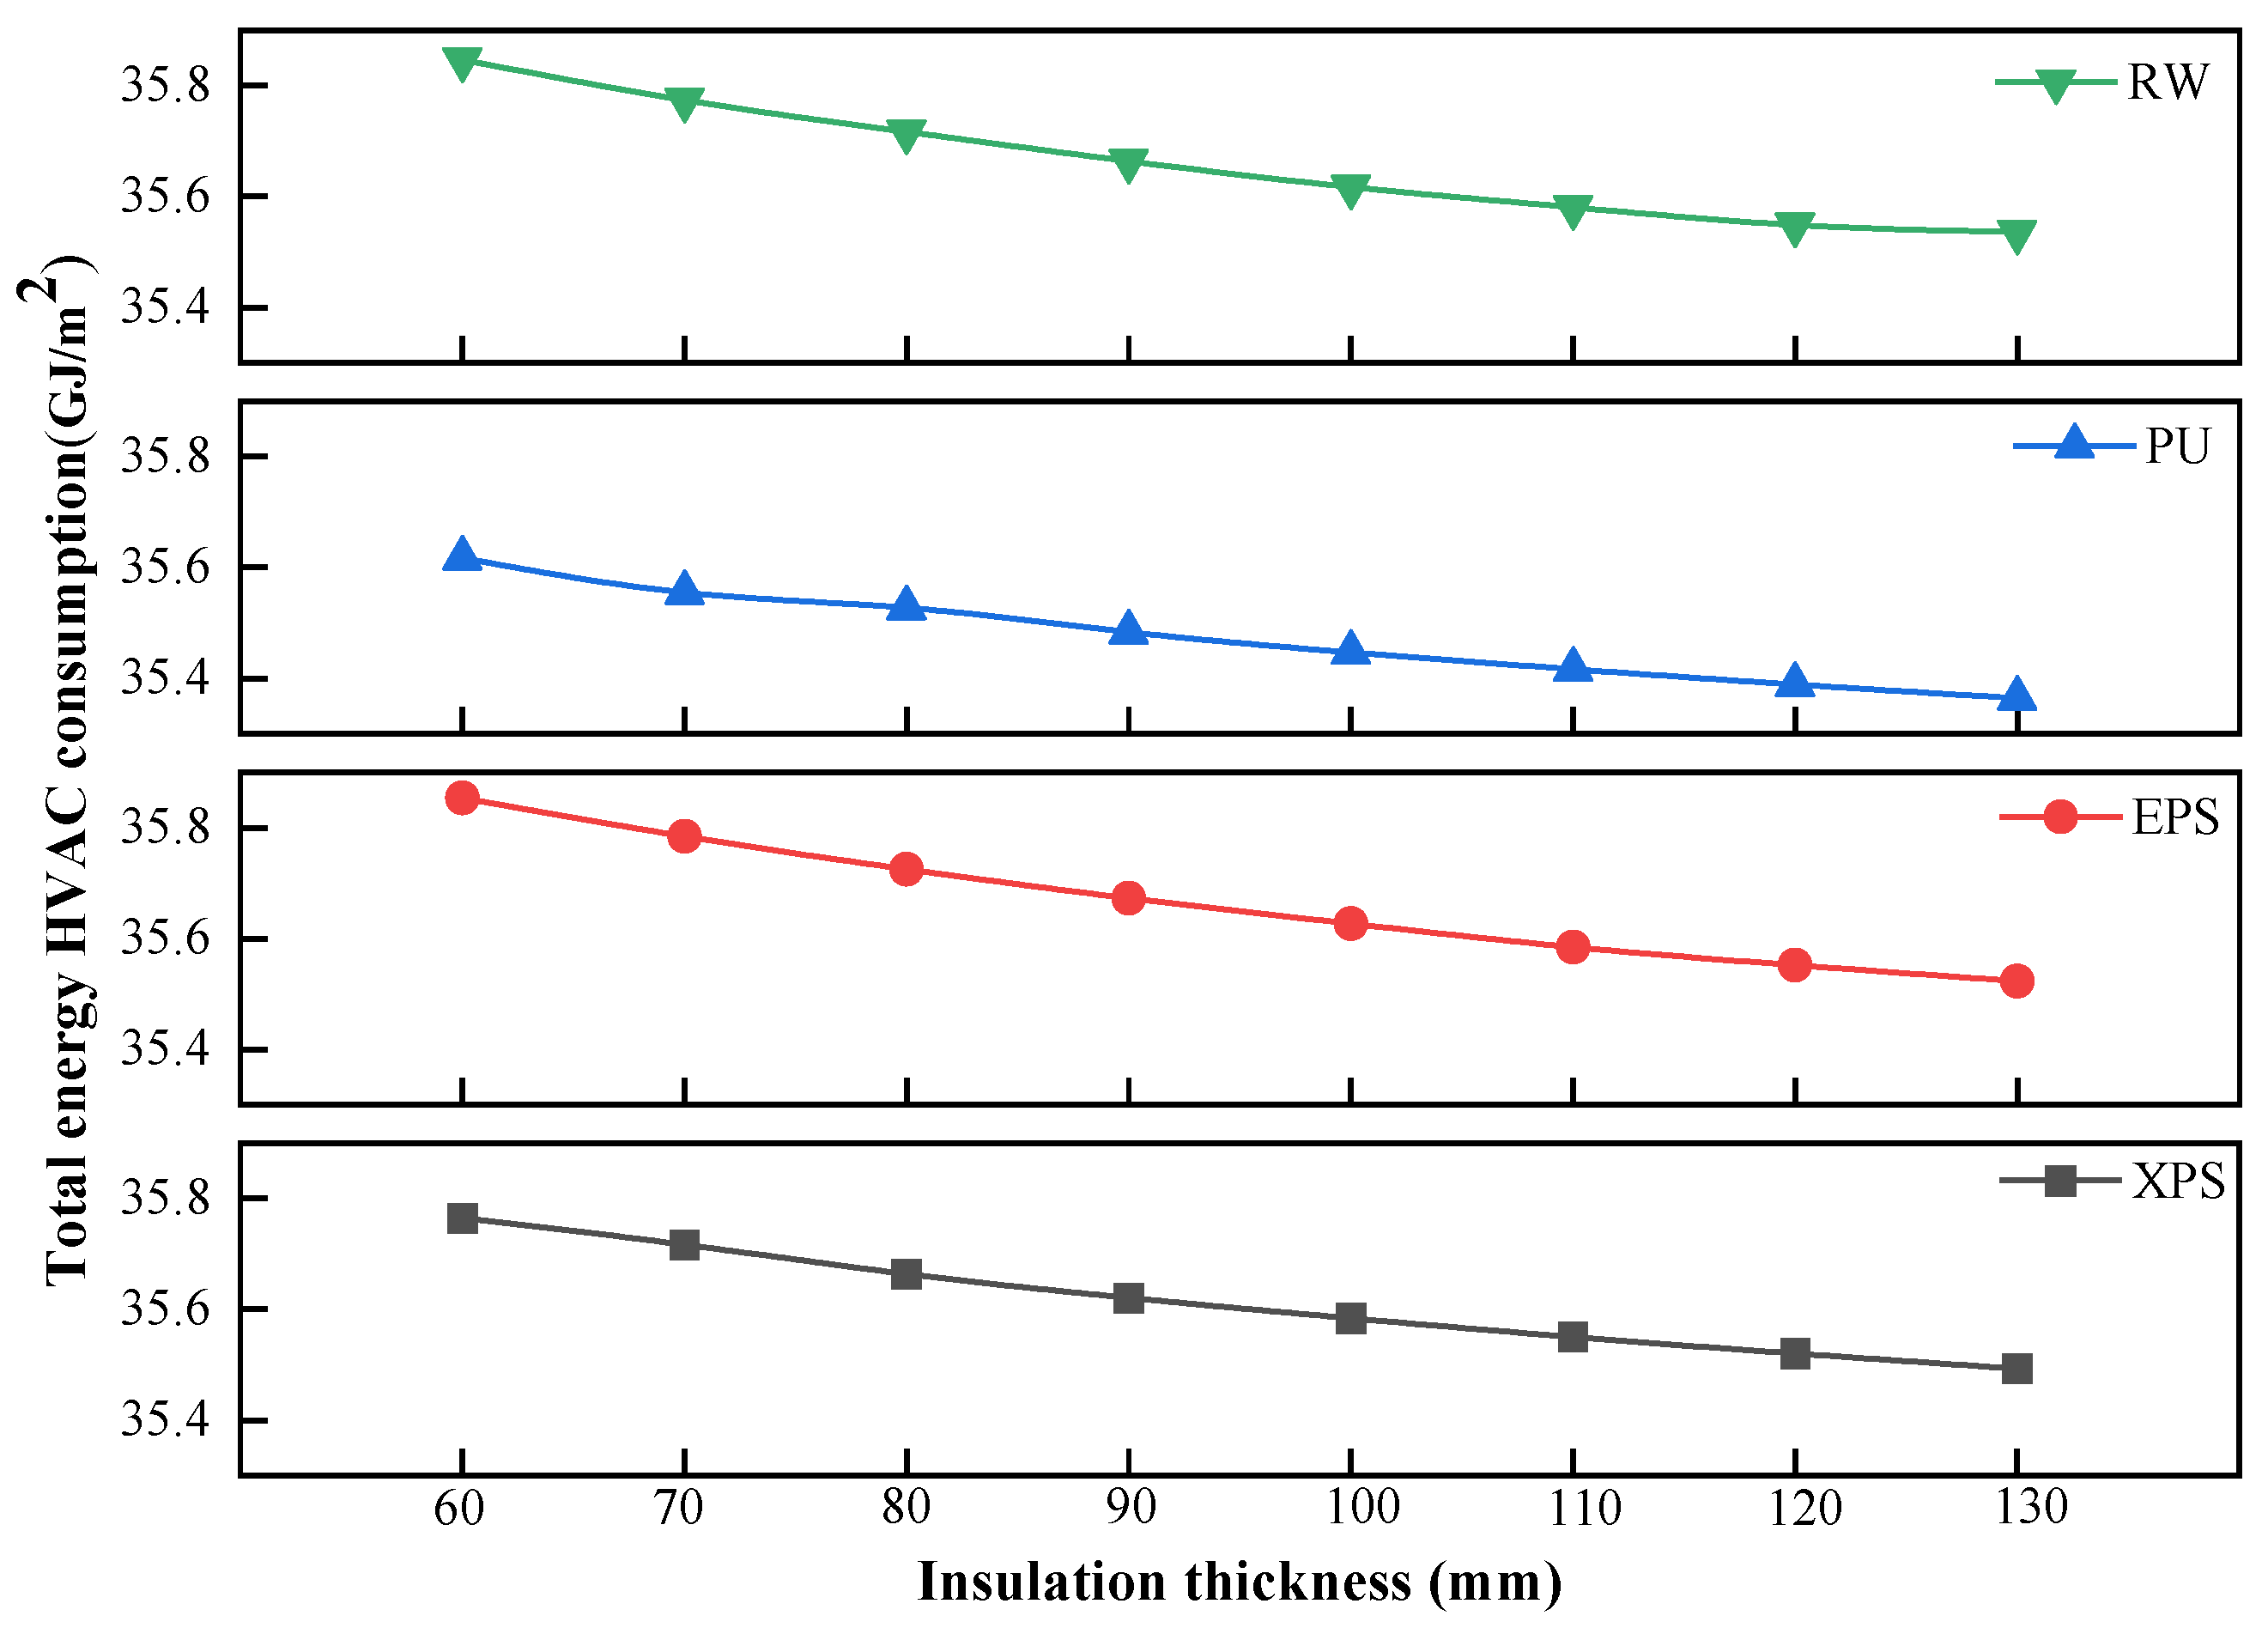
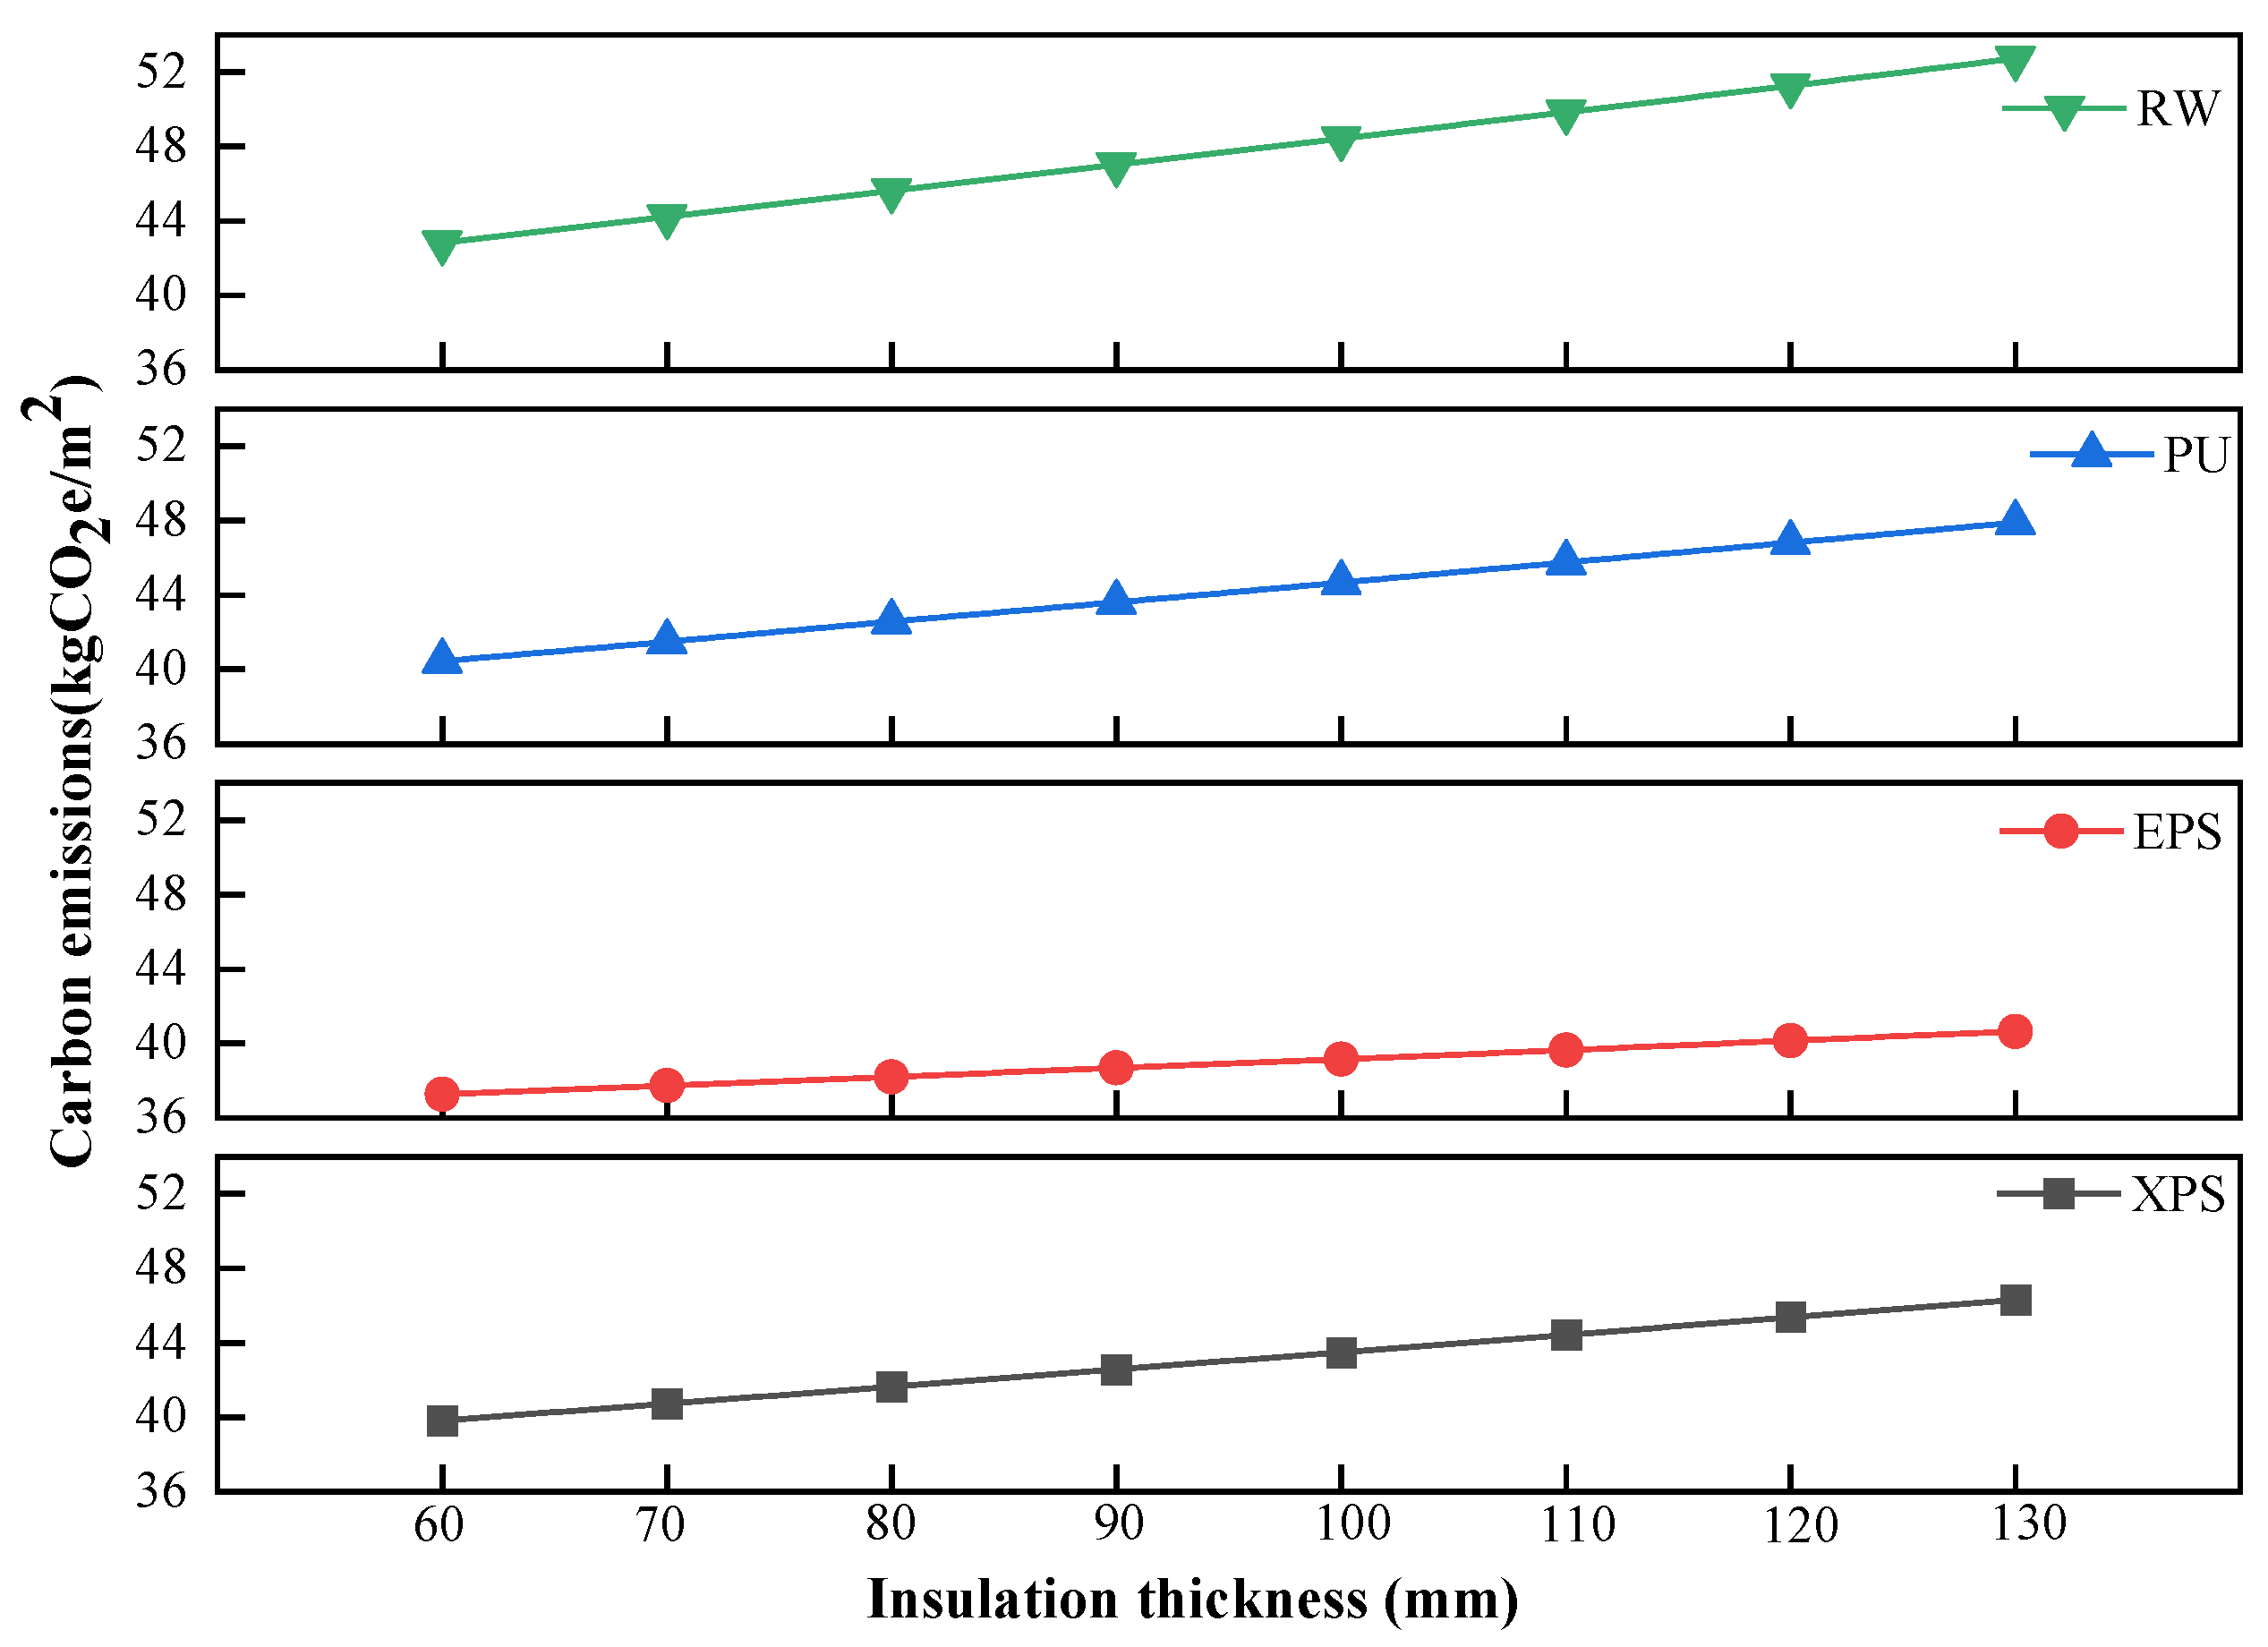
Adding insulation to external walls significantly reduces heating loads and winter energy consumption. Analyzing XPS, EPS, PU, and RW insulation materials shows that RW has the highest energy-saving potential but is minimally better than the others and costs more than twice as much. Thus, EPS and PU are more advantageous for well-performing external walls.
(2)
For regions with hot summers and cold winters, Low-E glass with a low shading coefficient and low transmittance should be more widely used. While PVC combined with Low-E glass offers the greatest potential for energy savings and emission reductions, it comes at a higher cost. Considering that cost is often the biggest constraint in design, PVC double-glazed windows with Low-E glass are recommended.
(3)
Balancing energy consumption, carbon emissions, and cost, it was found that roof insulation saves energy and reduces emissions, though XPS increases costs by 5.19%. EPS and PU materials are more advantageous for poorly performing envelopes. While EPS saves 1.62% less energy than PU, its cost savings are approximately double.
(4)
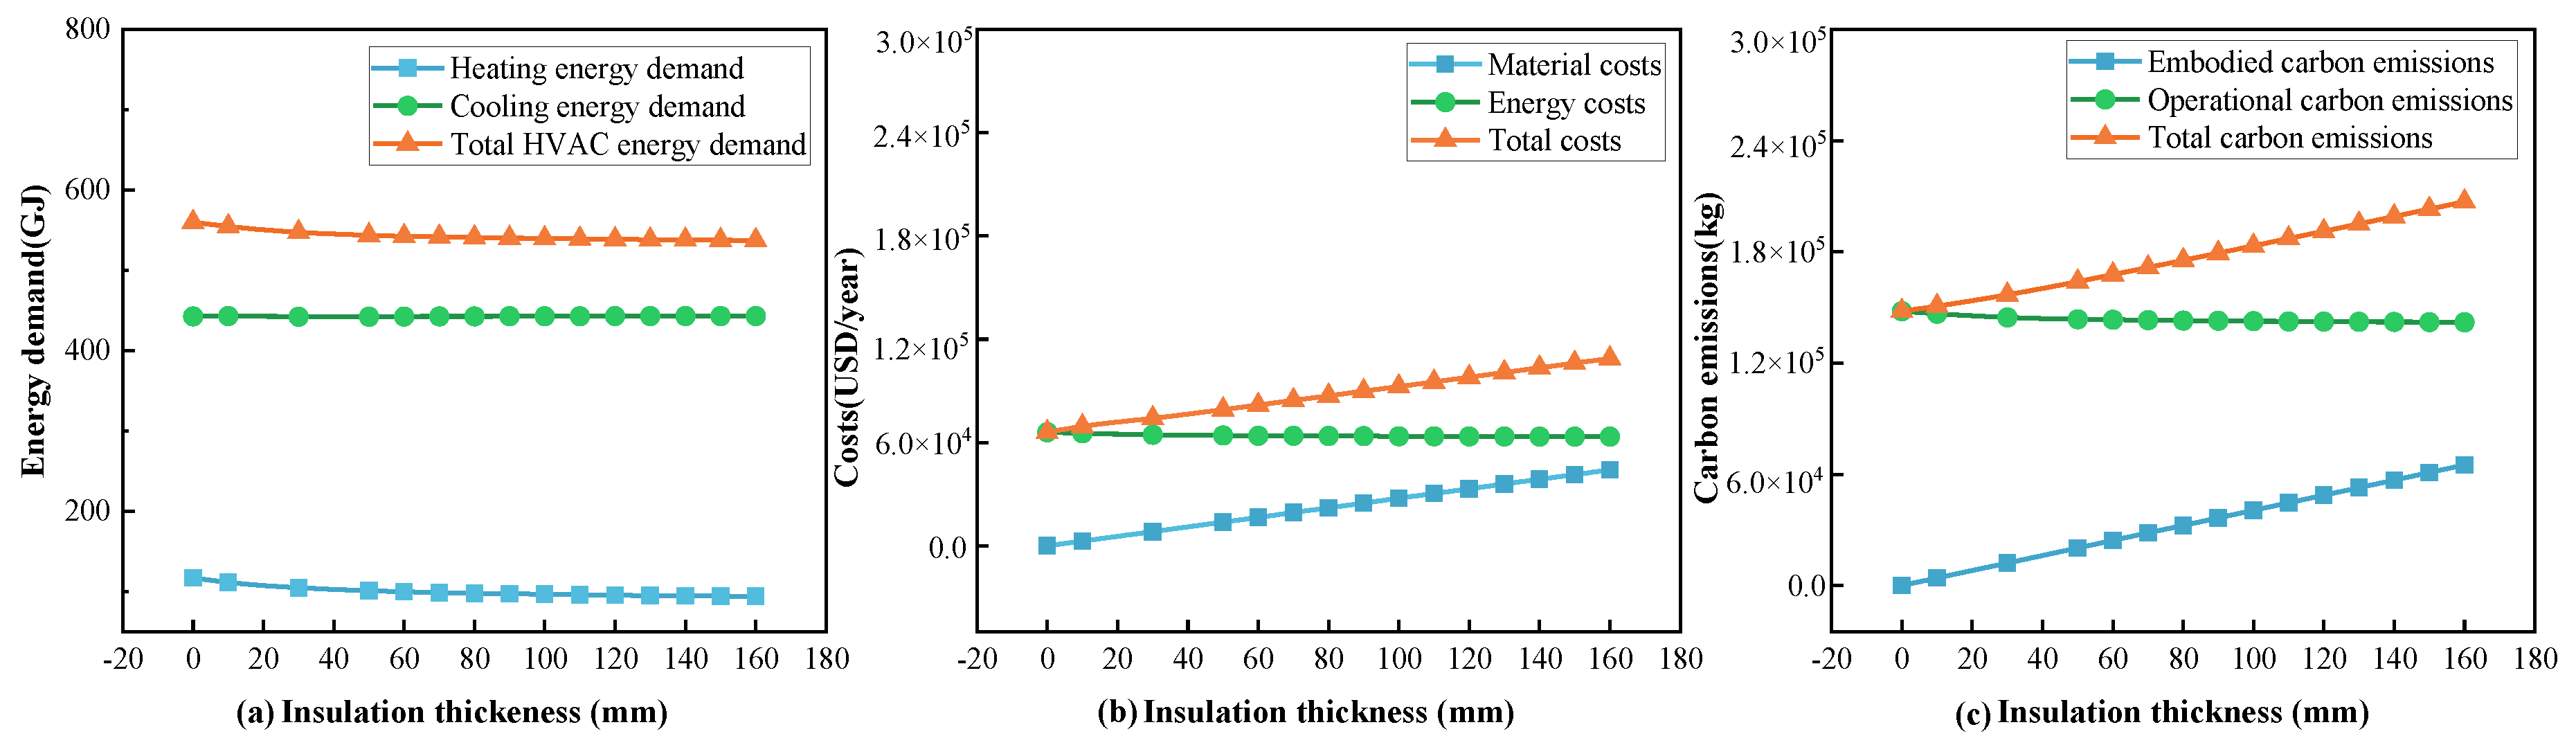
After analysis, the optimized building strategy is as follows: external walls with 164 mm EPS insulation, roof with 62 mm PU insulation, and external windows with thermal break Low-E glass. Compared to the case study building, the energy consumption is reduced by 31.79%, but carbon emissions and costs increase by 57.18% and 15.58%, respectively. It is noteworthy that this study only conducted a one-year life cycle assessment. The added insulation materials result in higher carbon emissions mainly during the material production phase, while the reduction in energy consumption and operational carbon emissions will continue throughout the building’s lifespan. Therefore, this building envelope optimization strategy can provide valuable insights for architects during the design phase.
This study developed a multi-criteria assessment model incorporating life cycle energy consumption, carbon emissions, and costs, providing a computational method and data reference for assessing the green sustainability retrofit of existing student dormitory buildings. The selected case study building in this research faces similar retrofit challenges as most existing buildings in China, where the insulation in external wall structures meets design standards. Still, there are deficiencies in the roof and window thermal conductivity. With the increasing demand for larger windows, the energy efficiency of windows should be prioritized during architectural design and renovation. Without a doubt, it is worth noting that, in advancing the sustainability of buildings, designers bear the important responsibility of balancing various criteria.

Author Contributions

F.X.: Investigation, Formal analysis, Writing—Original Draft, Software. Y.W.: Term, Conceptualization, Methodology. X.W.: Drawing, Software. X.Z.: Project administration, Funding Acquisition. All authors have read and agreed to the published version of the manuscript.

Funding

This work was supported by Hunan Provincial Natural Science Foundation Project—Provincial-City Joint Fund Project [grant number 2022JJ50037]. This work was also supported by the Scientific Research Fund of Hunan Provincial Education Department [grant number 21A0123].

Institutional Review Board Statement

Not applicable.

Informed Consent Statement

Not applicable.

Data Availability Statement

The original contributions presented in the study are included in the article, further inquiries can be directed to the corresponding author.

Conflicts of Interest

We declare that we have no financial and personal relationships with other people organizations that can inappropriately influence our work, there is no professional or other personal interest of any nature or kind in any product, service and/or company that could be construed as influencing the position presented in the manuscript entitled.

Nomenclature

Abbreviations Greek letters
CECarbon Emission δ R , k Roof thickness (mm)
CEFCarbon Emission Factor ρ E , i Exterior wall density (kg/m3)
LCALife Cycle Assessment μ R , k Roof mass energy (MJ/kg)
LCELife Cycle Energy Assessment ρ R , k Roof density (kg/m3)
LCCELife Cycle Carbon Emission Assessment δ E , i Exterior wall thickness(mm)
LCCLife Cycle Cost Assessment μ E , i Exterior wall mass energy (MJ/kg)
ESREnergy Saving Rate α Carbon emission coefficient of electricity (tCO2/MWh)
CESRCarbon Emission Saving Rate λ E , i Thermal conductivity coefficient (W/(m·K))
CSRCost Saving Rate R E , i Heat transfer coefficient (m2·K/W)
WWRWindow-to-Wall Ratio φ E , i Correction coefficient
HVACHeating, Ventilation and Air-ConditioningSubscripts
RMBRen Min Bi (Chinese Currency)sSummer
USDUnited States DollarwWinter
Symbols epLighting equipment
F(x)Objective functionmProduction stage of building material
EEnergy consumption (GJ)opThe operational phase
CCost (USD)iThe i material
CECarbon emissions (kg)optObjective function value of the optimal solution
ASurface area (m2)bcInitial function value of the building
PWFPresent value factor E , T O T A L Total energy consumption of exterior wall
gInflation rate (%) R , T O T A L Total energy consumption of roof
ILoan interest rate (%) E , i I material of exterior wall
Δ T Hourly temperature difference between indoor and outdoor (K) R , k K material of roof
RHeat transfer resistance (K/W)nyear
Nyear

References

  1. Nie, H.; Wang, L.; Tian, M. Analysis on Determinants of Carbon Emissions from Plaza Ground Paving during the Construction Stage Based on Life Cycle Assessment. Sci. Rep. 2024, 14, 136. [Google Scholar] [CrossRef]
  2. Tang, S.; Wu, C.; Liu, Y. Developing Global Health Education in Chinese Universities: Challenges and Opportunities. Lancet Reg. Health—West. Pac. 2023, 41, 100940. [Google Scholar] [CrossRef]
  3. Wang, Y. Application of Deep Learning Model in Building Energy Consumption Prediction. Comput. Intell. Neurosci. 2022, 2022, 4835259. [Google Scholar] [CrossRef] [PubMed] [PubMed Central]
  4. NBSC (National Bureau of Statistics of China). China Statistical Yearbook-2013; China Statistics Press: Beijing, China, 2013. [Google Scholar]
  5. Chi, F.; Xu, Y. Building Performance Optimization for University Dormitory through Integration of Digital Gene Map into Multi-Objective Genetic Algorithm. Appl. Energy 2022, 307, 118211. [Google Scholar] [CrossRef]
  6. Deng, Y.; Gou, Z.; Gui, X.; Cheng, B. Energy Consumption Characteristics and Influential Use Behaviors in University Dormitory Buildings in China’s Hot Summer-Cold Winter Climate Region. J. Build. Eng. 2021, 33, 101870. [Google Scholar] [CrossRef]
  7. Wen, F.; Wu, N.; Gong, X. China’s Carbon Emissions Trading and Stock Returns. Energy Econ. 2020, 86, 104627. [Google Scholar] [CrossRef]
  8. Motuzienė, V.; Čiuprinskas, K.; Rogoža, A.; Lapinskienė, V. A Review of the Life Cycle Analysis Results for Different Energy Conversion Technologies. Energies 2022, 15, 8488. [Google Scholar] [CrossRef]
  9. Cabeza, L.F.; Rincón, L.; Vilariño, V.; Pérez, G.; Castell, A. Life Cycle Assessment (LCA) and Life Cycle Energy Analysis (LCEA) of Buildings and the Building Sector: A Review. Renew. Sustain. Energy Rev. 2014, 29, 394–416. [Google Scholar] [CrossRef]
  10. Mahlan, S.; Francis, A.; Thumuganti, V.; Thomas, A.; Sadick, A.-M.; Tokede, O. An Integrated Life Cycle Assessment and Energy Simulation Framework for Residential Building Walling Systems. Build. Environ. 2024, 257, 111542. [Google Scholar] [CrossRef]
  11. Feng, G.; Chi, D.; Xu, X.; Dou, B.; Sun, Y.; Fu, Y. Study on the Influence of Window-Wall Ratio on the Energy Consumption of Nearly Zero Energy Buildings. Procedia Eng. 2017, 205, 730–737. [Google Scholar] [CrossRef]
  12. Marino, C.; Nucara, A.; Pietrafesa, M. Does Window-to-Wall Ratio Have a Significant Effect on the Energy Consumption of Buildings? A Parametric Analysis in Italian Climate Conditions. J. Build. Eng. 2017, 13, 169–183. [Google Scholar] [CrossRef]
  13. Goia, F. Search for the Optimal Window-to-Wall Ratio in Office Buildings in Different European Climates and the Implications on Total Energy Saving Potential. Sol. Energy 2016, 132, 467–492. [Google Scholar] [CrossRef]
  14. Pandey, P.R.; Dong, B. Prediction of Window Opening Behavior and Its Impact on HVAC Energy Consumption at a Residential Dormitory Using Deep Neural Network. Energy Build. 2023, 296, 113355. [Google Scholar] [CrossRef]
  15. Al-Yasiri, Q.; Alktranee, M.; Szabó, M.; Arıcı, M. Building Envelope-Enhanced Phase Change Material and Night Ventilation: Effect of Window Orientation and Window-to-Wall Ratio on Indoor Temperature. Renew. Energy 2023, 218, 119263. [Google Scholar] [CrossRef]
  16. Mangkuto, R.A.; Rohmah, M.; Asri, A.D. Design Optimisation for Window Size, Orientation, and Wall Reflectance with Regard to Various Daylight Metrics and Lighting Energy Demand: A Case Study of Buildings in the Tropics. Appl. Energy 2016, 164, 211–219. [Google Scholar] [CrossRef]
  17. Sadooghi, P. HVAC Electricity and Natural Gas Saving Potential of a Novel Switchable Window Compared to Conventional Glazing Systems: A Canadian House Case Study in City of Toronto. Sol. Energy 2022, 231, 129–139. [Google Scholar] [CrossRef]
  18. Ahmed, A.E.; Suwaed, M.S.; Shakir, A.M.; Ghareeb, A. The Impact of Window Orientation, Glazing, and Window-to-Wall Ratio on the Heating and Cooling Energy of an Office Building: The Case of Hot and Semi-Arid Climate. J. Eng. Res. 2023. [Google Scholar] [CrossRef]
  19. Hussien, A.; Khan, W.; Hussain, A.; Liatsis, P.; Al-Shamma’a, A.; Al-Jumeily, D. Predicting Energy Performances of Buildings’ Envelope Wall Materials via the Random Forest Algorithm. J. Build. Eng. 2023, 69, 106263. [Google Scholar] [CrossRef]
  20. Saboor, S.; Chelliah, A.; Gorantla, K.K.; Kim, K.-H.; Lee, S.-H.; Shon, Z.H.; Brown, R.J.C. Strategic Design of Wall Envelopes for the Enhancement of Building Thermal Performance at Reduced Air-Conditioning Costs. Environ. Res. 2021, 193, 110577. [Google Scholar] [CrossRef]
  21. Dombaycı, Ö.A. The Environmental Impact of Optimum Insulation Thickness for External Walls of Buildings. Build. Environ. 2007, 42, 3855–3859. [Google Scholar] [CrossRef]
  22. Bektas Ekici, B.; Aytac Gulten, A.; Aksoy, U.T. A Study on the Optimum Insulation Thicknesses of Various Types of External Walls with Respect to Different Materials, Fuels and Climate Zones in Turkey. Appl. Energy 2012, 92, 211–217. [Google Scholar] [CrossRef]
  23. Dardouri, S.; Mankai, S.; Almoneef, M.M.; Mbarek, M.; Sghaier, J. Energy Performance Based Optimization of Building Envelope Containing PCM Combined with Insulation Considering Various Configurations. Energy Rep. 2023, 10, 895–909. [Google Scholar] [CrossRef]
  24. Verichev, K.; Zamorano, M.; Fuentes-Sepúlveda, A.; Cárdenas, N.; Carpio, M. Adaptation and Mitigation to Climate Change of Envelope Wall Thermal Insulation of Residential Buildings in a Temperate Oceanic Climate. Energy Build. 2021, 235, 110719. [Google Scholar] [CrossRef]
  25. Luo, Y.; Cui, D.; Cheng, N.; Zhang, S.; Su, X.; Chen, X.; Tian, Z.; Deng, J.; Fan, J. A Novel Active Building Envelope with Reversed Heat Flow Control through Coupled Solar Photovoltaic-Thermoelectric-Battery Systems. Build. Environ. 2022, 222, 109401. [Google Scholar] [CrossRef]
  26. Huang, X.; Li, F.; Liu, Z.; Gao, X.; Yang, X.; Yan, J. Design and Optimization of a Novel Phase Change Photovoltaic Thermal Utilization Structure for Building Envelope. Renew. Energy 2023, 218, 119269. [Google Scholar] [CrossRef]
  27. Xu, Y.; Chen, J.; Cai, J.; Li, S.; He, Q. Simulation-Based Trade-off Modeling for Indoor Infection Risk of Airborne Diseases, Energy Consumption, and Thermal Comfort. J. Build. Eng. 2023, 76, 107137. [Google Scholar] [CrossRef]
  28. Assimakopoulos, M.-N.; De Masi, R.F.; Fotopoulou, A.; Papadaki, D.; Ruggiero, S.; Semprini, G.; Vanoli, G.P. Holistic Approach for Energy Retrofit with Volumetric Add-Ons toward nZEB Target: Case Study of a Dormitory in Athens. Energy Build. 2020, 207, 109630. [Google Scholar] [CrossRef]
  29. Razmi, A.; Rahbar, M.; Bemanian, M. PCA-ANN Integrated NSGA-III Framework for Dormitory Building Design Optimization: Energy Efficiency, Daylight, and Thermal Comfort. Appl. Energy 2022, 305, 117828. [Google Scholar] [CrossRef]
  30. Sugár, V.; Talamon, A.; Horkai, A.; Kita, M. Energy Saving Retrofit in a Heritage District: The Case of the Budapest. J. Build. Eng. 2020, 27, 100982. [Google Scholar] [CrossRef]
  31. Qu, K.; Chen, X.; Wang, Y.; Calautit, J.; Riffat, S.; Cui, X. Comprehensive Energy, Economic and Thermal Comfort Assessments for the Passive Energy Retrofit of Historical Buildings—A Case Study of a Late Nineteenth-Century Victorian House Renovation in the UK. Energy 2021, 220, 119646. [Google Scholar] [CrossRef]
  32. Chen, X.; Yang, H.; Zhang, W. Simulation-Based Approach to Optimize Passively Designed Buildings: A Case Study on a Typical Architectural Form in Hot and Humid Climates. Renew. Sustain. Energy Rev. 2018, 82, 1712–1725. [Google Scholar] [CrossRef]
  33. Lamberti, G.; Contrada, F.; Kindinis, A. Exploring Adaptive Strategies to Cope with Climate Change: The Case Study of Le Corbusier’s Modern Architecture Retrofitting. Energy Build. 2024, 302, 113756. [Google Scholar] [CrossRef]
  34. Asdrubali, F.; Grazieschi, G. Life Cycle Assessment of Energy Efficient Buildings. Energy Rep. 2020, 6, 270–285. [Google Scholar] [CrossRef]
  35. Zhan, J.; He, W.; Huang, J. Comfort, Carbon Emissions, and Cost of Building Envelope and Photovoltaic Arrangement Optimization through a Two-Stage Model. Appl. Energy 2024, 356, 122423. [Google Scholar] [CrossRef]
  36. Jami, S.; Forouzandeh, N.; Zomorodian, Z.S.; Tahsildoost, M.; Khoshbakht, M. The Effect of Occupant Behaviors on Energy Retrofit: A Case Study of Student Dormitories in Tehran. J. Clean. Prod. 2021, 278, 123556. [Google Scholar] [CrossRef]
  37. Moazzen, N.; Karagüler, M.E.; Ashrafian, T. Comprehensive Parameters for the Definition of Nearly Zero Energy and Cost Optimal Levels Considering the Life Cycle Energy and Thermal Comfort of School Buildings. Energy Build. 2021, 253, 111487. [Google Scholar] [CrossRef]
  38. Roberti, F.; Oberegger, U.F.; Lucchi, E.; Troi, A. Energy Retrofit and Conservation of a Historic Building Using Multi-Objective Optimization and an Analytic Hierarchy Process. Energy Build. 2017, 138, 1–10. [Google Scholar] [CrossRef]
  39. Sharif, S.A.; Hammad, A. Simulation-Based Multi-Objective Optimization of Institutional Building Renovation Considering Energy Consumption, Life-Cycle Cost and Life-Cycle Assessment. J. Build. Eng. 2019, 21, 429–445. [Google Scholar] [CrossRef]
  40. Su, X.; Huang, Y.; Chen, C.; Xu, Z.; Tian, S.; Peng, L. A Dynamic Life Cycle Assessment Model for Long-Term Carbon Emissions Prediction of Buildings: A Passive Building as Case Study. Sustain. Cities Soc. 2023, 96, 104636. [Google Scholar] [CrossRef]
  41. Ashrafian, T. Enhancing School Buildings Energy Efficiency under Climate Change: A Comprehensive Analysis of Energy, Cost, and Comfort Factors. J. Build. Eng. 2023, 80, 107969. [Google Scholar] [CrossRef]
  42. Kadrić, D.; Aganović, A.; Kadrić, E. Multi-Objective Optimization of Energy-Efficient Retrofitting Strategies for Single-Family Residential Homes: Minimizing Energy Consumption, CO2 Emissions and Retrofit Costs. Energy Rep. 2023, 10, 1968–1981. [Google Scholar] [CrossRef]
  43. Rosso, F.; Ciancio, V.; Dell’Olmo, J.; Salata, F. Multi-Objective Optimization of Building Retrofit in the Mediterranean Climate by Means of Genetic Algorithm Application. Energy Build. 2020, 216, 109945. [Google Scholar] [CrossRef]
  44. Wang, C.; Kilkis, S.; Tjernström, J.; Nyblom, J.; Martinac, I. Multi-Objective Optimization and Parametric Analysis of Energy System Designs for the Albano University Campus in Stockholm. Procedia Eng. 2017, 180, 621–630. [Google Scholar] [CrossRef]
  45. Zhao, L.; Guo, C.; Chen, L.; Qiu, L.; Wu, W.; Wang, Q. Using BIM and LCA to Calculate the Life Cycle Carbon Emissions of Inpatient Building: A Case Study in China. Sustainability 2024, 16, 5341. [Google Scholar] [CrossRef]
  46. GB 50189-2015; Design Standard for Energy Efficiency of Public Buildings. Ministry of Housing and Urban-Rural Development of the People’s Republic of China: Beijing, China, 2015.
  47. Buratti, C.; Moretti, E.; Belloni, E.; Cotana, F. Unsteady Simulation of Energy Performance and Thermal Comfort in Non-Residential Buildings. Build. Environ. 2013, 59, 482–491. [Google Scholar] [CrossRef]
  48. Pan, Y. Building Energy Simulation Handbook; Chinese Architecture Publishing & Media Co., Ltd.: Beijing, China, 2013; Volume 43, p. 11. [Google Scholar]
  49. Xu, W. Study on the Correlation between Occupancy Characteristic and Air Conditioning Behavior during Cooling Season of College Students’ Dormitory in Chongqing. Master’s Thesis, Chongqing University, Chongqing, China, 2022. [Google Scholar]
  50. Feng, G.; Chen, F.; Chang, S. Multi-objective optimization of envelope structure for near zero energy building. J. Shenyang Jianzhu Univ. (Nat. Sci.) 2023, 39, 699–706. [Google Scholar] [CrossRef]
  51. Liu, M. Optimization Study on Energy Efficiency Technologies of High-Rise Residental in Xi’an Based on Simulation Technique. Master’s Thesis, Xi’an University of Architecture and Technology, Xi’an, China, 2020. [Google Scholar]
  52. State Grid Zhejiang Electric Power Co., Ltd. Available online: https://www.zj.sgcc.com.cn/p1/index.html (accessed on 11 March 2024).
  53. Xie, F.; Wu, Y.; Zhou, X.; Zhang, S. Analysis of Standard Unit Carbon Emission and Cost Assessment of the Changing Building Envelope over Material Production Phase. Sci. Total Environ. 2024, 928, 172382. [Google Scholar] [CrossRef] [PubMed]
  54. GB/T 51366-2019; Building Carbon Emission Calculation Standard. Ministry of Housing and Urban-Rural Development of the People’s Republic of China: Beijing, China, 2019.
  55. Mao, C.; Tao, X.; Yang, H.; Chen, R.; Liu, G. Real-Time Carbon Emissions Monitoring Tool for Prefabricated Construction: An IoT-Based System Framework. In Proceedings of the International Conference on Construction and Real Estate Management 2018, Charleston, SC, USA, 9–10 August 2018; American Society of Civil Engineers: Reston, VA, USA, 2018; pp. 121–127. [Google Scholar]
  56. GB 50176-2016; Code for Thermal Design of Civil Buildings. Ministry of Housing and Urban-Rural Development of the People’s Republic of China: Beijing, China, 2016.
  57. Su, X. Life Cycle Inventory Comparison of Different Building Insulation Materials and Uncertainty Analysis. J. Clean. Prod. 2016, 112, 275–281. [Google Scholar] [CrossRef]
  58. Ma, L.; Jiang, Q.; Zhao, C. Life Cycle Assessment of Typical Rock Wood Board Production in China. J. Wuhan Univ. Technol. 2013, 35, 43–47. [Google Scholar] [CrossRef]
  59. Huang, J. Research on Comparative of Carbon Emissions during the Life Cycle of External Wall Insulation Systems in Cold Regions. Master’s Thesis, Xi’an University of Architecture and Technology, Xi’an, China, 2024. [Google Scholar]
  60. GB/T 51350-2019; Technical Standard for Near Zero Energy Buildings. Ministry of Housing and Urban-Rural Development of the People’s Republic of China: Beijing, China, 2019.
  61. Zhang, L.; Liu, Z.; Hou, C.; Hou, J.; Wei, D.; Hou, Y. Optimization Analysis of Thermal Insulation Layer Attributes of Building Envelope Exterior Wall Based on DeST and Life Cycle Economic Evaluation. Case Stud. Therm. Eng. 2019, 14, 100410. [Google Scholar] [CrossRef]
  62. Shadram, F.; Bhattacharjee, S.; Lidelöw, S.; Mukkavaara, J.; Olofsson, T. Exploring the Trade-off in Life Cycle Energy of Building Retrofit through Optimization. Appl. Energy 2020, 269, 115083. [Google Scholar] [CrossRef]
  63. Fu, M. Fundamental Research on Prefabricated Residential Building Envelope Based on Thermodynamic Method. Master’s Thesis, Hunan University, Changsha, China, 2018. [Google Scholar]
Figure 1. Research flowchart.
Sustainability 16 06172 g001
Figure 2. Geographical location of the dormitory building case study.
Sustainability 16 06172 g002
Figure 3. Temperature map of the Changsha area in 2023.
Sustainability 16 06172 g003
Figure 4. Annual humidity map of Changsha in 2023.
Sustainability 16 06172 g004
Figure 5. Case building diagram.
Sustainability 16 06172 g005
Figure 6. Dormitory model and interior diagram of a standard unit.
Sustainability 16 06172 g006
Figure 7. Relationship between the thickness of insulation material and unit energy consumption.
Sustainability 16 06172 g007
Figure 8. Relation between the thickness of insulation material and unit cost.
Sustainability 16 06172 g008
Figure 9. Relation between the thickness of insulation material and unit carbon emissions.
Sustainability 16 06172 g009
Figure 10. Multivariate analysis of XPS materials in exterior walls.
Sustainability 16 06172 g010
Figure 11. Optimal thickness saving rate of different insulation materials.
Sustainability 16 06172 g011
Figure 12. Relationship between the optimum thickness of different insulation materials and thermal conductivity.
Sustainability 16 06172 g012
Figure 13. Life cycle energy consumption, carbon emission, and cost analysis of different window structures.
Sustainability 16 06172 g013
Figure 14. Analysis of the saving rate of different window constructions.
Sustainability 16 06172 g014
Figure 15. Relation between XPS material thickness and energy consumption, cost, and carbon emission.
Sustainability 16 06172 g015
Figure 16. Relation between EPS material thickness and energy consumption, cost, and carbon emission.
Sustainability 16 06172 g016
Figure 17. Relationship between PU material thickness and energy consumption, cost, and carbon emission.
Sustainability 16 06172 g017
Figure 18. Optimal material thickness saving rates.
Sustainability 16 06172 g018
Figure 19. Evaluation of three building objectives after the improvement of the envelope structure.
Sustainability 16 06172 g019
Table 1. Building parameters of the case study.
ParameterValueUnit
Stories6/
Building total height21m
Window opening area583.92m2
Gross roof area702.24m2
Gross wall area2210.40m2
Gross total area4213.44m2
Gross area of typical floor702.24m2
Floor height3m
Gross window-to-wall ratio26.42%
Table 2. Structure and thermal conductivity of the exterior envelope of the case study.
Envelope StructureThickness and Material of Each Layer (From Outside to Inside)Thermal Conductivity K
[W/(m·K)]
Roof50 mm C20 concrete + 6 mm waterproof coil + 10 mm cement mortar + 120 mm reinforced concrete roof panel + 10 mm cement mortar3.376
WindowAluminum alloy ordinary hollow window4.2
Wall2 mm paint + 5 mm cement mortar + 200 mm concrete block0.965
Table 3. Operation times of air conditioners in the winter and summer in Changsha, Hunan Province.
Open DateOpening Time
Spring Semester (Summer)1 July–15 August12:00 a.m.–14:00 p.m./18:30 p.m.–8:00 a.m.
Summer Semester (Winter)1 December–15 January12:00 a.m.–14:00 p.m./18:30 p.m.–8:00 a.m.
Table 4. Hourly occupancy rate of the hostel staff (%).
Time and Room Ratio
Time123456789101112
Room ratio100%100%100%100%100%100%100%50%20%20%20%50%
Time131415161718192021222324
Room ratio100%100%20%20%50%50%70%70%70%90%100%100%
Table 5. Detailed data of air conditioning in the summer and winter.
SummerWinter
Cooling Capacity
(W)
Cooling Power
(W)
Cooling Energy Consumption RatioHeating Capacity
(W)
Heating Power (W)Heating Energy Consumption Ratio
350010803.28385011203.44
Note: Data source is from State Grid Zhejiang Electric Power Co., Ltd. (Hangzhou, China) [52].
Table 6. Different types of window construction and cost.
TypeThickness (mm)Costs
(USD/m2)
OrdinaryAluminium alloy plate glass window3 + 6A + 366.14
RetrofittedBroken heat aluminum alloy hollow glass window3 + 12A + 3110.23
Low-E insulating glass window of aluminum alloy5 + 12A + 380.83
PVC plastic steel Low-E hollow glass window5 + 12A + 3124.92
PVC plastic steel hollow glass window3 + 12A + 380.83
Note: (1) Take an ordinary window as an example, the thickness of 3 + 6A + 3 means the composition of the glass is 3 mm flat glass + 6 mm air + 3 mm flat glass from the outside to the inside. (2) The cost unit of the window is USD/m2, because the purchase of windows in China is charged based on the unit square area of the window.
Table 7. Carbon emission factors and prices of windows and glass.
StructureTypeCarbon Emission Factor (kg CO2 e/m2)
WindowAluminum–wood composite window147
Broken hot aluminum alloy window254
PVC plastic steel window121
GlassOrdinary insulating glass15.6
Insulating glass23.45
Low-E glass24.12
Table 8. Basic data of the materials.
TypeThermal Conductivity
([W/(m·K)])
Energy Consumption
(MJ/kg)
Density
(kg/m3)
Carbon Emission Factor
(kg CO2 e/t)
EPS0.041102.918~225020
PU0.02487.3405220
RW0.0437.81401980
XPS0.0385.4306120
Note: The statistics are derived from the “Code for Thermal Design of Civil Buildings”(GB 50176-2016 [56]), and the energy consumption of EPS, PU, and XPS is from the study by Xing Su et al. [57], while the energy consumption of RW is from the research by Liping Ma et al. [58]; the carbon emission factor data for EPS, PU, and RW are from the “Building Carbon Emission Calculation Standard” (GB/T 51366-2019 [54]); and the carbon emission factor for XPS is from the study by Jinyu Huang et al. [59].
Table 9. Limits of heat transfer coefficients of typical urban outer envelope structures in hot summer and cold winter climates in China.
Climatic RegionThermal Conductivity/[W/(m·K)]
Exterior WallRoofExterior Window
Hot summer and cold winter zone0.15~0.400.15~0.35≤2.0
Table 10. Heat transfer resistance of the building envelope inside and outside.
Ri([(m2·K)/W])Re ([(m2·K)/W])
/SummerWinter
0.110.050.04
Table 11. Design thickness of the external wall and roof insulation materials.
Exterior WallExterior Roof
TypeInitial Thickness
(mm)
Thickness Interval
(mm)
Thickness Replacement
(mm)
Initial Thickness
(mm)
Thickness Interval
(mm)
Thickness Replacement
(mm)
XPS5050–160208080–19010
EPS6060–22020110110–26010
PU4040–130207070–15010
RW5030–20020///
Table 12. Optimal thickness selection of the external wall insulation materials.
TypeRelationR2Limit Thickness
(mm)
Specification Range
(mm)
Optimum Thickness
(mm)
XPSy = 0.0012x2 − 0.3117x + 557.9196.79%130[40,165]130
EPSy = 0.0007x2 − 0.23x + 556.9495.57%164[55,226]164
PUy = 0.002x2 − 0.4057x + 557.795.64%101[32,132]101
RWy = 0.0006x2 − 0.2284x + 556.895.06%190[54,220]190
Note: Limit thickness means the maximum thickness of the insulation material that can be selected, specification range means a thickness range that meets the requirements of the specification, optimum thickness means that the maximum thickness of the insulation material is met at the same time, and the thickness is within the specification range.
Table 13. Optimum thickness of the insulation material under multiple targets.
XPS (mm)EPS (mm)PU (mm)
Life Cycle Energy Assessment177.7385.60116.01263.99199.4259.91
Life Cycle Carbon Emissions Assessment64.87178.8896.94237.9942540.21
Life Cycle Cost Assessment2425468.66309.2021.10211.44
Optimal thickness17923862
Table 14. Data of the energy consumption, carbon emission, and cost in the whole life cycle after improvement.
Configuration of Envelope StructureLife Cycle Energy Assessment
(GJ)
Life Cycle Carbon Emissions Assessment (×103 kg CO2e)Life Cycle Costs Assessment
(×103 USD)
Ordinary/560.08165.24104.57
Retrofit-1Wall (164 mm EPS) + window (DRLow-E) + roof (62 mm PU)381.99259.73120.86
Retrofit-2Wall (55 mm EPS) + window (DRLow-E) + roof (62 mm PU)391.84238.16121.98
Disclaimer/Publisher’s Note: The statements, opinions and data contained in all publications are solely those of the individual author(s) and contributor(s) and not of MDPI and/or the editor(s). MDPI and/or the editor(s) disclaim responsibility for any injury to people or property resulting from any ideas, methods, instructions or products referred to in the content.

