Abstract
The hydrochemical characteristics of rivers are affected by many natural factors, such as the nature of watershed bedrock, watershed environment, vegetation, and human activities. Examining the hydrochemistry of a river can provide insights into the baseline hydrological conditions, the geochemical environment, and the overall water quality of the river. In order to examine the hydrochemical characteristics and controlling factors of the water in the Mingyong River, a total of 154 water samples were gathered from the glacier meltwater, midstream, and downstream regions. Firstly, the findings revealed that the dominant cations are Ca2+ and Mg2+, while the dominant anions are HCO3− and SO42−. The mass concentration order of cations is Ca2+ > Mg2+ > Na+ > K+, and for anions, it is HCO3− > SO42− > NO3− > Cl−. The average concentration of TDS in the river water is 81.69 mg·L−1, with an average EC of 163.63 μs·cm−1 and an average pH of 8.99. Temporal variations in ion concentrations exhibit significant disparities between the glacier melting and accumulation periods. High ion concentration values are primarily observed during the glacier accumulation period, while values decrease during the glacier melting period due to increased precipitation. The river water in the study region is categorized as (HCO3− + SO42−)-(Ca2+ + Mg2+) type. Secondly, the Pearson correlation analysis indicates clear relationships between different parameters, indicating that the major ions were mostly influenced by materials from the Earth’s crust. The primary principal source of solutes in the water of the Mingyong River is rock weathering. The cations and anions present in the river water are derived from the breakdown of carbonate rocks and the dissolving of substances from silicate rocks. However, the influence of carbonate rocks is more significant compared to that of silicate rocks. Finally, the Mingyong River water is suitable for agricultural irrigation with minimal land salinization damage, making it appropriate for agricultural purposes but not suitable for people and animals to drink from directly.
1. Introduction
Water is an indispensable element of the Earth’s ecology, playing a vital role in supporting the survival of both people and other living species [1,2]. The study of the environmental changes in river water is a prominent area of research in hydrogeology and environmental geography. The main focus is on analyzing the spatial and temporal changes in the chemical properties of natural water bodies, identifying different zones of river water chemistry, and comprehending diverse hydrogeochemical processes. The objective is to analyze and forecast the geochemical changes that occur in river systems throughout time [3,4,5,6]. To comprehend the comprehensive trend of river water chemistry evolution, it is necessary to examine the hydrochemical evolution patterns of natural water bodies in various geological settings. This facilitates the acquisition of further knowledge regarding the effects of natural phenomena and human actions on the water ecosystem. The rational analysis of diverse hydrogeochemical phenomena is an emerging trend in the progression of river water habitats [7,8,9]. In his study of the Siberian River Basin, Savichev pointed out that hydrological parameters can directly affect the water chemistry of the river water [10]. The unique hydrochemical properties and changes in natural water bodies on the Qinghai–Tibet Plateau are a result of its special geographical environment and human activities, with the relatively complete original state being preserved. However, the region has experienced drastic changes in its hydrogeochemical environment and hydrochemical properties due to the continuous increase in human economic activities. Tian et al. discussed regional differences and provided examples of water chemical characteristics by collecting, analyzing, and measuring water samples from natural water bodies in the western, southern, and northeastern border areas of the Qinghai-Tibet Plateau, where human activities are concentrated [11]. Glacierized areas offer a perfect setting for studying the interaction between water and rocks, as the rates of chemical weathering are great, and human influences are usually negligible. The discharge of glacial meltwater plays a vital role in facilitating the chemical material cycle originating from glaciers. Studying the hydrochemical properties and patterns of changes in glacialized regions allows us to uncover the processes of the hydrogeochemical cycle of materials. This, in turn, establishes a foundation for comprehending and elucidating the consequences of glacial melting on the natural environment and human existence [12,13].
The Meili Snow Mountains are located in the Hengduan Mountain area on the southeastern edge of the Qinghai–Tibet Plateau, which has the most undulating terrain in Southwest China. The Mingyong Glacier, situated on the eastern slope of Meili Snow Mountains, spans a length of 11.7 km, with an approximate area of 13 km2. It is the lowest elevation of the typical monsoon temperate glacier at the end of the ice tongue in the Hengduan Mountain area, and it is also the largest, longest, and lowest elevation valley glacier in Yunnan Province [14,15]. In 1981, the comprehensive scientific expedition team of the Chinese Academy of Sciences conducted some investigation and research into the Meili Snow Mountains region, including a short-term study on the hydrochemical characteristics of the Mingyong River.
The elements released by surface rocks during various evolutionary processes are the primary sources of the hydrochemical composition of glacial meltwater runoff. The interaction between meltwater from ice and snow with soil and rocks, along with the influence of different lithologies, causes regional differences in hydrochemistry. So, what are the scientific questions researchers are trying to figure out? (i) Under the background of global climate change, what are the variation characteristics of cations and anions in the natural water body of Mingyong River in Meili Snow Mountains? (ii) What are the controlling factors of hydrochemical characteristics of the water in Mingyong River at the Meili Snow Mountains? (iii) Is the water of Mingyong River suitable for irrigation and drinking? These questions are worthy of an in-depth study.
2. Materials and Methods
2.1. Study Area
The Mingyong River Basin (98°41′–98°51′ E, 28°23′–28°29′ N) originates from the Mingyong Glacier in the Meili Snow Mountains range (Figure 1). It is a typical glacier-fed river in the southwestern region of China. The meltwater from the Mingyong Glacier flows into the Mingyong River, which is one of the important tributaries of the Lancang River. More than 300 local residents rely on the Mingyong River as their primary water source for agricultural irrigation when it converges with the Lancang River. The Meili Snow Mountains, situated in a region with substantial changes in altitude and a low latitude, display several vertical climate zones within the research area [16]. In mountainous regions, temperatures decline as the altitude increases, with the most significant decrease observed during the summer. From 1990 to 2020, the average temperature was 6.02 °C, and the average precipitation was 798.95 mm in the Meili Snow Mountains. Over the years, there has been a significant decreasing trend in precipitation at a rate of 41.19 mm/10 years. The main source of water vapor is influenced by the Indian Ocean [17]. Furthermore, the monsoon period from June to September is the rainy season for the study area and also the main period of glacier and snow melt in the region. From October to May of the following year, the non-monsoon period, is the accumulation period for glaciers [18]. The Mingyong Glacier had a broad and flat snow basin, beneath which multiple tiers of icefalls and ice terraces with numerous crevasses were formed. Some of the ice and snow from the northern snow basin spilled over the eastern ridge saddle, creating a hanging glacier suspended on the upper part of the steep cliff [19]. The studied region predominantly consisted of limestone, along with glacial moraine debris generally constituted of easily eroded minerals such as muscovite granite, calcareous sandstone, tuff, and limestone. These factors add to the amount of silt carried by the river and enhance its mineral content. The river is replenished by the melting of snow on the slopes during the spring thaw and by the runoff of precipitation in the glacial melt zone and on the slopes [15,19,20].
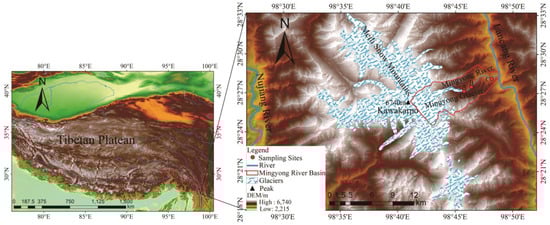
Figure 1.
Schematic diagram of sampling points in the Mingyong River Basin of Meili Snow Mountains. DEM data from the geospatial data cloud: http://www.gscloud.cn (accessed on 3 January 2024) and the glacier boundary date from a dataset of glacier inventory in Western China during 2017–2018). Point A, glacial meltwater); B, midstream river water; and C, (downstream river water).
2.2. Sample Collection and Analysis Methods
Based on through investigations and preliminary research findings of the Mingyong River, comprehensive consideration was given to factors such as surface topography, rock composition, soil characteristics, and distribution of vegetation within the glacier. Subsequently, rational monitoring and sampling points were established in the Mingyong River Basin [21]. The water samples from the Mingyong River were primarily collected from the meltwater runoff at the terminus of the Mingyong Glacier (near point A in Figure 2; latitude and longitude, 28.45° N, 98.76° E; altitude, 2821 m), the midstream water (near point B in Figure 2; latitude and longitude, 28.46° N, 98.77° E; altitude, 2556 m), and the downstream water (near point C in Figure 2; latitude and longitude, 28.46° N, 98.80° E; altitude, 2245 m) of the Mingyong River. The location information of the above sampling points is shown in Table 1. Efforts were made to reduce sample contamination during field sampling and sample processing. The water samples were selected from the river at a depth of 10–15 cm below the water surface. Sampling was conducted using 60 mL polyethylene plastic bottles that had been pre-cleaned with distilled water. Before sampling, the polyethylene bottles were cleaned three times with the collected river water. In the field, the gathered samples were placed in a refrigerated container at approximately 4 °C to decelerate chemical and physical reactions. Subsequently, they were sent to the laboratory for testing. Two bottles of the same type of sample were collected, one for the determination of water chemistry and other parameters, and one for reserve. During the sampling process, we used a handheld GPS to locate the longitude, latitude, and height of the sampling point.
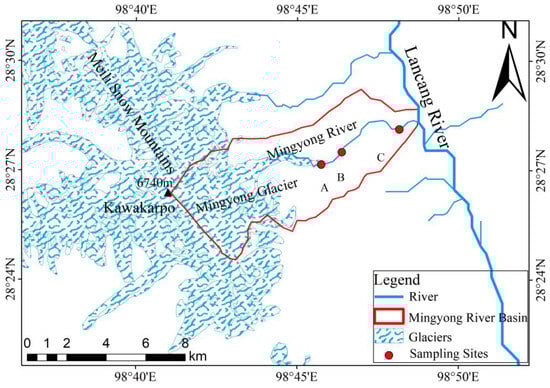
Figure 2.
The Mingyong River Basin (data from the geospatial data cloud: http://www.gscloud.cn (accessed on 3 January 2024)).

Table 1.
List of the sampling sites and sample information.
In this study, continuous sampling was conducted over a hydrological year, from 7 August 2021 to 7 August 2022. The glacial meltwater, midstream river water, and downstream river water are all sampled once a week. A total of 154 water samples were obtained in the Mingyong River Basin. Specifically, 45 samples were taken from the meltwater runoff near the terminal of the Mingyong Glacier, while 54 and 55 samples were obtained from the middle and downstream of the Mingyong River water, respectively. The variation in sample collection from the three types of water bodies is attributed to the occurrence of severe snowfall or avalanches in the study location during winter, rendering it impracticable to gather the glacier terminus meltwater flow and the midstream river water.
The collected river-water samples were tested in the State Key Laboratory of Cryospheric Sciences at the Northwest Institute of Eco-Environment and Resources, Chinese Academy of Sciences. The key indicators for testing included pH value, electrical conductivity (EC), total dissolved solids (TDS), and concentrations of cations (including Na+, K+, Ca2+, Mg2+, and NH4+) and anions (including Cl−, NO3−, SO42−, and F−). The pH values were measured using the UB-7 pH meter from the Germany Sartorius Scientific Instruments, Co., Ltd. Beijing branch (Beijing, China), with a measurement precision of 0.001 and an error margin of ±0.002. TDS and EC were measured using the CON 510 benchtop conductivity meter from the Malaysia Eutech/Oakton Instruments Limited Company (Malaysia), with a measurement accuracy of up to 0.001 μs·cm−1 and an error of less than ±0.5%. The concentrations of cations (Na+, K+, Ca2+, and Mg2+,) were measured using the DX 320 ion chromatograph from the Thermo Fisher Technology (China) Co., Ltd. (Shanghai, China). The concentrations of anions (Cl−, NO3−, and SO42−) were measured using the ICS-1500 ion chromatograph from the Thermo Fisher Technology (China) Co., Ltd. (Shanghai, China), with an accuracy of ng·g−1 and an error of less than 5%. Due to the lack of direct measurement of concentration of HCO3−, its value in the river water was estimated through ionization equilibrium [22,23,24]. Furthermore, a descriptive statistical analysis was performed on the main ions, TDS, EC, and pH of the samples. The Piper trilinear diagram was employed to evaluate the composition attributes of ions in the water and ascertain the hydrochemical classification. The Pearson correlation analysis was utilized to determine the degree of dependence between ions, as well as between ions and TDS. The Gibbs diagram method was utilized to ascertain the primary origins of solutes in the water. Ultimately, the ion combination and ratio approaches were employed to examine the origins of ions present in the water. The irrigation suitability and overall water environment status in the Mingyong River Basin were assessed by estimating the relationship between the percentage of sodium ions, sodium adsorption ratio, and ion proportion.
3. Results
3.1. The Hydrochemical Characteristics of River Water
3.1.1. The Spatial Variation Characteristics of Hydrochemistry in River Water
The main physicochemical parameters (pH value, EC, and TDS) and concentrations of major ions in the glacial meltwater and the midstream and downstream river water of the Mingyong River Basin are shown in Table 2. In the glacier meltwater, the average concentrations of TDS and EC are 68.77 mg·L−1 (ranging from 38.60 to 118.00 mg·L−1) and 137.70 μs·cm−1 (ranging from 77.3 to 237.00 μs·cm−1), respectively, with pH values varying between 8.30 and 9.66, and an average pH of 9.07. For the midstream river water, the average concentrations of TDS and EC are 86.64 mg·L−1 (ranging from 36.70 to 132.00 mg·L−1) and 173.60 μs·cm−1 (ranging from 73.40 to 264.00 μs·cm−1), respectively, with pH values ranging from 8.33 to 9.61 and an average pH of 8.94. In the downstream river water, the average concentrations of TDS and EC are 87.40 mg·L−1 (ranging from 28.50 to 141.00 mg·L−1) and 175.07 μs·cm−1 (ranging from 57.10 to 282.00 μs·cm−1), respectively, with pH values ranging from 8.44 to 9.74 and an average pH of 8.98. The average pH value of the Mingyong River water is 8.99, indicating overall alkalinity, which is higher than the world average value of 8.00. The average concentration of TDS is 81.69 mg·L−1, which is lower than the world average value of 120 mg·L−1. The average concentration of EC is 163.63 μs·cm−1.
Table 2.
Maximum, minimum, average, and deviations (SDs) of ion concentrations (mg·L−1), pH, EC (μs·cm−1), and total dissolved solids (TDS, mg·L−1) in the Mingyong River water.
In the glacier meltwater, the mass concentration order of cations is Ca2+ > Mg2+ > Na+ > K+, with average mass concentrations of 15.91, 8.04, 1.06, and 0.53 mg·L−1, respectively. The mass concentration order of anions is HCO3− > SO42− > NO3− > Cl−, with average mass concentrations of 46.29, 35.77, 0.47, and 0.14 mg·L−1, respectively. According to the chemical classification method of Shukarev for water, it belongs to (HCO3− + SO42−)-(Ca2+ + Mg2+)-type water [12].
In the midstream river water, the mass concentration order of cations is Ca2+ > Mg2+ > Na+ > K+, with average mass concentrations of 19.05, 10.80, 1.25, and 0.64 mg·L−1, respectively. The mass concentration order of anions is SO42− > HCO3− > NO3− > Cl−, with average mass concentrations of 51.07, 50.97, 0.46, and 0.11 mg·L−1, respectively. According to the chemical classification method of Shukarev for water, it belongs to (HCO3− + SO42−)-(Ca2+ + Mg2+)-type water.
In the downstream river water, the mass concentration order of cations is Ca2+ > Mg2+ > Na+ > K+, with average mass concentrations of 16.83, 11.35, 1.94, and 0.69 mg·L−1, respectively. The mass concentration order of anions is SO42− > HCO3− > NO3− > Cl−, with average mass concentrations of 50.42, 49.46, 0.52, and 0.22 mg·L−1, respectively. According to the chemical classification method of Shukarev for water, it belongs to (HCO3− + SO42−)-(Ca2+ + Mg2+)-type water.
As the river flows downstream and the altitude decreases gradually, the water temperature increases. Consequently, the solubility of HCO3− gradually decreases, leading to a decrease in its proportion relative to the total anions. The percentage of HCO3− in the total anions decreases from 56.58% in the glacier meltwater to 52.08% in the midstream river water, and further to 37.27% in the downstream river water. Meanwhile, the concentrations of other ions gradually increase. However, the variations in other ions are influenced by complex factors, resulting in differences in their changes. When the river water passes through evaporite rock areas (such as CaSO4·H2O and FeS2), substantial amounts of Ca2+ and SO42− enter the river through leaching and oxidation processes. In a weak alkaline environment, HCO3− and CO32− are more prone to react with Ca2+ to form precipitates, thereby reducing the inhibitory effect of CO32− and Ca2+ on SO42−. This results in the concentration of SO42− increasing from 35.77 mg·L−1 in the glacier meltwater to 51.07 mg·L−1 in the midstream river water and 50.42 mg·L−1 in the downstream river water. In the midstream and downstream river water, SO42− replaces HCO3− as the predominant anion [25,26]. With the accumulation of leaching and evaporation, the concentrations of Cl−, Na+, K+, and Mg2+ in the water will increase with rising salinity. However, the ratio of these cations to each other gradually decreases because Na+ is easily leached and affected by the exchange of adsorbed cations, such as Ca2+ replacing Na+ on colloids. In contrast, the migration capacity of K+ is much lower than that of Na+ since K+ is easily absorbed by plants or adsorbed by soil. Consequently, the proportions of Cl−, Na+, K+, and Mg2+ in river water gradually decrease as the content and proportion of SO42− increase. NO3− in the groundwater of the Mingyong River Basin originates from the decomposition and nitrification of animal and plant carcasses and excreta by microorganisms. This process directly produces NO3− or initially forms NO2−, which is then oxidized to NO3−. This NO3− subsequently enters the river water through lateral recharge and exchange with shallow groundwater, thereby increasing the NO3− content in the river. However, due to the small population in the Mingyong River Basin, the increase in NO3− content in the river water is relatively slow [26].
The order of cation mass concentrations in the Mingyong River water is Ca2+ > Mg2+ > Na+ > K+, differing from the abundance of elements in the Earth’s crust (i.e., Ca2+ > Na+ > K+ > Mg2+). The difference in concentrations of Mg2+, Na+, and K+ in the basin can be linked to the existence of salt minerals containing Mg2+ and the subsequent karst processes [27,28]. In the Mingyong River water, the order of anion mass concentrations is HCO3− > SO42− > NO3− > Cl−, which is different from the sequence of anion mass concentrations in standard seawater (i.e., Cl− > SO42− > NO3−). The elevated content of SO42− is predominantly influenced by the weathering processes of the basin rock. Alternatively, it may arise via the oxidation of minerals that contain sulfur or from atmospheric intake. In addition, the topography and proximity to the ocean, along with reduced effects from monsoons and atmospheric circulations but substantial human activities, result in a greater abundance of NO3− compared to Cl− [29,30].
3.1.2. The Temporal Variation Characteristics of Hydrochemistry in River Water
Figure 3, Figure 4 and Figure 5 depict the temporal variations in cation and anion concentrations of the glacial meltwater and the midstream and downstream river water of the Mingyong River in Meili Snow Mountains, respectively. As shown in Figure 3, Figure 4 and Figure 5, the variations in K+, NO3−, and Cl− are relatively small, while Ca2+, Mg2+, Na+, SO42−, and HCO3− exhibit significant fluctuations. In the glacier meltwater, the highest concentrations of Ca2+, Mg2+, Na+, and HCO3− appeared in December; the lowest concentrations of Ca2+, Mg2+, NO3−, and HCO3− appeared in August; and the lowest concentrations of Na+, K+, and Cl− appeared in July. In the midstream river water, the highest concentrations of Ca2+, Mg2+, Na+, and HCO3− appeared in January and February, and the highest concentrations of K+ and Cl− appeared in May. In the downstream river water, the highest concentrations of Mg2+ and Na+ appeared in February, and the highest concentrations of Ca2+, NO3−, and HCO3− appeared in April. The lowest concentrations of cations (Na+, K+, Ca2+, and Mg2+) and anions (Cl−, NO3−, SO42−, and HCO3−) in the midstream and downstream river water all appeared in July. The distinction between the monsoon season (i.e., June–September) and the non-monsoon season (i.e., October to the following May) is evident. High ion concentrations predominantly occur during the non-monsoon season (i.e., glacier accumulation period), while low values are mainly observed during the monsoon season (i.e., glacier ablation period). These findings indicate that changes in rainfall patterns during the monsoon period can impact the levels of ions present. Precipitation cleanses air aerosols, resulting in a diluting effect on ion concentrations, leading, in turn, to low ion concentration levels [31,32].
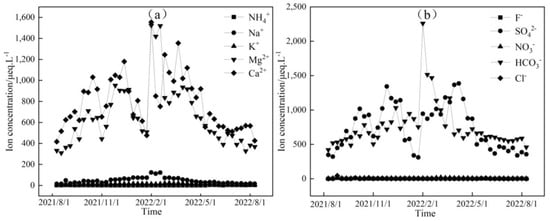
Figure 3.
Temporal variation in cation (a) and anion (b) concentrations of glacial meltwater in the Mingyong River.
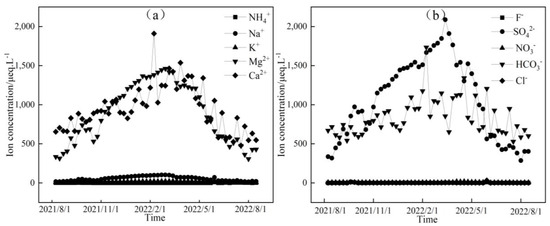
Figure 4.
Temporal variation in cation (a) and anion (b) concentrations of midstream water in the Mingyong River.
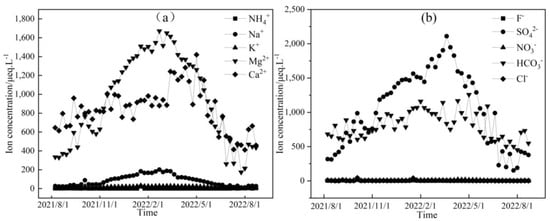
Figure 5.
Temporal variation in cation (a) and anion (b) concentrations of downstream water in the Mingyong River.
Figure 6, Figure 7 and Figure 8, respectively, depict the temporal variations in the physicochemical parameters, i.e., the EC, TDS, and pH values, of the glacier meltwater of the upper reaches, the midstream, and the downstream river water of the Mingyong River in the Meili Snow Mountains region. As shown in Figure 6, Figure 7 and Figure 8, the trend in the variation in EC and TDS values for the same type of water is basically consistent. The high values of EC and TDS mainly occur during the glacier accumulation period from October to May of the following year, and the low values primarily appear during the glacier melting period from June to September. The variations in EC and TDS for midstream and downstream river water tend to be consistent. The variations in pH for glacial meltwater and the midstream and downstream river water are similar, exhibiting a pattern of initial increase, followed by a decrease and then a subsequent increase. The low values of pH for all three types of water are mainly distributed from January to June 2022, while the high values are concentrated in two periods, from August to December 2021 and from July to August 2022. The pH value reflects the activity of H+ in the river. During the gradual decrease in the water level of the Mingyong River from January to June, the pH value generally decreased, showing an opposite trend to the changes in ion concentrations. This indicates that ions increased the activity of H+ when dissolved in the water, suggesting that the presence of these ions is primarily due to the input of more acidic substances [33].
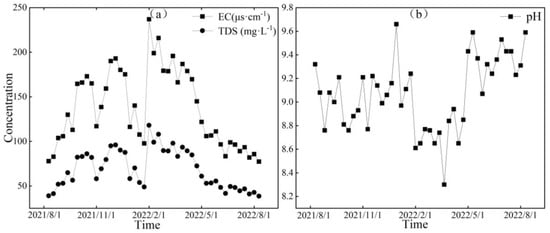
Figure 6.
Variation characteristics of EC (μs·cm−1), TDS (mg·L−1) (a), and pH (b) in glacial meltwater of the Mingyong River.
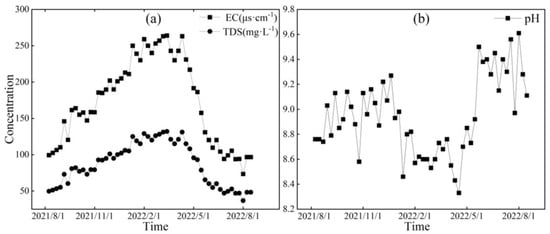
Figure 7.
Variation characteristics of EC (μs·cm−1), TDS (mg·L−1) (a), and pH (b) in midstream of the Mingyong River.
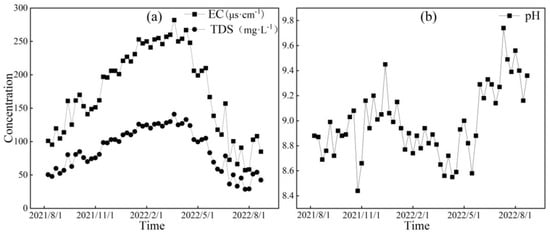
Figure 8.
Variation characteristics of EC (μs·cm−1), TDS (mg·L−1) (a), and pH (b) in downstream of the Mingyong River.
3.1.3. The Hydrochemical Type of River Water
The ratio of ion concentration in river water determines the chemical properties and type of hydrochemistry [34]. Using the ion concentration ratios of the Mingyong River water in conjunction with the Piper trilinear diagram to assess the hydrochemical type of the river water, the results, as shown in Figure 9, indicated that the distribution of ion concentration ratios of Mingyong River water is close to the HCO3− axis. The major anions consist mainly of HCO3− and SO42−. In the cation diagram, data points are mostly situated near the Ca2+ and Mg2+ axes, indicating that the predominant cations in this region are Ca2+ and Mg2+. In terms of rock-weathering contributions, HCO3− primarily originates from the weathering dissolution of carbonate rocks, while Ca2+ and Mg2+ mainly derive from calcite (CaCO3) and dolomite (CaMg(CO3)2), reflecting the dominance of carbonate rock weathering [35]. SO42− may stem from the dissolution of evaporite rocks in the basin, oxidation of sulfur-containing minerals, or atmospheric input. The weathering dissolution of river water and carbonates in the study area is primarily accomplish through the following chemical processes:
CaCO3 + CO2 + H2O = Ca2+ + 2HCO3−
CaMg(CO3)2+ 2CO2 + 2H2O = Ca2+ + Mg2+ + 4HCO3−
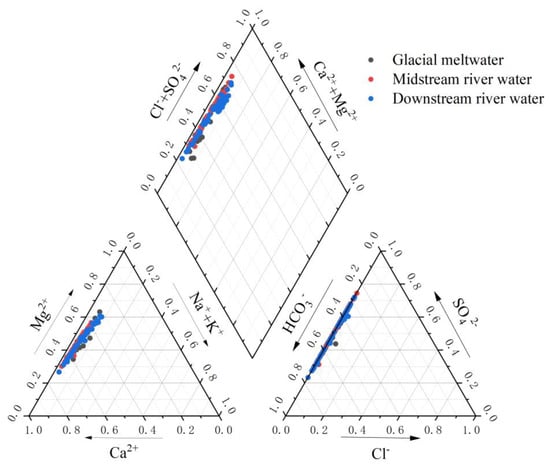
Figure 9.
The Piper trilinear nomograph for the cations and anions of the Mingyong River.
In summary, the water samples in the sampling area are primarily of the (HCO3− + SO42−)-(Ca2 ++ Mg2+) type. This is consistent with the hydrochemical type identified in the Mingyong Glacier, as obtained by the Tibetan Plateau Scientific Expedition Team of Chinese Academy of Sciences in the 1980s [20].
Table 3 presents the mass concentration values of significant anions and cations, together with the physicochemical properties of the Mingyong River water. It also includes the equivalent values from typical glacier runoff in China and the global average values for river water. From Table 3, it can be observed that the mass concentrations of Ca2+, Na+, K+, NO3−, and Cl− in the Mingyong River water from the Meili Snow Mountains are similar to those in the meltwater from glaciers such as the Baishui Glacier No.1 in the Yulong Snow Mountains and the Hailuogou Glacier in the Gongga Mountains. However, the mass concentrations of Mg2+ and SO42− ions are higher in the Mingyong River water compared to the glacier meltwater runoff from the Baishui Glacier No.1 and the Hailuogou Glacier. Additionally, the mass concentration of HCO3−, as well as the values for EC, TDS, and pH, is higher in the Mingyong River water than that in Baishui Glacier No.1 in the Yulong Snow Mountains. The pH value is similar to that of the meltwater runoff from the Hailuogou Glacier in the Gongga Mountains. The mass concentrations of Ca2+, Mg2+, Na+, K+, SO42−, and HCO3− ions in the Mingyong River water are similar to those in the meltwater runoff of the Urumqi Glacier No. 1, Tianshan Mountains, and Qingbingtan Glacier No.72 of Tomur Peak. However, the mass concentrations of NO3− and Cl− are lower in the Mingyong River water compared to the meltwater runoff of the Urumqi Glacier No.1, Tianshan Mountains, and Qingbingtan Glacier No.72 of Tomur Peak. Additionally, the values for EC, TDS, and pH are lower in the Mingyong River water than those in the meltwater runoff of the Urumqi Glacier No.1, Tianshan Mountains, but the pH value is relatively close. The mass concentrations of Ca2+, Mg2+, Na+, K+, SO42−, HCO3−, and Cl− in the Mingyong River water are lower than those in the upstream of the Mekong River (within China), while the TDS value is also lower, and the pH value is higher. The mass concentrations of Ca2+, Mg2+, and SO42− are higher than the global mean value, while the mass concentrations of Na+, K+, HCO3−, NO3−, and Cl− are lower than the global mean value.
Table 3.
Average values of ion concentrations (mg·L−1), pH, EC (μs·cm−1), and TDS (mg·L−1) in the Mingyong River and its comparison with other glaciers and rivers around the world.
3.2. The Controlling Factors of Hydrochemical Characteristics of River Water
3.2.1. Pearson Correlation Analysis
The Pearson correlation analysis yielded the correlation coefficient matrix for the concentrations of main ions and the TDS in the water of the Mingyong River, as presented in Table 4. In this paper, the correlation coefficient is expressed by R. In the Mingyong River water, TDS showed a significant correlation with Mg2+ (R = 0.961) and SO42− (R = 0.964), indicating that they have the same source. Additionally, the TDS exhibits good correlations with Na+ (R = 0.843), K+ (R = 0.863), and Ca2+ (R = 0.817), suggesting common controlling factors between them. The fluctuations in TDS were ascribed to the process of air-suspended particle matter dissolving in the river water [26].
Table 4.
Correlation analysis of main ions in the Mingyong River water.
Furthermore, significant correlations at the 0.01 level are observed among various ions: Na+ with K+, Mg2+, Ca2+, and HCO3− (R = 0.863, 0.907, 0.531, and 0.625, respectively); K+ with Mg2+, Ca2+, and HCO3− (R = 0.878, 0.692, and 0.572, respectively); Mg2+ with Ca2+ and HCO3− (R = 0.727 and 0.689, respectively); and Ca2+ with HCO3− (R = 0.760). These results indicated that these ions share a common source [31]. Na+, K+, Mg2+, and Ca2+ all show significant correlations at the 0.01 level, indicating contributions from the crustal source. Mg2+ and Ca2+ are typical ions derived from crustal source materials, implying that Na+, K+, Mg2+, and Ca2+ are primarily influenced by the crustal source [41]. The correlation between NH4+ and other ions is relatively weak, suggesting a minor influence of rock weathering on NH4+, with its main source being attribute to anthropogenic contributions [42,43]. F− and Cl− exhibit a significant positive correlation, indicating that they have the same source. SO42− shows significant positive correlations with Na+, K+, Mg2+, and Ca2+, with correlation coefficients of 0.796, 0.872, 0.938, and 0.792, respectively. Under natural conditions, SO42− in water primarily originates from the dissolution of evaporite rocks, while Mg2+ and Ca2+ mainly come from the dissolution of carbonate rocks and evaporite rocks. Na+ and K+ primarily originate from the weathering products of evaporite rocks [44,45]. The NO3− ion exhibits relatively weak connections with other ions, suggesting that it originates from slightly distinct sources. The primary sources of NO3− were derived not only from deposition of ice and snow but also from contributions resulting from the nitrification of soil microorganisms and human activity [38,45,46]. The results pertain to the composition of rocks in the Mingyong River Basin, primarily resulting from the weathering of carbonate and silicate rocks (see Section 3.2.3 for results analysis of rock weathering processes based on ion combination and ratio methods). Additionally, the correlation between Na+ and Cl− further validates their potential influence from evaporite rocks.
3.2.2. Gibbs Diagram Analysis
Gibbs collated the chemical compositions of surface water sources worldwide, encompassing rainwater, river water, and lakes. The natural Boomerang Envelope concept was suggested, accompanied by pictures illustrating the chemical composition and evolution of different types of river water. In addition, he classified the origins of ions in river water into three controlling factors: evaporative concentration, rock weathering, and precipitation regulation [47,48]. The sample data from the Mingyong River Basin were analyzed using Gibbs diagrams, resulting in Figure 10. From the figure, it can be observed that most of the river-water samples fall within the rock-weathering zone, indicating that the river water in the study area is primarily controlled by natural factors. The variation range of TDS in the river water is between 28.5 and 141 mg·L−1, with an average of 81.7 mg·L−1, which is below 100 mg·L−1. The ratio of Na+/(Na++Ca2+) ranges from 0.024 to 0.207, with an average of 0.072, which is below 0.5. Similarly, the ratio of Cl−/(Cl−+HCO3−) varies between 0.0005 and 0.047, with an average of 0.003, below 0.1. These results indicated that rock weathering is the primary source of solutes in the Mingyong River water.
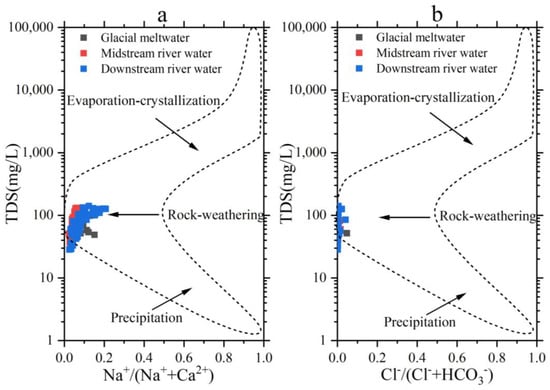
Figure 10.
Gibbs plots of concentrations ratios of TDS versus Na+/(Na+ + Ca2+) (a) and TDS versus Cl−/(Cl− + HCO3−) (b) of the Mingyong River.
3.2.3. Analysis of Rock Weathering Processes Based on Ion Combination and Ratio Methods
Based on Figure 10, it is evident that rock weathering is the primary contributor of ions in the river water within the research area. To investigate the primary categories and chemical makeup of rock weathering, we utilized the molar ions concentration and ratio approaches introduced by Gaillardet [40]. Combined with the classification in Table 5, Figure 11 is obtained. From Figure 11, it can be observed that the molar ratio of ions in the Mingyong River water falls within certain ranges: Ca2+/Na+ ratio ranges from 2.20 to 23.80, with an average of 9.5; Mg2+/Ca2+ ratio ranges from 0.38 to 2.04, with an average of 0.96; HCO3−/Na+ ratio ranges from 4.81 to 48.29, with an average of 17.90; and Mg2+/Na+ ratio ranges from 3.49 to 11.60, with an average of 7.86. Most of the samples fall within the range between carbonate and silicate rock weathering products. The molar ratios of HCO3−/Na+ and Mg2+/Na+ in the river water are concentrated in the middle of carbonate and silicate rocks, but closer to the carbonate region. This suggests that the ions are formed as a result of both the weathering of carbonate rocks and the dissolution of silicate rocks, with the weathering of carbonate rocks having a greater impact. The primary chemical reactions responsible for the weathering and dissolution of silicate rocks in the river water of the research region are as follows:
KAISiO3O8 + H+ → HAISiO3O8 + K+
NaAISiO3O8 + H+ → HAISiO3O8 + Na+
Table 5.
Ion combinations and ratios of three kinds of rocks (mmol·L−1) [40].
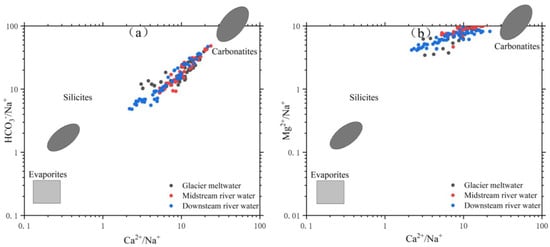
Figure 11.
Diagram of ratio (HCO3−/Na+)/(Ca2+/Na+) (a) and (Mg2+/Na+)/(Ca2+/Na+) (b) of the Mingyong River.
In Figure 11a, the data points are mostly aligned along a straight line, and the vertical axis shows a significant range of variation. This indicates a certain correlation between the sources of Ca2+ and HCO3−. In Figure 11b, the variation in Mg2+/Na+ is smaller and relatively stable compared to Figure 11a. This stability is mainly attributed to the composition of the rocks. The molar ratios of ions in the water of the Mingyong River are mostly distributed between the weathering control zones of carbonate rocks and silicate rocks. These findings indicate that the ion sources in the river water of this area are mostly determined by the erosion of carbonate rocks and silicate rocks, possibly with some contribution from the erosion of evaporite rocks.
Table 6 lists the main hydrochemical characteristics and controlling factors of the Mingyong River water compared to other typical glacier runoffs. As depicted in Table 6, the mass concentration order of the main anions and cations in the Mingyong River water corresponds to that of the runoff from the Baishui Glacier No.1 in the Yulong Snow Mountains. The mass concentration order of anions in the Mingyong River water is consistent with that of the runoff of the Urumqi Glacier No.1, Tianshan Mountains. The mass concentration order of cations in the Mingyong River water is similar to that of the Naradu Glacier runoff in the Western Himalayas. The hydrochemical type is consistent with that of the runoff from the Baishui Glacier No.1 and the Hailuogou Glacier in the Gongga Mountains. The controlling factors are primarily influenced by the weathering products of carbonate and silicate rocks, with some influence from evaporite weathering. Similar to the meltwater runoff of the Urumqi Glacier No.1, Tianshan Mountains, the main influence on the Mingyong River water is from weathering products of carbonate and silicate rocks. But the lithology of the Urumqi Glacier No.1, Tianshan Mountains, is mainly igneous and metamorphic rocks, with fewer occurrences of sulfate minerals; thus, it is not significantly impacted by evaporite weathering products. Similar to the runoff from Qingbingtan Glacier No.72 of Tomur Peak, the Mingyong River water is mainly influenced by water–rock interactions. However, Qingbingtan Glacier No.72 of Tomur Peak consists mainly of granites, diorites, and gneisses, which are siliceous crystalline rocks. The primary chemical reactions occur between silicate rocks and iron-bearing minerals in a weakly acidic environment. Naradu Glacier in the Western Himalayas is primarily influenced by carbonate rock weathering, with a secondary impact from silicate rock weathering, and a weaker influence from evaporite weathering due to hydrogeological differences.
Table 6.
Comparison of hydrochemical types and controlling factors in different study areas.
3.3. Water-Quality Assessment of the Mingyong River
In general, an elevated Na+ concentration in surface water leads to the displacement of Ca2+ and Mg2+ by Na+. This migration of Ca2+ and Mg2+ within the soil reduces its permeability, resulting in calcium deficiency, crop deviation, tilting, and ultimately impacting crop yield. Therefore, the risk of soil salinization in river water can be assessed by estimating the percentage of sodium ions (%Na) and the sodium adsorption ratio (SAR) [50].
The sodium adsorption ratio is a crucial parameter that reflects the extent of cation-exchange reactions between irrigation water and soil, indicating the concentration of Na+ in surface water and serving as an important indicator for measuring soil alkalization caused by water. The higher the SAR value, the greater the soil’s capacity to adsorb Na+ ions, thereby influencing soil alkalinity and subsequently leading to reduced water infiltration, impaired crop germination, increased susceptibility to pests and weeds, and hindered crop growth and development [51]. The formula for calculating SAR and %Na is as follows [51,52]:
An increase in the SAR in the soil leads to cation exchange between the soil solution and the soil cation exchange complex, resulting in a higher %Na in the soil. The inherent biogeochemistry and ion-exchange reactions in soil significantly influence the composition and exchange of soil solutions, thereby affecting the variation in SAR and %Na content [53]. The SAR values of the Mingyong River water ranged from 0.10 to 1.06, with an average value of 0.37 and EC values ranging from 57.1 to 282 μs·cm−1, and the EC values of most samples were less than 250 μs·cm−1. According to the ratio relationship between SAR and EC (Figure 12a), the results show that the Mingyong River water is suitable for direct agricultural irrigation with minimal land salinization damage. The average %Na value in the Mingyong River water is 6.61%, indicating its suitability as an irrigation water source (Figure 12b). The spatial distribution of %Na and SAR in the Mingyong River reveals distinct patterns: in the glacier meltwater, the average value is 6.12% and 0.30, which is lower than the overall average for the river. The midstream river water exhibits a relatively low average %Na and SAR concentration of 5.77% and 0.31. Conversely, due to human activities, the downstream river shows an elevated average %Na and SAR concentration of 7.84% and 0.48, surpassing the total average value observed in the Mingyong River.
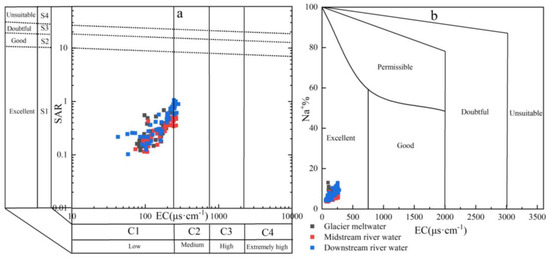
Figure 12.
Relationship between sodium adsorption ratio (a), sodium ion percentage, and conductivity (b) in the Mingyong River water.
According to the TDS value, the water body can be roughly divided into fresh water (TDS < 1000 mg/L), salt water (1000 mg/L < TDS < 3000 mg/L), and saline (3000 mg/L < TDS < 10,000 mg/L). According to the size of the TH, the water quality for surface water were divided into soft water (TH < 50 mg/L), micro-hard water (50 mg/L < TH < 150 mg/L), hard water (150 mg/L < TH < 300 mg/L), and extremely hard water (TH > 300 mg/L) [54].
Since the establishment of the People’s Republic of China, population growth has been accompanied by an intensification of human activities that is contributing to a continuous decline in water quality. Against the backdrop of global warming and melting glaciers, river-water quantity and quality are key factors affecting both ecological sustainability and economic stability within basins. The proportion diagram based on TDS and TH (Figure 13) can comprehensively reflect the general water quality of surface water of different geomorphic units in the Mingyong River Basin. The findings demonstrated that 15% of the water samples in the Mingyong River are soft water, 84% are micro-hard water, and the remaining 1% are hard water, making the water suitable for agricultural irrigation but not suitable for people and animals to drink directly. The SAR, %Na, and TH indices in the glacier meltwater and the midstream and downstream river water of the Mingyong River all fall within the safe range designated for irrigation water, with corresponding variations further affirming this conclusion.
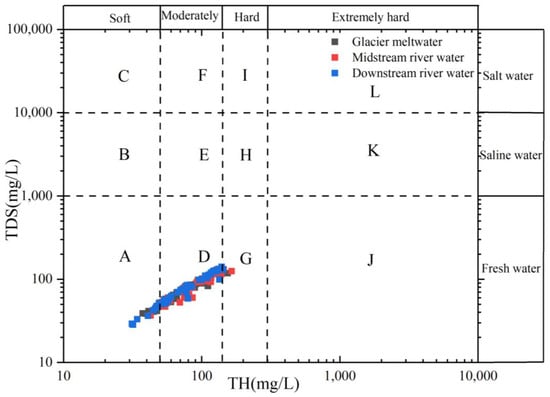
Figure 13.
Relationship between TDS and total hardness (TH) in the Mingyong River.
4. Discussion
The river is an important part of surface water and an important link in the water cycle between land and sea, and its hydrochemical characteristics are important parameters in the assessment of water quality. Rivers constantly scour, erode, and dissolve rocks in the process of flow and are affected by climate, soil, animals, and plants, as well as human activities. The hydrochemical characteristics of rivers can indicate the hydrochemical environment of their region, explain the chemical processes of rivers, and reflect the sources of dissolved substances in the river [55,56]. The variations in the dominant ions’ composition of the water chemistry within the basin serve as a primary indicator for investigating the process of chemical weathering, thereby enabling an examination of its origins, rate of weathering, and impact on climate dynamics [57,58]. TDS represents the comprehensive characteristics of solute quality in water and has certain representative value [59]. According to our study, the water samples in the sampling area are primarily of the (HCO3− + SO42−)-(Ca2+ + Mg2+) type; this result is consistent with the results obtained by others in this study area. The dominant cations in the river water of the Mingyong River Basin are Ca2+ and Mg2+; the dominant anions are SO42− and HCO3−; and the weathering of rocks, dominated by carbonate rocks and silicic rocks, is the main source of solute, with only minor effects from anthropogenic activities in this basin. The source of solute in the river water is also fully verified by the limestone, siliceous rocks, and calc sandstone rich in the river basin [15,19,20]. When the river water passes through evaporite rock areas, substantial amounts of Ca2+ and SO42− enter the river through leaching and oxidation processes, and SO42− replaces HCO3− as the predominant anion in the midstream and downstream river water. When the ions dissolved in the water, they increased the activity of H+, causing the pH value to generally decrease [33]. This decrease in pH exhibited an opposite trend to the changes in ion concentrations. The hydrochemical characteristics and controlling factors of Mingyong River water are similar to those of the Baishui Glacier No.1 in the Yulong Snow Mountains and the Hailuogou Glacier in the Gongga Mountains. The SAR, %Na, and TH indices in the glacier meltwater and the midstream and downstream river water of the Mingyong River all fall within the safe range designated for irrigation water, but such water is not suitable for people and animals to drink directly. This study area is a famous tourist attraction in China, and a large number of tourist activities may affect the hydrochemical characteristics and water quality of the river. In order to make better use of water resources, reasonable water-resource protection measures should be put into practice.
5. Conclusions
We analyzed the hydrochemical characteristics and controlling factors of the Mingyong River water. The primary findings can be summarized as follows: (1) The magnitude mass concentrations’ order of cation in the Mingyong River water is Ca2+ > Mg2+ > Na+ > K+. The magnitude mass concentrations’ order of anion in the Mingyong River water is HCO3− > SO42− > NO3− > Cl−. The hydrochemical type in the study area is (HCO3− + SO42−)-(Ca2+ + Mg2+). The high ion concentrations mainly occurred during the glacier accumulation period, and low concentrations during the glacier melting period. (2) The Pearson correlation analysis indicates different correlations between TDS and Mg2+, SO42−, Na+, K+, and Ca2+, as well as between various ions. The findings obtained by the Gibbs diagram approach suggest that the main origin of solutes in the water of the Mingyong River is rock weathering. Through ion combination and a ratio methods analysis, it was discovered that the ions present in the river water originate from both the weathering of carbonate rocks and the dissolution of silicate rocks, with a greater impact from carbonate rocks. The initial examination of the ion regulation variables in the river water indicates that the primary factors are the erosion of carbonate and silicate rocks through water–rock interaction processes, potentially with an extra impact from evaporite erosion. (3) The average %Na and SAR concentration in the river water is 6.61% and 0.37. Soft water accounts for 15% of the samples, micro-hard water constitutes 84%, and the remaining 1% represents hard water. Consequently, the Mingyong River water suitability for agricultural irrigation with minimal land salinization damage is established; however, it is not suitable for people and animals to drink directly.
Author Contributions
L.W. and X.Z. conceived the idea of this study; X.Z. carried out most of data analysis and wrote the manuscript draft; L.W. supervised the research project and designed the structure of this manuscript; Z.D. reviewed and edited this manuscript; Z.Z. contributed to sampling organization; K.W. analyzed some data of the study. A.W. and Y.W. provided support regarding field investigation design. All authors have read and agreed to the published version of the manuscript.
Funding
This research was funded by the National Natural Science Foundation of China (No. 42061012).
Institutional Review Board Statement
Not applicable.
Informed Consent Statement
Not applicable.
Data Availability Statement
Data are contained within the article.
Acknowledgments
We would like to acknowledge the Forestry and Grassland Bureau of Deqin County, Meili Snow Mountains National Park Development and Operation Co., Ltd., of Deqin County for their assistance in field survey and sampling. At the same time, we thank the State Key Laboratory of Cryospheric Sciences and the Tianshan Glaciological Station of the Northwest Institute of Eco-Environment and Resources of the Chinese Academy of Sciences for their help in laboratory testing.
Conflicts of Interest
The authors declare that there are no conflicts of interest.
References
- Falkenmark, M.; Rockström, J. Balancing Water for Humans and Nature: The New Approach in Ecohydrology; Earthscan: London, UK, 2004. [Google Scholar]
- Yao, J.Q. Analysis and Management of Water Balance between Supply and Demand in the Inland Arid River Basin. Master’s Thesis, Xinjiang University, Wulumuqi, China, 2015. [Google Scholar]
- Edmunds, W.M.; Ma, J.; Aeschbach-Hertig, W.; Kipfer, R.; Darbyshire, D.P.F. Grounfwater recharge history and hydrogeo chemical evolution in the Minqin Basin, North West China. Appl. Geochem. 2006, 21, 2148–2170. [Google Scholar] [CrossRef]
- Pazi, I. Water mass properties and chemical characteristics in the Saros Gulf, Northeast Aegean sea (Eastern Mediterranean). J. Mar. Syst. 2008, 74, 698–710. [Google Scholar] [CrossRef]
- Conner, N.P.; Sarraino, S.; Frantz, D.E.; Stephene, E. Geochemical characteristics of an urban river: Influences of an anthropogeni landscape. Appl. Geochem. 2014, 47, 209–216. [Google Scholar] [CrossRef]
- An, T.D.; Tsujimura, M.; Le, P.V.; Kswachi, A.; Ha, D.T. Chemical characteristics of surface water and groundwater in coastal watershed, Mekong Delta, Vietnam. Procedia Environ. Sci. 2014, 20, 712–721. [Google Scholar] [CrossRef]
- Winston, W.E.; Criss, R.E. Geochemical vanations during flash flooding, Meranec River basin, May 2000. J. Hydrol. 2002, 265, 149–163. [Google Scholar] [CrossRef]
- Batsaikhan, B.; Kwon, J.S.; Kim, K.H.; Young, J.L.; Jeong, H.L.; Menbayar, B.; Seong, T.Y. Hydrochemical evaluation of the influences of mining activities on river water chemistry in central northern Mongolia. Environ. Sci. Pollut. 2017, 24, 2019–2034. [Google Scholar] [CrossRef]
- Paudyal, R.; Kang, S.; Sharma, C.M.; Tripathee, L.; Huang, J.; Rupakheti, D.; Sillanpää, M. Major ions and trace elements of two selected rivers near Everest region, southern Himalayas, Nepal. Environ. Earth Sci. 2016, 75, 1–11. [Google Scholar] [CrossRef]
- Savichev, O.G. Hydrologic conditions for chemical composition of the Siberian river waters. Earth Environ. Sci. 2019, 232, 012. [Google Scholar] [CrossRef]
- Tian, Y.; Yu, C.Q.; Zha, X.J. Hydrochemical characteristics and factors controlling of natural water in the western, southern, and northeastern border areas of the Qinghai-Tibet Plateau. Acta Geogr. Sin. 2019, 74, 975–991. [Google Scholar]
- Brown, G.H. Glacier meltwater hydrochemistry. Appl. Geochem. 2002, 17, 855–883. [Google Scholar] [CrossRef]
- Li, M.Y.; Sun, X.J.; Li, S.N.; Zhang, Q.G. Advances on inorganic hydrochemistry of glacial meltwater runoff in the Qinghai-Tibet Plateau andits surrounding areas. J. Glaciol. Geocryol. 2020, 42, 562–574. [Google Scholar]
- Shi, Y.F.; Liu, C.H.; Wang, Z.T. A Concise Catalogue of Chinese Glaciers; Popular Science Press: Shanghai, China, 2005. [Google Scholar]
- Zheng, B.X.; Zhao, X.T.; Li, T.S.; Wang, C.Y. Features and Fluctuation of the Melang Glacier in the Mainri Mountain. J. Glaciol. Geocryol. 1999, 21, 145–150. [Google Scholar]
- Zhang, Z.M.; Wang, W.L.; Ou, X.K.; Wu, W.Q. The correlation between vegetation spatial pattern and environmental factors. J. Yunnan Univ. 2009, 31, 311–315. [Google Scholar]
- Miao, W.F. Study on Annual Runoff Processes of the Glacierized Mingyong Basin in Meili Snow Moubtains. Master’s Thesis, Yunnan University, Kunming, China, 2022. [Google Scholar]
- Pu, T.; He, Y.Q.; Zhu, G.F.; Xin, H.J.; Du, J.K.; Wang, S.X.; Wang, S.J. Hydrochemical Characteristics of Three Rivers Around Yulong Mountain in Rainy Season. Sci. Geogr. Sin. 2011, 31, 734–740. [Google Scholar]
- Yang, Z.N. Basin characteristics of runoff in modern glaciation zones in China. Sci. Geogr. Sin. 1981, 11, 467–476. [Google Scholar]
- Li, J.J. Glaciers in the Hengduan Mountains; Science Press: Beijing, China, 1996. [Google Scholar]
- Zhang, Z.; Wu, L.; Feng, J.; Dong, Z.W.; Zhao, X.; Cheng, X.P.; Dong, L.Q.; Liu, T.T. Characteristics of Runoff Components in the Mingyong Glacier Basin, Meili Snow Mountains. Water 2024, 16, 937. [Google Scholar] [CrossRef]
- Chen, J.S.; Tao, P.; Deng, B.S. Water Environmental Chemistry; Higher Education Press: Beijing, China, 1987. [Google Scholar]
- Mitamura, O.; Seike, Y.; Kondo, K.; Goto, N.; Anbutsu, K.; Akatsuka, T.; Kihira, M.; Tsering, Q.; Nishimura, M. First investigation of ultraoligotrophic alpine Lake Puma Yumco in the pre-Himalaya, China. Limnology 2003, 4, 167–175. [Google Scholar] [CrossRef]
- Murakami, T.; Terai, H.; Yoshiyama, Y.; Tezuka, T.; Zhu, L.; Matsunaka, T.; Nishimura, M. The second investigation of Lake Puma YumCo located in the Southern Tibetan Planteau, China. Limnology. 2007, 8, 331–335. [Google Scholar] [CrossRef][Green Version]
- Wu, X.B.; Li, Q.L.; Song, G.J.; He, J.Q.; Jiang, X. Hydrochemical characteristics andevolution of runoff at Qiyi Glacier, Qilian Mountains. Environ. Sci. 2008, 29, 613–618. [Google Scholar]
- He, Z.Q.; Li, Z.Q.; Chen, T.L.; Hu, L.A.; Yang, J.S. Changing process of hydrochemical composition in Stream in Glacier Area, the Tianshan Moubtains. Arid Zone Res. 2017, 34, 881–888. [Google Scholar]
- Sujatha, D.; Reddy, B.R. Quality characterization of groundwater in the south-eastern part of the Ranga Reddy district, Andhra Pradesh, India. Environ. Geol. 2003, 44, 579–586. [Google Scholar] [CrossRef]
- Athamena, A.; Gaagai, A.; Aouissi, H.A.; Burlakovs, J.; Bencedia, S.; Zekker, I.; Krauklis, A. Chemometrics of the environment: Hydrochemical characterization of groundwater in Lioua plain (North Africa) using time series and multivariate statistical analysis. Sustainability. 2022, 15, 20. [Google Scholar] [CrossRef]
- Liu, F. Characteristics and Affecting Factors of Hydrochemistry in Yushugou River Basin, Hami, Tianshan Mountains. Master’s Thesis, Northwest Normal University, Lanzhou, China, 2020. [Google Scholar]
- Zhang, Z.Y. The Study of Hydrochemical Characteristics and Ion Sources of Precipitation and River Water in Mountainous Areas in the Upper Reaches of the Shiyang River. Master’s Thesis, Northwest Normal University, Lanzhou, China, 2021. [Google Scholar]
- Li, Z.J.; Li, Z.X.; Tian, Q.; Song, L.L.; Jia, B.; Guo, R.; Song, Y.X.; Su, S.N.; Han, C.T. Environmental significance of wet deposition composition in the Central Qilian Mountains, China. Environ. Sci. 2014, 35, 4465–4474. [Google Scholar]
- Jia, W.X.; Li, Z.X. Hydrochemical characteristics and sources of Ions in precipitation at the East Qilian Mountains. Environ. Sci. 2016, 37, 3323–3332. [Google Scholar]
- Feng, F.; Feng, Q.; Li, Z.Q.; Liu, W.; Jin, S. Analysis on the hydrochemical characteristics in the Upper Reaches of Urumqi River Basin, Eastern Tianshan. J. Nat. Res. 2014, 29, 3323–3332. [Google Scholar]
- Piper, A.M. graphic procedure in the geochemical interpretation of water analyses. Trans. Am. Geophys. Union 1944, 25, 914–928. [Google Scholar]
- Dalai, T.K.; Krishnaswami, S.; Sarin, M.M. Major ion chemistry in the headwaters of the Yamuna river system: Chemical weathering, its temperature dependence and CO2 consumption in the Himalaya. Geochim. Cosmochim. Acta 2002, 66, 3397–3416. [Google Scholar] [CrossRef]
- Li, X.Y. Study on the Hydroculture Characteristics of Glacier Meltwater in Typical Glacier Regions of Western China. Ph.D. Thesis, Cold and Arid Regions Environmental and Engineering Research Institute, Chinese Academy of Sciences, Lanzhou, China, 2009. [Google Scholar]
- Feng, F.; Li, Z.Q.; Jin, S.; Dong, Z.W.; Wang, F.T. Hydrochemical characteristics and solute dynamics of meltwater runoff of Urumqi Glacier No. 1, eastern Tianshan, northwest China. J. Mt. Sci. 2012, 9, 472–482. [Google Scholar] [CrossRef]
- Zhao, A.F.; Zhang, M.J.; Li, Z.Q.; Wang, F.T.; Wang, S.J. Hydrochemical characteristics in the Glacier No.72 of Qingbingtan, Tomur Peak. Environ. Sci. 2012, 33, 1484–1490. [Google Scholar]
- Liu, J.; Zhao, Y.; Li, Z.; Guo, H.C. Quantitative source apportionment of water solutes and CO2 consumption of the whole Yarlung Tsangpo River basin in Tibet, China. Environ. Sci. Pollut. 2019, 26, 28243–28255. [Google Scholar] [CrossRef]
- Gaillardet, J.; Dupre, B.; Louvat, P.; Allegere, C.J. Global Silicate weathering and CO2 consumption rates deduced from the chemistry of largr rivers. Chem. Geol. 1999, 159, 3–30. [Google Scholar] [CrossRef]
- Xiao, H.W.; Xiao, H.Y.; Shen, C.Y.; Zhang, Z.Y.; Long, A.M. Chemical composition and sources of marine aerosol over the Western North Pacific Ocean in winter. Atmosphere 2018, 9, 298. [Google Scholar] [CrossRef]
- Jin, Z.; An, Z.; Yu, J.; Li, F.C.; Zhang, F. Lake Qinghai sediment geochemistry linked to hydroclimate variability since the last glacial. Quat. Sci. Rev. 2015, 122, 63–73. [Google Scholar] [CrossRef]
- Jin, Z.; You, C.F.; Wang, Y. Hydrological and solute budgets of Lake Qinghai, the largest lake on the Tibetan Plateau. Quat. Int. 2010, 218, 151–156. [Google Scholar] [CrossRef]
- Meybeck, M. Global chemical weathering of surficial rocks estimated from river dissolved loads. Am. J. Sci. 1987, 287, 401–428. [Google Scholar] [CrossRef]
- Li, Z.J.; Song, L.L.; Tian, Q. Water chemical characteristics in the wet season in Buha River Basin in Qinghai. Chin. J. Ecol. 2017, 36, 766–773. [Google Scholar]
- Hattori, S.; Palma, Y.N.; Itoh, Y.; Kawasaki, M.; Fujihara, Y.; Takase, K.; Yoshida, N. Isotopic evidence for seasonality of microbial internal nitrogen cycles in a temperate forested catchment with heavy snowfall. Sci. Total Environ. 2019, 690, 290–299. [Google Scholar] [CrossRef] [PubMed]
- Gibbs, R.J. Mechanisms controlling world water chemistry. Science 1970, 170, 1088–1090. [Google Scholar] [CrossRef]
- Feth, J.; Gibbs, R.J. Mechanisms controlling world water chemistry: Evaporation-crystallization process. Science 1971, 172, 870–872. [Google Scholar] [CrossRef]
- Kumar, R.; Kumar, R.; Singh, S.; Bhardwaj, A.; Chaudhary, H. Hydro-geochemical characteristics of glacial meltwater from Naradu Glacier catchment, Western Himalaya. Environ. Earth Sci. 2019, 78, 683. [Google Scholar] [CrossRef]
- Gao, Y.; Qian, H.; Ren, W.; Wang, H.K.; Liu, F.X.; Yang, F.X. Hydrogeochemical characterization and quality assessment of groundwater based on integrated-weight water quality index in a concentrated urban area. J. Clean. Prod. 2020, 260, 121006. [Google Scholar] [CrossRef]
- Raju, N.J. Hydrogeochemical parameters for assessment of groundwater quality in the upper Gunjanaeru River basin, Cuddapah District, Andhra Pradesh, South India. Environ. Geol. 2007, 52, 1067–1074. [Google Scholar] [CrossRef]
- Karanth, K.R. Groundwater Assessment Development and Management; Tata McGraw Hill Publishing Company Ltd.: New Delhi, India, 1987; p. 725. [Google Scholar]
- Phogat, V.; Mallants, D.; Cox, J.W.; Simunek, J.; Oliver, D.P.; Pitt, T.; Petrie, P.R. Impact of long-term recycled water irrigation on crop yield and soil chemical properties. Agric. Water Manag. 2020, 237, 106167. [Google Scholar] [CrossRef]
- Boyd, C.E. Total Hardness. Water Quality: An Introduction; Springer: Cham, Switzerland, 2020; pp. 205–214. [Google Scholar]
- Xia, X.H.; Zhang, L.T.; Chen, J.S. The Effect of Lithology and Climate on Major Ion Chemistry of the Yangtze River System. Acta Sci. Nat. Univ. Pekin. 2000, 36, 246–252. [Google Scholar]
- Wu, L.N.; Sun, C.J.; He, Q. Analysis of temporal and spatial variation of hydrochemical characterics of the typical inland in the middle of Tianshan Mountains. Res. Soil Water Conserv. 2017, 24, 149–156. [Google Scholar]
- Le, J.X.; Wang, D.C. Hydrochemistry of rivers in China. Acta Geogr. Sin. 1963, 3, 3–15. [Google Scholar]
- Zhang, T.; Wang, M.G.; Zhang, Z.Y.; Liu, T.; He, J. But lake basin surface water chemical characteristics and control factors. J. Environ. Sci. 2020, 9, 4003–4010. [Google Scholar]
- Wang, X.; Aji, D.; Tuoheti, S. Analysis of the Hydrochemical Characteristics and Genesis of Bosten Lake, China. Sustainability 2023, 15, 4139. [Google Scholar] [CrossRef]


Disclaimer/Publisher’s Note: The statements, opinions and data contained in all publications are solely those of the individual author(s) and contributor(s) and not of MDPI and/or the editor(s). MDPI and/or the editor(s) disclaim responsibility for any injury to people or property resulting from any ideas, methods, instructions or products referred to in the content. |
© 2024 by the authors. Licensee MDPI, Basel, Switzerland. This article is an open access article distributed under the terms and conditions of the Creative Commons Attribution (CC BY) license (https://creativecommons.org/licenses/by/4.0/).